83
AFRICA PRIVATE SECTOR GROUP MADAGASCAR INVESTMENT CLIMATE ASSESSMENT JUNE 2005 MANJU KEDIA SHAH JAMES HABYARIMANA LINDA COTTON IVAN ROSSIGNOL
AFRICA PRIVATE SECTOR GROUP
MADAGASCAR INVESTMENT CLIMATE ASSESSMENT
JUNE 2005
MANJU KEDIA SHAH JAMES HABYARIMANA
LINDA COTTON IVAN ROSSIGNOL

i
Acknowledgements The Investment Climate Assessment (ICA) is based on an analysis of investment climate survey data gathered by ATW Consultants Madagascar with technical assistance from Synovate and the Regional Program on Enterprise Development in the Africa Region Private Sector Group at the World Bank. Jean-Michel Marchat, Josiane Raveloarison and the Madagascar Country Office provided critical input for the survey fieldwork. Jessica Boccardo provided and Mike Ingram provided valuable research assistance. We are grateful for comments from Iain Christie, Alvaro Gonzalez, Gaiv Tata, Willem van Eeghen, and James Bond, as well as participants at the review meeting held on June 23. We would particularly like to thank all of the private sector enterprises who have contributed their time to participate in the survey.
ii
List of Acronyms AFD Agence Française de Développement AGOA Africa Growth and Opportunity Act AIDS Acquired Immunity Deficiency Syndrome COMESA Common Market of Eastern and Southern Africa EBA Everything but Arms EPZ Export Processing Zone EU European Union FDI Foreign Direct Investment FIAS Foreign Investment Advisory Services GDP Gross Domestic Product GOM Government of Madagascar HIV Human Immuno-Deficiency Syndrome ICA Investment Climate Assessment IMF International Monetary Fund LDC Less Developed Countries MDG Millennium Development Goals MFA Multi-Fibre Agreement MGF Malagasy Franc PRGF Poverty Reduction and Growth Facility RPED Regional Program on Enterprise Development SME Small and Medium Enterprises TFP Total Factor Productivity ULC Unit Labor Cost UNCTAD United Nations Conference on Trade and Development VMS Vessel Monitoring System WTO World Trade Organization
iii
Executive Summary & Policy Recommendations
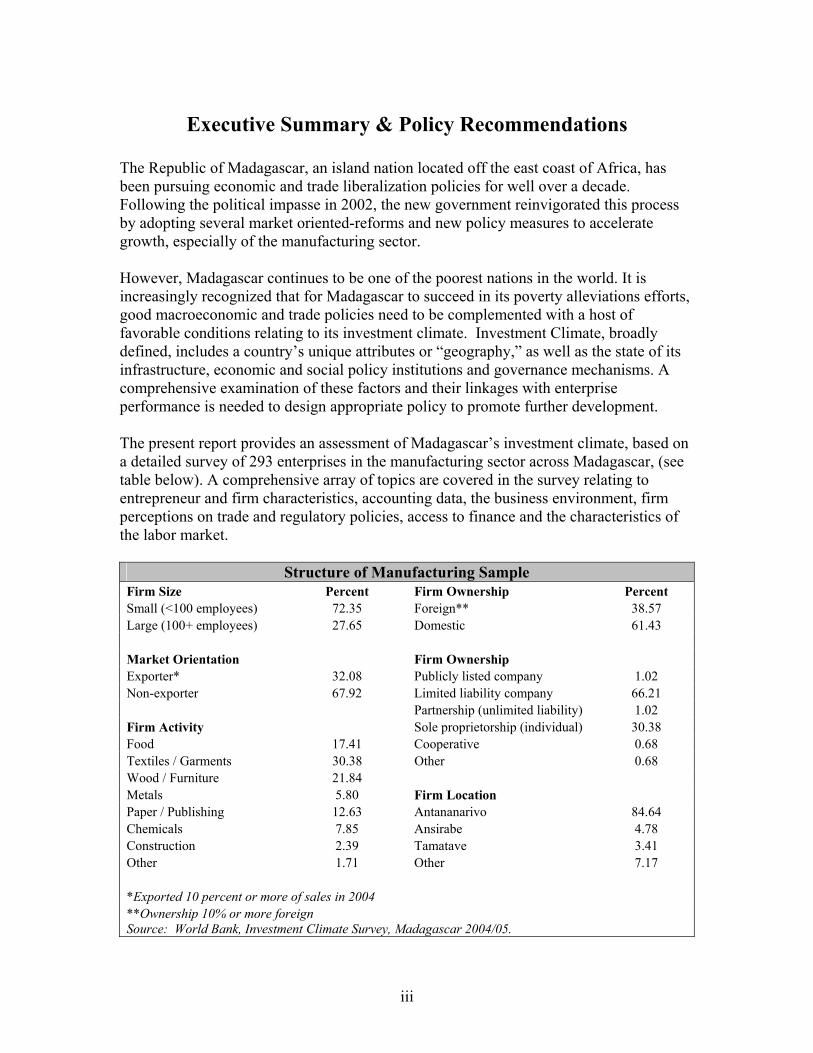
The Republic of Madagascar, an island nation located off the east coast of Africa, has been pursuing economic and trade liberalization policies for well over a decade. Following the political impasse in 2002, the new government reinvigorated this process by adopting several market oriented-reforms and new policy measures to accelerate growth, especially of the manufacturing sector. However, Madagascar continues to be one of the poorest nations in the world. It is increasingly recognized that for Madagascar to succeed in its poverty alleviations efforts, good macroeconomic and trade policies need to be complemented with a host of favorable conditions relating to its investment climate. Investment Climate, broadly defined, includes a country’s unique attributes or “geography,” as well as the state of its infrastructure, economic and social policy institutions and governance mechanisms. A comprehensive examination of these factors and their linkages with enterprise performance is needed to design appropriate policy to promote further development. The present report provides an assessment of Madagascar’s investment climate, based on a detailed survey of 293 enterprises in the manufacturing sector across Madagascar, (see table below). A comprehensive array of topics are covered in the survey relating to entrepreneur and firm characteristics, accounting data, the business environment, firm perceptions on trade and regulatory policies, access to finance and the characteristics of the labor market.
Structure of Manufacturing Sample Firm Size Percent Firm Ownership Percent Small (<100 employees) 72.35 Foreign** 38.57 Large (100+ employees) 27.65 Domestic 61.43 Market Orientation Firm Ownership Exporter* 32.08 Publicly listed company 1.02 Non-exporter 67.92 Limited liability company 66.21 Partnership (unlimited liability) 1.02 Firm Activity Sole proprietorship (individual) 30.38 Food 17.41 Cooperative 0.68 Textiles / Garments 30.38 Other 0.68 Wood / Furniture 21.84 Metals 5.80 Firm Location Paper / Publishing 12.63 Antananarivo 84.64 Chemicals 7.85 Ansirabe 4.78 Construction 2.39 Tamatave 3.41 Other 1.71 Other 7.17 *Exported 10 percent or more of sales in 2004 **Ownership 10% or more foreign Source: World Bank, Investment Climate Survey, Madagascar 2004/05.
iv
I. International Benchmarking: Firm Performance and Business Environment Indicators The Madagascar Investment Climate Assessment is a unique analysis that places Madagascar in comparative perspective. Investment climate survey data from similar sectors in several countries, based on a standardized global core questionnaire and a standardized sampling technique is used to benchmark Malagasy firms. To our knowledge, such an exercise has not been possible until now. In particular, we are able to assess firm performance—as measured by total factor productivity—and the relative importance of the determinants of productivity, as measured by factor markets (labor and finance), the business environment, and the regulatory burden. Our results indicate that EPZ firms in Madagascar, on average, are very competitive regionally, and significantly more efficient than non-EPZ firms, though there are large dispersions within this group. Non-EPZ Malagasy firms have much lower productivity compared to firms in all other Sub-Saharan countries except Zambia. The dualism in the industrial sector reflects the poor backward linkages of EPZ firms, the poorer business environment faced by non-EPZ firms and the high costs of infrastructure and regulations faced by both groups compared to most other countries regionally. For Malagasy firms to become internationally competitive, policy focus needs to shift towards augmenting productivity in the non-EPZ sector. The Integrated Growth Poles approach, focusing on the creation of regional growth centers, is a useful policy measure in this regard. A. Enterprise Performance How do Malagasy firms compare with firms in other developing nations in Africa and core competitors such as Mauritius and China? We examine the performance of Malagasy firms by comparing both partial labor and capital productivity, unit labor costs and total factor productivity of enterprises in Madagascar versus others. Labor Productivity: We find that Malagasy labor has very low productivity. Median labor productivity in Madagascar is higher only compared to workers in Uganda, and almost one third that of workers in India and almost one fourth of the average worker in China. However, the dispersion in worker productivity is higher in Madagascar. Large firms with more than 100 employees have more than double the productivity of smaller firms, and are more competitive internationally. Unit Labor Costs: One measure of labor competitiveness is unit labor cost, which is approximated by the ratio of wages to value-added. Median unit labor costs in Madagascar, at 0.33, are comparable to firms in China, and only marginally higher than firms in India. All comparator countries in sub-Saharan Africa have much higher unit labor costs. Unit labor costs fall further for the largest size class, as higher labor productivity is only partially offset by higher labor costs. In fact, the largest enterprises have much lower unit labor costs compared to medium enterprises and are very competitive internationally. But low unit labor costs do not provide a huge advantage.

v
Madagascar’s productivity is still relatively low in our sample of countries, driven down by negative factors in the business environment. Capital Intensity and Productivity: Madagascar’s manufacturing sector, dominated by labor-intensive garment firms, has very little capital per worker. Capital intensity is lowest compared to other countries in sub-Saharan Africa. Capital intensity falls with firm size, unlike other countries. Investments in new capital stock are also low. During the last three years combined, gross investment accounted for only 7 percent of sales or 3.8 percent of capital stock. Madagascar has low levels of capital stock and consequently, high returns to each additional dollar of capital investment. The percentage return on capital is much lower in other countries such as Tanzania, Uganda, Kenya and China than in Madagascar, and marginally higher in India, which also has very labor-intensive modes of production Total Factor Productivity: Pooling data for comparator nations such as Kenya, Uganda Tanzania, Senegal, Mali and Zambia, along with Madagascar, our cross-country estimates of total factor productivity show that firms in Madagascar have higher overall productivity compared to firms in Zambia, while productivity is not significantly different than firms in Kenya, Uganda and Tanzania. Examining non-EPZ firms in Madagascar with those in other countries, we see that they perform only better than firms in Zambia, and are less productive than firms in all other countries. EPZ firms have higher productivity than most other comparator countries. The dichotomous nature of manufacturing in Madagascar is a striking finding of our data, and the importance of speeding up reforms that improve the business environment for local businesses is an important policy issue discussed below. B. Business Environment General Rankings: Firms ranked several aspects of the business environment including regulatory policies, infrastructure, finance, telecommunications, and macro-economic environment. The business environment faced by Mauritian and Chinese firms is considerably superior with a lower proportion of firms reporting major constraints for just about every dimension of the business environment.1 The ranking of constraints in the other sub-Saharan African countries is similar to the ranking of constraints in Madagascar, except for corruption and tax rates, which are usually considered more burdensome. Macroeconomic instability, cost of, and access to finance and economic regulatory policy uncertainty are all leading constraints in the other African comparators. Bureaucratic Burden: One measure of bureaucratic burden is the proportion of senior management time spent with regulators. International comparisons reveal that bureaucratic burden is very high in Madagascar, where senior managers spend 22 percent of their time dealing with regulations. It is comparable to the bureaucratic burden in China but five times greater than that of firms in Mauritius and higher than all other 1 A higher proportion of firms in Mauritius report labor regulations and business licensing as major constraints than in Madagascar. (Findings for Mauritius are preliminary).

vi
surveyed countries in sub-Saharan Africa. Corruption is a related constraint equally endured by all types of firms. Land acquisition involves lengthy procedures that are perhaps more important to potential investors than the existing firms which participated in the ICA survey. Trade Policies: Given the high percentage of Malagasy firms that use ports to import raw materials and export products, efficacy of customs and trade regulations have a high impact on enterprise costs. We find that Madagascar fares well relative to a set of comparator countries: it has one of the lowest clearing times and is only bettered by Malaysia and Mauritius in import clearing time and only by Malaysia in export clearing. However, for significant proportion of the largest firms (40 percent) the quality of customs administration is consider to be poor or very poor. Infrastructure: Competitiveness in global markets requires efficient infrastructure services to improve factory floor productivity. Again, comparing Madagascar with Uganda, Zambia, Mauritius and China, we see that compared to most other countries, Malagasy firms face the most unreliable electricity regime. As a consequence, they also report the highest amount of output lost due to power outages. Obtaining a new electricity connection requires 18 days in China, 2 days in Mauritius, versus 49 days in Madagascar. Generator ownership is much lower than other countries with poor electricity services. Only 21 percent of firms own generators. This leads to a higher impact on sales lost due outages. Malagasy firms face the highest losses in this regard compared to other surveyed countries. Indirect Costs: Aggregating indirect costs as a percentage of sales by summing the total proportion of sales lost due to delivery delays, power outages, payment of bribes and so on, we find that firms in Madagascar bear a high proportion of indirect costs 15.6 percent, compared to 6.5 percent for Mauritius, and 9.1 percent for China. Power outages account for large fraction of total indirect costs. If Madagascar could eliminate its power outages, its indirect costs could be lowered to that of India. C. Financial Markets Access to Credit: Madagascar compares favorably to other countries in its provision of short-term financing, but access to longer term finance is considerably poor. Firms use retained earnings to finance 80 percent of new investments. Collateral Requirements: The value of the collateral required, relative to the value of the loan is 137 percent on average and is considerably higher than in comparator countries. We find a strong relationship between the quality of records generated by firms and access to bank finance. Firms that produce annual budgets are 2.5 times more likely to access bank finance. Supplier Credit: Access to trade credit for manufacturing firms in Madagascar compares favorably with the other comparator countries. 60 percent of all inputs are purchased on credit.

vii
D. Labor Market Educational Distribution: Education levels in Madagascar are comparable to those of workers in other countries at similar stages of development. Worker Earnings: Wages in Madagascar are lower than all other comparator nations. Unskilled workers in Madagascar earn $36.00 a month, compared to $145.00 in Mauritius and $85.00 in China. Earnings increase with firm size and are higher for EPZ firms compared to non-EPZ enterprises. Worker Training: Opportunities to acquire on the job skills through in-firm and off-site training are very limited. Provision of training by firms in Madagascar is very poor. Only 28 percent of firms, compared to 70 percent in Nigeria, provide external training. II: Firm Performance & the Role of Investment Climate within Madagascar Our survey tool also allows us to examine various aspects of the business environment across firms with different characteristics, highlighting the differential impact of business environment and regulatory regime on businesses. Since Madagascar has had a unique experience with the development of its EPZs, we emphasize the use of our survey data to examine the performance of firms with and without EPZ status, and to consider the impact of the investment climate on each group. Our data show that EPZ firms are on average more productive than non-EPZ firms but there is a high level of dispersion among the EPZ firms. While some EPZ firms are highly competitive and some have expanded over the last two years, the productivity of others is rather mediocre. In addition, non-EPZ firms are less productive than their counterparts in regional comparator countries. While some aspects of the business environment affect the groups differently, there are common constraints, such as corruption and infrastructure costs. EPZ versus Non-EPZ firms: How Different Are They? Madagascar’s manufacturing growth between 2002-2004 is largely associated with the growth of its garment industry, especially of EPZ firms set up by foreign investors. However, there has been concern that MFA phase-out and subsequent abolition of quotas in January 2005 would lead to a large retrenchment of workers, firm closures, and a large outflow of capital from EPZs to other countries. Did this happen? How have firms in EPZ performed compared to others in Madagascar? How favorable is the investment climate for these firms? What more can be done to foster further growth in manufacturing? Job Growth: Our findings indicate that most of the jobs in manufacturing between 2002 and 2004 were created by firms located in EPZs. Since the survey only included currently
viii
existing, operating firms, the exit of firms from the industry cannot be measured by our data. However, we do see that the majority of EPZ firms established by 2002 hired additional workers from 2002 to 2004, the years leading up to the elimination of textile quotas under the Multi-Fibre Agreement (MFA). Investment: Median firms’ investments for each of the last three years were zero. Median reported new investment amounts for three years combined was only $1,647. While a majority of firms made very little investment, there were a few large firms that invested in large amounts of capital stock. The average investment to sales ratio, for all three years combined, was also remarkably low, in contrast to the job growth. The weighted investment to sales ratio was only 7 percent for both EPZs and non-EPZs. The gross (weighted) investment to capital stock ratio for entire sample was only 3.8 percent. The ration was higher for EPZs due to their lower capital base (14.9 percent) compared to non-EPZs (2.9 percent). Net investment rates, taking depreciation into account, are likely to be even lower. Firm Performance: While job creation remains an important short-term goal for poverty alleviation, the medium term goal of improving the quality of jobs and worker earnings within manufacturing is inextricably linked to enterprise productivity. We see that total factor productivity is much higher for EPZs compared to other enterprises, especially the fully foreign EPZs. This illustrates the success of EPZs but also the lack of backward linkages to the rest of the economy. Local firms who have better educated managers and who provide in-house training to their workers have much higher productivity compared to others, indicating that further movements towards efficiency can be made by improving human capital formation. Business Environment: There is substantial variation in the extent to which constraints affect the operation of different types of firms. A considerably higher percentage of firms without EPZ-status report that price controls, inflation and macroeconomic instability are major constraints. Non-EPZ firms are also more likely to report cost of and access to finance as a major/severe constraint. A larger proportion of firms with EPZ-status report regulatory policy uncertainty as an important impediment. However, the proportion reporting corruption as a major impediment is relatively uniform across all firm categories. III. Policy Implications
Our findings highlight several important issues with direct policy bearing: Policies regarding EPZ firms: We see that while most EPZ firms have grown rapidly in terms of employment, only a few firms have made large investments in capital stock and outperformed others. These firms are likely to survive and grow with the current business environment, as they are competitive internationally. For other EPZ firms producing at the margin, tax incentives determine their survival. Moving forward, a careful evaluation of the incentive structure may be needed to foster growth of efficient enterprises, without

ix
dependence on exceptional regulatory benefits. Such a study could examine where the tax burden falls and how the effective tax impact compares to other countries in the region. Generalized tax cuts could be examined: Our analysis implies that tax exemptions or relief for EPZ firms may need to be rebalanced to foster new investments. Tax reduction on imported goods and machines would encourage investment and productivity. This would also promote capital deepening and diversification out of footloose industries. Our study also finds that firm-supplied training has a direct positive impact on productivity, while training provided at external institutions does not have the same positive impact. Tax benefits for training that would encourage privately-supplied, appropriate training can lead to increased productivity, value-added and eventually, wages. Wages could then increase without increasing unit labor costs, the measurement upon which foreign investors largely base location decisions. Fight corruption through regulatory reform: Regulatory issues loom large in firm responses. The regulatory burden in Madagascar is the highest of the set of comparator countries and is not unrelated to the huge problem of corruption. While the Government has recognized corruption as an issue and has created agencies to deal with it, streamlining regulations will go far toward reducing opportunities for corruption. Improving incentives for regulatory officials will reduce incidences of bribery as well. High indirect costs due to inadequate infrastructure: The burden of inadequate infrastructure accounts for nearly half of indirect costs and affects all firms in Madagascar. Unreliable electricity provision, supply chain deficiencies, inadequate transport networks and poor water services are all having profound impacts on the ability of firms to survive and thrive. Unlike many other countries, even large firms in Madagascar are not able to cope with power outages. Generator ownership is low across all firm categories. It is critical that electricity supply be improved and in the meantime, that the purchase of generators not be impeded by high taxes. Improvements in transport will reduce inefficiencies in the supply chain and will have the ripple effect of eliminating the costs behind holding large supplies of raw materials and inventories. While considerable progress is being made in road rehabilitation, construction and maintenance, the inefficient rail network and still weak road network are unquestionably binding constraints. Expand access and lower cost of finance for SMEs: The survey shows that small and medium-sized enterprises suffer disproportionately, especially concerning the cost of and access to finance. More competition in the sector is needed, as well as the promotion of microfinance institutions. The Government should play a leading role in establishing a credit reference bureau to build credit histories. On the other hand, business development services should focus on imparting best-practice record keeping habits to small and micro firms.

x
While opening up the scope of business environment reforms to the entire economy is a sizeable challenge and there is no “magic bullet,” a comprehensive strategy is more likely to lead to long-term gains for a larger proportion of the population.

xi
Table of Contents ACKNOWLEDGEMENTS .......................................................................................................................... I LIST OF ACRONYMS............................................................................................................................... II EXECUTIVE SUMMARY & POLICY RECOMMENDATIONS........................................................III TABLE OF CONTENTS........................................................................................................................... XI 1. INTRODUCTION ................................................................................................................................... 1
BACKGROUND ............................................................................................................................................ 1 STRUCTURE OF THE ECONOMY ................................................................................................................... 3 ECONOMIC MANAGEMENT ......................................................................................................................... 3
2. ENTERPRISE PERFORMANCE IN MADAGASCAR.................................................................... 11 MALAGASY LABOR PRODUCTIVITY.......................................................................................................... 12 PRODUCTIVITY OF CAPITAL...................................................................................................................... 16 PRODUCTIVITY DIFFERENTIALS WITHIN MADAGASCAR ........................................................................... 18 TOTAL FACTOR PRODUCTIVITY RESULTS................................................................................................. 20 MADAGASCAR VS. OTHERS: DIFFERENCES ACROSS COUNTRIES .............................................................. 23 CONCLUSION ............................................................................................................................................ 25
3. BUSINESS ENVIRONMENT.............................................................................................................. 27 THE BUSINESS ENVIRONMENT IN INTERNATIONAL PERSPECTIVE............................................................. 28 INDIRECT COSTS....................................................................................................................................... 45
4. FACTOR MARKETS: THE FINANCIAL MARKET AND THE LABOR MARKET ................. 48 THE FINANCE SECTOR .............................................................................................................................. 48 THE LABOR MARKET ............................................................................................................................... 59
BIBLIOGRAPHY ...................................................................................................................................... 69
1
1. Introduction
Background
The Republic of Madagascar, an island located off the east coast of Africa in the Indian Ocean, is the one of the poorest countries in the world. Over the past 30 years, the nation has grown steadily poorer. Between 1960 and 1999 average income per capita fell by approximately one third in real terms. However, GDP per capita grew over the 1999-2001 period for the first time since the 1980s, averaging 1.5 percent annually. Annual per capita income reached US$290 in 2004, but this is still well below the Sub-Saharan and low-income country averages of US$490 and US$450, respectively. Linear projections show that Madagascar is not making enough progress toward meeting the targets of the Millennium Development Goals (MDGs), (Box 1.1).
In 1960, Madagascar gained independence from French colonial rule which was followed by a long period of military control. Opposition parties were legalized in 1990 and the island became a multi-party republic. The 1996 election resulted in the return to power of Didier Ratsiraka, who headed the government during the 1970s and 1980s. Rastiraka had embarked on a process of economic adjustment and attempted to apply IMF-style reform to Madagascar’s economy. The country began to move away from the rigid state-controlled socialist structures which stressed self-sufficiency and extensive state intervention in the economy. Since 1996, the country has been pursuing economic liberalization and monetary stabilization, beginning a period of solid growth and accelerating foreign investment which lasted until 2001. Even during that period, however, poverty levels remained stubbornly high, at around 69 percent, governance remained weak and perceived corruption was extremely high.
Ratsiraka claimed victory in the presidential election of December 2001, but his contender, Marc Ravalomanana disputed the results. Political chaos and sporadic violence followed, fueled not only by political but also ethnic differences. The crisis devastated the economy, contracting it by 12.7 percent for the year 2002, and inducing a sharp drop in foreign investment. In July 2002, Ratsiraka and several of his supporters fled to exile in France and the I Love Madagascar party (Tiako I Madagasikara – TIM) under President Marc Ravalomanana took office. Following resolution of the political crisis, the economy rebounded with GDP growth of over 9 percent in 2003, bringing it to just below its 2001 level. Since then, the new government has begun to put in place business-friendly economic and financial policies, addressing many of the obstacles to foreign investment. The Government has stated their commitment to maintaining macroeconomic stability and containing inflation while accelerating the implementation of structural reforms while naming the fight against corruption a top priority. Since agriculture continues to employ the majority of the

2
population, another major goal of the government is to diversify the export base to boost agricultural exports and broad-based economic growth.
In these efforts to set a new course and build confidence, the international community has played a major role. Official aid grants from multilateral agencies and foreign governments comprise a substantial part of Madagascar’s public sector revenue base. Total foreign aid as a percentage of GNI averaged a very high 9.7 percent for the five year period 1998-2002. The country is currently benefiting from assistance from the IMF and World Bank under the Poverty Reduction and Growth Facility (PRGF) and Highly Indebted Poor Country (HIPC) programs and has generally been close to meeting its benchmark requirements under those programs.
In 2004, Madagascar experienced two cyclones, a deterioration in the terms of trade and a sharp depreciation of the currency, which have hampered the bright prospects of recovery but, most importantly, have provided evidence of the fact that the economy still remains highly dependent on agriculture and vulnerable to the impact of poor weather on harvests. Food insecurity is increasing due to low productivity in agriculture mainly because availability of the main staple food, rice, is decreasing. Production fell from 144 kg per person/year in 1981 to 112 in 2001. Rice prices have been increasing (one kilo was 2,400 Fmg or about US$0.25 in April 2004 and rose almost three times to about 7,000 Fmg or US$0.74 in December 2004). This price trend is primarily due to insufficient local production, high world prices and devaluation of the local currency.
Box 1.1: Poverty in Madagascar
• Urban poverty decreased from 63.2 percent in 1997 to 50 percent in 2001. But more than 80 percent of the poor live in rural areas. The prevalence of poverty, which had declined in 2001 to 69.6 percent, increased again to 75 percent of the total population (about 17.5 million) in 2002.
• After the 2002 post-electoral crisis, the chances of attaining the MDGs by 2015 became more remote. The only target close to being met is the rate of school enrollment of girls, compared to boys. Primary net enrollment rates have also increased, from around 70 percent in 2002 to 84 percent in 2003/04.
• Infant mortality remains high but decreased from 103 deaths per 1,000 births in 1990 to 84 deaths per 1,000 births in 2001.
• Although only 1.7 percent of adults are infected with HIV/AIDS, the disease has now been endemic for twenty years and is on the rise (from 0.02 percent in 1999) and constitutes a potential public health risk. However, the low rate of infection has been a key determinant for life expectancy at birth, which has shown some improvement in contrast to other sub-Saharan countries. Life expectancy at birth rose from 52.8 years in 1990 to 55.5 in 2002 compared to the 2002 sub-Saharan average of 46 years.
• Illiteracy is widespread at 46 percent of the population. • Infant juvenile and maternal mortality rates are still among the highest in sub-Saharan
Africa (150 per 1,000, 490 for 100,000 births, respectively). • Retarded growth, a sign of malnutrition, affects 48.6 percent of children under 5 years
old. • These figures mainly reflect the combined effects of a low rate of economic growth
and a high rate of average annual population growth, (2.8 percent).
3
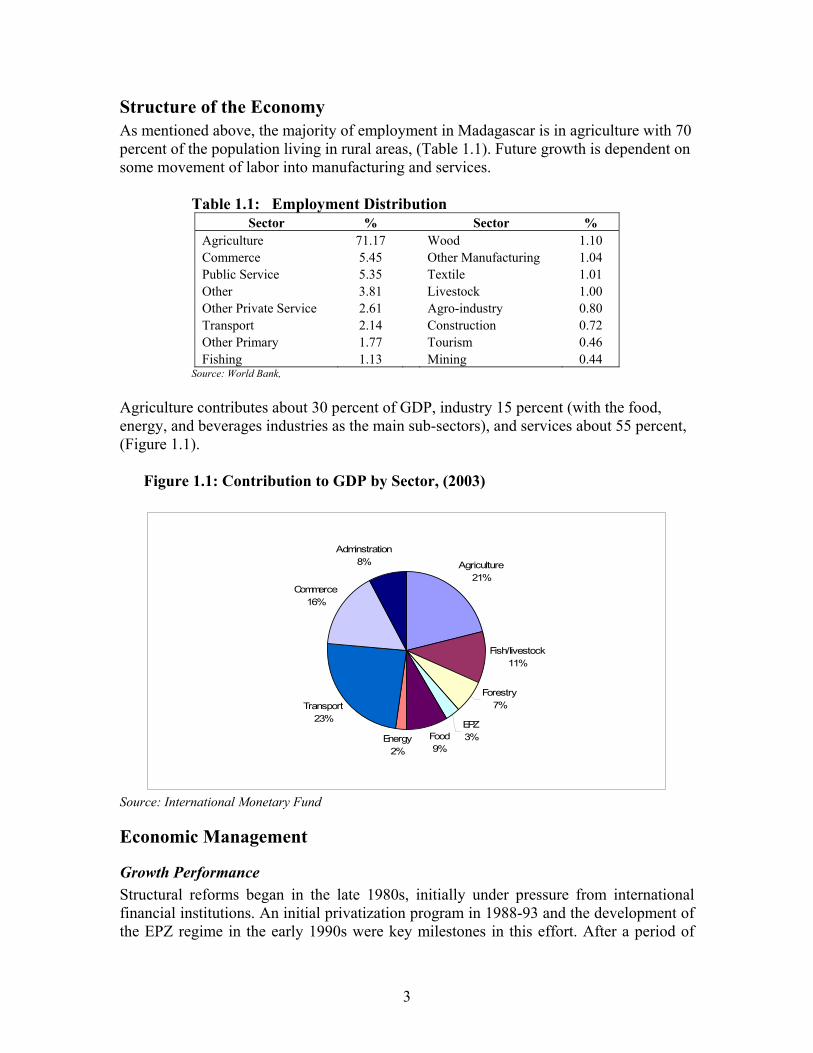
Structure of the Economy As mentioned above, the majority of employment in Madagascar is in agriculture with 70 percent of the population living in rural areas, (Table 1.1). Future growth is dependent on some movement of labor into manufacturing and services.
Table 1.1: Employment Distribution Sector % Sector %
Agriculture 71.17 Wood 1.10 Commerce 5.45 Other Manufacturing 1.04 Public Service 5.35 Textile 1.01 Other 3.81 Livestock 1.00 Other Private Service 2.61 Agro-industry 0.80 Transport 2.14 Construction 0.72 Other Primary 1.77 Tourism 0.46 Fishing 1.13 Mining 0.44
Source: World Bank, Agriculture contributes about 30 percent of GDP, industry 15 percent (with the food, energy, and beverages industries as the main sub-sectors), and services about 55 percent, (Figure 1.1).
Figure 1.1: Contribution to GDP by Sector, (2003)
Agriculture21%
Fish/Iivestock11%
Forestry7%
EPZ3%Food
9%Energy
2%
Transport23%
Commerce16%
Adminstration8%
Source: International Monetary Fund
Economic Management
Growth Performance Structural reforms began in the late 1980s, initially under pressure from international financial institutions. An initial privatization program in 1988-93 and the development of the EPZ regime in the early 1990s were key milestones in this effort. After a period of
4
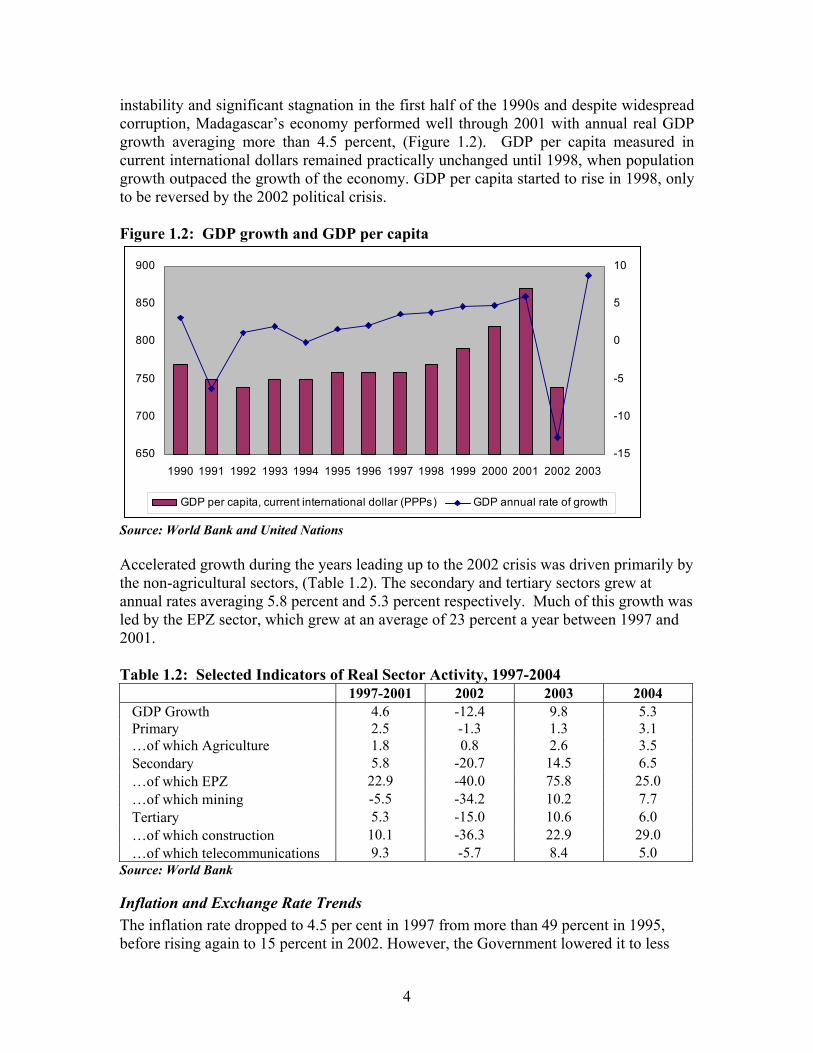
instability and significant stagnation in the first half of the 1990s and despite widespread corruption, Madagascar’s economy performed well through 2001 with annual real GDP growth averaging more than 4.5 percent, (Figure 1.2). GDP per capita measured in current international dollars remained practically unchanged until 1998, when population growth outpaced the growth of the economy. GDP per capita started to rise in 1998, only to be reversed by the 2002 political crisis. Figure 1.2: GDP growth and GDP per capita
650
700
750
800
850
900
1990 1991 1992 1993 1994 1995 1996 1997 1998 1999 2000 2001 2002 2003-15
-10
-5
0
5
10
GDP per capita, current international dollar (PPPs) GDP annual rate of growth
Source: World Bank and United Nations Accelerated growth during the years leading up to the 2002 crisis was driven primarily by the non-agricultural sectors, (Table 1.2). The secondary and tertiary sectors grew at annual rates averaging 5.8 percent and 5.3 percent respectively. Much of this growth was led by the EPZ sector, which grew at an average of 23 percent a year between 1997 and 2001.
Table 1.2: Selected Indicators of Real Sector Activity, 1997-2004 1997-2001 2002 2003 2004
GDP Growth 4.6 -12.4 9.8 5.3 Primary 2.5 -1.3 1.3 3.1 …of which Agriculture 1.8 0.8 2.6 3.5 Secondary 5.8 -20.7 14.5 6.5 …of which EPZ 22.9 -40.0 75.8 25.0 …of which mining -5.5 -34.2 10.2 7.7 Tertiary 5.3 -15.0 10.6 6.0 …of which construction 10.1 -36.3 22.9 29.0 …of which telecommunications 9.3 -5.7 8.4 5.0
Source: World Bank
Inflation and Exchange Rate Trends The inflation rate dropped to 4.5 per cent in 1997 from more than 49 percent in 1995, before rising again to 15 percent in 2002. However, the Government lowered it to less

5
than 1 percent by the end of 2003. Following strong non-inflationary growth performance in 2003, two cyclones hit Madagascar at the beginning of 2004 causing widespread damage to infrastructure and to agricultural output. This led to a deterioration of the trade account, resulting in a depreciation of the Malagasy Franc by about 40 percent against the Euro and an inflation rate of 13.8 percent. The exchange rate stabilized in mid-2004, but there have been significant inflationary pressures since then. The Government has tightened its monetary and fiscal policies to control the pressures on prices, mainly wages and tariffs, while still maintaining a floating currency (Figure 1.3).
Figure 1.3: Inflation (% growth) and Exchange Rate (US$ per national currency, period average)
-10
0
10
20
30
40
50
60
1992
1993
1994
1995
1996
1997
1998
1999
2000
2001
2002
2003
2004
0
50
100
150
200
250
(% growth) Annual rates of inflation Exhange rate- US$ per nat. currency
Source: International Monetary Fund
Fiscal Policy Madagascar has run sizeable balance of payments deficits since the mid-1980s. The current account deficit as a percentage of GDP averaged in excess of six percent during recent years and registered nearly seven percent after the 2002 crisis and in 2003. In the past, current account deficits have been financed by external borrowing, resulting in a heavy external debt burden. Debt as percentage of GDP reached 112 percent in 1993 but subsequently decreased to 83.8 percent in 2003, indicating that some progress has been made with regard to the government’s financial situation. Even though the government has run increasing deficits, overall tax revenues increased by one third from 8.9 percent of GDP in 1995 to 12.2 percent in 1999. The level of fiscal revenue rose to 10.5 percent of GDP as a yearly average, in 2000 and 2001. As a result of the post-electoral crisis, revenue fell to 8.8 percent of GDP at the end of 2002 but increased again in 2003 to reach 13.1 percent of GDP. Public expenditure, notwithstanding a rising trend, stabilized around 16 percent of

6
GDP in 1999 and 2000. It rose to represent 17 percent of GDP in 2001, due to expenditure arising from the organization of the presidential elections, (Figure 1.4). Since there is a narrow margin for reducing expenditure due to the urgent need to increase spending in health and education as well as road construction and rehabilitation, the government has focused primarily on improving the performance of tax revenue. The structure of taxation has changed with the broadening of the value-added tax (VAT) base, direct taxes nearly doubling, and the restriction of exemptions.
Figure 1.4: Fiscal balance: revenues and expenditures (MGF millions)
-400000-200000
0200000400000600000800000
10000001200000
1990
1991
1992
1993
1994
1995
1996
1997
1998
1999
2000
2001
Nat
iona
l Cur
renc
y in
mill
ions
REVENUE
EXPENDITURE
DEFICIT (-) ORSURPLUS
Source: IMF, International Financial Statistics. International Trade Since the beginning of the 1990s, the Malagasy economy undergone a series of reforms aimed at opening trade. In early 1994, the Malagasy authorities adopted sweeping changes in the market for foreign exchange and in the trade system. They introduced an inter-bank foreign exchange market and floating exchange rate, eliminated most import prohibitions, liberalized current transactions in the foreign exchange market and gave residents and non-residents the freedom to open foreign currency bank accounts. Despite these changes and further reductions of tariff rates since the mid-1980s, Madagascar still has a relatively high rate of protection. The simple average combined customs duty plus import tax is 16 percent, but over one third of products are subject to the maximum rate of 30 percent, including necessities such as food and clothing. The government’s decision to join the World Trade Organization (WTO) and Common Market of Eastern and Southern Africa (COMESA) in 1995 and the inclusion of Madagascar in the African Growth and Opportunity Act (AGOA) and the European Union (EU) “Everything But Arms” (EBA) trade preference initiative, contributed to Madagascar’s integration into the global economy. AGOA, which came into effect in 2000, allows dozens of sub-Saharan African countries to export a range of products - including garments - duty and tariff free to the United States. Madagascar became eligible for AGOA export benefits in March 2001.

7
Even though Madagascar has suffered from persistent trade deficits, Malagasy exports of non-factor goods and services from Madagascar nearly tripled between 1991 and 2001 in current dollars, (Figure 1.5). Figure 1.5: Imports and Exports of Goods and Services in US$ (m)
0100200300400500600700800900
1992 1993 1994 1995 1996 1997 1998 1999 2000 2001 2002 2003
Imports Exports
Source: IMF, International Financial Statistics. Madagascar’s export growth was impressive, especially compared to sub-Saharan African countries’ exports, which, as a whole, increased by only 15 percent, i.e. an average yearly rate of less than 1 percent. International companies have sought to make the most of the low labor costs in Madagascar. EPZ firms have had a positive influence on industrial output in general and apparel exports in particular, (Box 1.2). The increase in EPZ exports has altered the composition of exports considerably since 1990. At that time, Madagascar exported agricultural products almost exclusively. During the following decade, the share of agriculture in total exports fell by over thirty percentage points. The fastest growth in imports came from imported fabrics for use as inputs for the rapidly growing garment sector. Moreover, food imports have steadily increased over the past decade. Imports of machinery and transport equipment have been a major contributor to the growth of imports. This growth reflects the positive impact of a more stable macroeconomic environment, greater incentives given to the EPZ firms and the expansion of the transport sector. The crisis of December 2001 led to a fall in production, technical lay-offs, and hence a reduction of this growing trend in trade. The deficit in the current transactions (transfers included) widened, spreading from 1.3 percent of GDP in 2001 to 5.9 percent of GDP in 2002 as a result of the slump in export trade by 50.5 percent in value. The overall result was that the trade balance toppled from a modest US$15m surplus in 2001 to a US$117m deficit in 2002.
8
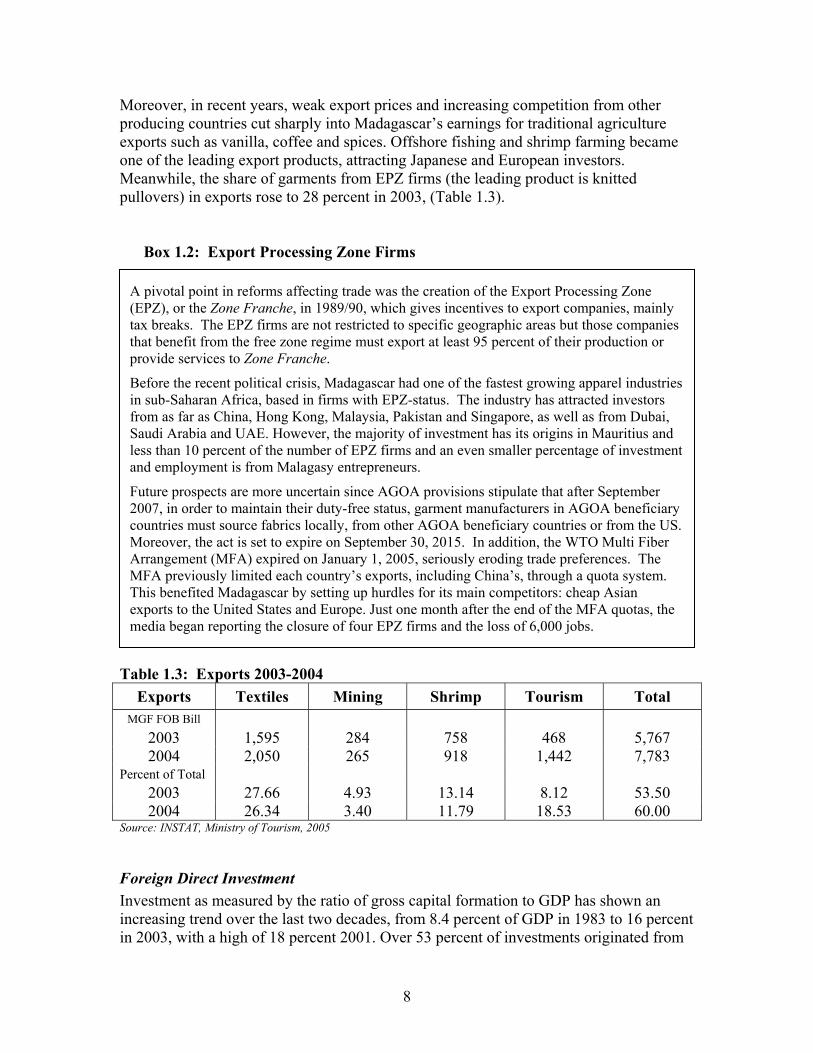
Moreover, in recent years, weak export prices and increasing competition from other producing countries cut sharply into Madagascar’s earnings for traditional agriculture exports such as vanilla, coffee and spices. Offshore fishing and shrimp farming became one of the leading export products, attracting Japanese and European investors. Meanwhile, the share of garments from EPZ firms (the leading product is knitted pullovers) in exports rose to 28 percent in 2003, (Table 1.3).
Box 1.2: Export Processing Zone Firms Table 1.3: Exports 2003-2004
Exports Textiles Mining Shrimp Tourism Total MGF FOB Bill
2003 1,595 284 758 468 5,767 2004 2,050 265 918 1,442 7,783
Percent of Total 2003 27.66 4.93 13.14 8.12 53.50 2004 26.34 3.40 11.79 18.53 60.00
Source: INSTAT, Ministry of Tourism, 2005
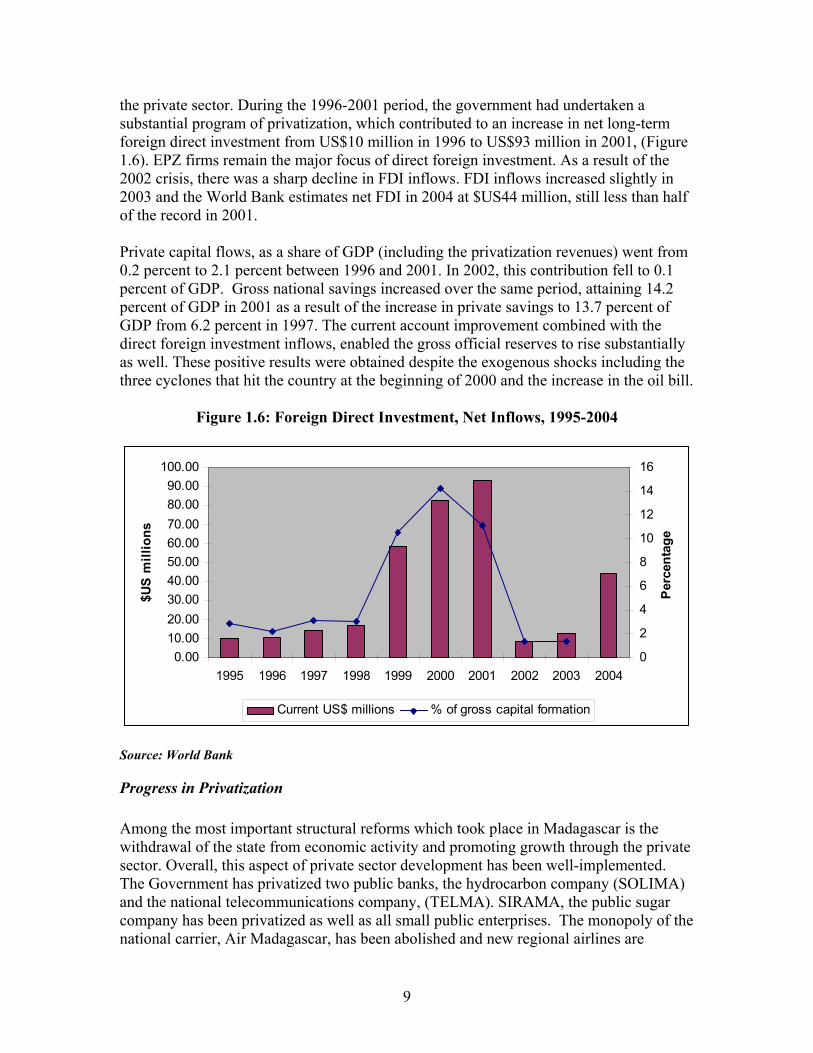
Foreign Direct Investment Investment as measured by the ratio of gross capital formation to GDP has shown an increasing trend over the last two decades, from 8.4 percent of GDP in 1983 to 16 percent in 2003, with a high of 18 percent 2001. Over 53 percent of investments originated from
A pivotal point in reforms affecting trade was the creation of the Export Processing Zone (EPZ), or the Zone Franche, in 1989/90, which gives incentives to export companies, mainly tax breaks. The EPZ firms are not restricted to specific geographic areas but those companies that benefit from the free zone regime must export at least 95 percent of their production or provide services to Zone Franche.
Before the recent political crisis, Madagascar had one of the fastest growing apparel industries in sub-Saharan Africa, based in firms with EPZ-status. The industry has attracted investors from as far as China, Hong Kong, Malaysia, Pakistan and Singapore, as well as from Dubai, Saudi Arabia and UAE. However, the majority of investment has its origins in Mauritius and less than 10 percent of the number of EPZ firms and an even smaller percentage of investment and employment is from Malagasy entrepreneurs.
Future prospects are more uncertain since AGOA provisions stipulate that after September 2007, in order to maintain their duty-free status, garment manufacturers in AGOA beneficiary countries must source fabrics locally, from other AGOA beneficiary countries or from the US. Moreover, the act is set to expire on September 30, 2015. In addition, the WTO Multi Fiber Arrangement (MFA) expired on January 1, 2005, seriously eroding trade preferences. The MFA previously limited each country’s exports, including China’s, through a quota system. This benefited Madagascar by setting up hurdles for its main competitors: cheap Asian exports to the United States and Europe. Just one month after the end of the MFA quotas, the media began reporting the closure of four EPZ firms and the loss of 6,000 jobs.
9
the private sector. During the 1996-2001 period, the government had undertaken a substantial program of privatization, which contributed to an increase in net long-term foreign direct investment from US$10 million in 1996 to US$93 million in 2001, (Figure 1.6). EPZ firms remain the major focus of direct foreign investment. As a result of the 2002 crisis, there was a sharp decline in FDI inflows. FDI inflows increased slightly in 2003 and the World Bank estimates net FDI in 2004 at $US44 million, still less than half of the record in 2001. Private capital flows, as a share of GDP (including the privatization revenues) went from 0.2 percent to 2.1 percent between 1996 and 2001. In 2002, this contribution fell to 0.1 percent of GDP. Gross national savings increased over the same period, attaining 14.2 percent of GDP in 2001 as a result of the increase in private savings to 13.7 percent of GDP from 6.2 percent in 1997. The current account improvement combined with the direct foreign investment inflows, enabled the gross official reserves to rise substantially as well. These positive results were obtained despite the exogenous shocks including the three cyclones that hit the country at the beginning of 2000 and the increase in the oil bill.
Figure 1.6: Foreign Direct Investment, Net Inflows, 1995-2004
0.0010.0020.0030.0040.0050.0060.0070.0080.0090.00
100.00
1995 1996 1997 1998 1999 2000 2001 2002 2003 2004
$US
mill
ions
0
2
4
6
8
10
12
14
16
Per
cent
age
Current US$ millions % of gross capital formation
Source: World Bank
Progress in Privatization Among the most important structural reforms which took place in Madagascar is the withdrawal of the state from economic activity and promoting growth through the private sector. Overall, this aspect of private sector development has been well-implemented. The Government has privatized two public banks, the hydrocarbon company (SOLIMA) and the national telecommunications company, (TELMA). SIRAMA, the public sugar company has been privatized as well as all small public enterprises. The monopoly of the national carrier, Air Madagascar, has been abolished and new regional airlines are
10
operating in Malagasy airports. Operations of Air Madagascar have been entrusted to Lufthansa Consulting under a management contract. HASYMA, the state-owned cotton company, is also operating under management contract, as is JIRAMA, the public electricity and water company. The north line of the railroad system is managed by a new company (MADARAIL), which is mostly in private hands. The Port of Tamatave was recently concesssioned as well. The government has introduced several legal and institutional initiatives in an attempt to improve the transparency of relations between the private and public sector and create a framework conducive to private activities.
Conclusion The political crisis of 2002 dealt a significant blow to the economy. Relative to their 2001 levels, all economic aggregates fell. Inflation rose from roughly 6 percent in 2001 to 15 percent in 2002 and exports fell by half. The secondary and tertiary sectors were affected more than agriculture by the crisis, and contracted by 25 percent and 12.5 percent, respectively. These contractions caused a significant decline in GDP in 2002 down by nearly 12 percent for the year. Recovery was rapid though, with GDP growth of almost 9 percent in 2003. Despite the detrimental impact of two cyclones and a sharp depreciation of the currency on major export crops, growth for the year 2004 remained high at 5.3 percent. Nevertheless, uncertainty over the future of AGOA and the impact of the dismantling of the Multi-Fiber Agreement quotas is likely to affect investment and relocation decisions in Madagascar, and thus negatively impact growth. Madagascar has also been quite dependent on foreign aid which is likely to be creating distortions. The Malagasy economy is, therefore, very vulnerable to shocks. Periods of high growth have been mitigated by external and internal shocks, (the 2002 crisis, cyclones, changes in trade preferences). These shocks have exacerbated internal problems with the business environment. We will discuss in detail in the coming chapters how these factors are partially offsetting Madagascar’s low labor cost advantage.

11
2. Enterprise Performance in Madagascar This section examines enterprise performance in Madagascar, examining first manufacturing labor productivity, capital stock in manufacturing and capital productivity. Labor productivity is then compared with labor costs, to obtain unit labor costs in manufacturing. These measures are compared internationally and across different types of firms within Madagascar. This is followed by an analysis of total factor productivity. We examine the characteristics determining overall productivity in Madagascar, looking at the impact of enterprise characteristics such as ownership, exporting, and learning channels such as education and training on total factor productivity. We also compare productivity of firms in Madagascar to firms in six other sub-Saharan African countries. Madagascar differs from most other sub-Saharan African countries in its industrial structure. The island’s location off the coast of Africa, its proximity to Mauritius, the Government’s EPZ policies and emphasis on building an effective export-led garments sector has led to skewness towards this industry in manufacturing jobs, foreign ownership and exports. In all our analysis, we take this into account. Our results show that Malagasy enterprises have very low labor productivity and capital per worker. These ratios are amongst the lowest in sub-Saharan Africa and East Asia. However, worker wages are extremely low as well. Median manufacturing wages are lower in Madagascar compared to all other surveyed countries. Comparing labor costs with labor productivity, we see that unit labor costs, measured as the ratio of wages to value-added, are lower in Madagascar compared to most other countries. Unit labor costs are lower than all other countries in sub-Saharan Africa, and similar to that of India and China. Comparing across different firm characteristics in Madagascar, we find that EPZ firms have slightly higher labor productivity than others, and much lower capital intensity. Unit labor costs are lower for EPZ firms compared to non-EPZ firms, and also for large firms compared to smaller enterprises. There are large dispersions in factor productivities around the median between both groups. These dispersions are higher amongst EPZs compared to non-EPZs. The chemicals and paper sectors are the most capital-intensive sectors in the economy. Labor costs per worker increase with firm size, and are higher for EPZ firms compared to non-EPZs. Examining investment behavior of firms in the past three years, we see that the rates of investment are very low- median investment rates in all three years are zero. Less than half of firms invested in each of the last three years. There were few firms making large investments in both the EPZ and non-EPZ sectors. However, after weighting by sales or capital stock, we see that the cumulative investment ratio for 2002-2004 is only 7 percent of sales, or 3.8 percent of capital stock. Sustainable growth will require a much greater push towards fixed investments. Total factor productivity results for the manufacturing sector indicate that firms in Madagascar are producing under increasing returns to scale, with larger firms being more

12
efficient than smaller enterprises. The metal working sector is the least efficient, followed by the wood and furniture sector. EPZ firms are significantly more efficient than non-EPZ enterprises. Amongst EPZs, those that are fully foreign-owned are more efficient than those formed as joint ventures with local partners. Location matters: firms that are located around Antananarivo are more efficient than firms in other areas. There are significant positive returns to education and worker training. Firms with university educated managers have 20 percent higher productivity compared to those with only secondary education. Similarly, firms that provide formal training to workers within the enterprise also have 23 percent higher productivity compared to those that do not. The use of external training institutions does not yield better performance. A separate analysis was also conducted for non-EPZ firms within Madagascar. Results were similar to that for the entire sample, indicating that these factors determining productivity are not driven by the characteristics of the EPZ firms alone. Cross-country regression results show that when Malagasy firms are compared as a group (including EPZs) with other countries, their performance is at par with Uganda, Tanzania, Senegal and Kenya, better than Zambia but worse than firms in Mali. However, when we distinguish between Madagascar EPZ firms and others, and compare the non-EPZ firms with enterprises elsewhere, we see that non-EPZ enterprises only perform at par with firm in Uganda and Tanzania. They have lower productivity compared to firms in Senegal, Mali and Kenya. Madagascar EPZ firms perform better than others. Their productivity is comparable to that of firms in Mali, and better than firms in other sub-Saharan African countries.
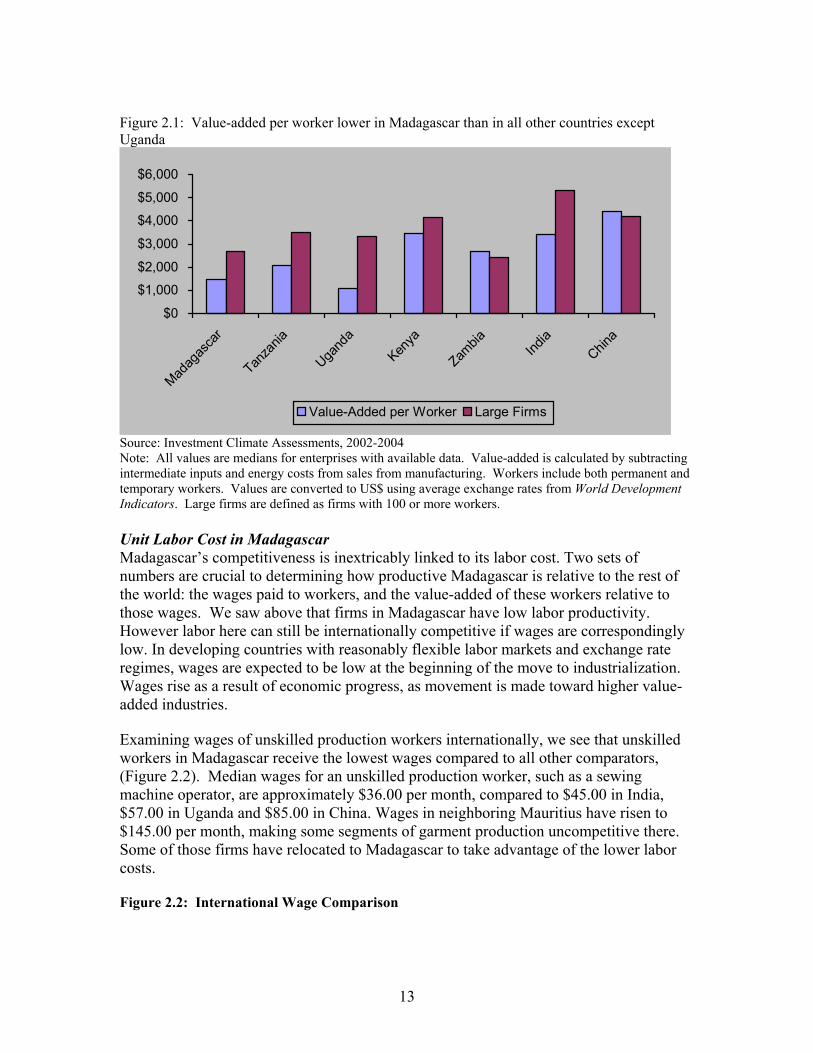
Malagasy Labor Productivity Labor productivity is measured by the value-added per worker ratio. Figure 2.1 presents international comparisons of worker productivity. We see that Malagasy labor has very low productivity. Median labor productivity in Madagascar is higher only compared to workers in Uganda, and almost one third that of workers in India and almost one fourth of the average worker in China. However, the dispersions in worker productivity are higher in Madagascar. Large firms with more than 100 employees have much higher productivity ($2691 per worker), which is almost double the median.
13
Figure 2.1: Value-added per worker lower in Madagascar than in all other countries except Uganda
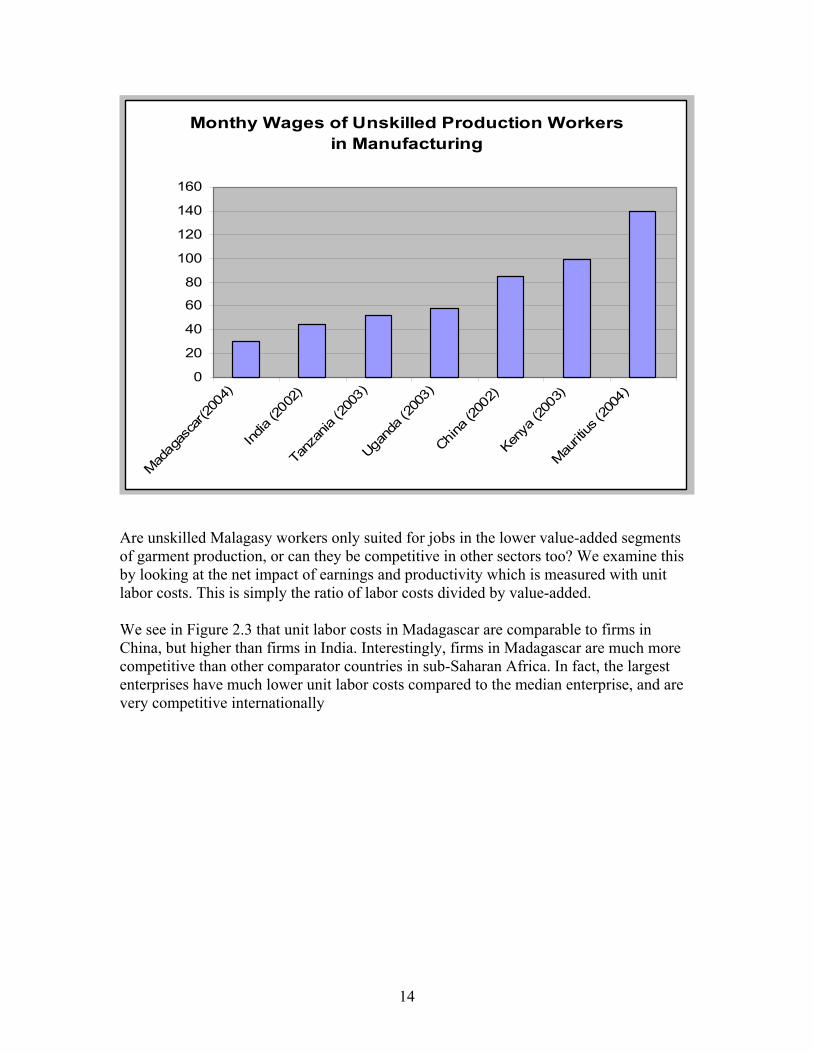
Source: Investment Climate Assessments, 2002-2004 Note: All values are medians for enterprises with available data. Value-added is calculated by subtracting intermediate inputs and energy costs from sales from manufacturing. Workers include both permanent and temporary workers. Values are converted to US$ using average exchange rates from World Development Indicators. Large firms are defined as firms with 100 or more workers. Unit Labor Cost in Madagascar Madagascar’s competitiveness is inextricably linked to its labor cost. Two sets of numbers are crucial to determining how productive Madagascar is relative to the rest of the world: the wages paid to workers, and the value-added of these workers relative to those wages. We saw above that firms in Madagascar have low labor productivity. However labor here can still be internationally competitive if wages are correspondingly low. In developing countries with reasonably flexible labor markets and exchange rate regimes, wages are expected to be low at the beginning of the move to industrialization. Wages rise as a result of economic progress, as movement is made toward higher value-added industries. Examining wages of unskilled production workers internationally, we see that unskilled workers in Madagascar receive the lowest wages compared to all other comparators, (Figure 2.2). Median wages for an unskilled production worker, such as a sewing machine operator, are approximately $36.00 per month, compared to $45.00 in India, $57.00 in Uganda and $85.00 in China. Wages in neighboring Mauritius have risen to $145.00 per month, making some segments of garment production uncompetitive there. Some of those firms have relocated to Madagascar to take advantage of the lower labor costs. Figure 2.2: International Wage Comparison
$0
$1,000
$2,000
$3,000
$4,000
$5,000
$6,000
Madag
asca
r
Tanza
nia
Ugand
a
Kenya
Zambia Ind
iaChin
a
Value-Added per Worker Large Firms
14
Monthy Wages of Unskilled Production Workers in Manufacturing
0
20
40
60
80
100
120
140
160
Madag
asca
r(200
4)
India
(2002
)
Tanz
ania
(200
3)
Ugand
a (20
03)
China (
2002
)
Kenya
(200
3)
Mauriti
us (2
004)
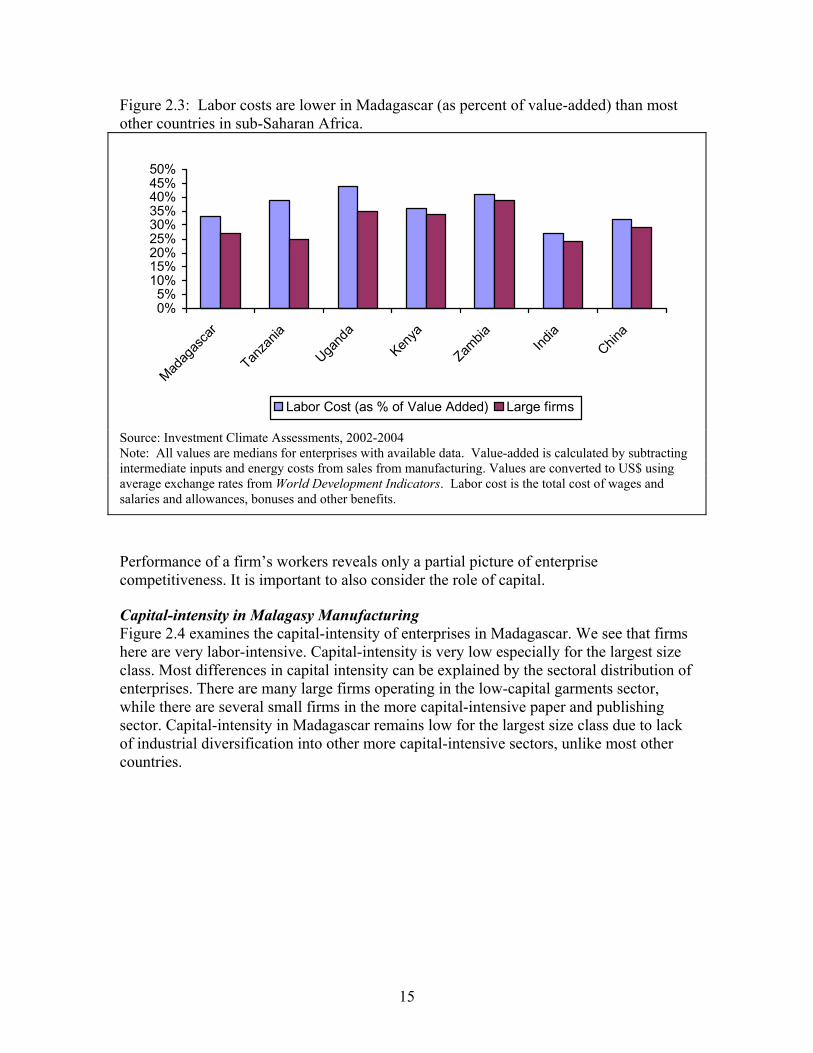
Are unskilled Malagasy workers only suited for jobs in the lower value-added segments of garment production, or can they be competitive in other sectors too? We examine this by looking at the net impact of earnings and productivity which is measured with unit labor costs. This is simply the ratio of labor costs divided by value-added. We see in Figure 2.3 that unit labor costs in Madagascar are comparable to firms in China, but higher than firms in India. Interestingly, firms in Madagascar are much more competitive than other comparator countries in sub-Saharan Africa. In fact, the largest enterprises have much lower unit labor costs compared to the median enterprise, and are very competitive internationally
15
Figure 2.3: Labor costs are lower in Madagascar (as percent of value-added) than most other countries in sub-Saharan Africa.
0%5%
10%15%20%25%30%35%40%45%50%
Madag
asca
r
Tanza
nia
Ugand
aKen
ya
Zambia Ind
iaChin
a
Labor Cost (as % of Value Added) Large firms
Source: Investment Climate Assessments, 2002-2004 Note: All values are medians for enterprises with available data. Value-added is calculated by subtracting intermediate inputs and energy costs from sales from manufacturing. Values are converted to US$ using average exchange rates from World Development Indicators. Labor cost is the total cost of wages and salaries and allowances, bonuses and other benefits.
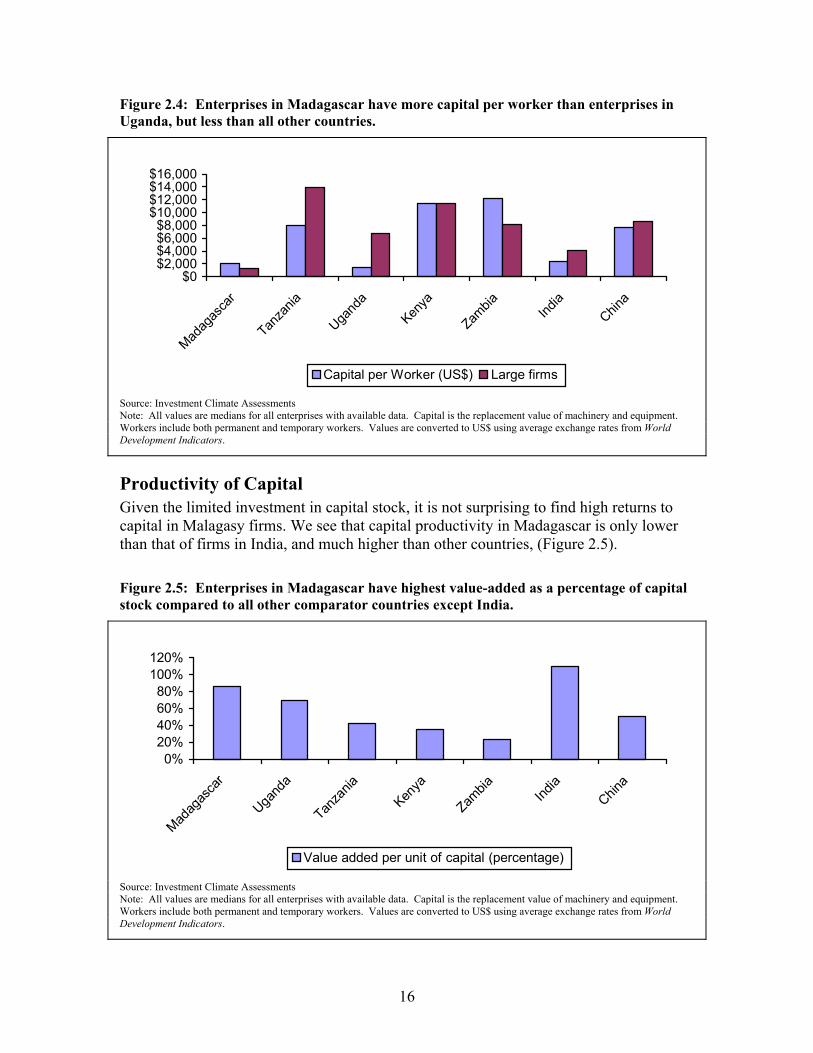
Performance of a firm’s workers reveals only a partial picture of enterprise competitiveness. It is important to also consider the role of capital. Capital-intensity in Malagasy Manufacturing Figure 2.4 examines the capital-intensity of enterprises in Madagascar. We see that firms here are very labor-intensive. Capital-intensity is very low especially for the largest size class. Most differences in capital intensity can be explained by the sectoral distribution of enterprises. There are many large firms operating in the low-capital garments sector, while there are several small firms in the more capital-intensive paper and publishing sector. Capital-intensity in Madagascar remains low for the largest size class due to lack of industrial diversification into other more capital-intensive sectors, unlike most other countries.
16
Figure 2.4: Enterprises in Madagascar have more capital per worker than enterprises in Uganda, but less than all other countries.
$0$2,000$4,000$6,000$8,000
$10,000$12,000$14,000$16,000
Madag
asca
r
Tanza
nia
Ugand
aKen
ya
Zambia Ind
iaChin
a
Capital per Worker (US$) Large firms
Source: Investment Climate Assessments Note: All values are medians for all enterprises with available data. Capital is the replacement value of machinery and equipment. Workers include both permanent and temporary workers. Values are converted to US$ using average exchange rates from World Development Indicators.
Productivity of Capital Given the limited investment in capital stock, it is not surprising to find high returns to capital in Malagasy firms. We see that capital productivity in Madagascar is only lower than that of firms in India, and much higher than other countries, (Figure 2.5). Figure 2.5: Enterprises in Madagascar have highest value-added as a percentage of capital stock compared to all other comparator countries except India.
0%20%40%60%80%
100%120%
Madag
asca
r
Ugand
a
Tanza
niaKen
ya
Zambia Ind
iaChin
a
Value added per unit of capital (percentage)
Source: Investment Climate Assessments Note: All values are medians for all enterprises with available data. Capital is the replacement value of machinery and equipment. Workers include both permanent and temporary workers. Values are converted to US$ using average exchange rates from World Development Indicators.
17
New Investments- Addition to Capital Stock The preceding tables have shown the low capital-intensity in manufacturing. Although these firms have a low threshold amount of capital, how have their investment patterns changed over the last three years? Is most of the capital part of recent investment? Have firms invested in machinery and equipment in the improved macro-economic environment, providing the basis for higher productive capacity and growth? We examine this issue by examining data of the last three years of investments, as reported by the firm in the present survey. Data for 2002 and 2003 are based on recall data. Table 2.1: Investment patterns: 2002-2004 2002 2003 2004 2002 -2004 % of firms investing 31% 39% 38% 62% % of EPZ firms investing 39% 57% 69% 82% % of Non-EPZ firms investing 29% 35% 31% 57% Median investment amounts $0.00 $0.00 $0.00 $1,647 EPZ median investment $0.00 $568.00 $4,545 $23,166 Non-EPZ median investment $0.00 $0.00 $0.00 $681.00 N 292 292 292 292 N-EPZ 55 55 55 55 A striking feature of this data is that many firms do not invest at all. For each of the three years, the median investment amounts are $0.00, (Table 2.1). The median investment amount for all three years combined is only $1,647. Most firms that do make investments lie within the EPZ segment. 82 percent of EPZ firms have made at least some investment in the past three years, compared to only 57 percent of non-EPZ firms. The median investment amounts for EPZ, while much higher than non-EPZ firms, is only $23,166 for all three years combined. The mean investment amounts are higher, driven by a few very large investments, for firms in both groups. Mean investment amount for the sample was $106,000, driven by eight firms which made investments of over $1 million. Of these large investors, three were classified as EPZs, while five were non-EPZ firms. Table 2.2 presents the investment ratios. We look at both investment over sales and investment over capital. Both unweighted and weighted measures are presented, with higher weight being placed on firms with larger capital stock or sales respectively. Given the low capital stock, the weighted averages of investment over sales provide the most useful measure. We see that for the full sample, the investment to sales ratio for all three years combined is 18.6 percent, but drops to 7.6 percent when weighted by sales. There is no significant difference between EPZ and non-EPZ firms. It is clear that investment rates are very low in Malagasy manufacturing. The weighted investment/capital stock ratios reflect a further dire picture- less than 4 percent of capital stock in manufacturing is a result of past three years investment. It is much higher for EPZ firms (which partly arises because of their lower capital stock), and extremely low for the non-EPZ sector.

18
Since these figures reflect gross investment rates for three years combined, and do not include depreciation, the net investment ratios are likely to be even lower. Table 2.2: Aggregate Investment Rates: 2002-2004 Overall EPZ Non-EPZ Investment/sales 18.6% 21% 18% Investment/sales (weighted) 7.6% 7.4% 7.9% Investment/Capital 15% 22% 14% Investment/capital (weighted) 3.8% 14.6% 2.9% Looking jointly at our findings on capital intensity and investment rates, we see that the capital base in Madagascar is low and increasing very slowly, even for the EPZ firms which are the fastest growing firms in terms of employment, (discussed below).
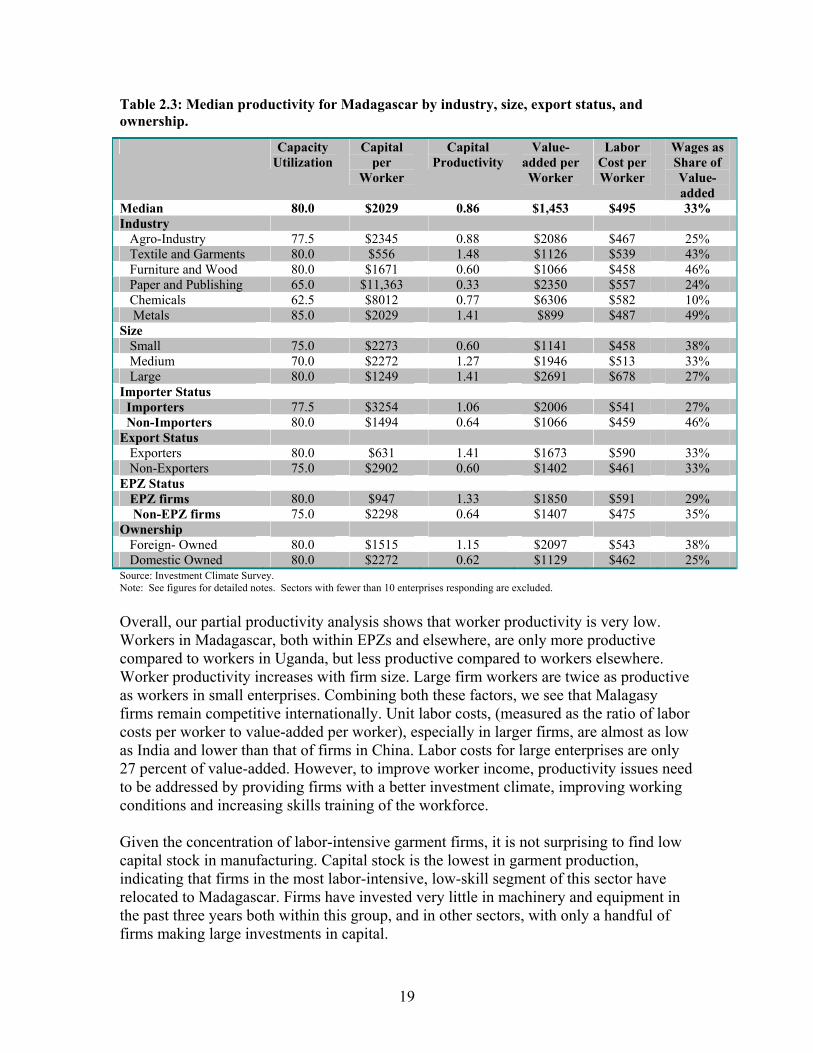
Productivity Differentials within Madagascar Examining differences in firm performance characteristics within Madagascar (Table 2.3 below) we see that firms in the paper and publishing sector have the highest capital intensity, followed by firms in the chemicals sector. Workers in chemicals sector also have corresponding higher labor productivity. Firms in the textile and garments sector have the least amount of capital per worker, and very low labor productivity. Examining differences by firm size, we see that capital intensity declines for the largest group (dominated by the garments EPZ firms), while labor productivity increases. Capacity utilization increases by firm size, as do labor costs per worker. Unit labor costs fall. Labor in larger firms is much more competitive compared to smaller enterprises. Examining EPZ firms versus non-EPZ firms, we see that workers in EPZ firms are more productive than non-EPZ firms. Labor costs are also higher. However, higher productivity is only partly offset by higher labor costs. Unit labor costs are still lower for EPZ firms compared to non-EPZ firms. Capacity utilization rates are high in Madagascar. Median capacity utilization is 80 percent, with low variance. The only sectors with less than 70 percent capacity utilization rates are chemicals and paper, both of which are highly capital-intensive. For all measures of productivity, it is important to note that the medians diverge significantly from the mean, indicating the survival of very inefficient enterprises along with the more productive ones. For example, the mean labor productivity in EPZs is $4955, compared to a median of $1850. For non-EPZs, the mean is $2890, compared to $1407. There are larger dispersions within the EPZ segment, indicating the survival of some EPZ firms at the margin due to the substantial tax benefits, while others are good performers and very competitive internationally.
19
Table 2.3: Median productivity for Madagascar by industry, size, export status, and ownership.
Capacity Utilization
Capital per
Worker
Capital Productivity
Value-added per Worker
Labor Cost per Worker
Wages as Share of Value-added
Median 80.0 $2029 0.86 $1,453 $495 33% Industry Agro-Industry 77.5 $2345 0.88 $2086 $467 25% Textile and Garments 80.0 $556 1.48 $1126 $539 43% Furniture and Wood 80.0 $1671 0.60 $1066 $458 46% Paper and Publishing 65.0 $11,363 0.33 $2350 $557 24% Chemicals 62.5 $8012 0.77 $6306 $582 10% Metals 85.0 $2029 1.41 $899 $487 49% Size Small 75.0 $2273 0.60 $1141 $458 38% Medium 70.0 $2272 1.27 $1946 $513 33% Large 80.0 $1249 1.41 $2691 $678 27% Importer Status Importers 77.5 $3254 1.06 $2006 $541 27% Non-Importers 80.0 $1494 0.64 $1066 $459 46% Export Status Exporters 80.0 $631 1.41 $1673 $590 33% Non-Exporters 75.0 $2902 0.60 $1402 $461 33% EPZ Status EPZ firms 80.0 $947 1.33 $1850 $591 29% Non-EPZ firms 75.0 $2298 0.64 $1407 $475 35% Ownership Foreign- Owned 80.0 $1515 1.15 $2097 $543 38% Domestic Owned 80.0 $2272 0.62 $1129 $462 25% Source: Investment Climate Survey. Note: See figures for detailed notes. Sectors with fewer than 10 enterprises responding are excluded. Overall, our partial productivity analysis shows that worker productivity is very low. Workers in Madagascar, both within EPZs and elsewhere, are only more productive compared to workers in Uganda, but less productive compared to workers elsewhere. Worker productivity increases with firm size. Large firm workers are twice as productive as workers in small enterprises. Combining both these factors, we see that Malagasy firms remain competitive internationally. Unit labor costs, (measured as the ratio of labor costs per worker to value-added per worker), especially in larger firms, are almost as low as India and lower than that of firms in China. Labor costs for large enterprises are only 27 percent of value-added. However, to improve worker income, productivity issues need to be addressed by providing firms with a better investment climate, improving working conditions and increasing skills training of the workforce. Given the concentration of labor-intensive garment firms, it is not surprising to find low capital stock in manufacturing. Capital stock is the lowest in garment production, indicating that firms in the most labor-intensive, low-skill segment of this sector have relocated to Madagascar. Firms have invested very little in machinery and equipment in the past three years both within this group, and in other sectors, with only a handful of firms making large investments in capital.
20
Although measures of labor and capital productivity provide useful information on firm performance, they can be misleading when considered in isolation. For example, a firm could have high labor productivity because it is efficient. It could also have high labor productivity only because it uses a capital-intensive production process. Therefore, it is also useful to look at total factor productivity, which examines the residual productivity of firms after controlling for use of capital, labor and intermediate inputs. Firms with higher total factor productivity are more efficient than other firms because they produce more output with fewer inputs. We examine this measure next.
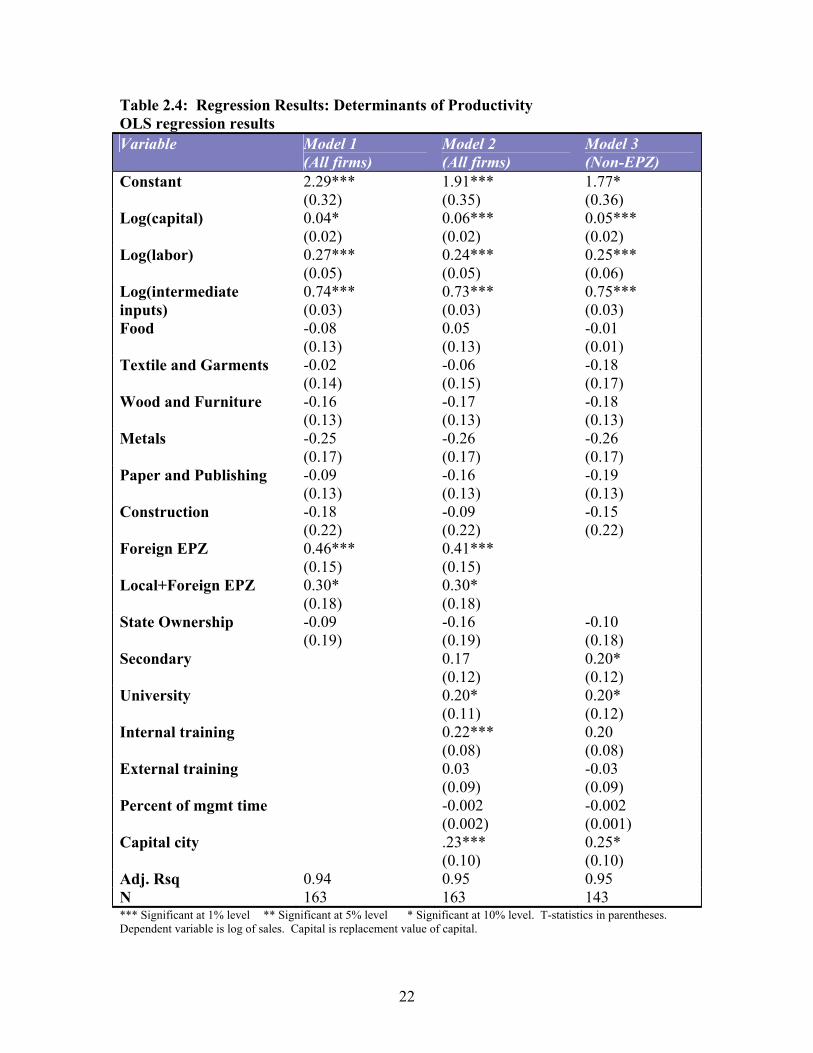
Total Factor Productivity Results Total factor productivity is estimated by using an OLS production function. The dependent variable is log of total sale, and all regressions control for the enterprises’ use of capital, labor and intermediate inputs (raw materials plus energy). Results are presented in Table 2.4 below. The first model estimates a basic production function, augmented only by ownership characteristics. We see increasing returns to scale in manufacturing. The sum of coefficients for labor, capital and intermediate inputs equals 1.05, indicating that doubling inputs will more than double output. Therefore, larger firms using more inputs are more efficient than smaller enterprises. Distinguishing between fully foreign-owned EPZs (100 percent foreign owned firms) versus EPZs that have some local collaboration, and state-owned enterprises versus others, we see that fully foreign EPZs are most productive, with 46 percent higher productivity compared to others. Joint EPZs have lower efficiency. They are 30 percent more efficient than other enterprises. This difference is significant at the 10 percent level. State-owned firms are less efficient than others, but that difference is not significant. The second model builds on the first by including other enterprise characteristics. We see that human capital formation is very significant in determining productivity. Managers or owners with university education have 20 percent higher productivity compared to managers with secondary education only. We also see that firms that provide internal training to their workers have 22 percent higher productivity compared to others. There is no impact on firm performance of external training provided by firms, which probably reflects on the poor quality of external training institutions or their ineffectiveness in providing firm-specific training to workers.2
2 Several econometric issues can be raised in the context of these regressions. Endogeneity is always an issue in cross-section data. Sector specific production functions are also more appropriate. These issues will be addressed in future research papers. Productivity regressions, using a single-step OLS procedure, have been shown to yield consistent estimates and is the approach used here.
21
Box 2.1: Mauritius versus Madagascar – Some Comparisons
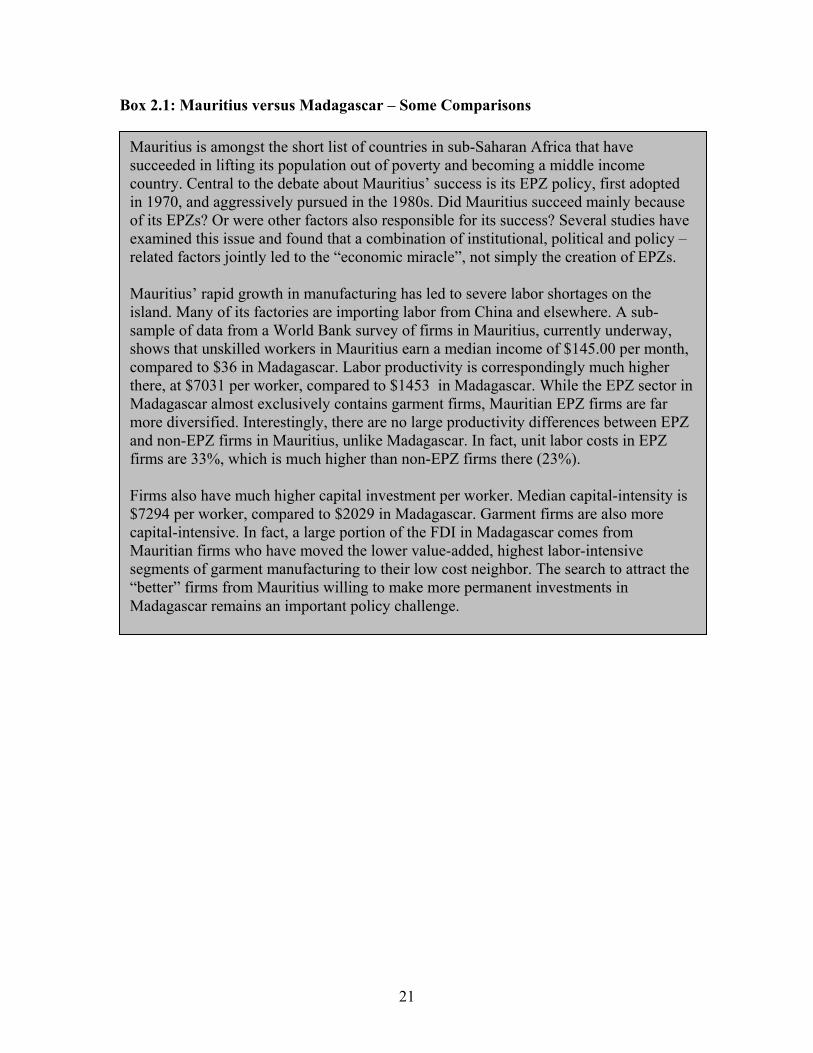
Mauritius is amongst the short list of countries in sub-Saharan Africa that have succeeded in lifting its population out of poverty and becoming a middle income country. Central to the debate about Mauritius’ success is its EPZ policy, first adopted in 1970, and aggressively pursued in the 1980s. Did Mauritius succeed mainly because of its EPZs? Or were other factors also responsible for its success? Several studies have examined this issue and found that a combination of institutional, political and policy –related factors jointly led to the “economic miracle”, not simply the creation of EPZs. Mauritius’ rapid growth in manufacturing has led to severe labor shortages on the island. Many of its factories are importing labor from China and elsewhere. A sub-sample of data from a World Bank survey of firms in Mauritius, currently underway, shows that unskilled workers in Mauritius earn a median income of $145.00 per month, compared to $36 in Madagascar. Labor productivity is correspondingly much higher there, at $7031 per worker, compared to $1453 in Madagascar. While the EPZ sector in Madagascar almost exclusively contains garment firms, Mauritian EPZ firms are far more diversified. Interestingly, there are no large productivity differences between EPZ and non-EPZ firms in Mauritius, unlike Madagascar. In fact, unit labor costs in EPZ firms are 33%, which is much higher than non-EPZ firms there (23%). Firms also have much higher capital investment per worker. Median capital-intensity is $7294 per worker, compared to $2029 in Madagascar. Garment firms are also more capital-intensive. In fact, a large portion of the FDI in Madagascar comes from Mauritian firms who have moved the lower value-added, highest labor-intensive segments of garment manufacturing to their low cost neighbor. The search to attract the “better” firms from Mauritius willing to make more permanent investments in Madagascar remains an important policy challenge.
22
Table 2.4: Regression Results: Determinants of Productivity OLS regression results Variable Model 1
(All firms) Model 2 (All firms)
Model 3 (Non-EPZ)
Constant 2.29*** (0.32)
1.91*** (0.35)
1.77* (0.36)
Log(capital) 0.04* (0.02)
0.06*** (0.02)
0.05*** (0.02)
Log(labor) 0.27*** (0.05)
0.24*** (0.05)
0.25*** (0.06)
Log(intermediate inputs)
0.74*** (0.03)
0.73*** (0.03)
0.75*** (0.03)
Food -0.08 (0.13)
0.05 (0.13)
-0.01 (0.01)
Textile and Garments -0.02 (0.14)
-0.06 (0.15)
-0.18 (0.17)
Wood and Furniture -0.16 (0.13)
-0.17 (0.13)
-0.18 (0.13)
Metals -0.25 (0.17)
-0.26 (0.17)
-0.26 (0.17)
Paper and Publishing -0.09 (0.13)
-0.16 (0.13)
-0.19 (0.13)
Construction -0.18 (0.22)
-0.09 (0.22)
-0.15 (0.22)
Foreign EPZ 0.46*** (0.15)
0.41*** (0.15)
Local+Foreign EPZ 0.30* (0.18)
0.30* (0.18)
State Ownership -0.09 (0.19)
-0.16 (0.19)
-0.10 (0.18)
Secondary 0.17 (0.12)
0.20* (0.12)
University 0.20* (0.11)
0.20* (0.12)
Internal training 0.22*** (0.08)
0.20 (0.08)
External training 0.03 (0.09)
-0.03 (0.09)
Percent of mgmt time -0.002 (0.002)
-0.002 (0.001)
Capital city .23*** (0.10)
0.25* (0.10)
Adj. Rsq 0.94 0.95 0.95 N 163 163 143 *** Significant at 1% level ** Significant at 5% level * Significant at 10% level. T-statistics in parentheses. Dependent variable is log of sales. Capital is replacement value of capital.
23
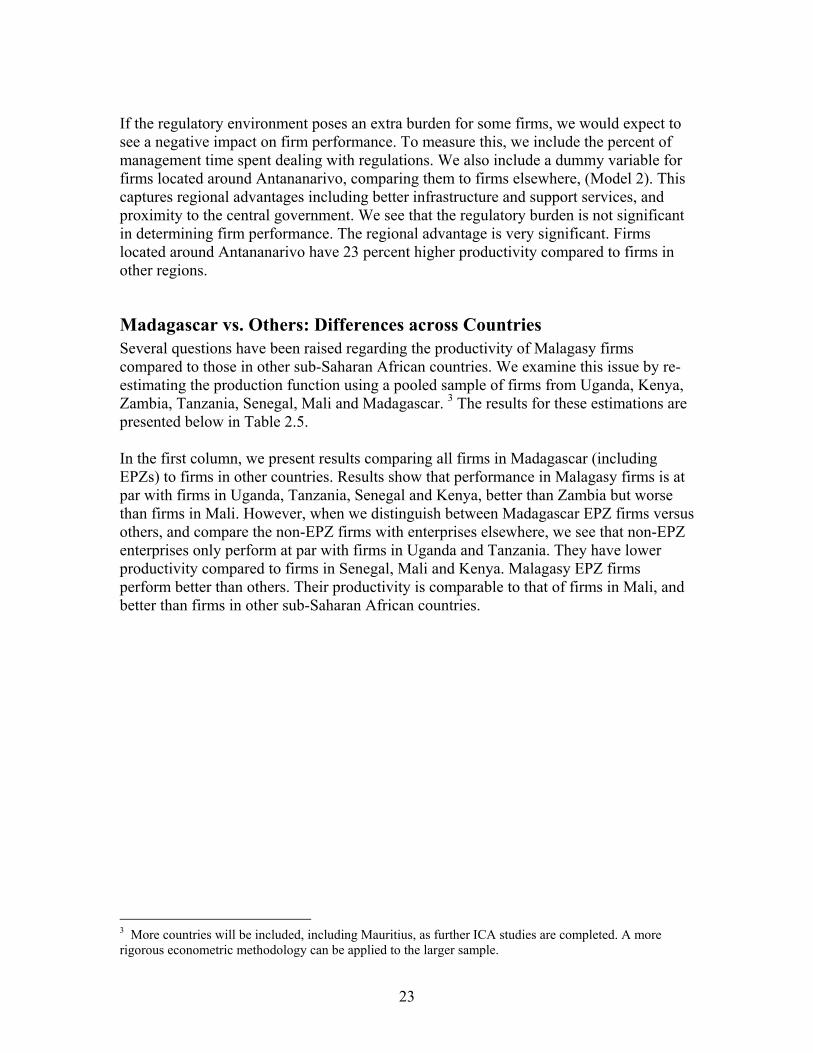
If the regulatory environment poses an extra burden for some firms, we would expect to see a negative impact on firm performance. To measure this, we include the percent of management time spent dealing with regulations. We also include a dummy variable for firms located around Antananarivo, comparing them to firms elsewhere, (Model 2). This captures regional advantages including better infrastructure and support services, and proximity to the central government. We see that the regulatory burden is not significant in determining firm performance. The regional advantage is very significant. Firms located around Antananarivo have 23 percent higher productivity compared to firms in other regions.
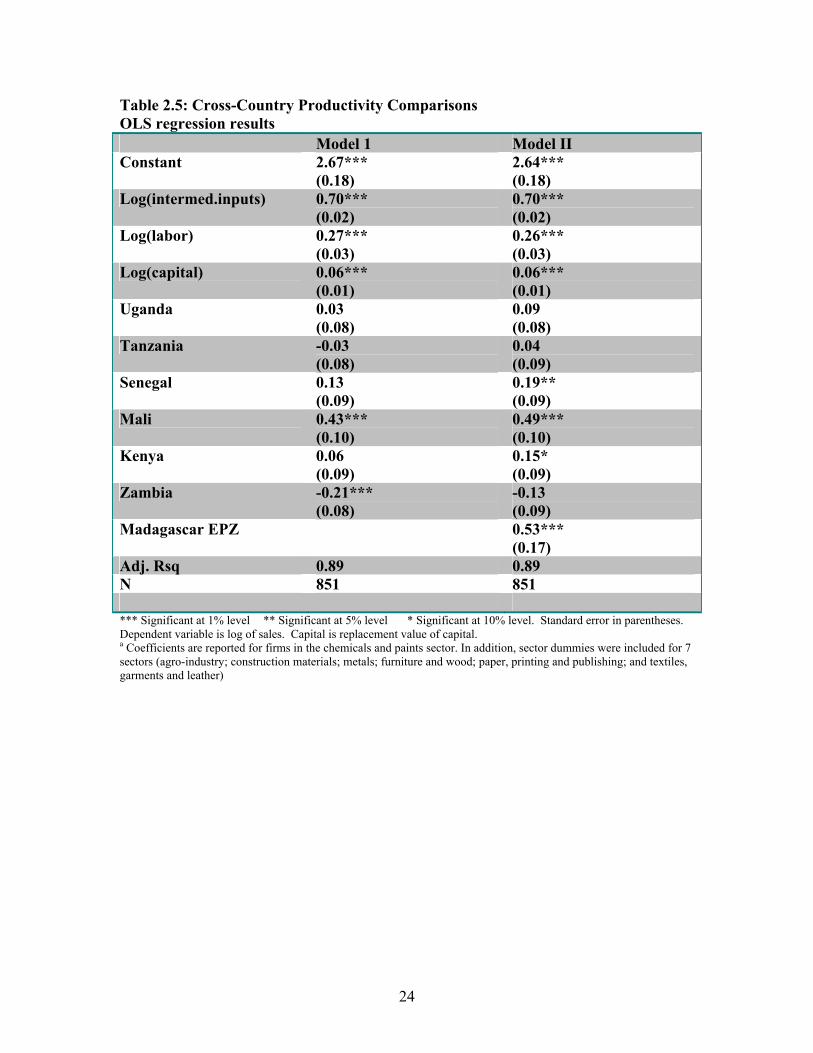
Madagascar vs. Others: Differences across Countries Several questions have been raised regarding the productivity of Malagasy firms compared to those in other sub-Saharan African countries. We examine this issue by re-estimating the production function using a pooled sample of firms from Uganda, Kenya, Zambia, Tanzania, Senegal, Mali and Madagascar. 3 The results for these estimations are presented below in Table 2.5. In the first column, we present results comparing all firms in Madagascar (including EPZs) to firms in other countries. Results show that performance in Malagasy firms is at par with firms in Uganda, Tanzania, Senegal and Kenya, better than Zambia but worse than firms in Mali. However, when we distinguish between Madagascar EPZ firms versus others, and compare the non-EPZ firms with enterprises elsewhere, we see that non-EPZ enterprises only perform at par with firms in Uganda and Tanzania. They have lower productivity compared to firms in Senegal, Mali and Kenya. Malagasy EPZ firms perform better than others. Their productivity is comparable to that of firms in Mali, and better than firms in other sub-Saharan African countries.
3 More countries will be included, including Mauritius, as further ICA studies are completed. A more rigorous econometric methodology can be applied to the larger sample.
24
Table 2.5: Cross-Country Productivity Comparisons OLS regression results Model 1 Model II Constant
2.67*** (0.18)
2.64*** (0.18)
Log(intermed.inputs) 0.70*** (0.02)
0.70*** (0.02)
Log(labor) 0.27*** (0.03)
0.26*** (0.03)
Log(capital) 0.06*** (0.01)
0.06*** (0.01)
Uganda 0.03 (0.08)
0.09 (0.08)
Tanzania -0.03 (0.08)
0.04 (0.09)
Senegal 0.13 (0.09)
0.19** (0.09)
Mali 0.43*** (0.10)
0.49*** (0.10)
Kenya 0.06 (0.09)
0.15* (0.09)
Zambia -0.21*** (0.08)
-0.13 (0.09)
Madagascar EPZ 0.53*** (0.17)
Adj. Rsq 0.89 0.89 N 851 851 *** Significant at 1% level ** Significant at 5% level * Significant at 10% level. Standard error in parentheses. Dependent variable is log of sales. Capital is replacement value of capital. a Coefficients are reported for firms in the chemicals and paints sector. In addition, sector dummies were included for 7 sectors (agro-industry; construction materials; metals; furniture and wood; paper, printing and publishing; and textiles, garments and leather)
25
Conclusion Our results show that Malagasy enterprises have very low labor productivity and capital per worker. These ratios are amongst the lowest in sub-Saharan Africa and East Asia. However, worker wages are extremely low as well. Median manufacturing wages are lower in Madagascar compared to all other surveyed countries. Comparing labor costs with labor productivity, we see that unit labor costs, measured as the ratio of wages to value-added, are lower in Madagascar compared to most other countries. Unit labor costs are lower than all other countries in sub-Saharan Africa, and similar to that of India and China. Comparing across different firm characteristics in Madagascar, we find that EPZ firms have slightly higher labor productivity than others, and much lower capital intensity. Unit labor costs are lower for EPZ firms compared to non-EPZ firms, and also for large firms compared to smaller enterprises. The chemicals and paper sectors are the most capital-intensive sectors in the economy. Labor costs per worker increase with firm size, and are higher for EPZ firms compared to non-EPZs. Examining investment behavior of firms in the past three years, we see that the rates of investment are very low. Median investment rates in all three years are $0.00. Less than half of firms invested in each of the last three years. There were few firms making large investments in both the EPZ and non-EPZ sectors. However, after weighting by sales or capital stock, we see that the cumulative investment ratio for 2002-2004 is only 7 percent of sales, or 3.8 percent of capital stock. Sustainable growth will require a much greater push towards fixed investments. Total factor productivity results for the manufacturing sector indicate that firms in Madagascar are producing under increasing returns to scale, with larger firms being more efficient than smaller enterprises. The wood and furniture sector is the least efficient, followed by metals. EPZ firms are significantly more efficient than non-EPZ enterprises. Amongst EPZs, those that are fully foreign-owned are more efficient than those formed as joint ventures with local partners. Location matters: firms that are located around Antananarivo are more efficient than firms in other areas. There are significant positive returns to education and worker training. Firms with university educated managers have 20 percent higher productivity compared to those with only secondary education. Similarly, firms that provide formal training to workers within the enterprise also have higher productivity compared to those that do not. The use of external training institutions does not yield better performance. A separate analysis was also conducted for non-EPZ firms within Madagascar. Results were similar to that for the entire sample, indicating that these factors determining productivity are not driven by the characteristics of the EPZ firms alone. Cross-country regression results show that when Malagasy firms are compared as a group (including EPZs) with other countries, their performance is at par with Uganda, Tanzania, Senegal and Kenya, better than Zambia but worse than firms in Mali. However, when we distinguish between Madagascar EPZ firms versus others, and compare the non-EPZ

26
firms with enterprises elsewhere, we see that non-EPZ enterprises only perform at par with firm in Uganda and Tanzania. They have lower productivity compared to firms in Senegal, Mali and Kenya. Madagascar EPZ firms perform better than others. Their productivity is comparable to that of firms in Mali, and better than firms in other sub-Saharan African countries.
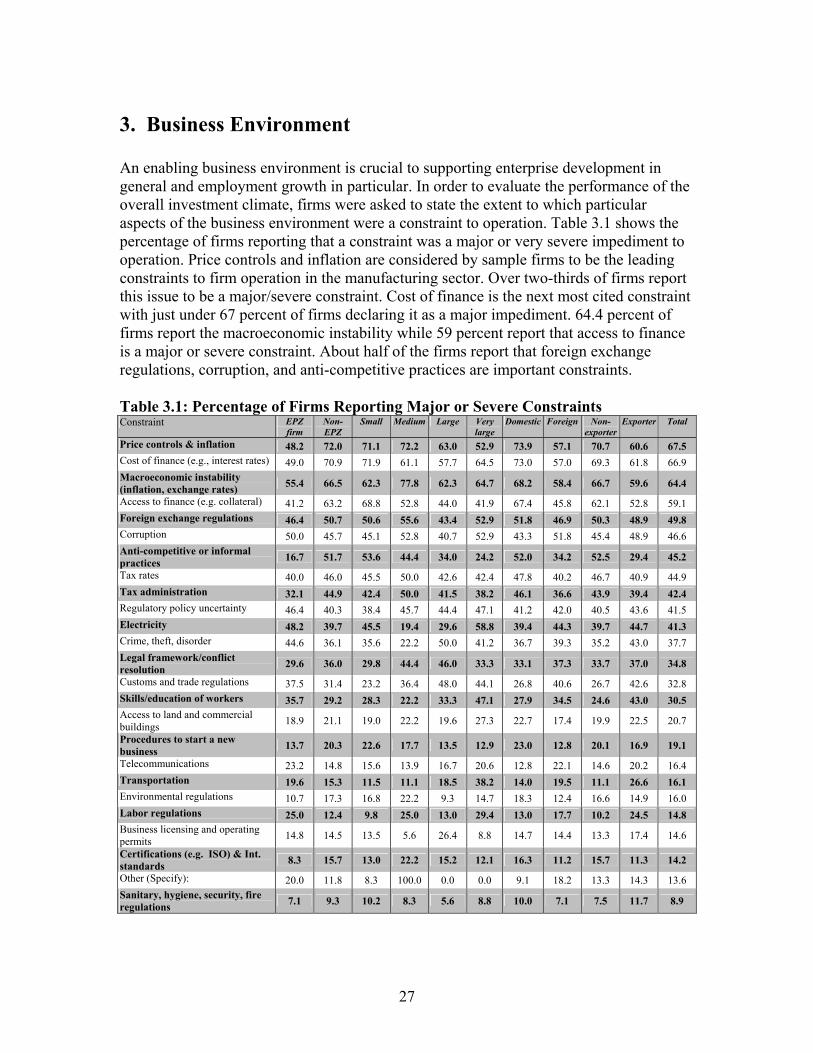
27
3. Business Environment An enabling business environment is crucial to supporting enterprise development in general and employment growth in particular. In order to evaluate the performance of the overall investment climate, firms were asked to state the extent to which particular aspects of the business environment were a constraint to operation. Table 3.1 shows the percentage of firms reporting that a constraint was a major or very severe impediment to operation. Price controls and inflation are considered by sample firms to be the leading constraints to firm operation in the manufacturing sector. Over two-thirds of firms report this issue to be a major/severe constraint. Cost of finance is the next most cited constraint with just under 67 percent of firms declaring it as a major impediment. 64.4 percent of firms report the macroeconomic instability while 59 percent report that access to finance is a major or severe constraint. About half of the firms report that foreign exchange regulations, corruption, and anti-competitive practices are important constraints. Table 3.1: Percentage of Firms Reporting Major or Severe Constraints Constraint EPZ
firm Non-EPZ
Small Medium Large Very large
Domestic Foreign Non-exporter
Exporter Total
Price controls & inflation 48.2 72.0 71.1 72.2 63.0 52.9 73.9 57.1 70.7 60.6 67.5 Cost of finance (e.g., interest rates) 49.0 70.9 71.9 61.1 57.7 64.5 73.0 57.0 69.3 61.8 66.9 Macroeconomic instability (inflation, exchange rates) 55.4 66.5 62.3 77.8 62.3 64.7 68.2 58.4 66.7 59.6 64.4
Access to finance (e.g. collateral) 41.2 63.2 68.8 52.8 44.0 41.9 67.4 45.8 62.1 52.8 59.1 Foreign exchange regulations 46.4 50.7 50.6 55.6 43.4 52.9 51.8 46.9 50.3 48.9 49.8 Corruption 50.0 45.7 45.1 52.8 40.7 52.9 43.3 51.8 45.4 48.9 46.6 Anti-competitive or informal practices 16.7 51.7 53.6 44.4 34.0 24.2 52.0 34.2 52.5 29.4 45.2
Tax rates 40.0 46.0 45.5 50.0 42.6 42.4 47.8 40.2 46.7 40.9 44.9 Tax administration 32.1 44.9 42.4 50.0 41.5 38.2 46.1 36.6 43.9 39.4 42.4 Regulatory policy uncertainty 46.4 40.3 38.4 45.7 44.4 47.1 41.2 42.0 40.5 43.6 41.5 Electricity 48.2 39.7 45.5 19.4 29.6 58.8 39.4 44.3 39.7 44.7 41.3 Crime, theft, disorder 44.6 36.1 35.6 22.2 50.0 41.2 36.7 39.3 35.2 43.0 37.7 Legal framework/conflict resolution 29.6 36.0 29.8 44.4 46.0 33.3 33.1 37.3 33.7 37.0 34.8
Customs and trade regulations 37.5 31.4 23.2 36.4 48.0 44.1 26.8 40.6 26.7 42.6 32.8 Skills/education of workers 35.7 29.2 28.3 22.2 33.3 47.1 27.9 34.5 24.6 43.0 30.5 Access to land and commercial buildings 18.9 21.1 19.0 22.2 19.6 27.3 22.7 17.4 19.9 22.5 20.7
Procedures to start a new business 13.7 20.3 22.6 17.7 13.5 12.9 23.0 12.8 20.1 16.9 19.1
Telecommunications 23.2 14.8 15.6 13.9 16.7 20.6 12.8 22.1 14.6 20.2 16.4 Transportation 19.6 15.3 11.5 11.1 18.5 38.2 14.0 19.5 11.1 26.6 16.1 Environmental regulations 10.7 17.3 16.8 22.2 9.3 14.7 18.3 12.4 16.6 14.9 16.0 Labor regulations 25.0 12.4 9.8 25.0 13.0 29.4 13.0 17.7 10.2 24.5 14.8 Business licensing and operating permits 14.8 14.5 13.5 5.6 26.4 8.8 14.7 14.4 13.3 17.4 14.6
Certifications (e.g. ISO) & Int. standards 8.3 15.7 13.0 22.2 15.2 12.1 16.3 11.2 15.7 11.3 14.2
Other (Specify): 20.0 11.8 8.3 100.0 0.0 0.0 9.1 18.2 13.3 14.3 13.6 Sanitary, hygiene, security, fire regulations 7.1 9.3 10.2 8.3 5.6 8.8 10.0 7.1 7.5 11.7 8.9
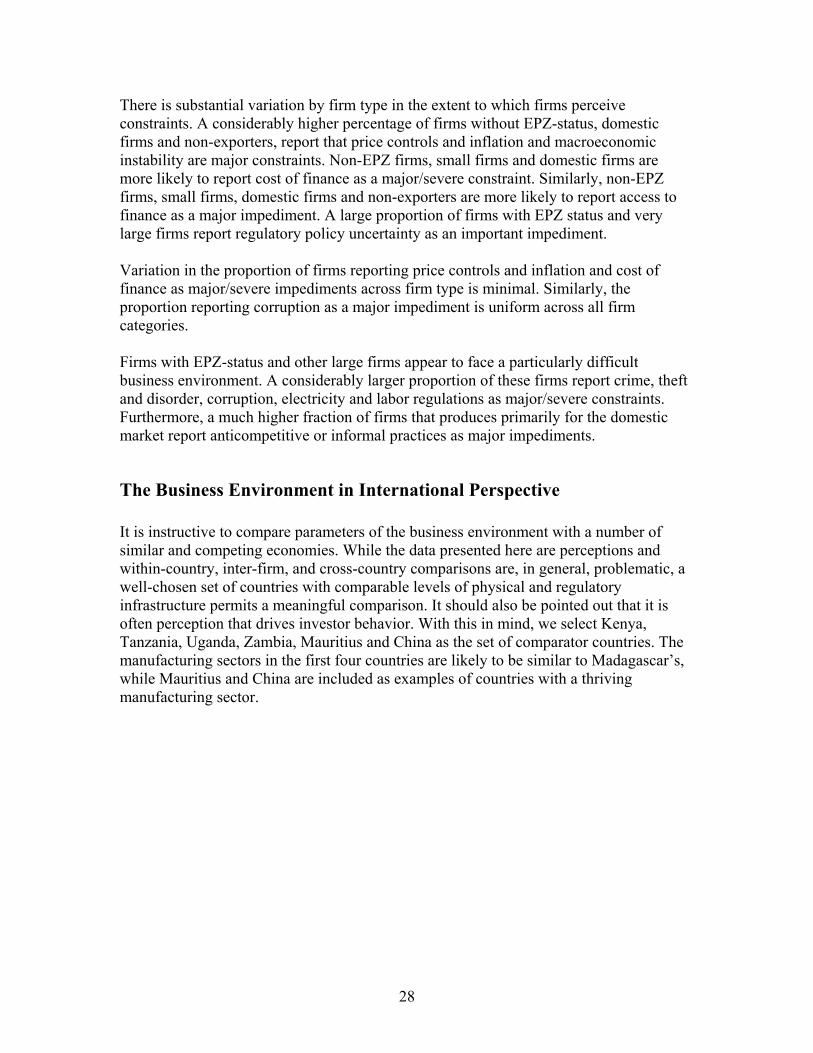
28
There is substantial variation by firm type in the extent to which firms perceive constraints. A considerably higher percentage of firms without EPZ-status, domestic firms and non-exporters, report that price controls and inflation and macroeconomic instability are major constraints. Non-EPZ firms, small firms and domestic firms are more likely to report cost of finance as a major/severe constraint. Similarly, non-EPZ firms, small firms, domestic firms and non-exporters are more likely to report access to finance as a major impediment. A large proportion of firms with EPZ status and very large firms report regulatory policy uncertainty as an important impediment. Variation in the proportion of firms reporting price controls and inflation and cost of finance as major/severe impediments across firm type is minimal. Similarly, the proportion reporting corruption as a major impediment is uniform across all firm categories. Firms with EPZ-status and other large firms appear to face a particularly difficult business environment. A considerably larger proportion of these firms report crime, theft and disorder, corruption, electricity and labor regulations as major/severe constraints. Furthermore, a much higher fraction of firms that produces primarily for the domestic market report anticompetitive or informal practices as major impediments.
The Business Environment in International Perspective It is instructive to compare parameters of the business environment with a number of similar and competing economies. While the data presented here are perceptions and within-country, inter-firm, and cross-country comparisons are, in general, problematic, a well-chosen set of countries with comparable levels of physical and regulatory infrastructure permits a meaningful comparison. It should also be pointed out that it is often perception that drives investor behavior. With this in mind, we select Kenya, Tanzania, Uganda, Zambia, Mauritius and China as the set of comparator countries. The manufacturing sectors in the first four countries are likely to be similar to Madagascar’s, while Mauritius and China are included as examples of countries with a thriving manufacturing sector.
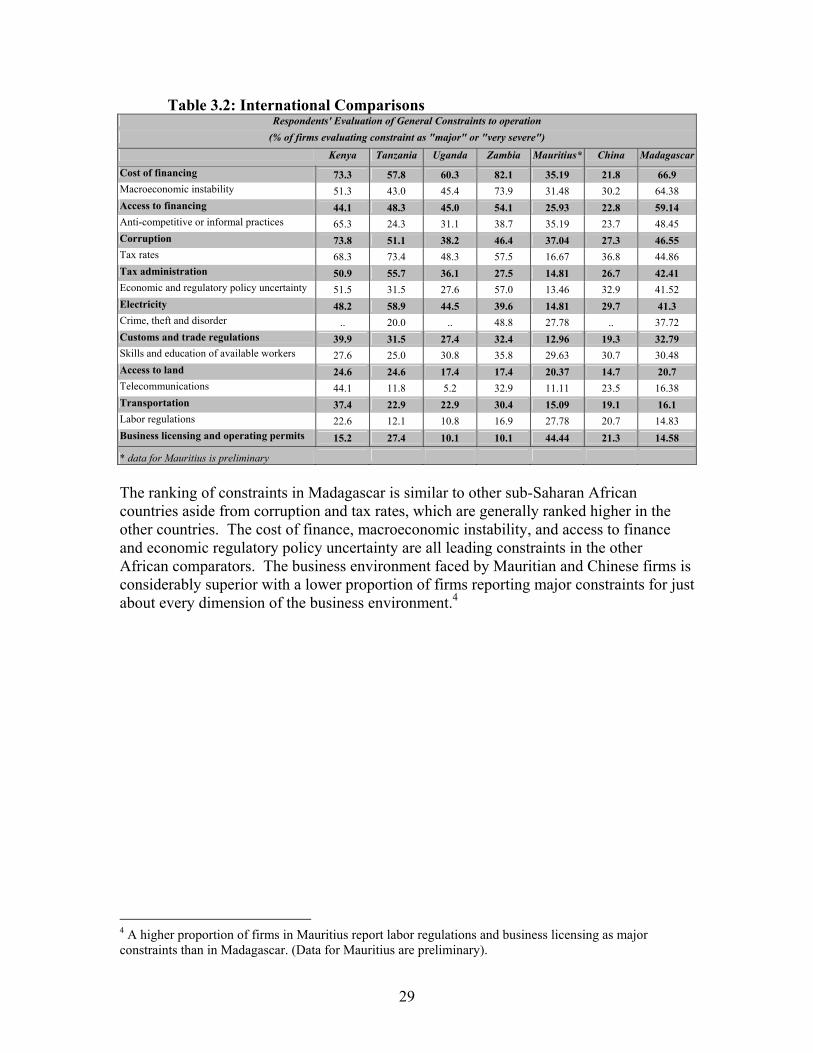
29
Table 3.2: International Comparisons Respondents' Evaluation of General Constraints to operation
(% of firms evaluating constraint as "major" or "very severe")
Kenya Tanzania Uganda Zambia Mauritius* China Madagascar
Cost of financing 73.3 57.8 60.3 82.1 35.19 21.8 66.9 Macroeconomic instability 51.3 43.0 45.4 73.9 31.48 30.2 64.38 Access to financing 44.1 48.3 45.0 54.1 25.93 22.8 59.14 Anti-competitive or informal practices 65.3 24.3 31.1 38.7 35.19 23.7 48.45 Corruption 73.8 51.1 38.2 46.4 37.04 27.3 46.55 Tax rates 68.3 73.4 48.3 57.5 16.67 36.8 44.86 Tax administration 50.9 55.7 36.1 27.5 14.81 26.7 42.41 Economic and regulatory policy uncertainty 51.5 31.5 27.6 57.0 13.46 32.9 41.52 Electricity 48.2 58.9 44.5 39.6 14.81 29.7 41.3 Crime, theft and disorder .. 20.0 .. 48.8 27.78 .. 37.72 Customs and trade regulations 39.9 31.5 27.4 32.4 12.96 19.3 32.79 Skills and education of available workers 27.6 25.0 30.8 35.8 29.63 30.7 30.48 Access to land 24.6 24.6 17.4 17.4 20.37 14.7 20.7 Telecommunications 44.1 11.8 5.2 32.9 11.11 23.5 16.38 Transportation 37.4 22.9 22.9 30.4 15.09 19.1 16.1 Labor regulations 22.6 12.1 10.8 16.9 27.78 20.7 14.83 Business licensing and operating permits 15.2 27.4 10.1 10.1 44.44 21.3 14.58
* data for Mauritius is preliminary
The ranking of constraints in Madagascar is similar to other sub-Saharan African countries aside from corruption and tax rates, which are generally ranked higher in the other countries. The cost of finance, macroeconomic instability, and access to finance and economic regulatory policy uncertainty are all leading constraints in the other African comparators. The business environment faced by Mauritian and Chinese firms is considerably superior with a lower proportion of firms reporting major constraints for just about every dimension of the business environment.4
4 A higher proportion of firms in Mauritius report labor regulations and business licensing as major constraints than in Madagascar. (Data for Mauritius are preliminary).
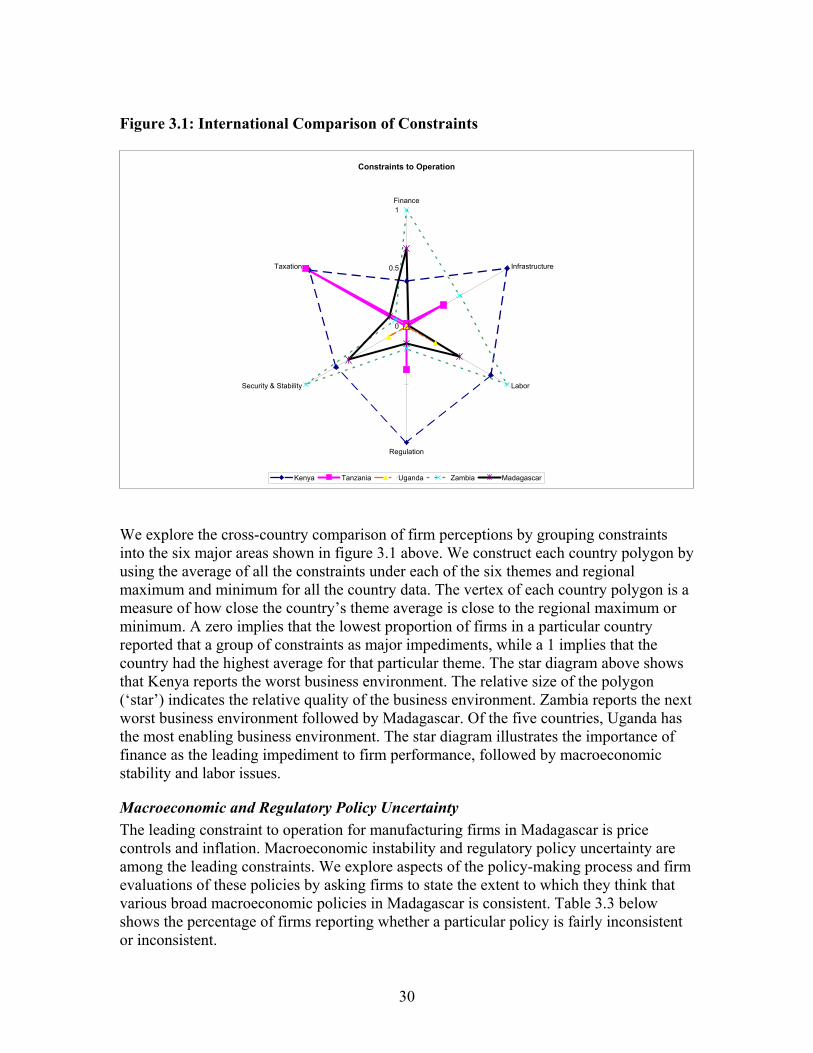
30
Figure 3.1: International Comparison of Constraints
We explore the cross-country comparison of firm perceptions by grouping constraints into the six major areas shown in figure 3.1 above. We construct each country polygon by using the average of all the constraints under each of the six themes and regional maximum and minimum for all the country data. The vertex of each country polygon is a measure of how close the country’s theme average is close to the regional maximum or minimum. A zero implies that the lowest proportion of firms in a particular country reported that a group of constraints as major impediments, while a 1 implies that the country had the highest average for that particular theme. The star diagram above shows that Kenya reports the worst business environment. The relative size of the polygon (‘star’) indicates the relative quality of the business environment. Zambia reports the next worst business environment followed by Madagascar. Of the five countries, Uganda has the most enabling business environment. The star diagram illustrates the importance of finance as the leading impediment to firm performance, followed by macroeconomic stability and labor issues.
Macroeconomic and Regulatory Policy Uncertainty The leading constraint to operation for manufacturing firms in Madagascar is price controls and inflation. Macroeconomic instability and regulatory policy uncertainty are among the leading constraints. We explore aspects of the policy-making process and firm evaluations of these policies by asking firms to state the extent to which they think that various broad macroeconomic policies in Madagascar is consistent. Table 3.3 below shows the percentage of firms reporting whether a particular policy is fairly inconsistent or inconsistent.
Constraints to Operation
0
0.5
1Finance
Infrastructure
Labor
Regulation
Security & Stability
Taxation
Kenya Tanzania Uganda Zambia Madagascar

31
Table 3.3: Attitudes toward Government Policies Firm type Attraction
of foreign investment
Privatization of state owned
enterprises
Liberalization of trade
Liberalization of foreign exchange
transactions
Improvement of tax
administration
Flexible policy on
employment of foreign workers
Improvement of the
infrastructure facilities
Specific incentives
for investments
Lowering bank
interest rates
Promoting locally
produced goods and services
Non-EPZ firm 28.4 23.7 23.73 29.1 37.3 20.89 15.3 31.8 46.15 28.1
EPZ firm 16.1 16.4 12.73 26.8 14.3 14.29 9.1 19.6 34.55 23.6
Small 25.8 24.6 22.75 26.7 38.9 18.99 16.9 28.7 44.85 27.0 Medium 25.0 22.2 8.33 36.1 33.3 28.57 14.3 25.0 44.44 14.3 Large 29.6 16.7 31.48 27.8 27.8 16.67 9.3 38.9 44.44 33.3 Very large 24.2 18.8 15.63 30.3 12.1 18.75 9.1 24.2 40.63 34.4
Domestic 22.2 23.3 21.67 24.2 37.2 19.41 15.0 26.7 41.9 23.5 Foreign owned 32.1 20.7 21.62 35.7 25.9 19.82 12.7 33.9 47.27 33.3
Non-exporter 26.1 26.1 21.11 26.9 36.7 20.53 13.1 28.6 44.67 28.3
Exporter 25.8 14.1 22.83 32.3 24.7 17.58 16.3 31.2 42.39 25.0 Total 26.0 22.3 21.65 28.6 32.9 19.57 14.1 29.5 43.94 27.2
The highest proportion of firms report that government policy associated with the lowering of interest rates is inconsistent. A large percentage of firms feel that government policy on employment of foreign nationals, improvements in infrastructure, trade liberalization and privatization is fairly consistent. A moderate fraction of firms are also positive about the governments’ position vis-à-vis attraction of foreign investment, foreign exchange liberalization, promoting locally produced goods and tax reform. Table 3.4 below shows the proportion of firms that report being uncertain about future changes in a number of important macroeconomic variables. Just over 40 percent of the firms in the sample are uncertain about increases in GDP growth rates and exchange rates. Firms with EPZ-status and small-large firms are more likely to report being uncertain. 37 percent of firms are uncertain about the exchange rate, while 23 percent of firms are uncertain about increases in the inflation and tax rates.
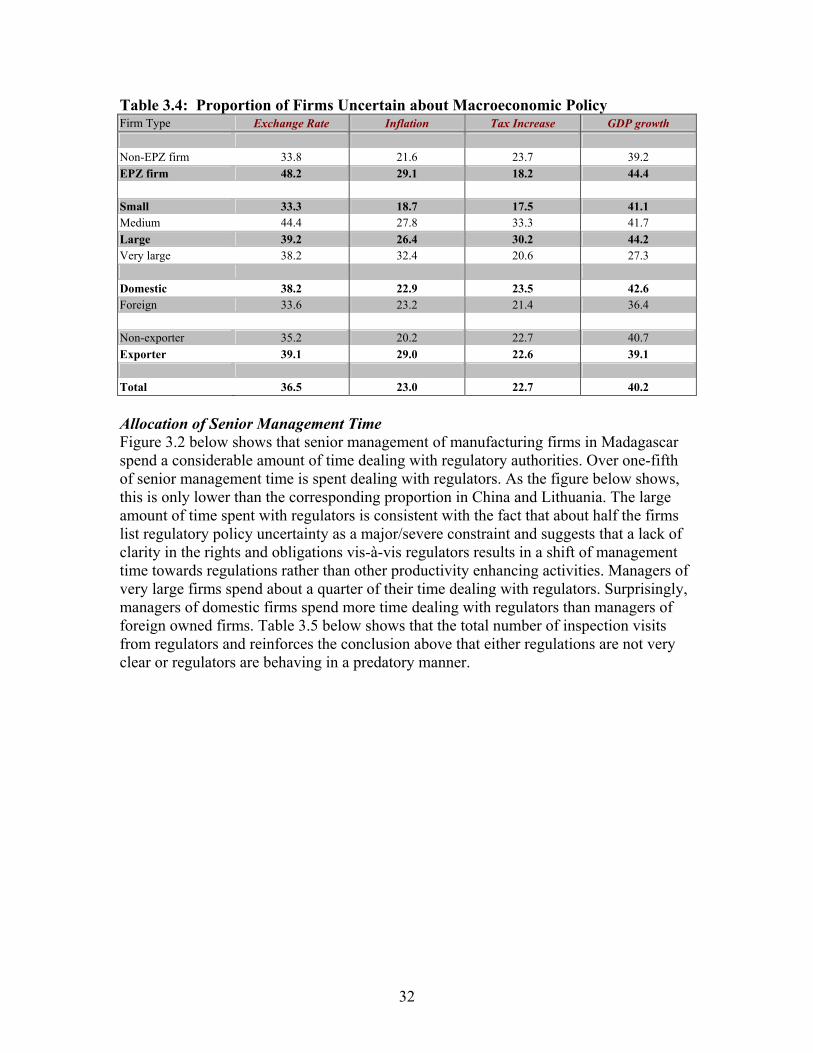
32
Table 3.4: Proportion of Firms Uncertain about Macroeconomic Policy Firm Type Exchange Rate Inflation Tax Increase GDP growth Non-EPZ firm 33.8 21.6 23.7 39.2 EPZ firm 48.2 29.1 18.2 44.4 Small 33.3 18.7 17.5 41.1 Medium 44.4 27.8 33.3 41.7 Large 39.2 26.4 30.2 44.2 Very large 38.2 32.4 20.6 27.3 Domestic 38.2 22.9 23.5 42.6 Foreign 33.6 23.2 21.4 36.4 Non-exporter 35.2 20.2 22.7 40.7 Exporter 39.1 29.0 22.6 39.1 Total 36.5 23.0 22.7 40.2 Allocation of Senior Management Time Figure 3.2 below shows that senior management of manufacturing firms in Madagascar spend a considerable amount of time dealing with regulatory authorities. Over one-fifth of senior management time is spent dealing with regulators. As the figure below shows, this is only lower than the corresponding proportion in China and Lithuania. The large amount of time spent with regulators is consistent with the fact that about half the firms list regulatory policy uncertainty as a major/severe constraint and suggests that a lack of clarity in the rights and obligations vis-à-vis regulators results in a shift of management time towards regulations rather than other productivity enhancing activities. Managers of very large firms spend about a quarter of their time dealing with regulators. Surprisingly, managers of domestic firms spend more time dealing with regulators than managers of foreign owned firms. Table 3.5 below shows that the total number of inspection visits from regulators and reinforces the conclusion above that either regulations are not very clear or regulators are behaving in a predatory manner.
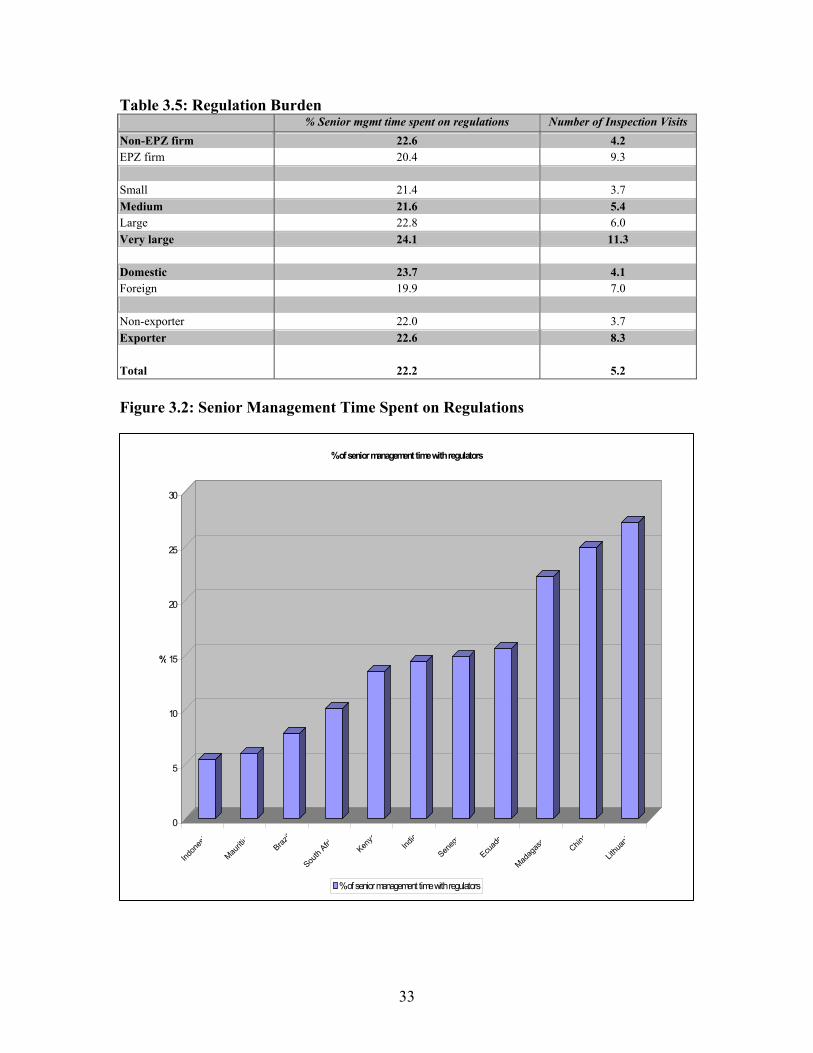
33
Table 3.5: Regulation Burden % Senior mgmt time spent on regulations Number of Inspection Visits
Non-EPZ firm 22.6 4.2 EPZ firm 20.4 9.3 Small 21.4 3.7 Medium 21.6 5.4 Large 22.8 6.0 Very large 24.1 11.3 Domestic 23.7 4.1 Foreign 19.9 7.0 Non-exporter 22.0 3.7 Exporter 22.6 8.3 Total 22.2 5.2 Figure 3.2: Senior Management Time Spent on Regulations
0
5
10
15
20
25
30
%
Indon
esi
Mauriti
uBraz
il
South
Afric Kenya
India
Seneg
a
Ecuad
o
Madag
asc
China
Lithu
ani
% of senior management time with regulators
% of senior management time with regulators

34
Business Start-Up World Bank Doing Business indicators, use "Setting up a business" as a measure of regulatory burden. Madagascar is close to or better than the regional average according to this data which is based on commercial law and assumes the case of one type of “typical” firm, (Table 3.6). Table 3.6: “Setting up a Business” Indicators Indicator Madagascar Regional
Average OECD
Average Number of procedures 13 11 6 Time (days) 44 60 25 Cost (% of income per capita) 65.3 225.2 8.0 Min. capital (% of income per capita) 50.7 254.1 44.1 The Doing Business averages are consistent with data from the ICA on this particular aspect of the regulatory environment, which show that only 19 percent of firms consider "procedures to start a new business" a major or severe constraint. However, the ICA shows that procedures for starting a business are harder for smaller, domestic enterprises than for large companies or EPZ firms. 23 percent of small businesses report this as a constraint as compared to 13 percent of large firms. The different experiences of various types of firms shown in the ICA data could indicate the unpredictability of implementation of regulatory procedures. It is this unpredictability that is driving over 40 percent of firms to rank “Regulatory Policy Uncertainty” as a major or severe constraint, rather than the quality of the written regulations. Labor Regulations Madagascar also compares well to the regional average for Hiring and Firing Workers in the Doing Business data, except for the Difficulty of Firing Index, which is considerably worse in Madagascar, (Table 3.7). Table 3.7: Hiring and Firing Index Indicator Madagascar Regional
Average OECD
Average Difficulty of Hiring Index 28 53.2 26.2 Rigidity of Hours Index 60 64.2 50.0 Difficulty of Firing Index 60 50.6 26.8 Rigidity of Employment Index 49 56.0 34.4 Firing costs (weeks of wages) 41 59.5 40.4 The ICA data are consistent with Doing Business in that Labor Regulations do not rank among the most important constraints for 85 percent of the sample firms in the ICA data. For labor regulations, as in setting up a business, there are differences in the responses

35
according to firm type. Labor regulations are more constraining for larger and EPZ-status businesses than for smaller, domestic firms. Corruption Not unrelated to the problem of regulatory policy uncertainty is corruption. The constraint ranks highly, with 45 percent of firms considering it a major or severe obstacle. This perception is surprisingly consistent across firm types. Generally, it is the large firms in countries of sub-Saharan Africa that seem to be targeted by government officials and asked for larger informal payments.
The Government of Madagascar has recognized corruption as an important issue and has passed an anti-corruption law and created agencies to implement it. Accordingly, the World Bank Governance Indicators Data indicate that compared to our East African comparator countries, Madagascar is doing much better in terms of controlling corruption, (Figure 3.3).
Figure 3.3 Control of Corruption
Figure 3.3 depicts the percentile rank on the governance indicator Control of Corruption. Percentile rank indicates the percentage of countries worldwide that rate below the selected country (subject to margin of error). The statistically likely range of the governance indicator is shown as a thin black line. Higher values imply better governance ratings. However, several governance rankings in Madagascar have slipped since 2002, except for regulatory quality which has seen consistent improvement, (Figure 3.4).

36
Figure 3.4 Governance Indicators
Confidence in Property Rights Enforcement Firms were asked how confident they were “that the judicial system will enforce my contractual property rights in business disputes”. Figure 3.5 shows the percentage of firms that agreed with this statement. Confidence in both arms of government shows a weak relationship with firm size, with the proportion confident increasing with firm size. A lower proportion of exporting firms, particularly very large firms are confident in the judiciary.

37
Figure 3.5: Confidence in Judiciary
020
4060
80
Non-exporter Exporter
MicroSmall
MediumLarge
Very largeMicro
SmallMedium
LargeVery large
Courts will enforce rights
Judiciary Government
Firms were also asked the extent to which they thought that the court system was fair, corrupt, quick, affordable and able to enforce its decisions, (Table 3.8). The table below shows the percentage of firms that have a favorable opinion of the court system. Table 3.8: Attitudes Towards the Court System Domestic Foreign Total Fair and Impartial 18.8 25.0 30.4 Honest/Uncorrupt 14.8 31.3 30.8 Quick 17.0 3.1 11.4 Affordable 47.8 31.3 41 Able to Enforce Decisions 25.5 35.5 29.5 Overall, the majority of firms do not have a favorable impression of the court system. Only 30 percent of firms find the court system fair/impartial and able to enforce decisions, 31 percent think the court system is honest, only 11 percent think that courts resolve cases in a timely fashion and 41 percent find the court system affordable. Aside from the ability to enforce decisions, domestic firms have a more favorable view of the court system than foreign firms. The data presented above is consistent with the results of the 2004 Doing Business Survey in Madagascar that reports a lengthy and costly judiciary process. The Doing Business survey reports that court systems in Madagascar require 29 procedures, 280
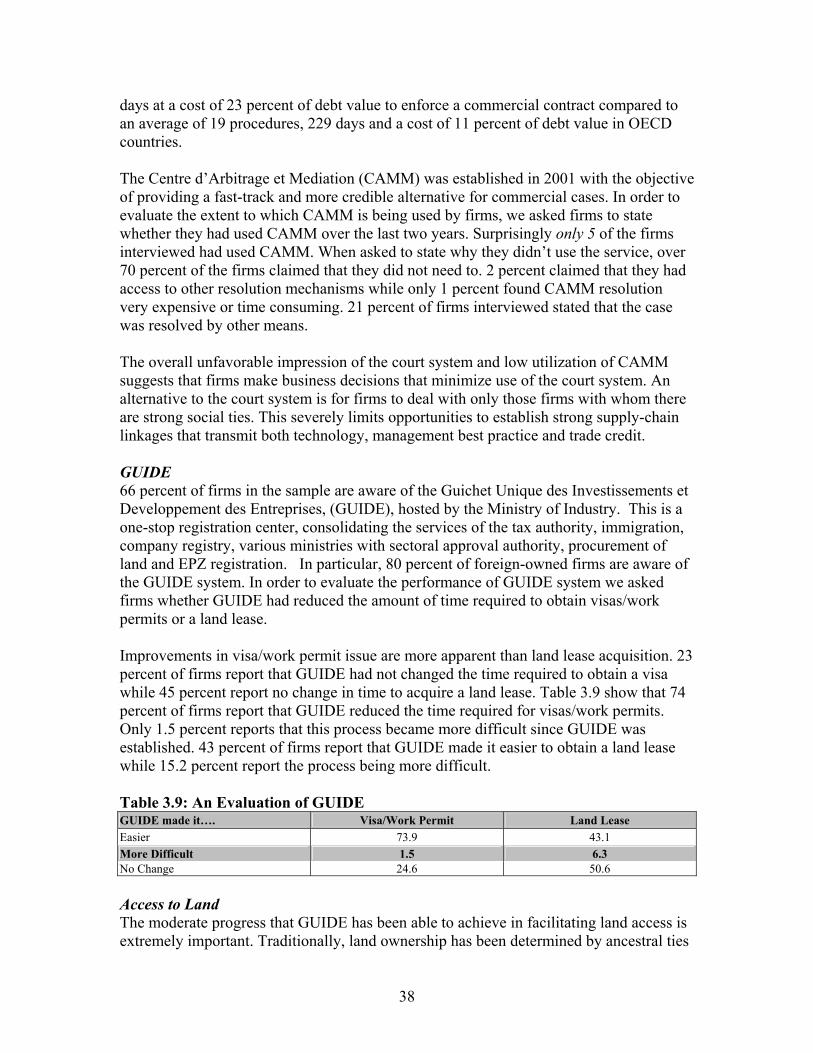
38
days at a cost of 23 percent of debt value to enforce a commercial contract compared to an average of 19 procedures, 229 days and a cost of 11 percent of debt value in OECD countries. The Centre d’Arbitrage et Mediation (CAMM) was established in 2001 with the objective of providing a fast-track and more credible alternative for commercial cases. In order to evaluate the extent to which CAMM is being used by firms, we asked firms to state whether they had used CAMM over the last two years. Surprisingly only 5 of the firms interviewed had used CAMM. When asked to state why they didn’t use the service, over 70 percent of the firms claimed that they did not need to. 2 percent claimed that they had access to other resolution mechanisms while only 1 percent found CAMM resolution very expensive or time consuming. 21 percent of firms interviewed stated that the case was resolved by other means. The overall unfavorable impression of the court system and low utilization of CAMM suggests that firms make business decisions that minimize use of the court system. An alternative to the court system is for firms to deal with only those firms with whom there are strong social ties. This severely limits opportunities to establish strong supply-chain linkages that transmit both technology, management best practice and trade credit. GUIDE 66 percent of firms in the sample are aware of the Guichet Unique des Investissements et Developpement des Entreprises, (GUIDE), hosted by the Ministry of Industry. This is a one-stop registration center, consolidating the services of the tax authority, immigration, company registry, various ministries with sectoral approval authority, procurement of land and EPZ registration. In particular, 80 percent of foreign-owned firms are aware of the GUIDE system. In order to evaluate the performance of GUIDE system we asked firms whether GUIDE had reduced the amount of time required to obtain visas/work permits or a land lease. Improvements in visa/work permit issue are more apparent than land lease acquisition. 23 percent of firms report that GUIDE had not changed the time required to obtain a visa while 45 percent report no change in time to acquire a land lease. Table 3.9 show that 74 percent of firms report that GUIDE reduced the time required for visas/work permits. Only 1.5 percent reports that this process became more difficult since GUIDE was established. 43 percent of firms report that GUIDE made it easier to obtain a land lease while 15.2 percent report the process being more difficult. Table 3.9: An Evaluation of GUIDE GUIDE made it…. Visa/Work Permit Land Lease Easier 73.9 43.1 More Difficult 1.5 6.3 No Change 24.6 50.6 Access to Land The moderate progress that GUIDE has been able to achieve in facilitating land access is extremely important. Traditionally, land ownership has been determined by ancestral ties
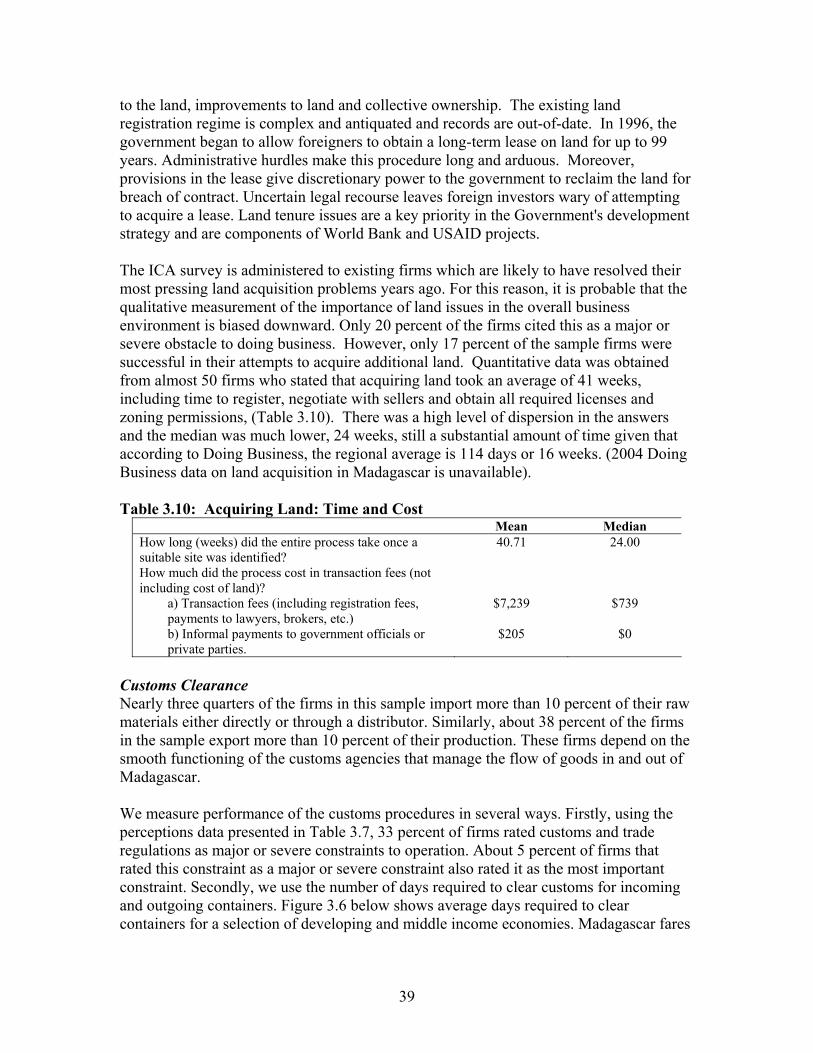
39
to the land, improvements to land and collective ownership. The existing land registration regime is complex and antiquated and records are out-of-date. In 1996, the government began to allow foreigners to obtain a long-term lease on land for up to 99 years. Administrative hurdles make this procedure long and arduous. Moreover, provisions in the lease give discretionary power to the government to reclaim the land for breach of contract. Uncertain legal recourse leaves foreign investors wary of attempting to acquire a lease. Land tenure issues are a key priority in the Government's development strategy and are components of World Bank and USAID projects. The ICA survey is administered to existing firms which are likely to have resolved their most pressing land acquisition problems years ago. For this reason, it is probable that the qualitative measurement of the importance of land issues in the overall business environment is biased downward. Only 20 percent of the firms cited this as a major or severe obstacle to doing business. However, only 17 percent of the sample firms were successful in their attempts to acquire additional land. Quantitative data was obtained from almost 50 firms who stated that acquiring land took an average of 41 weeks, including time to register, negotiate with sellers and obtain all required licenses and zoning permissions, (Table 3.10). There was a high level of dispersion in the answers and the median was much lower, 24 weeks, still a substantial amount of time given that according to Doing Business, the regional average is 114 days or 16 weeks. (2004 Doing Business data on land acquisition in Madagascar is unavailable). Table 3.10: Acquiring Land: Time and Cost
Mean Median How long (weeks) did the entire process take once a suitable site was identified?
40.71 24.00
How much did the process cost in transaction fees (not including cost of land)?
a) Transaction fees (including registration fees, payments to lawyers, brokers, etc.)
$7,239 $739
b) Informal payments to government officials or private parties.
$205 $0
Customs Clearance Nearly three quarters of the firms in this sample import more than 10 percent of their raw materials either directly or through a distributor. Similarly, about 38 percent of the firms in the sample export more than 10 percent of their production. These firms depend on the smooth functioning of the customs agencies that manage the flow of goods in and out of Madagascar. We measure performance of the customs procedures in several ways. Firstly, using the perceptions data presented in Table 3.7, 33 percent of firms rated customs and trade regulations as major or severe constraints to operation. About 5 percent of firms that rated this constraint as a major or severe constraint also rated it as the most important constraint. Secondly, we use the number of days required to clear customs for incoming and outgoing containers. Figure 3.6 below shows average days required to clear containers for a selection of developing and middle income economies. Madagascar fares

40
well with lower clearing times than South Africa. However, Malaysia, Mauritius, Indonesia and Lithuania have lower clearing times than Madagascar.
Figure 3.6: Customs Clearance
*Data for Mauritius are preliminary Finally, we examine firm perceptions of customs related services and port operation. Table 3.11 below shows the average percentage of firms reporting bad/very bad impressions. Overall, firms appear to be fairly happy with the quality of service provided by customs. Table below shows that less than 25 percent of sample firms find the various aspects of customs operations to be poor.
Average number of days to clear
0
2
4
6
8
10
12
14
16
Malaysia Mauritius Indonesia Lithuania Madagascar South Africa Senegal China Peru Kenya Brazil
Days
Imports Exports
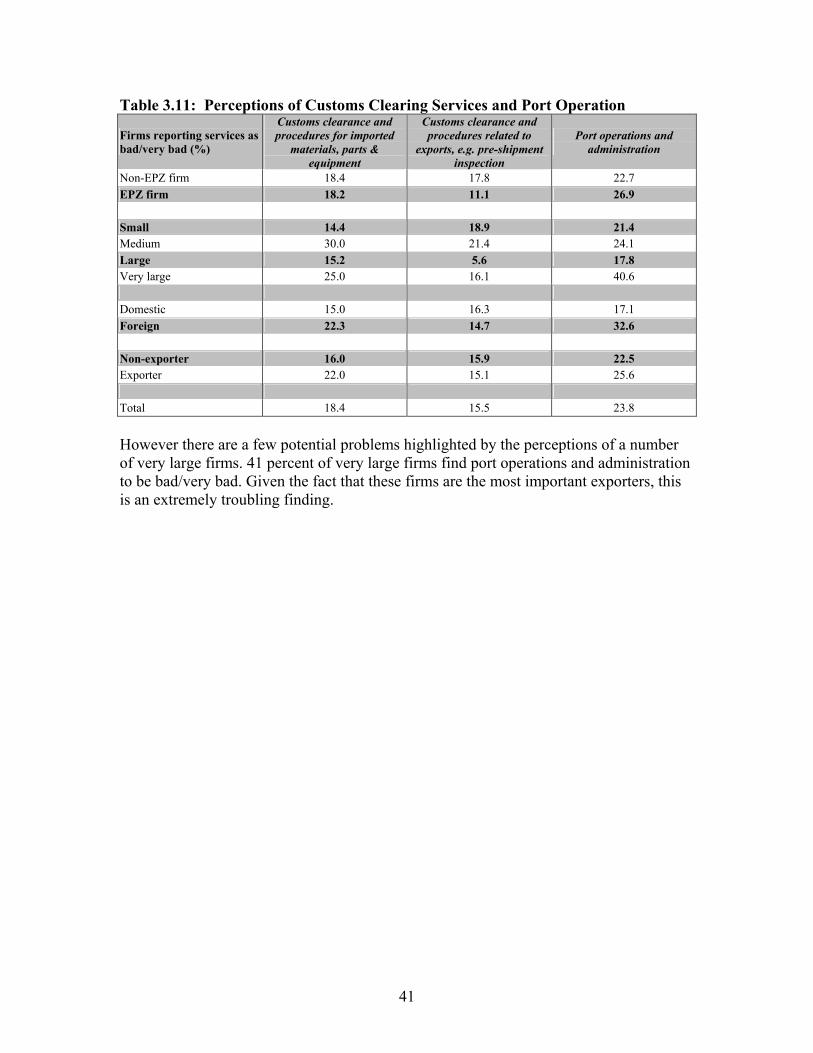
41
Table 3.11: Perceptions of Customs Clearing Services and Port Operation
Firms reporting services as bad/very bad (%)
Customs clearance and procedures for imported
materials, parts & equipment
Customs clearance and procedures related to
exports, e.g. pre-shipment inspection
Port operations and administration
Non-EPZ firm 18.4 17.8 22.7 EPZ firm 18.2 11.1 26.9 Small 14.4 18.9 21.4 Medium 30.0 21.4 24.1 Large 15.2 5.6 17.8 Very large 25.0 16.1 40.6 Domestic 15.0 16.3 17.1 Foreign 22.3 14.7 32.6 Non-exporter 16.0 15.9 22.5 Exporter 22.0 15.1 25.6 Total 18.4 15.5 23.8 However there are a few potential problems highlighted by the perceptions of a number of very large firms. 41 percent of very large firms find port operations and administration to be bad/very bad. Given the fact that these firms are the most important exporters, this is an extremely troubling finding.

42
Infrastructure Competitiveness in global markets requires high productivity on the factory floor which cannot be achieved without a minimum level of reliable and affordable complementary infrastructure services. We measure the quality of infrastructure services available to firms in two ways. Firstly, using perceptions data. Firms were asked to rate the quality of a variety of infrastructure services. Table 3.12 below shows the average percentage of firms reporting that a particular infrastructure service is poor or very poor. Electricity, waste disposal, security and railway services are the most frequently cited services whose quality or reliability falls well short of expected standards. 43 percent of firms report that electricity services are poor or very poor. There is substantial variation across firm categories: nearly 60 percent of very large firms report electricity services as poor. Similarly, 50 percent (compared to 39 percent) of foreign owned firms report electricity services to be of poor quality. 41 percent of all firms rate waste disposal services as poor/very poor. 48 percent of domestic firms and 45 percent of firms with EPZ status rate waste services as poor/very poor (compared to 31 percent and 24 percent respectively). More than half of very large firms rate security services as poor/very poor.
Table 3.12: Infrastructure Perceptions
EPZ Non-EPZ
Small Medium Large Very large
Domestic Foreign Non-exporter
Exporter Total
Electricity 48.21 42.19 41.32 33.33 44.44 58.82 38.89 50.44 42.21 45.74 43.34 Waste disposal 24.07 45.73 42.68 41.67 42.59 37.5 48.04 31.19 45.69 32.97 41.67 Security (police)
35.71 34.89 34.34 25 33.96 52.94 31.84 40.18 35.03 35.11 35.05
Railways 25 33.55 28.44 45.83 35.48 30.43 31.36 33.33 33.82 27.45 32.09 Roads 26.79 28.39 25.9 16.67 33.33 41.18 24.02 34.51 27.78 28.72 28.08 Postal service 27.27 23.91 25.47 17.14 26.42 26.47 22.03 28.7 21.03 32.22 24.56 Land telecoms 19.64 16.45 16.15 8.33 22.22 23.53 13.22 23.01 14.51 22.34 17.07 Internet 22.64 13.82 13.91 18.18 14 23.53 10.43 23.36 12.29 21.98 15.56 Water 25.45 12.29 13.25 5.56 13.21 35.29 11.24 20.35 11.11 22.58 14.78 Trucking services
18.18 13.1 13.84 8.57 16.67 17.65 10.98 18.92 11.46 19.57 14.08
Air freight services
9.09 4.84 4.03 9.09 7.84 6.06 4.29 7.92 3.95 8.99 5.81
Mobile telecoms 8.93 1.27 1.2 0 5.56 8.82 0.56 6.19 2.01 4.3 2.74
Just under one-third of sampled firms rate railway services as poor/very poor. Firm ratings of railway services are reasonably uniform across firm categories, ranging from 25-35.5 percent. 35 percent of very large firms find the water services poor while half of the same firms find road and security services to be poor. 14 percent of firms with EPZ-status find trucking services poor/very poor. Mobile telecoms are the least likely service to be rated as poor followed by air freight services. The second measure of infrastructure quality is derived from responses that firms gave with respect to objective measures of service quality. Firms were asked about the frequency and duration of power outages and the percentage of output lost as a result of

43
these outages. Further more, we asked firms to report if they were compensating for the poor quality of service by self-providing both electricity and water. Finally we asked how long it took for firms to obtain a new telephone or electricity connection. The results are shown in Table 3.13 below. The frequency of power outages is very high. The average firm experiences 78 power outages per year. The dispersion in this measure is also considerably high. The median frequency of outages is 30. However, even using the median suggests that a firm experiences at least one power outage every 12 days. The average duration of power outages is 5 hours (median is 1 hour). The lack of reliability of electricity services is reflected in the output lost due to power outages. On average, firms lose nearly 11 percent of sales as a result of poor electricity services. This is a very large efficiency loss. Given the frequency and the cost of poor electricity services, it is surprising that only 21.5 percent of all firms own a generator. Half of very large firms and two-fifths of firms with EPZ-status own a generator. Very large firms are four times more likely to own a generator than small firms. The low frequency of generator ownership suggests a potential impediment in the importation of generators. Self-provision of water is low, with only 17 percent of firms owning a well even though a quarter of the sample firms consider government services to be poor or very poor. As with the self-provision of electricity services, a higher proportion of firms with EPZ-status own their own well.
Table 3.13: Some Objective Measures of the Quality of Infrastructure Services Non-
EPZ EPZ Small Medium Large Very large Domestic Foreign Non-
exporter Export
er Total Total-median
Freq of power outages(times last yr) 66.54 123.79 64.31 76.96 94.98 125.19 63.33 102.41 64.25 105.99 77.99 30
% of production lost due to power outages 11.65 6.31 7.94 5.65 8.26 35.06 7.93 15.17 7.46 17.56 10.66 5
Have own generator (%) 17.72 37.5 13.17 19.44 29.63 52.94 18.89 25.66 18.09 28.72 21.5 0
Have own well (%) 15.61 25 14.97 19.44 22.22 20.59 17.22 17.7 15.08 22.34 17.41 0 % of production lost in shipment 1.91 1.55 2.09 1.29 1.41 2.29 1.91 1.71 1.85 1.77 1.81 0
No. of days to obtain a telephone connection 30 14 30 91 60 14 21 60 21 30 30 30
No. of days to obtain an electricity connection
52 39 46 53 63 41 43 57 52 45 49 30
Shipping services from factory gate to final customer are associated with considerable losses. On average, 1.8 percent of production is lost during shipment. Losses arise either from spoilage, breakage or theft. Finally, the median time required to obtain a new telephone and electricity connection is 30 and 90 days, respectively.

44
In order to assess the extent to which the quality of infrastructure affects the international competitiveness of Malagasy firms, it is necessary to compare these objective measures against a selection of potential competitors. Table 3.14 includes average infrastructure measures for Uganda, Zambia, Mauritius and China. Table 3.14: Infrastructure Quality—Cross-Country Comparisons
Uganda Zambia Madagascar Mauritius China
Freq of power outages(times last yr) 38.6 37.2 77.99 5.3 na % of production lost due to power outages 6.3 4.5 10.66 2.5 1.8 Have own generator (%) 35.3 38.2 21.5 42.6 17 Have own well (%) 13 59.9 17.41 33.3 21.1 % of production lost in shipment na 3.8 1.81 0.8 1.2 No. of days to obtain a telephone connection 33.2 132.5 30 9 12.5 No. of days to obtain an electricity connection 38.3 120.7 49 2 18.2
Compared to all the other countries, Malagasy firms face the most unreliable electricity service regime. Both Uganda and Zambia, which are at a similar level of development, experience a frequency of power outages that is nearly half as large as that experienced in Madagascar. It is not surprising that the production lost as a result of power outages is highest in Madagascar. Self-provision of electricity in the other countries explains to some degree why output losses there are lower. Generator ownership in Uganda is at 35 percent and 38 percent in Zambia is nearly twice as high as in Madagascar. Firms in Mauritius experience an average of 5.3 power outages a year. This is nearly 15 times lower than the frequency observed in Madagascar. Shipping services are associated with a loss of only 1.2 percent of output in China and 0.8 percent in Mauritius. Shipping losses in Madagascar are nearly two and a half times as high as those in Mauritius. Shipment losses in Zambia are higher but this is likely due to the fact that Zambia has no direct access to the sea. Firms in Madagascar report median fixed phone-line connection times of 30 days. This is comparable to Uganda, less than Zambia but considerably longer than China and Mauritius. Connections to the electric grid take much longer with median waiting times of 2.5 months. Overall, we can conclude that the international competitiveness of manufacturing firms in Madagascar is likely to be adversely affected by the quality of infrastructure. Table 3.15: International Haulage Services % Reporting service as bad/very bad
Non-EPZ firm
EPZ firm Small Medium Large Very large Non-exporter
Exporter Total
International airport and air services 8.6 5.9 7.6 8 7.5 9.7 7.5 8.3 7.9
International maritime shipping services (excluding air)
15.5 8.2 14.4 16 6.8 19.4 14.9 11.7 13.6
Telecommunication links with foreign suppliers and customers
2.4 2.4 2.5 2.3 2.4 2.4 2.4 2.4 2.4
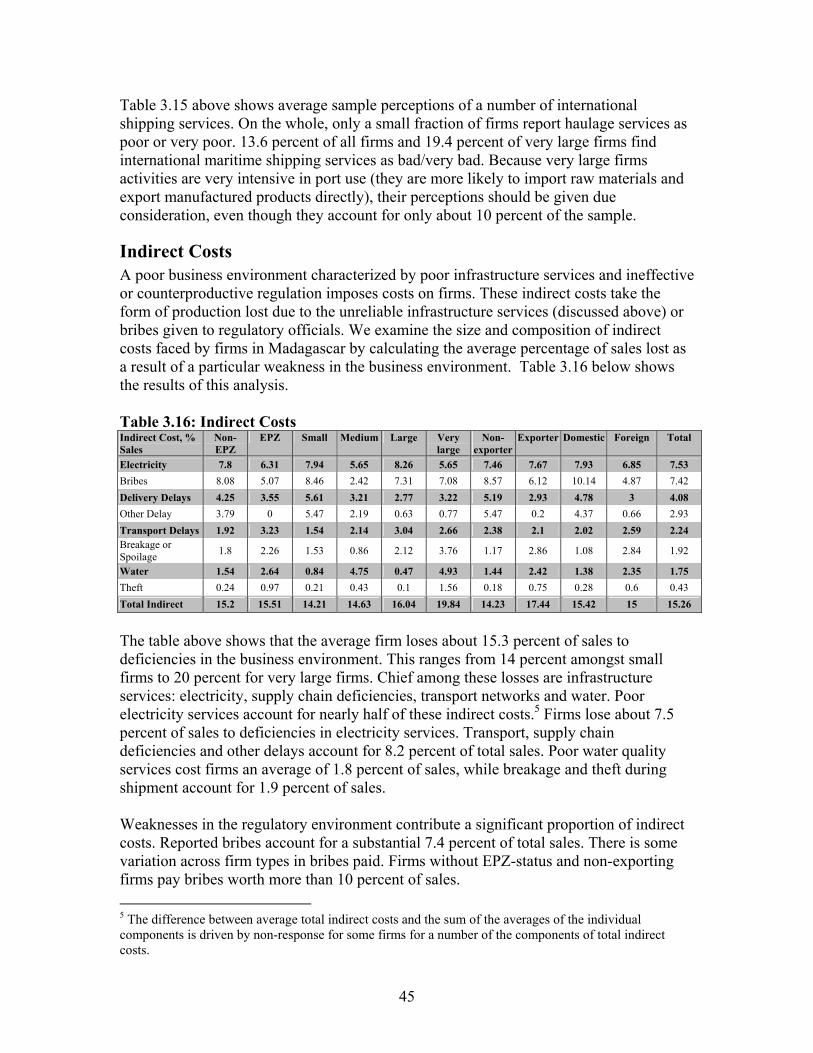
45
Table 3.15 above shows average sample perceptions of a number of international shipping services. On the whole, only a small fraction of firms report haulage services as poor or very poor. 13.6 percent of all firms and 19.4 percent of very large firms find international maritime shipping services as bad/very bad. Because very large firms activities are very intensive in port use (they are more likely to import raw materials and export manufactured products directly), their perceptions should be given due consideration, even though they account for only about 10 percent of the sample.
Indirect Costs A poor business environment characterized by poor infrastructure services and ineffective or counterproductive regulation imposes costs on firms. These indirect costs take the form of production lost due to the unreliable infrastructure services (discussed above) or bribes given to regulatory officials. We examine the size and composition of indirect costs faced by firms in Madagascar by calculating the average percentage of sales lost as a result of a particular weakness in the business environment. Table 3.16 below shows the results of this analysis. Table 3.16: Indirect Costs Indirect Cost, % Sales
Non-EPZ
EPZ Small Medium Large Very large
Non-exporter
Exporter Domestic Foreign Total
Electricity 7.8 6.31 7.94 5.65 8.26 5.65 7.46 7.67 7.93 6.85 7.53 Bribes 8.08 5.07 8.46 2.42 7.31 7.08 8.57 6.12 10.14 4.87 7.42 Delivery Delays 4.25 3.55 5.61 3.21 2.77 3.22 5.19 2.93 4.78 3 4.08 Other Delay 3.79 0 5.47 2.19 0.63 0.77 5.47 0.2 4.37 0.66 2.93 Transport Delays 1.92 3.23 1.54 2.14 3.04 2.66 2.38 2.1 2.02 2.59 2.24 Breakage or Spoilage 1.8 2.26 1.53 0.86 2.12 3.76 1.17 2.86 1.08 2.84 1.92
Water 1.54 2.64 0.84 4.75 0.47 4.93 1.44 2.42 1.38 2.35 1.75 Theft 0.24 0.97 0.21 0.43 0.1 1.56 0.18 0.75 0.28 0.6 0.43 Total Indirect 15.2 15.51 14.21 14.63 16.04 19.84 14.23 17.44 15.42 15 15.26
The table above shows that the average firm loses about 15.3 percent of sales to deficiencies in the business environment. This ranges from 14 percent amongst small firms to 20 percent for very large firms. Chief among these losses are infrastructure services: electricity, supply chain deficiencies, transport networks and water. Poor electricity services account for nearly half of these indirect costs.5 Firms lose about 7.5 percent of sales to deficiencies in electricity services. Transport, supply chain deficiencies and other delays account for 8.2 percent of total sales. Poor water quality services cost firms an average of 1.8 percent of sales, while breakage and theft during shipment account for 1.9 percent of sales. Weaknesses in the regulatory environment contribute a significant proportion of indirect costs. Reported bribes account for a substantial 7.4 percent of total sales. There is some variation across firm types in bribes paid. Firms without EPZ-status and non-exporting firms pay bribes worth more than 10 percent of sales. 5 The difference between average total indirect costs and the sum of the averages of the individual components is driven by non-response for some firms for a number of the components of total indirect costs.

46
A comparison of indirect costs between firms with EPZ-status and firms without EPZ-status in Figure 3.7 below suggests that for both firm types, electricity is the largest contributor to indirect costs. Bribes account for a larger share of indirect costs for non-EPZ firms, while poor water service quality contributes about the same proportion. Transport delays are more important for EPZ firms, while delivery delays (supply chain deficiencies) are more important for non-EPZ firms. Figure 3.7: Indirect Costs by EPZ Status
Shipment SpoilageShipment Theft
Delivery delay
Transport delay
Other delay
WaterElectricity
Bribes Shipment Spoilage
Shipment Theft
Delivery delay
Transport delay
Water
Electricity
Bribes
Non-EPZ firm EPZ firm
Graphs by Firm in EPZ
An examination of indirect costs across a set of potential competitor countries is revealing. Average indirect costs as a share of sales range between 15 percent and 31 percent for the African countries, (Table 3.17). To the extent that indirect costs reflect the quantifiable burden of an imperfect investment climate, then the relative size of the ‘stars’ in the star diagram (Figure 3.1) are misleading. The numbers below show that indirect costs associated with the investment climate in Madagascar are lower than corresponding costs in East and Southern Africa and about the same as Morocco. However, relative to China, India or Mauritius, indirect costs in Madagascar are considerably higher. The overall share of indirect costs in China is equivalent to a little over the losses associated with power outages in Madagascar. The levels of indirect costs
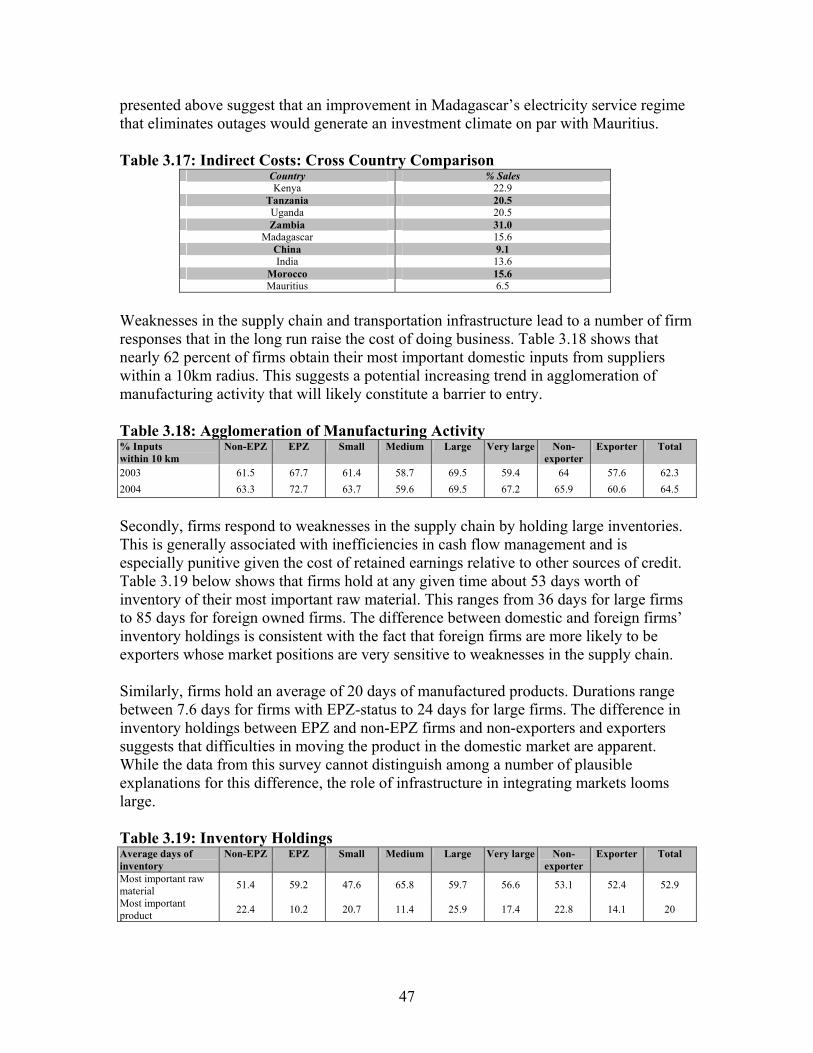
47
presented above suggest that an improvement in Madagascar’s electricity service regime that eliminates outages would generate an investment climate on par with Mauritius. Table 3.17: Indirect Costs: Cross Country Comparison
Country % Sales Kenya 22.9
Tanzania 20.5 Uganda 20.5 Zambia 31.0
Madagascar 15.6 China 9.1 India 13.6
Morocco 15.6 Mauritius 6.5
Weaknesses in the supply chain and transportation infrastructure lead to a number of firm responses that in the long run raise the cost of doing business. Table 3.18 shows that nearly 62 percent of firms obtain their most important domestic inputs from suppliers within a 10km radius. This suggests a potential increasing trend in agglomeration of manufacturing activity that will likely constitute a barrier to entry. Table 3.18: Agglomeration of Manufacturing Activity % Inputs within 10 km
Non-EPZ EPZ Small Medium Large Very large Non-exporter
Exporter Total
2003 61.5 67.7 61.4 58.7 69.5 59.4 64 57.6 62.3 2004 63.3 72.7 63.7 59.6 69.5 67.2 65.9 60.6 64.5
Secondly, firms respond to weaknesses in the supply chain by holding large inventories. This is generally associated with inefficiencies in cash flow management and is especially punitive given the cost of retained earnings relative to other sources of credit. Table 3.19 below shows that firms hold at any given time about 53 days worth of inventory of their most important raw material. This ranges from 36 days for large firms to 85 days for foreign owned firms. The difference between domestic and foreign firms’ inventory holdings is consistent with the fact that foreign firms are more likely to be exporters whose market positions are very sensitive to weaknesses in the supply chain. Similarly, firms hold an average of 20 days of manufactured products. Durations range between 7.6 days for firms with EPZ-status to 24 days for large firms. The difference in inventory holdings between EPZ and non-EPZ firms and non-exporters and exporters suggests that difficulties in moving the product in the domestic market are apparent. While the data from this survey cannot distinguish among a number of plausible explanations for this difference, the role of infrastructure in integrating markets looms large. Table 3.19: Inventory Holdings Average days of inventory
Non-EPZ EPZ Small Medium Large Very large Non-exporter
Exporter Total
Most important raw material 51.4 59.2 47.6 65.8 59.7 56.6 53.1 52.4 52.9
Most important product 22.4 10.2 20.7 11.4 25.9 17.4 22.8 14.1 20

48
4. Factor Markets: The Financial Market and the Labor Market
The Finance Sector Access to credit is crucial to the smooth operation and growth of manufacturing firms. There are three primary sources of formal credit available to manufacturing firms in Madagascar; loans and credit lines from the banking sector and credit extended by suppliers. As discussed in Chapter 3, the cost of and access to financing are ranked in the upper quintile of the most frequently-cited constraints to the operation of firms. This suggests both that formal sources of credit are very difficult to obtain and very costly when firms can obtain financing. Figure 4.1 shows that about 34 percent of Malagasy firms have access to a line of credit and just less than 20 percent have access to a loan. However, 57 percent of firms purchase inputs on credit suggesting a wider availability of this form of credit. The figure below shows a strong pattern of access to loans and firm size with just over 10 percent of small firms with access to a loan compared to about 40 percent for very large firms. This likely reflects a variety of factors associated with eligibility for loans: access to collateral and good accounting records. There is no obvious pattern between access to credit lines and firm size, ownership or export status. Figure 4.1 suggests that the demand for trade credit is negatively associated with having a loan. While this negative correlation does imply levels of substitution between the trade credit and long-term credit, it is likely to reflect that firms with greater access to formal credit are more likely to be net suppliers trade credit. Figure 4.1: Access to Credit
Access to Credit
0
10
20
30
40
50
60
70
Non-EPZfirm
EPZ firm Small Medium Large Very large Domesticallyown
Foreignowned
Non-exporter
Exporter Total
%
% inputs purchased on credit % with overdrafts % with loans

49
Figure 4.2: Access to Credit—Cross-country comparison
In order to outline the policy changes that are required in the credit markets, it is important to compare access to credit in a number of comparator countries. Overall, access to formal credit in Madagascar is similar to levels observed in Uganda and Tanzania. The fraction of firms with access to loans is about the same in these countries. On the contrary, the share of firms with access to a credit line/overdraft facility is considerably higher in Madagascar than in Uganda and Tanzania. While Madagascar compares favorably with its competitors in access to short-term financing, access to longer term financing is considerably poor. Access to credit lines and loans in Kenya is twice as high as in Madagascar while 50 percent more firms use trade credit in Kenya. A comparison with Mauritius shows a gaping financing advantage for Mauritian firms. Nearly 90 percent of Mauritian firms have access to a credit line and more than half have access to a loan. Similarly, access to loans is more than twice as high in China
We examine the sources of financing for two important metrics of firm performance; working capital requirements and new investment needs. Table 4.1 below shows the sources of finance for a number of comparator countries. Manufacturing firms finance 76 percent of working capital with internally generated cash. This is considerably higher than countries such as Kenya, Mauritius, China or India where access to bank finance is more widespread. Trade credit finances about 6 percent of working capital requirements. While this is a shade higher than most of the comparator countries, it is considerably lower than Kenya.
Access to Credit
0.0%
10.0%
20.0%
30.0%
40.0%
50.0%
60.0%
70.0%
80.0%
90.0%
100.0%
Kenya Tanzania Uganda China Mauritius Madagascar
Share that purchase input on credit Share with overdraft or line of credit Share with a loan from a bank or financial institution

50
Table 4.1: Sources of Finance Share of Working Capital from:
Kenya Tanzania Uganda Mauritius China India Madagascar
Retained earnings 47.7% 74.0% 80.0% 62% 51.5% 30.4% 76% Banks 28.7% 13.8% 5.7% 31% 20.6% 36.1% 10% Trade credit 16.7% 5.6% 5.3% 2% 4.1% 6% Equity 1.2% 3.0% 1.8% 2% 0.1% 13.0% 2% Informal sources 1.2% 2.6% 0.4% 0% 8.6% 0% Other 4.4% 1.0% 2.7% 3% 6.3% 20.5% 6% Share of New Investment from
Retained earnings 52.7% 68.0% 71.1% 56.0% -- -- 76% Banks 36.6% 17.4% 11.6% 28.0% -- -- 11.9% Trade credit 4.0% 2.0% 0.5% 0.0% -- -- 2% Equity 0.3% 4.8% 2.0% 0.0% -- -- 2.00% Informal sources 1.5% 3.7% 1.5% 0.0% -- -- 0.05% Other 8.5% 4.2% 4.5% 16% -- -- 7%
The picture for new investment finance is a little bleaker. 76 percent of new investments are financed from retained earnings. Firms in Kenya fund just over half of their investments using internal resources. Similarly, Uganda and Tanzania, where the banking sector is less developed, internal resources fund about 70 percent of new investment. Long-term finance from banks accounts for only 12 percent of new investment. This is the lowest level of financing among the comparator countries. Banks finance 37 percent of new investments in Kenya, 28 percent in Mauritius, 17 percent in Tanzania and 12 percent in Uganda. Trade credit funds only 2 percent of new investments. The heavy reliance on retained earnings is a severe handicap given the cash flow problems associated with high inventory holdings (see Chapter 3). With the aim of understanding where improvements in the banking sector can be made, we explore below some the characteristics of the long-term financing available to manufacturing firms in Madagascar. In particular, we examine collateral requirements, cost of financing and the association between the ability of firms to present verifiable information/records. About 63 percent of the loans in the sample require collateral. This is lower than collateral requirements in the set of comparator countries including China. However, an examination of the value of collateral as a proportion of the loan reveals that on average firms must be able to post collateral levels equivalent to 137 percent loan values. Collateral requirements in China, Mauritius, Uganda and Tanzania are considerably lower. Buildings constitute about 37 percent of collateral while machinery and equipment account for 39 percent. Land does not constitute an important proportion of collateral. This is plausibly a result of the absence of clarity in land property rights discussed in Chapter 3.

51
Figure 4.3: Collateral Requirements
Cost of Borrowing Figure 4.4 below shows the average cost of bank finance broken down by export status and firm size categories. The average interest rate for credit line facilities is 13.8 percent and 14.5 percent for loans. On average it does not appear that loan prices are pegged to a highly variable economy-wide aggregate. The difference between initial costs and current loan costs is less than 20 basis points. On the whole, exporting firms pay lower interest rates than non-exporters. While this is consistent with the fact that exporting firms are higher quality, it could also be due to the fact that a good number of foreign firms have access to cheaper sources of bank finance outside Madagascar. However, only about 15 percent of firms with bank loans have foreign denominated debt. Surprisingly there is no obvious association between the price of short-term bank debt and firm size. One reason for this is that the predominant form of collateral for short-term debt is inventories or the firms’ cash holdings in the bank. There is, however, a relationship between the price of loans and size for non-exporting firms. Small firms pay nearly 2 percent per MGF borrowed more than large firms. The price differential probably reflects the risk premium associated with lending to small firms with low value (or uncertain) fixed assets. Small exporting firms pay more than large or very large exporting firms.
Collateral Requirement
0%
20%
40%
60%
80%
100%
120%
140%
160%
180%
200%
Kenya Tanzania Uganda Mauritius China Madagascar
Share of loans that required collateral Average value of collateral required (as % of loan)

52
Figure 4.4: Cost of Bank Finance
05
1015
20In
tere
st ra
te
Non-exporter Exporter
MicroSmall
MediumLarge
Very largeMicro
SmallMedium
LargeVery large
Cost of bank debt
Overdrafts Loan, currentLoan, initial
The Role of Information Banks typically lend long-term when they have sufficient information about the quality of the borrower’s proposition and the borrower’s repayment reliability. Both these pieces of information are particularly important in an environment where the enforcement of property rights is weak. In the absence of high value fixed assets, firms can borrow against reliable information. It is therefore important that firms be able to keep credible information that can be evaluated by banks. In order to achieve this, firms need to keep regular separate accounts and importantly need to have their accounts audited by external agencies. We examine the extent to which access to finance is associated with the capacity of firms to produce hard information. In the figures below we graph access to finance across two measures of information production:
• firms that produce annual budgets • firms that have their accounts audited by external agencies
45 percent of firms have their accounts audited by an external agency while 80 percent of firms keep annual budgets. Figure 4.5 shows the percentage of firms with access to credit by whether the firm’s accounts are audited by and external agency. There is no discernible pattern that would suggest that externally-audited accounts result in greater access to credit.

53
Figure 4.5: The Role of Information—External Audits
020
4060
Perc
ent
No Audit External Audit
MicroSmall
MediumLarge
Very largeMicro
SmallMedium
LargeVery large
% of firms with access to bank finance
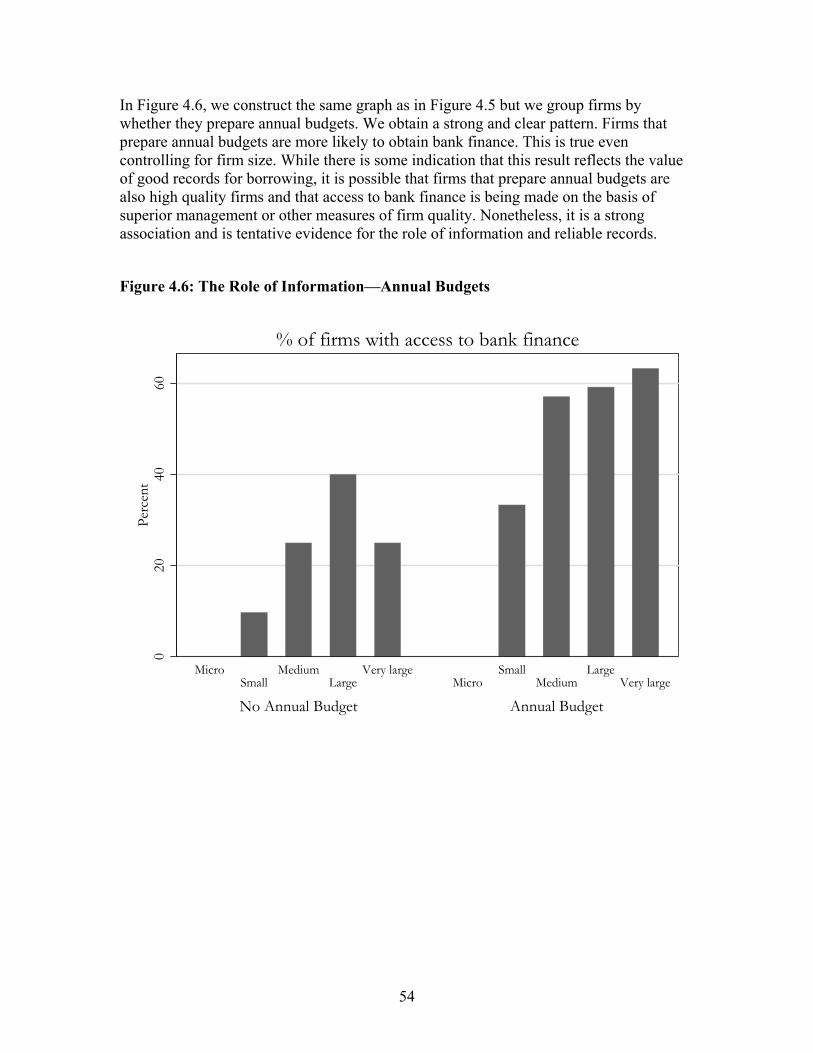
54
In Figure 4.6, we construct the same graph as in Figure 4.5 but we group firms by whether they prepare annual budgets. We obtain a strong and clear pattern. Firms that prepare annual budgets are more likely to obtain bank finance. This is true even controlling for firm size. While there is some indication that this result reflects the value of good records for borrowing, it is possible that firms that prepare annual budgets are also high quality firms and that access to bank finance is being made on the basis of superior management or other measures of firm quality. Nonetheless, it is a strong association and is tentative evidence for the role of information and reliable records.
Figure 4.6: The Role of Information—Annual Budgets
020
4060
Perc
ent
No Annual Budget Annual Budget
MicroSmall
MediumLarge
Very largeMicro
SmallMedium
LargeVery large
% of firms with access to bank finance
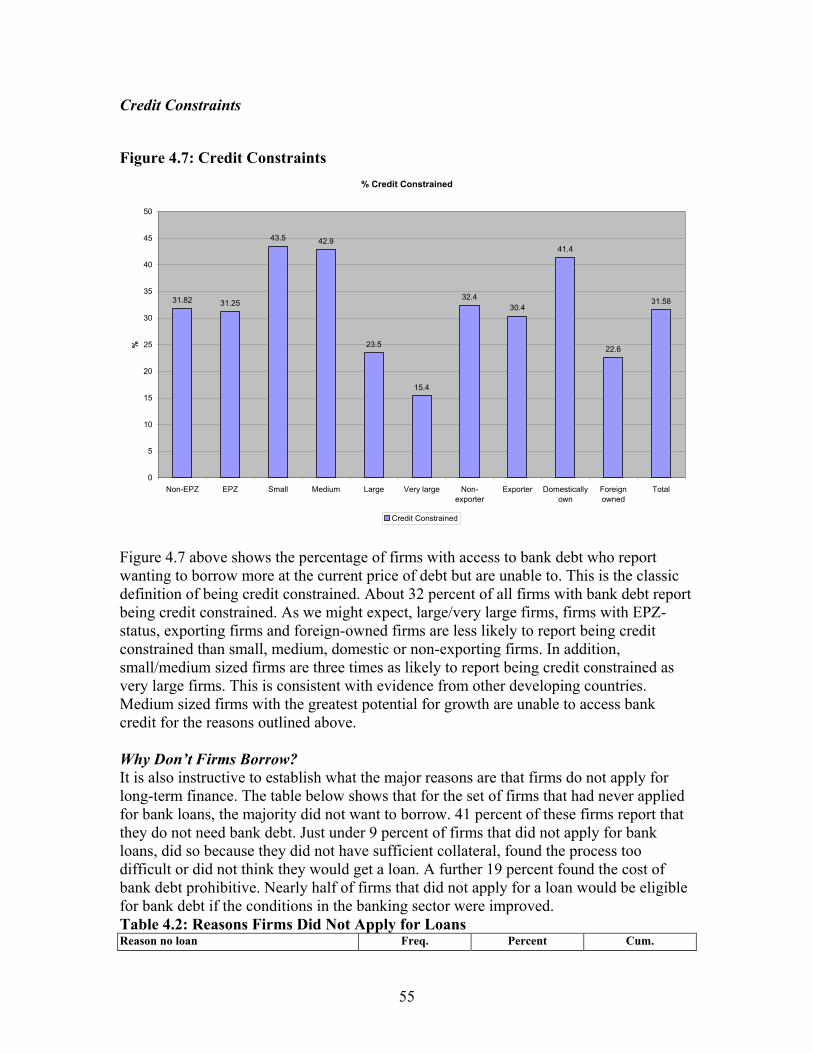
55
Credit Constraints
Figure 4.7: Credit Constraints
Figure 4.7 above shows the percentage of firms with access to bank debt who report wanting to borrow more at the current price of debt but are unable to. This is the classic definition of being credit constrained. About 32 percent of all firms with bank debt report being credit constrained. As we might expect, large/very large firms, firms with EPZ-status, exporting firms and foreign-owned firms are less likely to report being credit constrained than small, medium, domestic or non-exporting firms. In addition, small/medium sized firms are three times as likely to report being credit constrained as very large firms. This is consistent with evidence from other developing countries. Medium sized firms with the greatest potential for growth are unable to access bank credit for the reasons outlined above. Why Don’t Firms Borrow? It is also instructive to establish what the major reasons are that firms do not apply for long-term finance. The table below shows that for the set of firms that had never applied for bank loans, the majority did not want to borrow. 41 percent of these firms report that they do not need bank debt. Just under 9 percent of firms that did not apply for bank loans, did so because they did not have sufficient collateral, found the process too difficult or did not think they would get a loan. A further 19 percent found the cost of bank debt prohibitive. Nearly half of firms that did not apply for a loan would be eligible for bank debt if the conditions in the banking sector were improved. Table 4.2: Reasons Firms Did Not Apply for Loans Reason no loan Freq. Percent Cum.
% Credit Constrained
31.82 31.25
43.5 42.9
23.5
15.4
32.430.4
41.4
22.6
31.58
0
5
10
15
20
25
30
35
40
45
50
Non-EPZ EPZ Small Medium Large Very large Non-exporter
Exporter Domesticallyown
Foreignowned
Total
%
Credit Constrained

56
Inadequate collateral 16.0 8.7 8.7 Did want debt 75.0 41.0 49.7 Process too difficult 27.0 14.8 64.5 Didn't think I’d get one 3.0 1.6 66.1 Interest rate too high 35.0 19.1 85.3 Too much debt 3.0 1.6 86.9 Corruption 2.0 1.1 88.0 Other 22.0 12.0 100.0
Other Reasons for Low Levels of Bank Debt Figure 4.8 below shows total credit extended by commercial banks, credit to the private sector and the real interest rate. While total credit shows a slight upward trend from 2000 onwards, credit to the private sector has been flat at about 10 percent of GDP. This is considerably lower than other countries with comparable levels of development. Figure 4.8: Credit to Private Sector, Real Costs of Borrowing
Figure 4.8 also shows high real costs of borrowing. This affects the selection of projects that can be funded with bank finance. In particular, only those projects with very high returns will apply for bank debt. The second group of reasons for low bank financing is shown in Figure 4.9 below. The spread between borrowing and lending rates has ranged between 10 and 15 percent in the last 5 years. A plausible explanation for this spread is that there isn’t sufficient competition in the banking sector to bring lending rates closer to borrowing rates.
Banking Sector Activities
-10
-5
0
5
10
15
20
25
30
35
1990 1991 1992 1993 1994 1995 1996 1997 1998 1999 2000 2001 2002
Year
% G
DP
Total Credit Credit to Private Sector Real Interest Rate
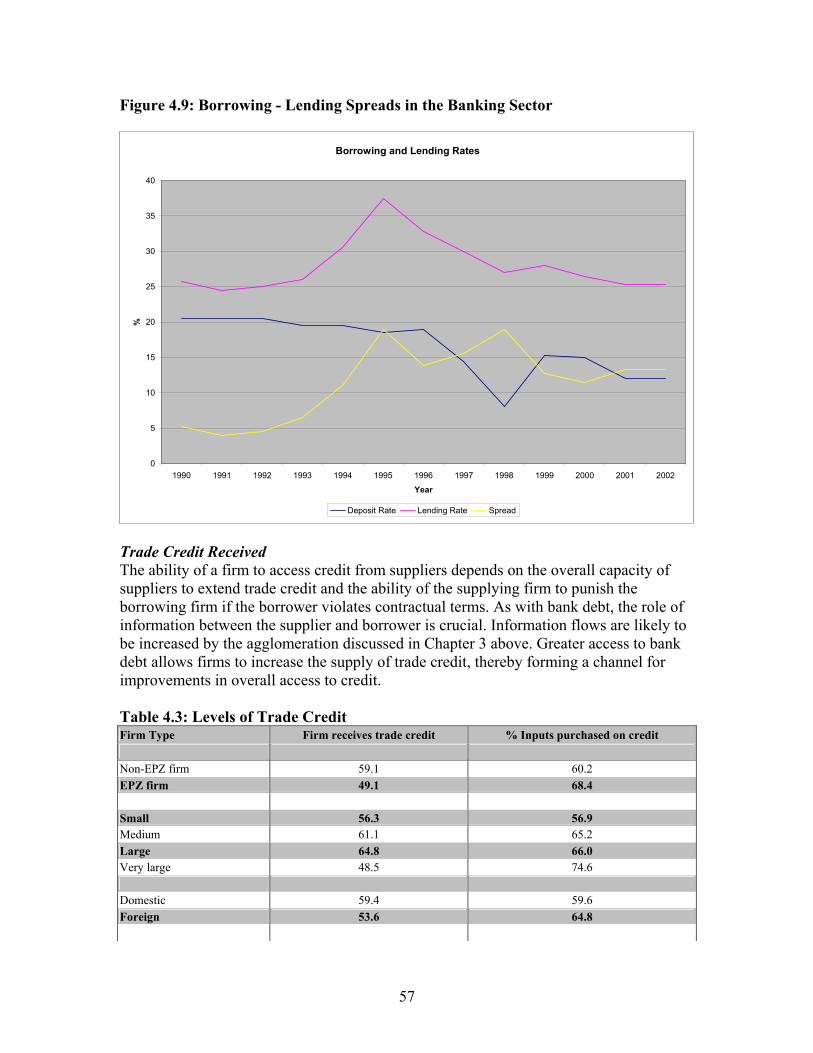
57
Figure 4.9: Borrowing - Lending Spreads in the Banking Sector
Trade Credit Received The ability of a firm to access credit from suppliers depends on the overall capacity of suppliers to extend trade credit and the ability of the supplying firm to punish the borrowing firm if the borrower violates contractual terms. As with bank debt, the role of information between the supplier and borrower is crucial. Information flows are likely to be increased by the agglomeration discussed in Chapter 3 above. Greater access to bank debt allows firms to increase the supply of trade credit, thereby forming a channel for improvements in overall access to credit. Table 4.3: Levels of Trade Credit Firm Type Firm receives trade credit % Inputs purchased on credit Non-EPZ firm 59.1 60.2 EPZ firm 49.1 68.4 Small 56.3 56.9 Medium 61.1 65.2 Large 64.8 66.0 Very large 48.5 74.6 Domestic 59.4 59.6 Foreign 53.6 64.8
Borrowing and Lending Rates
0
5
10
15
20
25
30
35
40
1990 1991 1992 1993 1994 1995 1996 1997 1998 1999 2000 2001 2002
Year
%
Deposit Rate Lending Rate Spread
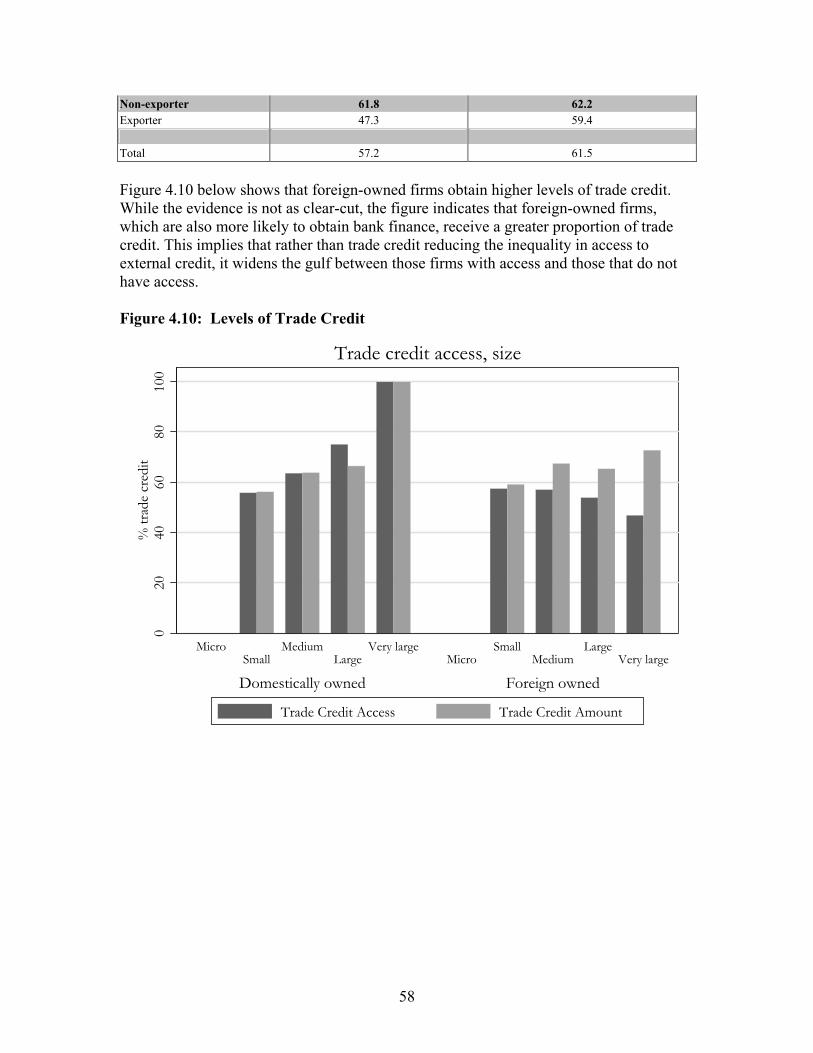
58
Non-exporter 61.8 62.2 Exporter 47.3 59.4 Total 57.2 61.5 Figure 4.10 below shows that foreign-owned firms obtain higher levels of trade credit. While the evidence is not as clear-cut, the figure indicates that foreign-owned firms, which are also more likely to obtain bank finance, receive a greater proportion of trade credit. This implies that rather than trade credit reducing the inequality in access to external credit, it widens the gulf between those firms with access and those that do not have access. Figure 4.10: Levels of Trade Credit
020
4060
8010
0%
trad
e cr
edit
Domestically owned Foreign owned
MicroSmall
MediumLarge
Very largeMicro
SmallMedium
LargeVery large
Trade credit access, size
Trade Credit Access Trade Credit Amount

59
The Labor Market Employment Growth and Worker Characteristics in Madagascar This section examines patterns of employment growth in Madagascar and the characteristics of the labor market. After the political upheaval in early 2002, Madagascar’s new government launched an aggressive pro-reform strategy to promote export-oriented industrial growth. Identifying the garments sector as one of the “gateway” industries for industrial expansion, the Government sought to revitalize the EPZ segment by continuing to improve the regulatory environment and tax incentives for this sector. Also, in 2001, Madagascar began to enjoy preferential access to the US market under AGOA. The right set of labor market conditions, government policies and political environment proved conducive to attracting FDI into this sector. Several firms moved to Madagascar and the number of EPZ firms and employment in this sector grew rapidly. By 2004, most manufacturing job growth was concentrated in a single sector - garments - produced by firms with EPZ status around Antananarivo and Antsirabe. However, with the lapse of the MFA and concomitant abolition of quotas in January 2005, there was a fear that these footloose garment firms would simply shut down or relocate due to increasing competition from China and elsewhere. Has that happened? Have firms grown or declined between 2002 and present? We examine this issue by looking at employment patterns of firms that existed in both periods. Since we do not have information on firm exits, these numbers may have an upward bias, though that will be partly offset by entry of new firms into the sector.6 Also, if changes in macroeconomic conditions were to have a significant negative impact on firms, we would expect to see downsizing in existing firms, rather than growth. These patterns are examined below. The survey methodology was designed so that each worker had an equal probability of being selected, rather than each firm. This provides us a sample that is representative of manufacturing employment distribution in the population. Table 4.4 describes the sample characteristics. We have 242 enterprises that existed before 2002 and provided employment figures for both periods. Of these, only 41 had EPZ status. However, when we look at total employment in our sample, we see that most manufacturing jobs (67 percent) are located within EPZs, compared to 33 percent in non-EPZ firms. Most jobs are located in large enterprises. While 75 percent of firms can be classified as SMEs (small and medium enterprises with less than 100 workers), they provide only 14 percent of manufacturing employment.
6 Some EPZ firms did close this year. On February 7, 2005, Les Nouvelles headlines described the loss of 6000 EPZ jobs since the beginning of the year; another article highlighted the loss of another 4000 jobs within EPZs on March 3, 2005.
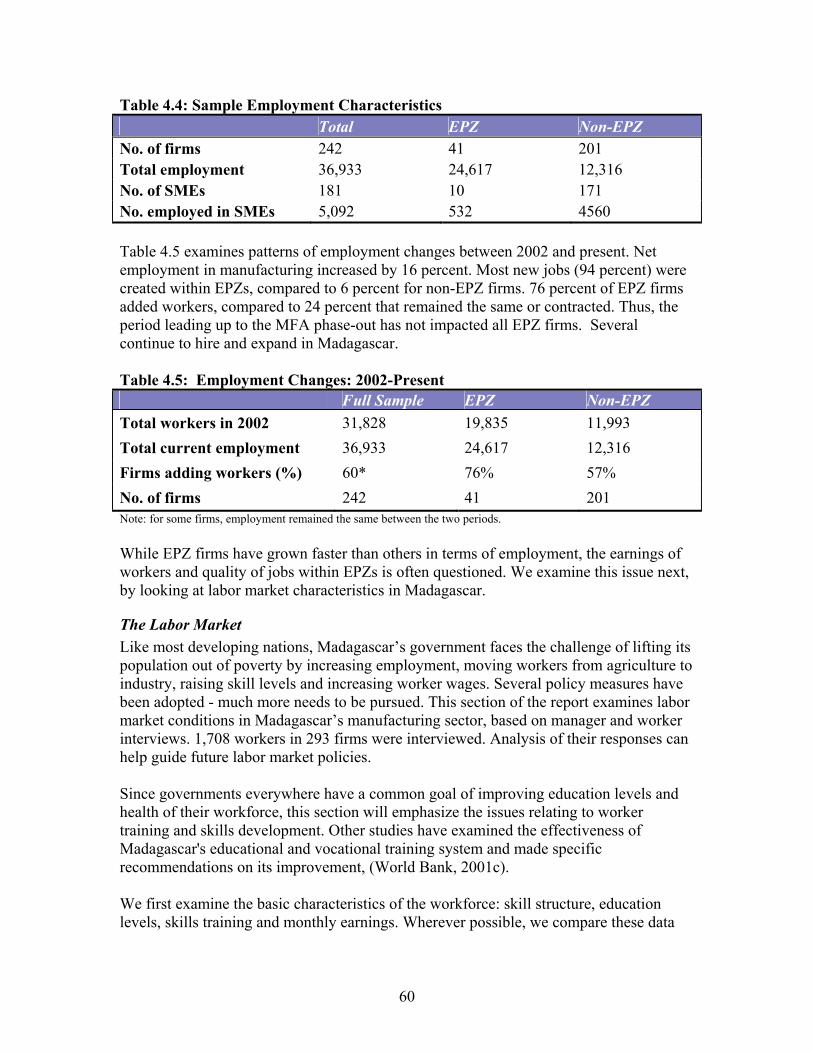
60
Table 4.4: Sample Employment Characteristics Total EPZ Non-EPZ No. of firms 242 41 201 Total employment 36,933 24,617 12,316 No. of SMEs 181 10 171 No. employed in SMEs 5,092 532 4560 Table 4.5 examines patterns of employment changes between 2002 and present. Net employment in manufacturing increased by 16 percent. Most new jobs (94 percent) were created within EPZs, compared to 6 percent for non-EPZ firms. 76 percent of EPZ firms added workers, compared to 24 percent that remained the same or contracted. Thus, the period leading up to the MFA phase-out has not impacted all EPZ firms. Several continue to hire and expand in Madagascar. Table 4.5: Employment Changes: 2002-Present Full Sample EPZ Non-EPZ Total workers in 2002 31,828 19,835 11,993 Total current employment 36,933 24,617 12,316 Firms adding workers (%) 60* 76% 57% No. of firms 242 41 201 Note: for some firms, employment remained the same between the two periods. While EPZ firms have grown faster than others in terms of employment, the earnings of workers and quality of jobs within EPZs is often questioned. We examine this issue next, by looking at labor market characteristics in Madagascar.
The Labor Market Like most developing nations, Madagascar’s government faces the challenge of lifting its population out of poverty by increasing employment, moving workers from agriculture to industry, raising skill levels and increasing worker wages. Several policy measures have been adopted - much more needs to be pursued. This section of the report examines labor market conditions in Madagascar’s manufacturing sector, based on manager and worker interviews. 1,708 workers in 293 firms were interviewed. Analysis of their responses can help guide future labor market policies. Since governments everywhere have a common goal of improving education levels and health of their workforce, this section will emphasize the issues relating to worker training and skills development. Other studies have examined the effectiveness of Madagascar's educational and vocational training system and made specific recommendations on its improvement, (World Bank, 2001c). We first examine the basic characteristics of the workforce: skill structure, education levels, skills training and monthly earnings. Wherever possible, we compare these data

61
with worker data from other countries. Thereafter, we use an econometric approach to examine the determinants of wages in Madagascar. The skill structure of labor in manufacturing firms in Madagascar is shown in Table 4.6 below, based on management responses. The modal worker has between 6 and 9 years of schooling, while a little less than 10 percent of workers have university education and 8.8 percent have less than 5 years of schooling. Women account for 37 percent of total labor force and more than half of professional and non-production workers groups. Representation of women in management and skilled production worker groups is only about 25 percent. Table 4.6: Skill Composition of Labor in the Manufacturing Sector Education Structure % with Type of Labor % females Less than primary/none 8.8 Management 39.0 Primary (5 years) 30.0 Professionals 41.0 Secondary (6-9 years) 34.5 Skilled Production workers 26.7 Lycée (10-12 years) 18.8 Unskilled production workers 33.2 University (> 12 years) 8.9 Non-production workers 49.7 Total 37.0 Examining the educational distribution of the workforce with other countries in sub-Saharan Africa, educational levels in Madagascar are comparable with workers in Senegal and Benin at the primary level, (Figure 4.11). Countries like Uganda, Kenya and Nigeria have much fewer workers with only primary education. Madagascar has the lowest percentage of workers with university education, 8.9 percent, compared to 20 percent in Senegal, 20 percent in Nigeria and almost 15 percent in Uganda.
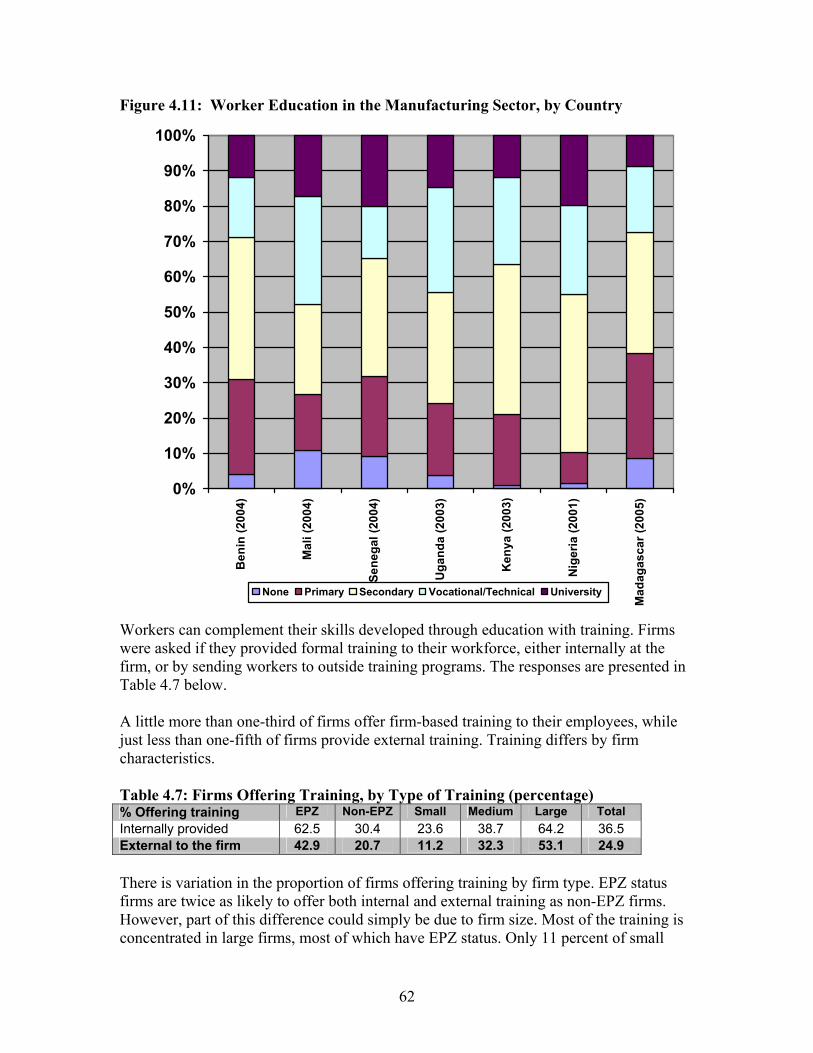
62
Figure 4.11: Worker Education in the Manufacturing Sector, by Country
0%
10%
20%
30%
40%
50%
60%
70%
80%
90%
100%
Ben
in (2
004)
Mal
i (20
04)
Sene
gal (
2004
)
Uga
nda
(200
3)
Ken
ya (2
003)
Nig
eria
(200
1)
Mad
agas
car (
2005
)
None Primary Secondary Vocational/Technical University
Workers can complement their skills developed through education with training. Firms were asked if they provided formal training to their workforce, either internally at the firm, or by sending workers to outside training programs. The responses are presented in Table 4.7 below. A little more than one-third of firms offer firm-based training to their employees, while just less than one-fifth of firms provide external training. Training differs by firm characteristics. Table 4.7: Firms Offering Training, by Type of Training (percentage) % Offering training EPZ Non-EPZ Small Medium Large Total Internally provided 62.5 30.4 23.6 38.7 64.2 36.5 External to the firm 42.9 20.7 11.2 32.3 53.1 24.9 There is variation in the proportion of firms offering training by firm type. EPZ status firms are twice as likely to offer both internal and external training as non-EPZ firms. However, part of this difference could simply be due to firm size. Most of the training is concentrated in large firms, most of which have EPZ status. Only 11 percent of small

63
firms offer training obtained outside the firm. This is very low relative to the mean percentage of firms offering external training. Several training programs are provided or subsidized by the government to improve the skills of its workforce. Most of these would be classified as external training. Comparing across countries, we see that percentage of firms providing external training differs widely across countries, (Figure 4.12). Countries like Nigeria have a well-developed system with more that 78 percent of firms sending workers for external training programs. Kenya and Senegal also fare better than Madagascar. The proportion of firms using external training is similar among Madagascar, Uganda and Mali. Figure 4.12
Worker Health and Absenteeism A well-developed educational system and adequate training programs may still not translate to higher productivity and wages if workers are not healthy. The spread of HIV/AIDS is of foremost concern for most countries in sub-Saharan Africa. In Madagascar, the disease environment does not appear to be an important determinant of labor productivity at present. This is not surprising considering that the latest available data from the UNAIDS Joint United Nations Programme on HIV/AIDS estimates the adult prevalence rate to be only 1.7 percent (end-2003), but the rate is on the increase. Overall, personnel managers reported low malaria and HIV/AIDS prevalence ranging between 0 and 5 percent.
Percent of firms providing external training
29.732.3
28.9
17.6
47.9
78.2
27.8
0
10
20
30
40
50
60
70
80
90
Benin (2004) Mali (2004) Uganda (2002) Senegal (2004) Kenya (2002) Nigeria (2001) Madagascar (2005)

64
Table 4.6 shows the number of unauthorized absences taken by each category of labor. Workers in the manufacturing sector miss an average of 2.8 days per year. This is very low relative to other countries in sub-Saharan Africa. Absences are concentrated amongst unskilled production workers. A typical unskilled production worker misses about 12.7 days a year or about a day a month. There is variation across firm types, with absenteeism much more severe for EPZ-status firms. A typical unskilled worker in an EPZ-status firm misses about 23.7 days a year or just over 2 days a month compared to less than a day a month for non-EPZ firms. Worker surveys of East African countries suggest absence rates of a little over 2 days a month. Table 4.8: Unauthorized Absences, (days per year) Labor category Non EPZ-firm EPZ-firm Total Management 0.2 0.3 0.2 Professionals 1.0 0.6 1.0 Skilled Production workers 4.7 12.4 6.3 Unskilled production workers 10.0 23.7 12.7 Non-production workers 1.9 1.2 1.8
Worker Earnings As discussed in Chapter 2, median wages for an unskilled production worker in Madagascar are $36.00 per month, compared to $45.00 in India, $57.00 in Uganda and $85.00 in China. Wages in neighboring Mauritius have risen to $145.00 per month. In fact, most EPZ investment occurring is by Mauritian firms, who are moving the least skill-intensive, least capital-intensive production lines of garments to Madagascar, creating low-wage, low-skill manufacturing jobs there. Worker earnings for all skill categories are presented below, as reported in worker interviews, (Table 4.9). Total earnings are computed by adding monthly allowances to basic wages. Means are presented, along with standard deviations. The dispersions around the means are high, indicating that earnings within each category vary vastly among workers. We see that earnings are much lower for female employees in higher skill categories, compared to their male counterparts. However, for unskilled production workers, the mean wages are the same for women and men. Managers of large firms earn the highest wages, followed by professionals. Large firms pay more than small firms, and firms with EPZ status, usually larger firms, pay more than non-EPZ firms. Mean earnings of unskilled production workers are only $44.00 per month, with little dispersion around the mean indicating low wage differentials across firms within this category.

65
Table 4.9: Monthly Earnings, by Occupation and Firm Type
N Mean St Dev
Management 41 203 209 Small 23 146.5 162.9 Medium 5 115.9 56.4 Large 13 337.8 260.6 Male 25 252.2 245.8 Female 16 127.3 103.4 EPZ 6 378.2 270.9 non-EPZ 35 190.7 199.7 Professionals 134 150.22 123.84 Small 59 116.0 73.7 Medium 14 131.9 94.6 Large 61 187.5 155.5 Male 79 150.8 141.5 Female 55 149.4 94.1 EPZ 29 187.6 192.2 non-EPZ 105 139.9 95.8
Skilled production workers 330 72.1 51.7 Small 184 66.33 44.61 Medium 39 77.3 46.9 Large 107 80.2 62.9 Male 242 76.9 58.9 Female 88 58.9 31.3 EPZ 68 75.3 40.3 non-EPZ 262 71.3 54.4
Unskilled production workers 750 44.0 37.6 Small 534 43.32 42.89 Medium 64 44.3 20.7 Large 152 46.7 18.4 Male 501 45.8 44.2 Female 249 40.6 17.5 EPZ 141 44.5 19.5 non-EPZ 609 44.0 40.7
Non-production workers 453 69.5 120.5 Small 207 57.8 56.4 Medium 73 63.2 40.0 Large 173 86.2 182.3 Male 228 62.1 90.8 Female 225 76.9 144.5 EPZ 119 71.0 118.2 non-EPZ 334 68.9 121.5
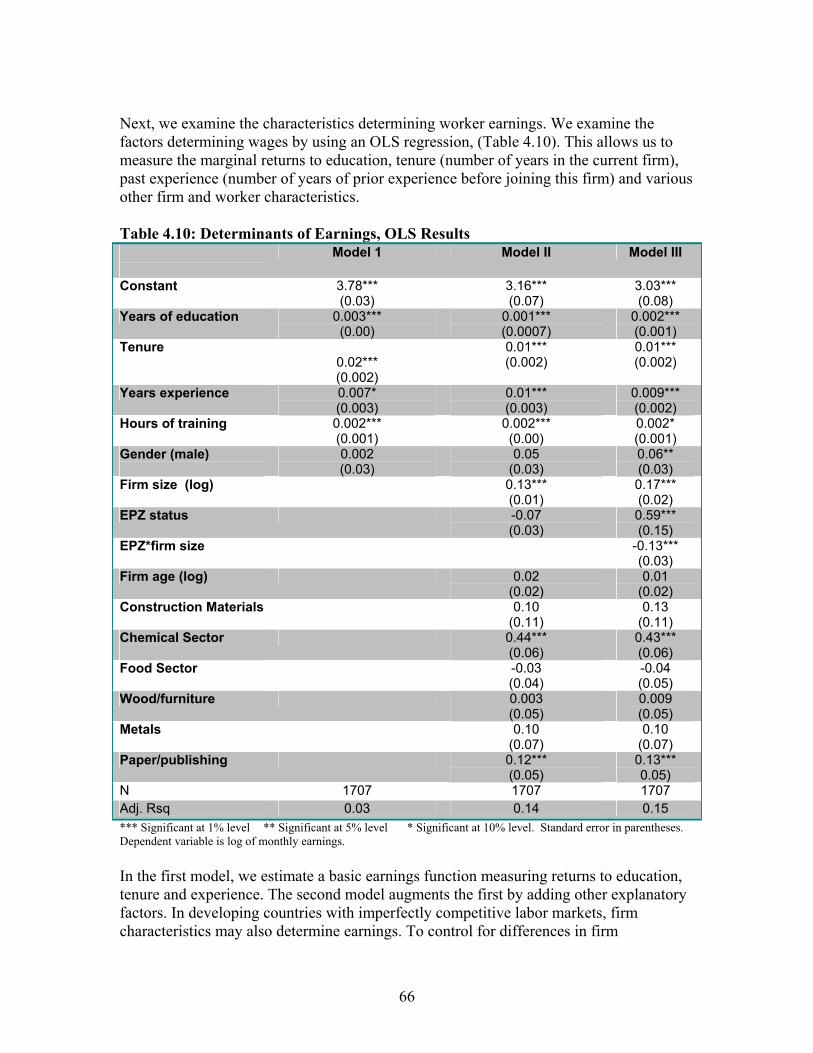
66
Next, we examine the characteristics determining worker earnings. We examine the factors determining wages by using an OLS regression, (Table 4.10). This allows us to measure the marginal returns to education, tenure (number of years in the current firm), past experience (number of years of prior experience before joining this firm) and various other firm and worker characteristics. Table 4.10: Determinants of Earnings, OLS Results
Model 1 Model II Model III
Constant 3.78*** (0.03)
3.16*** (0.07)
3.03*** (0.08)
Years of education 0.003*** (0.00)
0.001*** (0.0007)
0.002*** (0.001)
Tenure
0.02*** (0.002)
0.01*** (0.002)
0.01*** (0.002)
Years experience 0.007* (0.003)
0.01*** (0.003)
0.009*** (0.002)
Hours of training 0.002*** (0.001)
0.002*** (0.00)
0.002* (0.001)
Gender (male)
0.002 (0.03)
0.05 (0.03)
0.06** (0.03)
Firm size (log) 0.13*** (0.01)
0.17*** (0.02)
EPZ status -0.07 (0.03)
0.59*** (0.15)
EPZ*firm size -0.13*** (0.03)
Firm age (log) 0.02 (0.02)
0.01 (0.02)
Construction Materials 0.10 (0.11)
0.13 (0.11)
Chemical Sector
0.44*** (0.06)
0.43*** (0.06)
Food Sector
-0.03 (0.04)
-0.04 (0.05)
Wood/furniture 0.003 (0.05)
0.009 (0.05)
Metals
0.10 (0.07)
0.10 (0.07)
Paper/publishing 0.12*** (0.05)
0.13*** 0.05)
N 1707 1707 1707 Adj. Rsq 0.03 0.14 0.15 *** Significant at 1% level ** Significant at 5% level * Significant at 10% level. Standard error in parentheses. Dependent variable is log of monthly earnings. In the first model, we estimate a basic earnings function measuring returns to education, tenure and experience. The second model augments the first by adding other explanatory factors. In developing countries with imperfectly competitive labor markets, firm characteristics may also determine earnings. To control for differences in firm
67
characteristics, we include firm size and firm age as additional explanatory variables, along with a firm’s sector of operation and EPZ status. The third model adds an interaction term between EPZs and firm size, assuming that the impact on wages is non-linear in size for EPZ firms. Results indicate that every additional year of education improves worker earnings by 5 percent. Number of years worked with the current firm also leads to higher earnings. Each additional year of tenure leads to a 1 percent increase in earnings. The same returns are achieved with prior years of experience elsewhere. Workers who receive more training (hours per year) get higher wages. Each additional hour of formal training within the firm leads to a 0.5 percent increase in pay. The returns to training are fairly high. Since very few workers receive formal training, (the mean for unskilled workers is only 0.5 hours per year), this is not surprising. Neither is the fact that larger firms pay higher wages. Also, controlling for firm size, younger firms in Madagascar pay marginally higher wages compared to older enterprises. The results for the EPZ variable are noteworthy. When included without an interaction term, the variable is insignificant, indicating that there is no fixed increase in wages stemming from EPZ status. However, when we interact it with firm size, we see that firms in the EPZ sector pay higher threshold wages than non-EPZ firms, but these wages increase less rapidly with increase in firm size compared to non-EPZ firms.7 Improving the general education of the workforce and worker health is a common policy goal of all governments. Additional policy interventions can be made by including labor laws such as higher minimum wages, better working conditions and provisions for worker training. It is on the last issue that further debate is necessary, given the low levels of existing training. Should the Government subsidize training, providing tax incentives for firms who invest in training their workforce? Or, should it set up additional training centers? A recent World Bank report evaluates the impact of interventions to increase private sector training in various developing countries, (World Bank, 2003c). The authors examine different public intervention programs including 1) increasing training levies to support training programs by the government, 2) tax incentives for training through allowing workers to deduct training expenditures from income, 3) training taxes with reimbursement provisions for firms who train and 4) wage subsidies. They find that most of these programs have not been successful, especially for small firms. The only measurably successful program was adopted by Singapore, where a levy on wages of unskilled workers goes into a Skills Development Fund which is used to upgrade the workforce through training grants to enterprises. Also, matching grant programs have been used to help build a “training culture” in Mexico’s CIMO program. They conclude that “a study of training programs in seven developing countries show [that] private-sector provided training has had a significant impact on productivity while the
7 A closer look at earnings by firm size within EPZs shows that there are a few small EPZs paying their workers relatively higher wages compared to bigger EPZs. This explains the high magnitude of the coefficient on EPZ. These results will be further investigated.

68
effectiveness of government sponsored training programs has been relatively poor.” In light of these findings, it would be useful to evaluate and design training programs in Madagascar that are instituted by the private sector.

69
Bibliography Agence Française de Développement, (2003) Madagascar Country Strategy Paper 2002-2004. Country Department North East and South Region, June 2003. Paris. Autrand, Michel, (2004) Etude de Compétitivité de l’Aquaculture de Crevettes de Madagascar, Fisheries and Agriculture Consulting, for GAPCM. Cling, Jean Pierre et al, (2004) Export Processing Zones in Madagascar: an Endangered Success Story, Document de travail DIAL / Unité de Recherche CIPRE, March 2004. Economist Intelligence Unit, (2004) Madagascar Country Profile 2004, London. FAO/GIEWS, (2005) Foodcrops and Shortages: Madagascar, February 10, 2005, available at: http://64.233.161.104/search?q=cache:sJGU53RKe_cJ:www.fao.org/docrep/007/J4273e/pays/MAG.htm+price+of+rice+Madagascar&hl=en&start=7 OECD, (2002) Education and Health Expenditure and Poverty Reduction in East Africa: Madagascar and Tanzania, Paris. Paternostro, Stefano, Jean Razafindravonona, David Stifel, (2001) Changes in Poverty in Madagascar: 1993-1999, July 2001, Africa Region Working Paper Series No. 19. Rojat, Dominique, Sandy Rajaosafara, and Christian Chaboud, (2004), Co-Management of the Shrimp Fishery in Madagascar, IIFET Japan Proceedings. Sampson, Gary P., (2000) Trade, Environment and the WTO: The Post-Seattle Agenda. Policy Essay No. 27, Overseas Development Council, Washington, DC. UNESCO/International Institute for Educational Planning, 2002, Revisiting Technical and Vocational Education in sub-Saharan Africa: An Update on Trends, Innovations and Challenges, Paris. United States Department of State, (2005) Background Note: Madagascar, Bureau of African Affairs, March 2005, Washington, DC. USAID/Madagascar Program, available at http://www.usaid.gov/policy/budget/cbj2005/afr/pdf/mg_cbj_fy05.pdf World Bank, (2001a) Project Appraisal Document for the Second Private Sector Development Project, Private Sector Unit, Africa Region. Washington, DC. World Bank, (2001b) Export Processing Zones: Has Africa Missed the Boat? Africa Region Working Paper Series No. 17, May 2001, Washington, DC.

70
World Bank, (2001c) Education and Training in Madagascar: Towards a Policy for Economic Growth and Poverty Reduction, June 2001, Human Development, Africa Region. Washington, DC. World Bank, (2002a) Madagascar: Increasing Integration into World Markets as a Poverty Reduction Strategy, Integrated Framework for Trade-Related Technical Assistance, Washington, DC. World Bank, (2002b) “Trade Policy and Poverty” in A Sourcebook for Poverty Reduction Strategies, October 2002, Washington, DC. World Bank, (2003a) Republic of Madagascar: Tourism Sector Study, Africa Region Working Paper Series No. 63, October 2003, Washington, DC. World Bank, (2003b) Project Appraisal Document for a Governance and Institutional Development Project. October 22, 2003, Public Sector Reform and Capacity Building Unit, Africa Region. Washington, DC. World Bank, (2003c) Direct Support to Private Firms: Evidence on Effectiveness, World Bank Policy Research Paper 3170, November 2003.Washington, DC. World Bank, (2003d) Project Appraisal Document in Support of the Third Phase of the Transport Sector Reform and Rehabilitation Program, November 2003. Transport Sector, Africa Region. Washington, DC. World Bank, (2004) Saving Fish and Fishers: Toward Sustainable and Equitable Governance of the Global Fishing Sector, Agricultural and Rural Development Department, Washington, DC. World Bank, (2005) Madagascar Development Policy Review: Sustaining Growth for Enhanced Poverty Reduction, PREM 1. Africa Region. Washington, DC. World Bank, (2005) Project Appraisal Document for an Integrated Growth Poles Project, Africa Region, Washington, DC. World Trade Organization, (2004) Evaluation of Madagascar’s Commercial Policies, February, 2001. World Wildlife Fund, (1998) Position Statement on Shrimp Aquaculture, December 1998, Washington, DC.

71


