Magna International Inc. First Quarter Report 2019 1 MAGNA INTERNATIONAL INC. Management's Discussion and Analysis of Results of Operations and Financial Position Unless otherwise noted, all amounts in this Management's Discussion and Analysis of Results of Operations and Financial Position ["MD&A"] are in U.S. dollars and all tabular amounts are in millions of U.S. dollars, except per share figures, which are in U.S. dollars. When we use the terms "we", "us", "our" or "Magna", we are referring to Magna International Inc. and its subsidiaries and jointly controlled entities, unless the context otherwise requires. This MD&A should be read in conjunction with the unaudited interim consolidated financial statements for the three months ended March 31, 2019 included in this Quarterly Report, and the audited consolidated financial statements and MD&A for the year ended December 31, 2018 included in our 2018 Annual Report to Shareholders. The most recent updates to our accounting policies, including the impact of the adoption of Accounting Standards Codification 842 – Leases, can be found in Note 2 of our audited consolidated financial statements for the three months ended March 31, 2019. This MD&A contains statements that are forward looking. Refer to the "Forward-Looking Statements" section in this MD&A for a more detailed discussion of our use of forward-looking statements. This MD&A has been prepared as at May 8, 2019. USE OF NON-GAAP FINANCIAL MEASURES In addition to results presented in accordance with accounting principles generally accepted in the United States of America ["U.S. GAAP"], this report includes the use of Adjusted EBIT, Adjusted EBIT as a percentage of sales, Adjusted diluted earnings per share, Return on Invested Capital and Return on Equity [collectively, the "Non-GAAP Measures"]. We believe these non-GAAP financial measures provide additional information that is useful to investors in understanding our underlying performance and trends through the same financial measures employed by our management for this purpose. Readers should be aware that Non-GAAP Measures have no standardized meaning under U.S. GAAP and accordingly may not be comparable to the calculation of similar measures by other companies. We believe that Return on Invested Capital and Return on Equity are useful to both management and investors in their analysis of our results of operations and reflect our ability to generate returns. Similarly, we believe that Adjusted EBIT, Adjusted EBIT as a percentage of sales and Adjusted diluted earnings per share provide useful information to our investors for measuring our operational performance as they exclude certain items that are not reflective of ongoing operating profit or loss and facilitate a comparison of our performance with prior periods. The presentation of any Non-GAAP Measures should not be considered in isolation or as a substitute for our related financial results prepared in accordance with U.S. GAAP. Non-GAAP financial measures are presented together with the most directly comparable GAAP financial measure, and a reconciliation to the most directly comparable GAAP financial measure, can be found in the "Non-GAAP Financial Measures Reconciliation" section of this MD&A. HIGHLIGHTS • Total sales decreased 2% to $10.6 billion in the first quarter of 2019, compared to $10.8 billion in the first quarter of 2018, primarily as a result of the weakening of a number of foreign currencies against the U.S. dollar, together with a 7% decline in global vehicle production. These were partially offset by the launch of new programs, in particular in our Complete Vehicles segment, as well as acquisitions, net of divestitures. Excluding the impact of foreign exchange and acquisitions, net of divestitures, each of our operating segments outpaced global vehicle production in the first quarter of 2019. • Diluted earnings per share and adjusted diluted earnings per share were $3.39 and $1.63, respectively. Adjusted diluted earnings per share declined 11% from the first quarter of 2018, largely reflecting increased engineering and other costs in our Electronics business, substantially associated with certain ADAS programs that are utilizing new technologies, lower equity income and reduced earnings from lower sales. These were partially offset by lower launch costs, productivity and efficiency improvements at certain Body & Structures facilities and the impact of a lower share count. • Included in Other (income) expense, net in the first quarter of 2019 were a $516 million gain on the sale of our Fluid Pressure & Controls ["FP&C"] business, a $177 million unrealized gain on our investment in Lyft, Inc. ["Lyft"] and restructuring costs of $14 million. • Cash from operating activities was $594 million in the first quarter of 2019, an increase of 3% over the first quarter of 2018. • We returned $403 million to shareholders in the first quarter of 2019 through $284 million in share repurchases and $119 million in dividends. OVERVIEW OUR BUSINESS (1) We are a mobility technology company. We have more than 169,000 entrepreneurial-minded employees and 338 manufacturing operations and 89 product development, engineering and sales centres in 28 countries. We have complete vehicle engineering and contract manufacturing expertise, as well as product capabilities which include body, chassis, exterior, seating, powertrain, active driver assistance, electronics, mirrors & lighting, mechatronics and roof systems. Magna also has electronic and software capabilities across many of these areas. Our common shares trade on the Toronto Stock Exchange (MG) and the New York Stock Exchange (MGA). 1 Manufacturing operations, product development, engineering and sales centres and employee figures include certain operations accounted for under the equity method
Transcript
Magna International Inc. First Quarter Report 2019 1
MAGNA INTERNATIONAL INC. Management's Discussion and Analysis of Results of Operations and Financial Position Unless otherwise noted, all amounts in this Management's Discussion and Analysis of Results of Operations and Financial Position ["MD&A"] are in U.S. dollars and all tabular amounts are in millions of U.S. dollars, except per share figures, which are in U.S. dollars. When we use the terms "we", "us", "our" or "Magna", we are referring to Magna International Inc. and its subsidiaries and jointly controlled entities, unless the context otherwise requires. This MD&A should be read in conjunction with the unaudited interim consolidated financial statements for the three months ended March 31, 2019 included in this Quarterly Report, and the audited consolidated financial statements and MD&A for the year ended December 31, 2018 included in our 2018 Annual Report to Shareholders. The most recent updates to our accounting policies, including the impact of the adoption of Accounting Standards Codification 842 – Leases, can be found in Note 2 of our audited consolidated financial statements for the three months ended March 31, 2019. This MD&A contains statements that are forward looking. Refer to the "Forward-Looking Statements" section in this MD&A for a more detailed discussion of our use of forward-looking statements. This MD&A has been prepared as at May 8, 2019.
USE OF NON-GAAP FINANCIAL MEASURES
In addition to results presented in accordance with accounting principles generally accepted in the United States of America ["U.S. GAAP"], this report includes the use of Adjusted EBIT, Adjusted EBIT as a percentage of sales, Adjusted diluted earnings per share, Return on Invested Capital and Return on Equity [collectively, the "Non-GAAP Measures"]. We believe these non-GAAP financial measures provide additional information that is useful to investors in understanding our underlying performance and trends through the same financial measures employed by our management for this purpose. Readers should be aware that Non-GAAP Measures have no standardized meaning under U.S. GAAP and accordingly may not be comparable to the calculation of similar measures by other companies. We believe that Return on Invested Capital and Return on Equity are useful to both management and investors in their analysis of our results of operations and reflect our ability to generate returns. Similarly, we believe that Adjusted EBIT, Adjusted EBIT as a percentage of sales and Adjusted diluted earnings per share provide useful information to our investors for measuring our operational performance as they exclude certain items that are not reflective of ongoing operating profit or loss and facilitate a comparison of our performance with prior periods. The presentation of any Non-GAAP Measures should not be considered in isolation or as a substitute for our related financial results prepared in accordance with U.S. GAAP. Non-GAAP financial measures are presented together with the most directly comparable GAAP financial measure, and a reconciliation to the most directly comparable GAAP financial measure, can be found in the "Non-GAAP Financial Measures Reconciliation" section of this MD&A.
HIGHLIGHTS • Total sales decreased 2% to $10.6 billion in the first quarter of 2019, compared to $10.8 billion in the first quarter of 2018, primarily as a
result of the weakening of a number of foreign currencies against the U.S. dollar, together with a 7% decline in global vehicle production. These were partially offset by the launch of new programs, in particular in our Complete Vehicles segment, as well as acquisitions, net of divestitures. Excluding the impact of foreign exchange and acquisitions, net of divestitures, each of our operating segments outpaced global vehicle production in the first quarter of 2019.
• Diluted earnings per share and adjusted diluted earnings per share were $3.39 and $1.63, respectively. Adjusted diluted earnings per share declined 11% from the first quarter of 2018, largely reflecting increased engineering and other costs in our Electronics business, substantially associated with certain ADAS programs that are utilizing new technologies, lower equity income and reduced earnings from lower sales. These were partially offset by lower launch costs, productivity and efficiency improvements at certain Body & Structures facilities and the impact of a lower share count.
• Included in Other (income) expense, net in the first quarter of 2019 were a $516 million gain on the sale of our Fluid Pressure & Controls ["FP&C"] business, a $177 million unrealized gain on our investment in Lyft, Inc. ["Lyft"] and restructuring costs of $14 million.
• Cash from operating activities was $594 million in the first quarter of 2019, an increase of 3% over the first quarter of 2018. • We returned $403 million to shareholders in the first quarter of 2019 through $284 million in share repurchases and $119 million in dividends.
OVERVIEW
OUR BUSINESS(1)
We are a mobility technology company. We have more than 169,000 entrepreneurial-minded employees and 338 manufacturing operations and 89 product development, engineering and sales centres in 28 countries. We have complete vehicle engineering and contract manufacturing expertise, as well as product capabilities which include body, chassis, exterior, seating, powertrain, active driver assistance, electronics, mirrors & lighting, mechatronics and roof systems. Magna also has electronic and software capabilities across many of these areas. Our common shares trade on the Toronto Stock Exchange (MG) and the New York Stock Exchange (MGA).
1 Manufacturing operations, product development, engineering and sales centres and employee figures include certain operations accounted for under the equity method
2 Magna International Inc. First Quarter Report 2019
INDUSTRY TRENDS AND RISKS
Our operating results are primarily dependent on the levels of North American, European and Chinese car and light truck production by our customers. While we supply systems and components to every major original equipment manufacturer ["OEM"], we do not supply systems and components for every vehicle, nor is the value of our content consistent from one vehicle to the next. As a result, customer and program mix relative to market trends, as well as the value of our content on specific vehicle production programs, are important drivers of our results. OEM production volumes are generally aligned with vehicle sales levels. Overall vehicle sales levels are significantly affected by changes in consumer confidence levels, which may in turn be impacted by consumer perceptions and general trends related to the job, housing and stock markets. Other factors impacting vehicle sales levels, and thus production volumes in North America, Europe and China, include: interest rates and/or availability of credit; fuel and energy prices; relative currency values; and other factors. Production volumes in different regions may also be impacted by a range of factors which vary from one region to the next, including: general economic and political conditions; free trade arrangements; tariffs; relative currency values; commodities prices; supply chains and infrastructure; availability and relative cost of skilled labour; and regulatory considerations, including those related to environmental emissions and safety standards; and other factors. While the foregoing economic, political and other factors are part of the general context in which the global automotive industry operates, there have been a number of significant industry trends that are shaping the future of the industry and creating opportunities and risks for automotive suppliers. We have developed a business strategy intended to help us succeed in the short, medium and long-term; however, there are a number of factors which could affect our ability to do so. Significant industry trends, our business strategy and the major risks we face are discussed in our Annual Information Form ["AIF"] and Annual Report on Form 40-F ["Form 40-F"] in respect of the year ended December 31, 2018. Those industry trends and risk factors remain substantially unchanged in respect of the first quarter ended March 31, 2019, except that: • Industry timeframes for commercial deployment of autonomous driving are being delayed, including as a result of the
complexity involved in this product area. Some market participants are experiencing technical and other challenges in achieving their "driverless ready" milestones. Market participants generally appear to be experiencing higher than anticipated costs for advanced driver assistance systems ["ADAS"] technologies. In the first quarter of 2019, our Magna Electronics business incurred higher development, testing and validation costs on leading-edge technologies, which are expected to persist at levels that are significantly higher than previously expected for 2019 and 2020.
• Data from third party sources of vehicle production volumes, such as IHS Markit, indicates deteriorating production volumes in each of our three key markets, compared to our January 2019 Outlook.
• In addition to the deteriorating production volumes in China, shifting OEM and consumer preferences for certain types of transmissions, OEM pricing pressures and other factors are collectively impacting the performance of our equity-accounted transmission joint ventures in China. Joint venture management is engaged in ongoing discussions with OEM customers on a range of potential solutions.
Magna International Inc. First Quarter Report 2019 3
RESULTS OF OPERATIONS
AVERAGE FOREIGN EXCHANGE For the three months ended March 31, 2019 2018 Change
1 Canadian dollar equals U.S. dollars 0.752 0.790 - 5% 1 euro equals U.S. dollars 1.135 1.229 - 8% 1 Chinese renminbi equals U.S. dollars 0.148 0.157 - 6%
The preceding table reflects the average foreign exchange rates between the most common currencies in which we conduct business and our U.S. dollar reporting currency. The changes in these foreign exchange rates for the three months ended March 31, 2019 impacted the reported U.S. dollar amounts of our sales, expenses and income. The results of operations for which the functional currency is not the U.S. dollar are translated into U.S. dollars using the average exchange rates in the table above for the relevant period. Throughout this MD&A, reference is made to the impact of translation of foreign operations on reported U.S. dollar amounts where relevant.
LIGHT VEHICLE PRODUCTION VOLUMES Our operating results are mostly dependent on light vehicle production in the regions reflected in the table below: Light Vehicle Production Volumes (thousands of units) For the three months ended March 31, 2019 2018 Change
North America 4,273 4,414 - 3% Europe 5,733 5,918 - 3% China 5,550 6,659 - 17%
4 Magna International Inc. First Quarter Report 2019
RESULTS OF OPERATIONS – FOR THE MONTH ENDED MARCH 31, 2019
SALES
Sales decreased 2% or $201 million to $10.59 billion for the first quarter of 2019 compared to $10.79 billion for the first quarter of 2018, primarily as a result of a $553 million decrease in reported U.S. dollar sales due to the weakening of the euro, Canadian dollar, Turkish lira, and Chinese renminbi, each against the U.S. dollar. Excluding the impact of foreign exchange, sales increased $352 million primarily as a result of the launch of new programs during or subsequent to the first quarter of 2018, in particular in our Complete Vehicles business, and acquisitions, net of divestitures, subsequent to the first quarter of 2019 which positively impacted sales by $74 million. These factors were partially offset by lower global light vehicle production and net customer price concessions subsequent to the first quarter of 2019. The changes in sales are discussed further in the "Segment Analysis" section of this MD&A.
COST OF GOODS SOLD For the three months ended March 31, 2019 2018 Change
Material $ 6,706 $ 6,785 $ (79) Direct labour 747 778 (31) Overhead 1,711 1,730 (19)
Cost of goods sold $ 9,164 $ 9,293 $ (129)
Cost of goods sold decreased $129 million to $9.16 billion for the first quarter of 2019 compared to $9.29 billion for the first quarter of 2018 primarily as a result of a $486 million net decrease in reported U.S. dollar cost of goods sold primarily due to the weakening of the euro, Canadian dollar, Turkish lira and Chinese renminbi, each against the U.S. dollar. Excluding the impact of foreign exchange, cost of goods sold increased $357 million primarily as a result of higher material, direct labour and overhead costs associated with the increase in sales, excluding foreign exchange. The additional increase in cost of goods sold, excluding foreign exchange, was due to: • acquisitions, net of divestitures, subsequent to the first quarter of 2018 which increased cost of sales by $66 million; and • higher engineering and other costs in our Electronics business, substantially associated with certain ADAS programs that
are utilizing new technologies, including an $11 million write-down of engineering costs that were previously capitalized on our balance sheet.
These factors were partially offset by lower launch costs and productivity and efficiency improvements at certain Body Exteriors & Structures facilities.
DEPRECIATION AND AMORTIZATION Depreciation and amortization costs increased $6 million to $321 million for the first quarter of 2019 compared to $315 million for the first quarter of 2018. The higher depreciation and amortization was primarily a result of increased capital deployed at existing facilities, and to support the launch of new programs during or subsequent to the first quarter of 2018. These factors were partially offset by lower depreciation on our FP&C assets formerly classified as held for sale which, as of September 2018, were no longer being amortized and a $16 million net decrease in reported U.S. dollar depreciation and amortization mainly due to the weakening of the euro and Canadian dollar, each against the U.S. dollar.
$10,792 $10,591
$4,000
$11,000
2018 2019
Sales
- 2%
Magna International Inc. First Quarter Report 2019 5
SELLING, GENERAL AND ADMINISTRATIVE ["SG&A"] SG&A expense as a percentage of sales was 4.0% for the first quarter of 2019 compared to 3.7% for the first quarter of 2018. SG&A expense increased $25 million to $421 million for the first quarter of 2019 compared to $396 million for the first quarter of 2018, primarily as a result of: • a favourable settlement reported during the first quarter of 2018 relating to the acquisition of Getrag; • higher labour and benefit costs; • acquisitions, net of divestitures, subsequent to the first quarter of 2018 which increased SG&A by $17 million; • a $16 million write-down in our Electronics business of fixed assets associated with certain ADAS programs that are utilizing
new technologies; and • an $8 million unfavourable impact of lower foreign exchange gains in the first quarter of 2019 compared to the first quarter
of 2018 related to the re-measurement of net deferred tax assets that are maintained in a currency other than their functional currency.
These factors were partially offset by: • a $20 million net decrease in the reported U.S. dollar SG&A expense primarily due to the weakening of the euro and
Canadian dollar, each against the U.S. dollar; • gains on the sale of assets in our Seating Systems and Corporate segments during the first quarter of 2019; • foreign exchange gains in the first quarter of 2019 compared to foreign exchange losses in the first quarter of 2018; and • lower incentive compensation.
INTEREST EXPENSE, NET During the first quarter of 2019, we recorded net interest expense of $31 million compared to $21 million for the first quarter of 2018. The $10 million increase is primarily the result of higher interest expense due to the increase in borrowings and higher average interest rates.
EQUITY INCOME
Equity income decreased $52 million to $35 million for the first quarter of 2019 compared to $87 million for the first quarter of 2018, primarily due to lower sales in our Power & Vision segment in China.
OTHER (INCOME) EXPENSE, NET For the three months ended March 31, 2019 2018
Gain on sale of FP&C (1) $ (516) $ — Unrealized gain on investment revaluation (2) (177) — Restructuring (3) 14 3
$ (679) $ 3
(1) Gain on sale of FP&C
During the first quarter of 2019, we recorded a gain on the sale of FP&C of $516 million [$438 million after tax].
(2) Unrealized gain on investment revaluation
During the first quarter of 2019, we recorded unrealized gains of $177 million [$151 million after tax], substantially relating to the initial public offering for Lyft. As a result of the initial public offering, our private equity investment in Lyft was converted to publicly traded equity securities.
(3) Restructuring
During the first quarter of 2019, we recorded net restructuring charges of $14 million [$14 million after tax] in our Body Exteriors & Structures operations. During the first quarter of 2018, we recorded net restructuring charges of $3 million [$3 million after tax], in our Power & Vision operations.
6 Magna International Inc. First Quarter Report 2019
INCOME FROM OPERATIONS BEFORE INCOME TAXES Income from operations before income taxes increased $517 million to $1.37 billion for the first quarter of 2019 compared to $851 million for the first quarter of 2018. This increase is the result of a $682 increase in other (income) expense, net and a $129 million decrease in cost of goods sold, partially offset by a $201 million decrease in sales, a $52 million decrease in equity income, a $25 million increase in SG&A, a $10 million increase in interest expense, net and a $6 million increase in depreciation and amortization, each as discussed above.
INCOME TAXES
For the three months ended March 31, 2019 2018
Income Taxes as reported $ 267 19.5% $ 182 21.4% Tax effect on Other (income) expense, net (104) 4.2 — (0.1)
$ 163 23.7% $ 182 21.3%
Excluding Other (income) expense, net, after tax, the effective income tax rate increased to 23.7% for 2019 compared to 21.3% for 2018, primarily as a result of: • a decrease in equity income; • a change in mix of earnings resulting in proportionally lower income earned in jurisdictions with lower income tax rates; and • an increase in losses not benefited in Asia and South America, as well as a decrease in utilization of losses previously not
benefited in Europe.
These factors were partially offset by a reduction in our reserves for uncertain tax positions.
LOSS (INCOME) ATTRIBUTABLE TO NON-CONTROLLING INTERESTS
Loss attributable to non-controlling interests was $5 million for the first quarter of 2019 compared to income attributable to non-controlling interests of $9 million for the first quarter of 2018. The change was primarily due to decreased profits at certain Power & Vision and Body Exteriors & Structures operations.
NET INCOME ATTRIBUTABLE TO MAGNA INTERNATIONAL INC.
Net income attributable to Magna International Inc. increased $446 million to $1.11 billion for the first quarter of 2019 compared to $660 million for the first quarter of 2018, as a result of an increase in income from operations before income taxes of $517 million and a decrease in loss (income) attributable to non-controlling interests of $14 million partially offset by an increase in income taxes of $85 million.
Magna International Inc. First Quarter Report 2019 7
EARNINGS PER SHARE
For the three months ended March 31, 2019 2018 Change
Earnings per Common Share Basic $ 3.40 $ 1.84 + 85% Diluted $ 3.39 $ 1.83 + 85%
Weighted average number of Common Shares outstanding (millions) Basic 325.1 357.7 - 9% Diluted 326.3 359.9 - 9%
Diluted earnings per share increased $1.56 to $3.39 for the first quarter of 2019 compared to $1.83 for the first quarter of 2018 as a result of the increase in net income attributable to Magna International Inc., as discussed above, and a decrease in the weighted average number of diluted shares outstanding during the first quarter of 2019. The decrease in the weighted average number of diluted shares outstanding was primarily due to the purchase and cancellation of Common Shares, during or subsequent to the first quarter of 2018, pursuant to our normal course issuer bids. Other (income) expense, net, after tax, positively impacted diluted earnings per share by $1.76 in the first quarter of 2019 and negatively impacted diluted earnings per share by $0.01 in the first quarter of 2018, as discussed in the "Other (income) expense, net" and "Income Taxes" sections. Adjusted diluted earnings per share, as reconciled in the "Non-GAAP Financial Measures Reconciliation" section, decreased $0.21 to $1.63 for the first quarter of 2019 compared to $1.84 for the first quarter of 2018.
$1.83
$3.39
$-
$3.50
2018 2019
Diluted earnings per share
+ 85%
$1.84 $1.63
$-
$3.50
2018 2019
Adjusted diluted earnings per share
- 11%
8 Magna International Inc. First Quarter Report 2019
NON-GAAP PERFORMANCE MEASURES - FOR THE THREE MONTHS ENDED MARCH 31, 2019
ADJUSTED EBIT AS A PERCENTAGE OF SALES
The table below shows the change in Magna's Sales and Adjusted EBIT by segment and the impact each segment's changes have on Magna's Adjusted EBIT as a percentage of sales for the first quarter of 2019 compared to the first quarter of 2018: Adjusted EBIT Adjusted as a percentage Sales EBIT of sales
First quarter of 2018 $ 10,792 $ 875 8.1% Increase (Decrease) related to:
Body Exteriors & Structures (311) 20 + 0.4% Power & Vision (107) (143) - 1.3% Seating Systems (37) (36) - 0.3% Complete Vehicles 268 9 - 0.1% Corporate and Other (14) (5) —
First quarter of 2019 $ 10,591 $ 720 6.8%
Adjusted EBIT as a percentage of sales decreased 1.3% to 6.8% for the first quarter of 2019 compared to 8.1% for the first quarter of 2018 primarily due to: • higher engineering and other costs in our Electronics business, substantially associated with certain ADAS programs that
are utilizing new technologies, including a $27 million write-down of amounts that were previously capitalized on our balance sheet;
• lower equity income; • a favourable settlement reported during the first quarter of 2018 relating to the acquisition of Getrag; • reduced earnings due to lower sales; • acquisitions, net of divestitures, subsequent to the first quarter of 2018; and • an increase in the proportion of sales generated in our Complete Vehicles segment relative to total sales, which have a
lower margin than our consolidated average. These factors were partially offset by lower launch costs and productivity and efficiency improvements at certain Body Exteriors & Structures facilities.
8.1%6.8%
0.0%
5.0%
10.0%
2018 2019
Adjusted EBIT as a percentage of sales
- 1.3%
Magna International Inc. First Quarter Report 2019 9
RETURN ON INVESTED CAPITAL
Return on Invested Capital increased 9.8% to 27.0% for the first quarter of 2019 compared to 17.2% for the first quarter of 2018, primarily as a result of an increase in After-tax operating profits partially offset by higher Average Invested Capital. The gain on sale of FP&C and the unrealized gain on investment revaluation, as described in the "Other (income) expense, net" section, favourably impacted Return on Invested Capital by 14.0%. Average Invested Capital increased $783 million to $16.70 billion for the first quarter of 2019 compared to $15.92 billion for the first quarter of 2018, primarily due to: • the recognition of operating lease right-of-use assets during the first quarter of 2019 in accordance with the adoption of the
accounting standard Accounting Standards Codification 842 – Leases; • an increase in our investment in fixed assets to refurbish or replace assets consumed in the normal course of business and
for manufacturing equipment for programs that will be launching subsequent to the first quarter of 2019; • an increase in investments, including our investment in Lyft equity during the second quarter of 2018; and • an increase in working capital. These factors were partially offset by: • the net weakening of foreign currencies against the U.S. dollar; and • the sale of our FP&C business during the first quarter of 2019, including the associated assets and liabilities formerly
classified as held for sale. After-tax operating profits increased primarily as a result of higher other (income) expense, net and lower cost of goods sold partially offset by lower sales, higher income taxes, lower equity income, higher SG&A, and higher depreciation and amortization.
RETURN ON EQUITY
Return on Equity increased 16.3% to 38.3% for the first quarter of 2019 compared to 22.0% for the first quarter of 2018 due to higher net income attributable to Magna and lower Average Shareholders' Equity. The gain on sale of FP&C and the unrealized gain on investment revaluation, as described in the "Other (income) expense, net" section, favourably impacted Return on Equity by 20.2%.
17.2%
27.0%
0.0%
10.0%
20.0%
30.0%
2018 2019
Return on Invested Capital
+ 9.8%
22.0%
38.3%
10.0%
40.0%
2018 2019
Return on Equity
+ 16.3%
10 Magna International Inc. First Quarter Report 2019
SEGMENT ANALYSIS
We are a global automotive supplier which has complete vehicle engineering and contract manufacturing expertise, as well as product capabilities including body, chassis, exterior, seating, powertrain, advanced driver assistance, electronics, vision, mechatronics and roof systems. Magna also has electronic and software capabilities across many of these areas. Our business is managed under operating segments which have been determined on the basis of technological opportunities, product similarities, as well as market and operating factors. Our internal financial reporting is aligned with the way our business is managed. Accordingly, we report key internal operating performance measures for Body Exteriors & Structures, Power & Vision, Seating Systems, and Complete Vehicles for presentation to the chief operating decision maker to use in the assessment of operating performance, allocation of resources, and to help plan our long-term strategic direction and future global growth. Our chief operating decision maker uses Adjusted EBIT as the measure of segment profit or loss, since we believe Adjusted EBIT is the most appropriate measure of operational profitability or loss for our reportable segments. Adjusted EBIT has been reconciled in the "Non-GAAP Financial Measures Reconciliation" section included in this MD&A. For the three months ended March 31, Sales Adjusted EBIT 2019 2018 Change 2019 2018 Change
Body Exteriors & Structures $ 4,308 $ 4,619 $ (311) $ 363 $ 343 $ 20 Power & Vision 3,083 3,190 (107) 216 359 (143) Seating Systems 1,433 1,470 (37) 94 130 (36) Complete Vehicles 1,928 1,660 268 28 19 9 Corporate and Other (161) (147) (14) 19 24 (5)
BODY EXTERIORS & STRUCTURES For the three months ended March 31, 2019 2018 Change
Sales $ 4,308 $ 4,619 $ (311) - 7%
Adjusted EBIT $ 363 $ 343 $ 20 + 6%
Adjusted EBIT as a percentage of sales 8.4% 7.4% + 1.0%
Sales – Body Exteriors & Structures Sales for Body Exteriors & Structures decreased 7% or $311 million to $4.31 billion for the first quarter of 2019 compared to $4.62 billion for the first quarter of 2018, primarily as a result of: • lower global light vehicle production; • a $177 million decrease in reported U.S. dollar sales primarily as a result of the weakening of the euro, Canadian dollar,
Russian ruble and Chinese renminbi, each against the U.S. dollar; and • net customer price concessions subsequent to the first quarter of 2018. These factors were partially offset by: • the launch of new programs during or subsequent to the first quarter of 2019, including the:
• GMC Sierra and Chevrolet Silverado; • BMW X3; • Mercedes-Benz G-Class; and • Ford Ranger.
$4,619 $4,308
$3,000
$5,000
2018 2019
Sales
- 7%
Magna International Inc. First Quarter Report 2019 11
Adjusted EBIT – Body Exteriors & Structures Adjusted EBIT for Body Exteriors & Structures increased $20 million to $363 million for the first quarter of 2019 compared to $343 million for the first quarter of 2018, primarily as a result of: • lower launch costs; • productivity and efficiency improvements, including at certain previously underperforming facilities; • favourable customer pricing resolutions and commercial settlements in the first quarter of 2019; and • foreign exchange gains in 2019 compared to foreign exchange losses in 2018.
These factors were partially offset by: • a $15 million decrease in reported U.S. dollar Adjusted EBIT as a result of the weakening of certain foreign currencies
against the U.S. dollar including the euro, Canadian dollar and Russian ruble; • higher depreciation and amortization; • reduced earnings due to lower sales; • inefficiencies at plants we are closing; and • net customer price concessions subsequent to the first quarter of 2018.
Adjusted EBIT as a percentage of sales – Body Exteriors & Structures
Adjusted EBIT as a percentage of sales for Body Exteriors & Structures increased 1.0% to 8.4% for the first quarter of 2019 compared to 7.4% for the first quarter of 2018, primarily as a result of: • lower launch costs; • productivity and efficiency improvements, including at certain previously underperforming facilities; • favourable customer pricing resolutions and commercial settlements in the first quarter of 2019; and • foreign exchange gains in 2019 compared to foreign exchange losses in 2018.
These factors were partially offset by higher depreciation and amortization and inefficiencies at plants we are closing.
$343 $363
$200
$400
2018 2019
Adjusted EBIT
+ 6%
7.4%
8.4%
5.0%
10.0%
2018 2019
Adjusted EBIT as a percentage of sales
+ 1.0%
12 Magna International Inc. First Quarter Report 2019
POWER & VISION For the three months ended March 31, 2019 2018 Change
Sales $ 3,083 $ 3,190 $ (107) - 3%
Adjusted EBIT $ 216 $ 359 $ (143) - 40%
Adjusted EBIT as a percentage of sales 7.0% 11.3% - 4.3%
Sales – Power & Vision Sales for Power & Vision decreased 3% or $107 million to $3.08 billion for the first quarter of 2019 compared to $3.19 billion for the first quarter of 2018, primarily as a result of: • a $160 million decrease in reported U.S. dollar sales primarily as a result of the weakening of the euro, Canadian dollar and
Chinese renminbi, each against the U.S. dollar; • lower global light vehicle production; and • net customer price concessions subsequent to the first quarter of 2018. These factors were partially offset by: • acquisitions, net of divestitures, subsequent to the first quarter of 2019 which positively impacted sales by $72 million; and • the launch of new programs during or subsequent to the first quarter of 2019, including the;
• BMW X5; • Chevrolet Blazer; • Audi A6; • RAM 1500 pickup; and • dual-clutch transmissions on various Daimler vehicles.
Adjusted EBIT – Power & Vision Adjusted EBIT for Power & Vision decreased $143 million to $216 million for the first quarter of 2019 compared to $359 million for the first quarter of 2018, primarily as a result of: • higher engineering and other costs in our Electronics business, substantially associated with certain ADAS programs that
are utilizing new technologies, including a $27 million write-down of amounts that were previously capitalized on our balance sheet;
• lower equity income, excluding the impact of foreign exchange, of $45 million; • a favourable settlement reported during the first quarter of 2018 relating to the acquisition of Getrag; • acquisitions, net of divestitures, subsequent to the first quarter of 2018; and • an $11 million decrease in reported U.S. dollar Adjusted EBIT, primarily due to the weakening of the euro and Canadian
dollar, each against the U.S. dollar.
These factors were partially offset by lower depreciation on our FP&C assets formerly classified as held for sale which, as of September 2018, were no longer being amortized and lower warranty costs of $9 million.
$3,190 $3,083
$1,000
$3,500
2018 2019
Sales
- 3%
$359
$216
$-
$400
2018 2019
Adjusted EBIT
- 40%
11.3%
7.0%
0.0%
12.0%
2018 2019
Adjusted EBIT as a percentage of sales
- 4.3%
Magna International Inc. First Quarter Report 2019 13
Equity income, excluding the impact of foreign exchange, was $45 million lower, primarily due to lower sales at our Power & Vision business in China. Adjusted EBIT as a percentage of sales – Power & Vision Adjusted EBIT as a percentage of sales for Power & Vision decreased 4.3% to 7.0% for the first quarter of 2019 compared to 11.3% for the first quarter of 2018, primarily as a result of: • higher engineering and other costs in our Electronics business, substantially associated with certain ADAS programs that
are utilizing new technologies, including a $27 million write-down of amounts that were previously capitalized on our balance sheet;
• lower equity income; • a favourable settlement reported during the first quarter of 2018 relating to the acquisition of Getrag; and • acquisitions, net of divestitures, subsequent to the first quarter of 2018.
These factors were partially offset by lower depreciation on our FP&C assets formerly classified as held for sale which, as of September 2018, were no longer being amortized and lower warranty costs.
SEATING SYSTEMS For the three months ended March 31, 2019 2018 Change
Sales $ 1,433 $ 1,470 $ (37) - 3%
Adjusted EBIT $ 94 $ 130 $ (36) - 28%
Adjusted EBIT as a percentage of sales 6.6% 8.8% - 2.2%
Sales – Seating Systems Sales in Seating Systems decreased 3% or $37 million to $1.43 billion for the first quarter of 2019 compared to $1.47 billion for the first quarter of 2018, primarily as a result of: • a $67 million decrease in reported U.S. dollar sales, primarily as a result of the weakening of the Turkish lira, Canadian
dollar, euro and Brazilian real, each against the U.S. dollar; • lower global light vehicle production; • the end of production of certain programs; and • net customer price concessions subsequent to the first quarter of 2018. These factors were partially offset by the launch of new programs during or subsequent to the first quarter of 2019, including the;
• BMW X5; • Geely Bin Yue; • Skoda Kodiaq; and • BMW X7.
$1,470 $1,433
$500
$1,500
2018 2019
Sales
- 3%
14 Magna International Inc. First Quarter Report 2019
Adjusted EBIT – Seating Systems Adjusted EBIT for Seating Systems decreased $36 million to $94 million for the first quarter of 2019 compared to $130 million for the first quarter of 2018, primarily as a result of: • reduced earnings due to lower sales; • higher commodity costs; • a $4 million decrease in reported U.S. dollar Adjusted EBIT, primarily due to the weakening of the Canadian dollar and
Turkish lira, each against the U.S. dollar; and • lower equity income, excluding the impact of foreign exchange, of $3 million. These factors were partially offset by a gain on the sale of assets in the first quarter of 2019. Adjusted EBIT as a percentage of sales – Seating Systems Adjusted EBIT as a percentage of sales for Seating Systems decreased 2.2% to 6.6% for the first quarter of 2019 compared to 8.8% for the first quarter of 2018, primarily as a result of: • higher launch costs incurred at new facilities; • reduced earnings due to lower sales; • higher commodity costs; and • lower equity income. These factors were partially offset by a gain on the sale of assets in the first quarter of 2019.
$130
$94
$-
$150
2018 2019
Adjusted EBIT
- 28%8.8%
6.6%
0.0%
10.0%
2018 2019
Adjusted EBIT as a percentage of sales
- 2.2%
Magna International Inc. First Quarter Report 2019 15
COMPLETE VEHICLES For the three months ended March 31, 2019 2018 Change
Adjusted EBIT as a percentage of sales 1.5% 1.1% + 0.4%
(i) Vehicles produced at our Complete Vehicle operations are included in Europe Light Vehicle Production volumes.
Sales – Complete Vehicles Sales increased 16% or $268 million to $1.93 billion for the first quarter of 2019 compared to $1.66 billion for the first quarter of 2018 and assembly volumes increased 12% or five thousand units. The increase in Complete Vehicle sales is primarily due to: • the launch of the Jaguar I-Pace program which started production during the first quarter of 2018; • the launch of the BMW Z4 program which started production during the fourth quarter of 2018; and • the launch of the new Mercedes-Benz G-Class program which started production during the second quarter of 2018.
These factors were partially offset by: • the impact of lower assembly volumes on the BMW 5-Series and Jaguar E-Pace; and • a $160 million decrease in reported U.S. dollar sales as a result of the weakening of the euro against the U.S. dollar.
$1,660 $1,928
$500
$2,000
2018 2019
Sales
+ 16% 40.945.9
-
50.0
2018 2019
Complete Vehicle Volumes(thousands of units)
+ 12%
16 Magna International Inc. First Quarter Report 2019
Adjusted EBIT – Complete Vehicles Adjusted EBIT for Complete Vehicles increased $9 million to $28 million for the first quarter of 2019 compared to $19 million for the first quarter of 2018, primarily as a result of lower launch and other costs and earnings on higher sales. These factors were partially offset by higher depreciation and amortization relating to programs that launched subsequent to the first quarter of 2018. Adjusted EBIT as a percentage of sales – Complete Vehicles Adjusted EBIT as a percentage of sales for Complete Vehicles increased 0.4% to 1.5% for the first quarter of 2019 compared to 1.1% for the first quarter of 2018, primarily as a result of lower launch and other costs. These factors were partially offset by higher depreciation and amortization relating to programs that launched subsequent to the first quarter of 2018.
CORPORATE AND OTHER Adjusted EBIT in Corporate and Other decreased $5 million to $19 million for the first quarter of 2019 compared to $24 million for the first quarter of 2018, primarily due to an $8 million unfavourable impact of lower foreign exchange gains in the first quarter of 2019 compared to the first quarter of 2018 related to the re-measurement of net deferred tax assets that are maintained in a currency other than their functional currency and spending associated with corporate research & development partially offset by a gain on the sale of assets in the first quarter of 2019.
$19
$28
$-
$30
2018 2019
Adjusted EBIT
+ 47% 1.1%
1.5%
0.0%
2.0%
2018 2019
Adjusted EBIT as a percentage of sales
+ 0.4%
Magna International Inc. First Quarter Report 2019 17
FINANCIAL CONDITION, LIQUIDITY AND CAPITAL RESOURCES
CASH FLOW FROM OPERATIONS
For the three months ended March 31, 2019 2018 Change
Net income $ 1,101 $ 669 Items not involving current cash flows (213) 363
888 1,032 $ (144) Changes in operating assets and liabilities (294) (455) 161
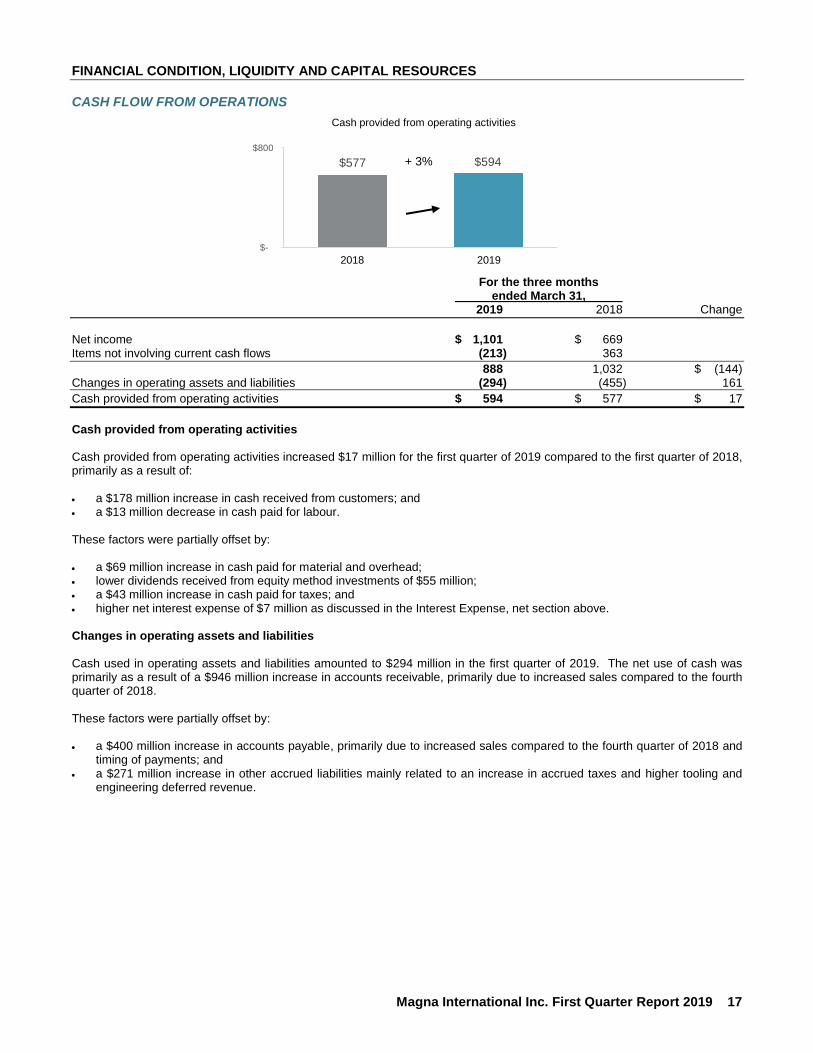
Cash provided from operating activities Cash provided from operating activities increased $17 million for the first quarter of 2019 compared to the first quarter of 2018, primarily as a result of: • a $178 million increase in cash received from customers; and • a $13 million decrease in cash paid for labour. These factors were partially offset by: • a $69 million increase in cash paid for material and overhead; • lower dividends received from equity method investments of $55 million; • a $43 million increase in cash paid for taxes; and • higher net interest expense of $7 million as discussed in the Interest Expense, net section above. Changes in operating assets and liabilities Cash used in operating assets and liabilities amounted to $294 million in the first quarter of 2019. The net use of cash was primarily as a result of a $946 million increase in accounts receivable, primarily due to increased sales compared to the fourth quarter of 2018. These factors were partially offset by: • a $400 million increase in accounts payable, primarily due to increased sales compared to the fourth quarter of 2018 and
timing of payments; and • a $271 million increase in other accrued liabilities mainly related to an increase in accrued taxes and higher tooling and
engineering deferred revenue.
$577 $594
$-
$800
2018 2019
Cash provided from operating activities
+ 3%
18 Magna International Inc. First Quarter Report 2019
CAPITAL AND INVESTING SPENDING
For the three months ended March 31, 2019 2018 Change
Fixed asset additions $ (251) $ (243) Investments, other assets and intangible assets (82) (114)
Fixed assets, investments, other assets and intangible assets additions (333) (357) Proceeds from disposition 86 29 Proceeds on sale of FP&C 1,129 —
Fixed assets, investments, other assets and intangible assets additions In 2019, we invested $251 million in fixed assets. While investments were made to refurbish or replace assets consumed in the normal course of business and for productivity improvements, a large portion of the investment in the first quarter of 2019 was for manufacturing equipment and buildings for programs that launched during the first quarter of 2019, or that will be launching subsequent to the first quarter of 2019. In addition, we invested $77 million in other assets related primarily to fully reimbursable tooling, planning, and engineering costs for programs that launched during the first quarter of 2019 or will be launching subsequent to the first quarter of 2019, and we invested a further $5 million in investments, primarily related to equity method investments. Proceeds from disposition In the first quarter of 2019, the $86 million of proceeds related to normal course fixed and other asset disposals. Proceeds on sale of FP&C The $1.13 billion of proceeds relate to the sale of our FP&C business during the first quarter of 2019.
FINANCING For the three months ended March 31, 2019 2018 Change
Issues of debt $ 5 $ 15 (Decrease) Increase in short-term borrowings (774) 1 Repayments of debt (86) (13) Contributions to subsidiaries by non-controlling interests 2 — Issue of Common Shares on exercise of stock options 8 5 Shares repurchased for tax withholdings on vesting of equity awards (3) — Repurchase of Common Shares (284) (103) Dividends (119) (118)
Cash used for financing activities $ (1,251) $ (213) $ (1,038)
The decrease in short-term borrowings relates primarily to a $593 million decrease in U.S. commercial paper [the "U.S. Program"] and a $160 million decrease in euro-commercial paper [the "Euro Program"] during the first quarter of 2019. Repurchases of Common Shares during the first quarter of 2019 are related to 5.6 million Common Shares repurchased for aggregate cash consideration of $284 million. Cash dividends paid per Common Share were $0.365 for the first quarter of 2019, for a total of $119 million compared to cash dividends paid per Common Share of $0.330 for the first quarter of 2018, for a total of $118 million.
$(328)
$882
$(500)
$1,2002018 2019
Cash used for investing activities
Magna International Inc. First Quarter Report 2019 19
FINANCING RESOURCES
As at As at March 31, December 31, 2019 2018 Change
Liabilities Short-term borrowings $ 335 $ 1,098 Long-term debt due within one year 122 201 Current portion of operating lease liabilities 176 — Long-term debt 3,062 3,084
Total capitalization increased by $100 million to $15.64 billion as at March 31, 2019 compared to $15.54 billion at December 31, 2018, primarily as a result of a $779 million increase in shareholders' equity and a $9 million increase in non-controlling interests, partially offset by a $688 million decrease in liabilities. The increase in shareholders' equity was primarily as a result of $1.10 billion of net income earned in the first quarter of 2019, a $37 million net unrealized gain on cash flow hedges and a $27 million net unrealized gain on translation of our net investment in foreign operations whose functional currency is not U.S. dollars. These factors were partially offset by the $284 million repurchase and cancellation of 5.6 million Common Shares during the first quarter of 2019 and the $119 million of dividends paid during the first quarter of 2019. The increase in non-controlling interest was primarily as a result of dividends paid during the first quarter of 2019 partially offset by loss (income) attributable to non-controlling interests in the first quarter of 2019. The decrease in liabilities relates primarily to a $593 million decrease in the U.S. Program and a $160 million decrease in the Euro Program during the first quarter of 2019, partially offset by the recognition of $176 million of current operating lease liabilities during the first quarter of 2019 in accordance with the adoption of the accounting standard Accounting Standards Codification 842 – Leases.
CASH RESOURCES During the first quarter of 2019, our cash resources including restricted cash equivalents increased by $239 million to $1.04 billion, primarily as a result of the cash used for investing and financing activities partially offset by the cash provided from operating activities, as discussed above. In addition to our cash resources at March 31, 2019, we had term and operating lines of credit totalling $3.3 billion, of which $2.7 billion was unused and available. The Company maintains a revolving credit facility of $2.75 billion with a maturity date of June 22, 2024. The facility includes a $200 million Asian tranche, a $100 million Mexican tranche and a tranche for Canada, U.S. and Europe, which is fully transferable between jurisdictions and can be drawn in U.S. dollars, Canadian dollars or euros.
MAXIMUM NUMBER OF SHARES ISSUABLE The following table presents the maximum number of shares that would be outstanding if all of the outstanding options at May 8, 2019 were exercised: Common Shares 319,969,867 Stock options (i) 9,271,596
329,241,463
(i) Options to purchase Common Shares are exercisable by the holder in accordance with the vesting provisions and upon
payment of the exercise price as may be determined from time to time pursuant to our stock option plans.
20 Magna International Inc. First Quarter Report 2019
CONTRACTUAL OBLIGATIONS AND OFF-BALANCE SHEET FINANCING There have been no material changes with respect to the contractual obligations requiring annual payments during the first quarter of 2019 that are outside the ordinary course of our business. Refer to our MD&A included in our 2018 Annual Report.
NON-GAAP FINANCIAL MEASURES RECONCILIATION
ADJUSTED EBIT Adjusted EBIT is discussed in the "Segment Analysis" section. The following table reconciles net income to Adjusted EBIT: For the three months ended March 31, 2019 2018
Net Income $ 1,101 $ 669 Add : Interest expense, net 31 21 Other (income) expense, net (679) 3 Income taxes 267 182
Adjusted EBIT $ 720 $ 875
ADJUSTED EBIT AS A PERCENTAGE OF SALES Adjusted EBIT as a percentage of sales is discussed in the "Non-GAAP Performance Measures" section and is calculated in the table below: For the three months ended March 31, 2019 2018
Sales $ 10,591 $ 10,792
Adjusted EBIT $ 720 $ 875
Adjusted EBIT as a percentage of sales 6.8% 8.1%
ADJUSTED DILUTED EARNINGS PER SHARE Adjusted diluted earnings per share has been discussed in the "Earnings per Share" section. The following table reconciles net income attributable to Magna International Inc. to Adjusted diluted earnings per share: For the three months ended March 31, 2019 2018
Net income attributable to Magna International Inc. $ 1,106 $ 660 Add : Other (income) expense, net (679) 3 Tax effect on Other (income) expense, net 104 —
Adjusted net income attributable to Magna International Inc. 531 663 Diluted weighted average number of Common Shares outstanding during the period (millions) 326.3 359.9
Adjusted diluted earnings per share $ 1.63 $ 1.84
Magna International Inc. First Quarter Report 2019 21
RETURN ON INVESTED CAPITAL Return on Invested Capital is discussed in the "Non-GAAP Performance Measures" section. Return on Invested Capital is calculated as After-tax operating profits divided by Average Invested Capital (Invested Capital is averaged on a five-fiscal quarter basis) for the period. After-tax operating profits is calculated in the table below: For the three months ended March 31, 2019 2018
Net Income $ 1,101 $ 669 Add : Interest expense, net 31 21 Income taxes on Interest expense, net at Magna's effective income tax rate: (6) (5)
After-tax operating profits $ 1,126 $ 685
Invested Capital is calculated in the table below: As at March 31, 2019 2018
Total Assets $ 27,980 $ 27,089 Excluding: Cash and cash equivalents (925) (769) Deferred tax assets (264) (260) Less Current Liabilities (9,980) (10,231) Excluding: Short-term borrowings 335 262 Long-term debt due within one year 122 114 Current portion of operating lease liabilities 176 —
Invested Capital $ 17,444 $ 16,205
Return on Invested Capital is calculated in the table below: For the three months ended March 31, 2019 2018
After-tax operating profits $ 1,126 $ 685
Average Invested Capital $ 16,700 $ 15,917
Return on Invested Capital 27.0% 17.2%
RETURN ON EQUITY Return on Equity is discussed in the "Non-GAAP Performance Measures" section and is calculated in the table below: For the three months ended March 31, 2019 2018
Net income attributable to Magna International Inc. $ 1,106 $ 660
Average Shareholders' Equity $ 11,553 $ 12,003
Return on Equity 38.3% 22.0%
22 Magna International Inc. First Quarter Report 2019
SUBSEQUENT EVENT
CREDIT FACILITY AMENDMENT On April 26, 2019, we amended our $2.75 billion revolving credit facility, including an extension of the maturity date from June 22, 2023 to June 24, 2024.
ACQUISITION OF VIZA GECA SL
In the fourth quarter of 2018, we signed an agreement to acquire 100% of the common shares and voting interest of VIZA Geca SL ["VIZA"], a Spain-based supplier of seat structures and related systems. The transaction was completed on April 29, 2019. The total consideration transferred by us was approximately $100 million [€89 million] in cash, net of cash acquired, and is subject to working capital and other customary purchase price adjustments. The acquisition of VIZA will be accounted for as a business combination under the acquisition method of accounting. We will record the assets acquired and liabilities assumed at their fair values as of the acquisition date. Due to the limited amount of time since the acquisition date, the preliminary acquisition valuation for the business combination is incomplete at this time. As a result, we are unable to provide the amounts recognized as of the acquisition date for the major classes of assets acquired and liabilities assumed, including the information required for valuation of intangible assets and goodwill.
FUTURE CHANGES IN ACCOUNTING POLICIES
Refer to Note 1 - Significant Accounting Policies included in our unaudited interim consolidated financial statements for the three months ended March 31, 2019 included in this Quarterly Report for the impact of recently issued accounting pronouncements.
COMMITMENTS AND CONTINGENCIES
From time to time, we may be contingently liable for litigation, legal and/or regulatory actions and proceedings and other claims. Refer to note 23 of our audited consolidated financial statements for the year ended December 31, 2018, which describes these claims. For a discussion of risk factors relating to legal and other claims/actions against us, refer to "Item 5. Risk Factors" in our Annual Information Form and Annual Report on Form 40-F, each in respect of the year ended December 31, 2018.
CONTROLS AND PROCEDURES
During the three months ended March 31, 2019, we implemented a new lease accounting system and process in response to the adoption of Accounting Standards Codification 842 – Leases, effective January 1, 2019. The operating effectiveness of these changes to our internal control over financial reporting will be evaluated as part of our 2019 annual assessment. Other than as described above, there have been no changes in our internal controls over financial reporting that occurred during the three months ended March 31, 2019 that have materially affected, or are reasonably likely to materially affect, our internal control over financial reporting.
Magna International Inc. First Quarter Report 2019 23
FORWARD-LOOKING STATEMENTS
Certain statements in this MD&A constitute "forward-looking information" or "forward-looking statements" (collectively, "forward-looking statements") and are intended to provide information about management's current expectations and plans. Such forward-looking statements may not be appropriate for other purposes. Forward-looking statements may include financial and other projections, as well as statements regarding our future plans, strategic objectives or economic performance, or the assumptions underlying any of the foregoing, and other statements that are not recitations of historical fact. We use words such as "may", "would", "could", "should", "will", "likely", "expect", "anticipate", "believe", "intend", "plan", "aim", "forecast", "outlook", "project", "estimate", "target" and similar expressions suggesting future outcomes or events to identify forward-looking statements. Forward-looking statements in this MD&A include, but are not limited to, statements relating to:
• industry timeframes for deployment of autonomous driving;
• our expectations for development, validation, testing and other costs related to our advanced driver assistance systems;
• vehicle production volume trends in our key markets;
• factors impacting the performance of our equity-accounted joint ventures in China.
Our forward-looking statements are based on information currently available to us, and are based on assumptions and analyses made by us in light of our experience and our perception of historical trends, current conditions and expected future developments, as well as other factors we believe are appropriate in the circumstances. While we believe we have a reasonable basis for making such forward-looking statements, they are not a guarantee of future performance or outcomes. Whether actual results and developments conform to our expectations and predictions is subject to a number of risks, assumptions and uncertainties, many of which are beyond our control, and the effects of which can be difficult to predict, including, without limitation:
Risks Related to the Automotive Industry
• economic cyclicality;
• regional production volume declines;
• intense competition;
• potential restrictions on free trade;
• trade disputes/tariffs;
Customer and Supplier Related Risks
• concentration of sales with six customers;
• shifts in market shares among vehicles or vehicle segments;
• shifts in consumer "take rates" for products we sell;
• quarterly sales fluctuations;
• potential loss of any material purchase orders;
• a deterioration in the financial condition of our supply base;
Manufacturing Operational Risks
• product and new facility launch risks;
• operational underperformance;
• restructuring costs;
• impairment charges;
• labour disruptions;
• supply disruptions;
• climate change risks;
• attraction/retention of skilled labour; IT Security Risk
• IT/Cybersecurity breach; Pricing Risks
• pricing risks between time of quote and start of production;
• price concessions;
• commodity costs;
• declines in scrap steel prices;
Warranty / Recall Risks
• costs to repair or replace defective products;
• warranty costs that exceed warranty provision;
• costs related to a significant recall;
Acquisition Risks
• inherent merger and acquisition risks;
• acquisition integration risk;
Other Business Risks
• risks related to conducting business through joint ventures;
• our ability to consistently develop and commercialize innovative products or processes;
• our changing business risk profile as a result of increased investment in electrification and autonomous driving, including: higher R&D and engineering costs, and challenges in quoting for profitable returns on products for which we may not have significant quoting experience;
• risks of conducting business in foreign markets;
• fluctuations in relative currency values;
• tax risks;
• reduced financial flexibility as a result of an economic shock;
• changes in credit ratings assigned to us; Legal, Regulatory and Other Risks
• antitrust risk;
• legal claims and/or regulatory actions against us; and
• changes in laws and regulations, including those related to vehicle emissions.
In evaluating forward-looking statements or forward-looking information, we caution readers not to place undue reliance on any forward-looking statement, and readers should specifically consider the various factors which could cause actual events or results to differ materially from those indicated by such forward-looking statements, including the risks, assumptions and uncertainties above which are discussed in greater detail in this document under the section titled "Industry Trends and Risks" and set out in our Annual Information Form filed with securities commissions in Canada and our annual report on Form 40-F filed with the United States Securities and Exchange Commission, and subsequent filings.
24 Magna International Inc. First Quarter Report 2019
MAGNA INTERNATIONAL INC. CONSOLIDATED STATEMENTS OF INCOME [Unaudited] [U.S. dollars in millions, except per share figures] Three months ended March 31, Note 2019 2018
Sales $ 10,591 $ 10,792
Costs and expenses
Cost of goods sold 9,164 9,293 Depreciation and amortization 321 315 Selling, general and administrative 421 396 Interest expense, net 31 21 Equity income (35) (87) Other (income) expense, net 4 (679) 3
Income from operations before income taxes 1,368 851 Income taxes 267 182
Net income 1,101 669 Loss (Income) attributable to non-controlling interests 5 (9)
Net income attributable to Magna International Inc. $ 1,106 $ 660
Earnings per Common Share: 5
Basic $ 3.40 $ 1.84 Diluted $ 3.39 $ 1.83
Cash dividends paid per Common Share $ 0.365 $ 0.330
Weighted average number of Common Shares outstanding
during the period [in millions]: 5 Basic 325.1 357.7 Diluted 326.3 359.9
See accompanying notes
Magna International Inc. First Quarter Report 2019 25
MAGNA INTERNATIONAL INC. CONSOLIDATED STATEMENTS OF COMPREHENSIVE INCOME [Unaudited] [U.S. dollars in millions] Three months ended March 31, Note 2019 2018
Net income $ 1,101 $ 669
Other comprehensive income, net of tax: 15
Net unrealized gain on translation of net investment in foreign operations 27 134
Net unrealized gain (loss) on cash flow hedges 37 (21) Reclassification of net loss (gain) on cash flow hedges
to net income 18 (1) Reclassification of net loss on pensions to net income 1 2
Other comprehensive income 83 114
Comprehensive income 1,184 783 Comprehensive income attributable to non-controlling interests (7) (26)
Comprehensive income attributable to Magna International Inc. $ 1,177 $ 757
See accompanying notes
26 Magna International Inc. First Quarter Report 2019
MAGNA INTERNATIONAL INC. CONSOLIDATED BALANCE SHEETS [Unaudited] [U.S. dollars in millions] As at As at March 31, December 31, Note 2019 2018
ASSETS Current assets Cash and cash equivalents 6 $ 925 $ 684 Accounts receivable 2 7,446 6,548 Inventories 7 3,501 3,403 Prepaid expenses and other 222 193 Income taxes receivable 53 57 Assets held for sale 3 — 949
LIABILITIES AND SHAREHOLDERS' EQUITY Current liabilities Short-term borrowings 11 $ 335 $ 1,098 Accounts payable 6,484 6,094 Accrued salaries and wages 860 769 Other accrued liabilities 12 2,003 1,734 Long-term debt due within one year 122 201 Current portion of operating lease liabilities 9 176 — Liabilities held for sale 3 — 408
Common Shares [issued: 322,053,641; December 31, 2018 – 327,339,095] 14 3,340 3,380
Contributed surplus 129 120 Retained earnings 9,101 8,376 Accumulated other comprehensive loss 15 (1,090) (1,175)
11,480 10,701 Non-controlling interests 467 458
11,947 11,159
$ 27,980 $ 25,945
See accompanying notes
Magna International Inc. First Quarter Report 2019 27
MAGNA INTERNATIONAL INC. CONSOLIDATED STATEMENTS OF CASH FLOWS [Unaudited] [U.S. dollars in millions] Three months ended March 31, Note 2019 2018
Cash provided from (used for): OPERATING ACTIVITIES Net income $ 1,101 $ 669 Items not involving current cash flows 6 (213) 363
888 1,032 Changes in operating assets and liabilities 1, 6 (294) (455)
Cash provided from operating activities 594 577
INVESTMENT ACTIVITIES Fixed asset additions (251) (243) Increase in investments, other assets and intangible assets (82) (114) Proceeds from disposition 86 29 Proceeds on sale of business 3 1,129 —
Cash provided from (used for) investing activities 882 (328)
FINANCING ACTIVITIES Issues of debt 5 15 (Decrease) Increase in short-term borrowings (774) 1 Repayments of debt (86) (13) Contributions to subsidiaries by non-controlling interests 2 — Issues of Common Shares on exercise of stock options 8 5 Shares repurchased for tax withholdings on vesting of equity awards (3) — Repurchase of Common Shares 14 (284) (103) Dividends (119) (118)
Cash used for financing activities (1,251) (213)
Effect of exchange rate changes on cash, cash equivalents and
restricted cash equivalents 14 10
Net increase in cash, cash equivalents and restricted
cash equivalents during the period 239 46 Cash, cash equivalents and restricted cash equivalents,
beginning of period 802 839
Cash, cash equivalents and restricted cash equivalents, end of period 6 $ 1,041 $ 885
See accompanying notes
28 Magna International Inc. First Quarter Report 2019
MAGNA INTERNATIONAL INC. CONSOLIDATED STATEMENTS OF CHANGES IN EQUITY [Unaudited] [U.S. dollars in millions]
Common Shares Contri- Non- Stated buted Retained controlling Total Note Number Value Surplus Earnings AOCL (i) Interest Equity
Balance, December 31, 2018, as adjusted 327.3 $ 3,380 $ 120 $ 8,351 $ (1,175) $ 458 $ 11,134 Net income 1,106 (5) 1,101 Other comprehensive income 71 12 83 Contributions by non-controlling interests 2 2 Sale of business 3 8 8 Shares issued on exercise of stock options 0.2 10 (2) 8 Release of stock and stock units 0.1 6 (6) — Shares repurchased for tax withholdings on vesting of equity rewards (0.1) (3) (3) Repurchase and cancellation under normal course issuer bid 14 (5.6) (59) (231) 6 (284) Stock-based compensation expense 17 17 Dividends paid 0.2 3 (122) (119)
Magna International Inc. First Quarter Report 2019 29
MAGNA INTERNATIONAL INC. NOTES TO INTERIM CONSOLIDATED FINANCIAL STATEMENTS [Unaudited] [All amounts in U.S. dollars and all tabular amounts in millions unless otherwise noted]
1. SIGNIFICANT ACCOUNTING POLICIES
[a] Basis of presentation The unaudited interim consolidated financial statements of Magna International Inc. and its subsidiaries [collectively "Magna" or the "Company"] have been prepared in U.S. dollars following accounting principles generally accepted in the United States of America ["GAAP"]. The unaudited interim consolidated financial statements do not conform in all respects to the requirements of GAAP for annual financial statements. Accordingly, these unaudited interim consolidated financial statements should be read in conjunction with the December 31, 2018 audited consolidated financial statements and notes thereto included in the Company's 2018 Annual Report. The unaudited interim consolidated financial statements reflect all adjustments, which consist only of normal and recurring adjustments, necessary to present fairly the financial position at March 31, 2019 and the results of operations, changes in equity and cash flows for the three-months ended March 31, 2019 and 2018.
[b] Recently adopted Accounting Standards
Leases In February 2016, the FASB issued ASU No. 2016-02, "Leases: Topic 842 (ASU 2016-02)", to supersede nearly all existing lease guidance under GAAP. The Company adopted the standard on January 1, 2019 using a modified retrospective transition approach, without restatement of the comparative period’s financial information, as permitted by the transition guidance. The adoption of the new standard resulted in a cumulative-effect adjustment to retained earnings of $25 million. The Company has elected certain practical expedients including not to reassess whether any expired or existing contract is or contains a lease, the lease classification of any expired or existing lease, and not to reassess any initial direct costs for any existing leases. In addition, the Company has elected to use the hindsight, practical expedient. The most significant impact on the Consolidated Financial Statements was the recognition of Right-of-use ["ROU"] assets and lease liabilities for operating leases, while the accounting for finance leases remained substantially unchanged. On January 1, 2019, the Company recognized operating lease liabilities of $1.8 billion and right-of-use assets of $1.8 billion based on the present value of the remaining lease payments over the lease term. The adoption of the new standard did not have a material impact on the Company's results of operations or cash flows.
[c] Seasonality
The Company's businesses are generally not seasonal. However, the Company's sales and profits are closely related to its automotive customers' vehicle production schedules. The Company's largest North American customers typically halt production for approximately two weeks in July and one week in December. Additionally, many of the Company's customers in Europe typically shutdown vehicle production during portions of August and one week in December.
2. REVENUE RECOGNITION
[a] Disaggregation of Revenue
Total tooling and other sales were $149.0 million and $177.6 million for the three months ended March 31, 2019 and 2018, respectively. For revenues disaggregated by product group and geography, refer to Segmented Information [note 18].
[b] Contract Assets and Liabilities
The Company's unbilled accounts receivable balance was $274 million as at March 31, 2019, and $293 million as at December 31, 2018. Accounts receivable related to production, tooling and engineering sales were $4.5 billion as of March 31, 2019 and $4.3 billion as at December 31, 2018. Customer advances are recorded as deferred revenue [a contract liability]. The Company's contract liability balance was $176 million as at March 31, 2019 and $176 million as at December 31, 2018. The amount of revenue recognized for the three-month period ended March 31, 2019 that was included in the deferred revenue balance at the beginning of the period was $25 million.
30 Magna International Inc. First Quarter Report 2019
MAGNA INTERNATIONAL INC. NOTES TO INTERIM CONSOLIDATED FINANCIAL STATEMENTS [Unaudited] [All amounts in U.S. dollars and all tabular amounts in millions unless otherwise noted]
3. SALE OF BUSINESS
On March 29, 2019, the Company completed the sale of its global Fluid Pressure & Controls ["FP&C"] business to Hanon Systems for total consideration of $1.23 billion. The business was included in the Company's Power & Vision segment and did not meet the criteria to be classified as a discontinued operation. The following table summarizes the carrying value of the major classes of assets and liabilities of the FP&C business which were reflected as held for sale in the consolidated balance sheets at December 31, 2018:
December 31,
2018
Accounts receivable $ 258 Inventories 140 Prepaid expenses and other 4 Investments 4 Fixed assets, net 320 Goodwill 157 Deferred tax assets 17 Other assets 11 Intangibles 38
Assets held for sale $ 949
Accounts payable $ 226 Accrued salaries and wages 30 Other accrued liabilities 76 Income taxes payable 6 Long-term employee benefit liabilities 62 Other long-term liabilities 3 Deferred tax liabilities 5
Liabilities held for sale $ 408
The Company recognized a gain on the sale within other (income) expense, net as follows: March 29, 2019
Proceeds on disposal, net of transaction costs $ 1,168 Net assets disposed 652
516 Income taxes 78
Gain on divestiture, net of tax $ 438
Consideration associated with the sale remains subject to further adjustments, primarily related to working capital. The Company does not anticipate significant continuing involvement with the disposed FP&C business subsequent to the close of the transaction.
Magna International Inc. First Quarter Report 2019 31
MAGNA INTERNATIONAL INC. NOTES TO INTERIM CONSOLIDATED FINANCIAL STATEMENTS [Unaudited] [All amounts in U.S. dollars and all tabular amounts in millions unless otherwise noted]
4. OTHER (INCOME) EXPENSE, NET
Three months ended
March 31, 2019 2018
First Quarter
Gain on the sale of Business [a] $ (516) $ — Unrealized gains on investment revaluations [b] (177) — Restructuring [c] 14 3
$ (679) $ 3
[a] Gain on the sale of Business [note 3]
During the first quarter of 2019, the Company recorded a gain on the sale of the FP&C business of $516 million [$438 million after tax].
[b] Unrealized gains on investment revaluation
During the first quarter of 2019, the Company recorded unrealized gains of $177 million [$151 million after tax], substantially related to the initial public offering for Lyft, Inc. As a result of the initial public offering, the Company's private equity investment was converted to publicly traded equity securities.
[c] Restructuring
During the first quarter of 2019, the Company recorded net restructuring charges of $14 million [$14 million after tax] for its Body Exteriors & Structures operations.
During the first quarter of 2018, the Company recorded net restructuring charges of $3 million [$3 million after tax], for its Power & Vision operations.
5. EARNINGS PER SHARE
Three months ended March 31,
2019 2018
Basic earnings per Common Share:
Net income attributable to Magna International Inc. $ 1,106 $ 660
Weighted average number of Common Shares outstanding 325.1 357.7
Basic earnings per Common Share $ 3.40 $ 1.84
Diluted earnings per Common Share [a]:
Net income attributable to Magna International Inc. $ 1,106 $ 660
Weighted average number of Common Shares outstanding 325.1 357.7 Adjustments Stock options and restricted stock 1.2 2.2
326.3 359.9
Diluted earnings per Common Share $ 3.39 $ 1.83
[a] For the three months ended March 31, 2019, diluted earnings per Common Share excluded 3.5 million Common Shares issuable under the Company's Incentive Stock Option Plan because these options were not "in-the-money". The dilutive effect of participating securities using the two-class method was excluded from the calculation of earnings per share because the effect would be immaterial.
32 Magna International Inc. First Quarter Report 2019
MAGNA INTERNATIONAL INC. NOTES TO INTERIM CONSOLIDATED FINANCIAL STATEMENTS [Unaudited] [All amounts in U.S. dollars and all tabular amounts in millions unless otherwise noted]
6. DETAILS OF CASH FROM OPERATING ACTIVITIES
[a] Cash, cash equivalents and restricted cash equivalents: March 31, December 31,
2019 2018
Bank term deposits and bankers' acceptances $ 375 $ 314 Cash 550 370
Cash and cash equivalents 925 684 Restricted cash equivalents included in prepaid expenses [note 11] 116 118
$ 1,041 $ 802
[b] Items not involving current cash flows:
Three months ended March 31, 2019 2018
Depreciation and amortization $ 321 $ 315 Amortization of other assets included in cost of goods sold 59 36 Other non-cash charges 29 10 Deferred income taxes 60 (12) Equity income in excess of dividends received 11 14 Gain on sale of business [note 3] (516) — Non-cash portion of Other (income) expense, net [note 4] (177) —
$ (213) $ 363
[c] Changes in operating assets and liabilities:
Three months ended March 31, 2019 2018
Accounts receivable $ (946) $ (1,328) Inventories (107) 1 Prepaid expenses and other (32) (15) Accounts payable 400 404 Accrued salaries and wages 87 113 Other accrued liabilities 271 307 Income taxes payable 33 63
$ (294) $ (455)
7. INVENTORIES
Inventories consist of: March 31, December 31, 2019 2018
Raw materials and supplies $ 1,278 $ 1,282 Work-in-process 345 331 Finished goods 419 408 Tooling and engineering 1,459 1,382
$ 3,501 $ 3,403
Tooling and engineering inventory represents costs incurred on tooling and engineering services contracts in excess of billed and unbilled amounts included in accounts receivable.
Magna International Inc. First Quarter Report 2019 33
MAGNA INTERNATIONAL INC. NOTES TO INTERIM CONSOLIDATED FINANCIAL STATEMENTS [Unaudited] [All amounts in U.S. dollars and all tabular amounts in millions unless otherwise noted]
[a] The Company has two investees that are variable interest entities ["VIEs"]. The Company has determined that it is the
primary beneficiary and has the power to direct the activities that are considered most significant to these entities. As a result, the assets, liabilities, and results of operations of these variable interest entities are included in the Company's Interim Consolidated Financial Statements. The Company's maximum exposure to any potential losses associated with these affiliated companies is limited to its investment, which was $126 million at March 31, 2019, and $101 million at December 31, 2018.
The carrying amounts and classification of assets and liabilities included in the Company's consolidated
balance sheet related to the consolidated VIEs are as follows: March 31, December 31,
2019 2018
Current assets $ 210 $ 207 Noncurrent assets 113 118
Total assets $ 323 $ 325
Current liabilities $ 191 $ 218 Noncurrent liabilities 6 6
Total liabilities $ 197 $ 224
Assets recognized as a result of consolidating these VIEs do not represent additional assets that could be used to satisfy claims against the Company's general assets. Conversely, liabilities recognized as a result of consolidating these VIEs do not represent additional claims on the Company's general assets; rather, they represent claims against the specific assets of the consolidated VIEs.
[b] The Company values its investments in publicly traded equity securities using the closing price on the measurement
date, as reported on the stock exchange on which the securities are traded.
34 Magna International Inc. First Quarter Report 2019
MAGNA INTERNATIONAL INC. NOTES TO INTERIM CONSOLIDATED FINANCIAL STATEMENTS [Unaudited] [All amounts in U.S. dollars and all tabular amounts in millions unless otherwise noted]
9. LEASES
The Company determines if an arrangement is a lease or contains a lease at inception. The Company has entered into leases primarily for real estate, manufacturing equipment and vehicles. The Company's leases have terms which range from 1 year to 33 years, excluding land use rights which generally extend over 90 years. These leases often include options to extend the term of the lease for up to 12 years or to terminate the lease within 1 year. When it is reasonably certain that the option will be exercised, the impact of the option is included in the lease term for purposes of determining total future lease payments. Leases with an initial term of 12 months or less are not recorded on the balance sheet. The Company recognizes operating lease expense for these leases on a straight-line basis over the lease term.
Operating lease right-of-use ["ROU"] assets and operating lease liabilities are recognized based on the present value of the future lease payments over the lease term at the commencement date. As the rate implicit in the lease is not readily determinable for the Company's operating leases, an incremental borrowing rate is generally used based on information available at the lease commencement date to determine the present value of future lease payments. A majority of the Company's leases for manufacturing facilities are subject to variable lease-related payments, such as escalation clauses based on consumer price index ["CPI"] rates or other similar indices. Variable payments that are based on an index or a rate are included in the recognition of the Company’s right-of-use assets and lease liabilities using the index or rate at lease commencement. Subsequent changes to these lease payments due to rate or index updates are recorded as lease expense in the period incurred.
The Company's lease agreements generally exclude non-lease components. As a result, non-lease components are accounted for separately for all classes of assets and expensed as incurred. In addition, the Company's lease agreements do not contain any material residual value guarantees or material restrictive covenants. Operating leases are included in operating lease right-of-use assets, long-term debt due within one year and operating lease liabilities, and finance leases are included in fixed assets, net, long-term debt due within one year, and long-term debt on the Company's consolidated balance sheet. The Company's finance leases were not material for any of the periods presented.
Costs associated with the Company's operating lease expense were as follows:
Supplemental information related to the Company's operating leases was as follows:
Three months ended March 31,
(in millions except for percent and period data) 2019
Operating cash flows – cash paid relating to operating leases $ 84 Right-of-use assets obtained in exchange for new operating lease liabilities $ 17 Weighted-average remaining lease term – operating leases, in years 11 years Weighted-average discount rate – operating leases 4.9%
Magna International Inc. First Quarter Report 2019 35
MAGNA INTERNATIONAL INC. NOTES TO INTERIM CONSOLIDATED FINANCIAL STATEMENTS [Unaudited] [All amounts in U.S. dollars and all tabular amounts in millions unless otherwise noted]
9. LEASES (CONTINUED)
At March 31, 2019, the Company had commitments under operating leases requiring annual payments as follows:
As of March 31, 2019, the Company has additional operating leases, primarily for manufacturing facilities, that have not yet commenced of $18 million. These operating leases will commence during 2019 and have lease terms of 4 to 7 years.
The Company's future minimum lease commitments, as of December 31, 2018, under Accounting Standard Codification Topic 840, the predecessor to Topic 842, were as follows: Total
For the year ended December 31, 2018, operating lease expense was $361 million, reflected in Selling, general and administrative expenses in the consolidated statement of income.
10. OTHER ASSETS
Other assets consist of: March 31, December 31, 2019 2018
Preproduction costs related to long-term supply agreements with contractual guarantee for reimbursement $ 719 $ 741 Long-term receivables 198 198 Pension overfunded status 18 18 Unrealized gain on cash flow hedges 14 9 Other, net 28 22
$ 977 $ 988
36 Magna International Inc. First Quarter Report 2019
MAGNA INTERNATIONAL INC. NOTES TO INTERIM CONSOLIDATED FINANCIAL STATEMENTS [Unaudited] [All amounts in U.S. dollars and all tabular amounts in millions unless otherwise noted]
11. SHORT-TERM BORROWINGS
The Company's short-term borrowings consist of the following:
March 31, December 31, 2019 2018
Bank indebtedness [i] $ 25 $ 35 Commercial paper [ii] 310 1,063
$ 335 $ 1,098
[i] The Company has an agreement for a credit facility that is drawn in euros. The Company is required to secure any
amounts drawn on the facility with a USD cash deposit of 105% of the outstanding euro balance. As at March 31, 2019, the gross amount outstanding under the credit facility was $110 million [€98 million]. The credit agreement includes a netting arrangement with the bank that provides for the legal right of setoff. Accordingly, as at March 31, 2019, this liability balance was offset against the related restricted cash equivalent deposit of $116 million. The remaining net deposit of $6 million was included in the prepaid expenses and other balance, and is restricted under the terms of the loan. As at December 31, 2018 the gross amount outstanding under the credit facility was $112 million [€98 million], and the net deposit included in the prepaid expenses and other balance was $6 million.
[ii] The Company has a U.S. commercial paper program [the "U.S. Program"] and a euro-commercial paper program [the
"euro-Program"]. Under the U.S. Program, the Company may issue U.S. commercial paper notes [the "U.S. notes"] up to a maximum aggregate amount of U.S. $1 billion. The U.S. Program is supported by the Company's existing global credit facility. As of March 31, 2019, $310 million [2018 – $903 million] of U.S notes were outstanding, with a weighted-average interest rate of 2.75% [2018 – 3.00%], and maturities less than three months.
Under the euro-Program, the Company may issue euro-commercial paper notes [the "euro notes"] up to a maximum aggregate amount of €500 million or its equivalent in alternative currencies. The euro notes issued are guaranteed by the Company's existing global credit facility. As of December 31, 2018, $160 million [€140 million] of euro notes were outstanding, with a negative weighted-average interest rate of 0.24%, and maturities less than three months. There were no amounts outstanding as of March 31, 2019.
12. WARRANTY
The following is a continuity of the Company's warranty accruals: 2019 2018
Balance, beginning of period $ 208 $ 255 Expense, net 21 32 Settlements (24) (17) Foreign exchange and other 4 2
Balance, March 31 $ 209 $ 272
13. LONG-TERM EMPLOYEE BENEFIT LIABILITIES
The Company recorded long-term employee benefit expenses as follows:
Three months ended March 31,
2019 2018
Defined benefit pension plans and other $ 3 $ 2 Termination and long-term service arrangements 6 7
$ 9 $ 9
Magna International Inc. First Quarter Report 2019 37
MAGNA INTERNATIONAL INC. NOTES TO INTERIM CONSOLIDATED FINANCIAL STATEMENTS [Unaudited] [All amounts in U.S. dollars and all tabular amounts in millions unless otherwise noted]
14. CAPITAL STOCK
[a] During the first quarter of 2019, the Company repurchased 5,661,112 shares under a normal course issuer bid for cash
consideration of $284 million. [b] The following table presents the maximum number of shares that would be outstanding if all the dilutive instruments
outstanding at May 8, 2019 were exercised or converted:
Common Shares 319,969,867 Stock options (i) 9,271,596
329,241,463
(i) Options to purchase Common Shares are exercisable by the holder in accordance with the vesting provisions and upon payment
of the exercise price as may be determined from time to time pursuant to the Company's stock option plans.
15. ACCUMULATED OTHER COMPREHENSIVE LOSS
The following is a continuity schedule of accumulated other comprehensive loss: 2019 2018
Accumulated net unrealized loss on translation of net investment in foreign operations (i)
Balance, beginning of period $ (917) $ (456) Net unrealized gain 15 117 Repurchase of shares under normal course issuer bid 6 2
Balance, March 31 (896) (337)
Accumulated net unrealized gain (loss) on cash flow hedges (ii) Balance, beginning of period (68) 39
Net unrealized gain (loss) 37 (21) Reclassification of net loss (gain) to net income 18 (1)
Balance, March 31 (13) 17
Accumulated net unrealized loss on pensions (iii)
Balance, beginning of period (190) (183) Reclassification of net loss to net income 1 2 Sale of business 8 —
Balance, March 31 (181) (181)
Total accumulated other comprehensive loss $ (1,090) $ (501)
The impact on net income of amounts reclassified from AOCL were immaterial for the three months ended March 31, 2019 and 2018, respectively.
38 Magna International Inc. First Quarter Report 2019
MAGNA INTERNATIONAL INC. NOTES TO INTERIM CONSOLIDATED FINANCIAL STATEMENTS [Unaudited] [All amounts in U.S. dollars and all tabular amounts in millions unless otherwise noted]
15. ACCUMULATED OTHER COMPREHENSIVE LOSS (CONTINUED)
(i) The amount of income tax benefit that has been netted in the accumulated net unrealized loss on translation of net investment in foreign operations is as follows:
2019 2018
Balance, beginning of period $ — $ 7
Net unrealized loss — —
Balance, March 31 $ — $ 7
(ii) The amount of income tax benefit that has been netted in the accumulated net unrealized gain (loss) on cash flow hedges is as
follows:
2019 2018
Balance, beginning of period $ 23 $ (12) Net unrealized (gain) loss (13) 5
Reclassification of net loss to net income (6) —
Balance, March 31 $ 4 $ (7)
(iii) The amount of income tax benefit that has been netted in the accumulated net unrealized loss on pensions is as follows:
2019 2018
Balance, beginning of period $ 21 $ 17
Net unrealized loss — —
Balance, March 31 $ 21 $ 17
The amount of other comprehensive loss that is expected to be reclassified to net income over the next 12 months is $6 million.
Magna International Inc. First Quarter Report 2019 39
MAGNA INTERNATIONAL INC. NOTES TO INTERIM CONSOLIDATED FINANCIAL STATEMENTS [Unaudited] [All amounts in U.S. dollars and all tabular amounts in millions unless otherwise noted]
16. FINANCIAL INSTRUMENTS
[a] The Company's financial assets and financial liabilities consist of the following:
March 31, December 31, 2019 2018
Financial assets
Cash and cash equivalents $ 925 $ 684 Restricted cash equivalents 116 118 Accounts receivable 7,446 6,548 Publicly traded and private equity investments 509 323 Severance investments 1 3 Long-term receivables included in other assets 198 198
Financial assets held for sale [note 3] Accounts receivable held for sale — 258 Severance investments held for sale — 1
$ 9,195 $ 8,133
Financial liabilities
Bank indebtedness $ 25 $ 35 Commercial paper 310 1,063 Long-term debt (including portion due within one year) 3,184 3,285 Accounts payable 6,484 6,094
Financial liabilities held for sale [note 3] Accounts payable held for sale — 226
$ 10,003 $ 10,703
Derivatives designated as effective hedges, measured at fair value
Foreign currency contracts Prepaid expenses $ 25 $ 25 Other assets 14 9 Other accrued liabilities (28) (61) Other long-term liabilities (21) (40)
$ (10) $ (67)
[b] Derivatives designated as effective hedges, measured at fair value
The Company presents derivatives that are designated as effective hedges at gross fair values in the consolidated balance sheets. However, master netting and other similar arrangements allow net settlements under certain conditions. The following table shows the Company's derivative foreign currency contracts at gross fair value as reflected in the consolidated balance sheets and the unrecognized impacts of master netting arrangements: Gross Gross amounts amounts presented not offset in consolidated in consolidated balance sheets balance sheets Net amounts
40 Magna International Inc. First Quarter Report 2019
MAGNA INTERNATIONAL INC. NOTES TO INTERIM CONSOLIDATED FINANCIAL STATEMENTS [Unaudited] [All amounts in U.S. dollars and all tabular amounts in millions unless otherwise noted]
16. FINANCIAL INSTRUMENTS (CONTINUED)
[c] Fair value
The Company determined the estimated fair values of its financial instruments based on valuation methodologies it believes are appropriate; however, considerable judgment is required to develop these estimates. Accordingly, these estimated fair values are not necessarily indicative of the amounts the Company could realize in a current market exchange. The estimated fair value amounts can be materially affected by the use of different assumptions or methodologies. The methods and assumptions used to estimate the fair value of financial instruments are described below:
Cash and cash equivalents, restricted cash equivalents, accounts receivable, short-term borrowings and accounts payable. Due to the short period to maturity of the instruments, the carrying values as presented in the consolidated balance sheets are reasonable estimates of fair values.
Publicly traded and private equity securities The fair value of the Company's investments in publicly traded equity securities is determined using the closing price on the measurement date, as reported on the stock exchange on which the securities are traded. [Level 1 input based on the GAAP fair value hierarchy.] The Company estimates the value of its private equity securities based on valuation methods using the observable transaction price at the transaction date and other observable inputs including rights and obligations of the securities held by the Company. [Level 3 input based on the GAAP fair value hierarchy.]
Commercial Paper Due to the short period to maturity of the commercial paper, the carrying value as presented in the consolidated balance sheet is a reasonable estimate of its fair value. Term debt The Company's term debt includes $122 million due within one year. Due to the short period to maturity of this debt, the carrying value as presented in the consolidated balance sheets is a reasonable estimate of its fair value. Senior Notes The fair value of our Senior Notes are classified as Level 1 when we use quoted prices in active markets and Level 2 when the quoted prices are from less active markets or when other observable inputs are used to determine fair value. At March 31, 2019, the net book value of the Company's Senior Notes was $3.01 billion and the estimated fair value was $3.13 billion.
[d] Credit risk
The Company's financial assets that are exposed to credit risk consist primarily of cash and cash equivalents, restricted cash equivalents, accounts receivable, and foreign exchange forward contracts with positive fair values.
Cash and cash equivalents and restricted cash equivalents which consists of short-term investments, are only invested in bank term deposits and bank commercial paper with an investment grade credit rating. Credit risk is further reduced by limiting the amount which is invested in certain major financial institutions.
The Company is also exposed to credit risk from the potential default by any of its counterparties on its foreign exchange forward contracts. The Company mitigates this credit risk by dealing with counterparties who are major financial institutions that the Company anticipates will satisfy their obligations under the contracts.
In the normal course of business, the Company is exposed to credit risk from its customers, substantially all of which are in the automotive industry and are subject to credit risks associated with the automotive industry. For the three month period ended March 31, 2019, sales to the Company's six largest customers represented 76% of the Company's total sales, and substantially all of the Company's sales are to customers in which it has ongoing contractual relationships.
Magna International Inc. First Quarter Report 2019 41
MAGNA INTERNATIONAL INC. NOTES TO INTERIM CONSOLIDATED FINANCIAL STATEMENTS [Unaudited] [All amounts in U.S. dollars and all tabular amounts in millions unless otherwise noted]
16. FINANCIAL INSTRUMENTS (CONTINUED)
[e] Interest rate risk
The Company is not exposed to significant interest rate risk due to the short-term maturity of its monetary current assets and current liabilities. In particular, the amount of interest income earned on the Company's cash and cash equivalents is impacted more by the investment decisions made and the demands to have available cash on hand, than by movements in the interest rates over a given period. In addition, the Company is not exposed to interest rate risk on its term debt and Senior Notes as the interest rates on these instruments are fixed.
[f] Currency risk and foreign exchange contracts
The Company is exposed to fluctuations in foreign exchange rates when manufacturing facilities have committed to the delivery of products for which the selling price has been quoted in currencies other than the facilities' functional currency, and when materials and equipment are purchased in currencies other than the facilities' functional currency. In an effort to manage this net foreign exchange exposure, the Company employs hedging programs, primarily through the use of foreign exchange forward contracts.
At March 31, 2019, the Company had outstanding foreign exchange forward contracts representing commitments to buy and sell various foreign currencies. Significant commitments are as follows: Buys Sells
For Canadian dollars
U.S. amount 264 (1,628) euro amount 10 (7)
For U.S. dollars
Peso amount 8,638 — Euro amount 143 (260)
For euros U.S. amount 312 (169) GBP amount 19 (33) Czech Koruna amount 7,884 — Polish Zlotys amount 589 —
Forward contracts mature at various dates through 2023. Foreign currency exposures are reviewed quarterly.
[g] Equity price risk
The Company holds certain public equity securities as part of its strategic investment in technology. These public equity securities are subject to price risk.
42 Magna International Inc. First Quarter Report 2019
MAGNA INTERNATIONAL INC. NOTES TO INTERIM CONSOLIDATED FINANCIAL STATEMENTS [Unaudited] [All amounts in U.S. dollars and all tabular amounts in millions unless otherwise noted]
17. CONTINGENCIES
From time to time, the Company may become involved in regulatory proceedings, or become liable for legal, contractual and other claims by various parties, including customers, suppliers, former employees, class action plaintiffs and others. On an ongoing basis, the Company attempts to assess the likelihood of any adverse judgments or outcomes to these proceedings or claims, together with potential ranges of probable costs and losses. A determination of the provision required, if any, for these contingencies is made after analysis of each individual issue. The required provision may change in the future due to new developments in each matter or changes in approach such as a change in settlement strategy in dealing with these matters. [a] In September 2014, the Conselho Administrativo de Defesa Economica ["CADE"], Brazil's Federal competition
authority, attended at one of the Company's operating divisions in Brazil to obtain information in connection with an ongoing antitrust investigation relating to suppliers of automotive door latches and related products ["access mechanisms"].
In May 2019, CADE informed the Company that it completed its preliminary investigation and, based on a review of the
evidence, has commenced a formal administrative proceeding into alleged anticompetitive behaviour relating to access mechanisms involving the Company.
Administrative proceedings of this nature can often continue for several years. At this time, management is unable to predict the duration or outcome of the Brazilian administrative proceeding, including whether any operating divisions of the Company will be found liable for any violation of law or the extent or magnitude of any liability, if any. In the event that wrongful conduct is found, CADE may impose administrative penalties or fines taking into account several mitigating and aggravating factors. Administrative fines are tied to the sales in Brazil of the applicable Magna companies in the fiscal year prior to the commencement of the formal administrative proceeding. Magna could also be subject to restitution settlements, civil proceedings and other consequences, including reputational damage.
The Company's policy is to comply with all applicable laws, including antitrust and competition laws. The Company has
completed its previously announced global review focused on antitrust risk and does not currently anticipate any material liabilities in connection with the review.
[b] In certain circumstances, the Company is at risk for warranty costs including product liability and recall costs. Due to
the nature of the costs, the Company makes its best estimate of the expected future costs [note 12]; however, the ultimate amount of such costs could be materially different. The Company continues to experience increased customer pressure to assume greater warranty responsibility. Currently, under most customer agreements, the Company only accounts for existing or probable claims. Under certain complete vehicle engineering and assembly contracts, and with respect to our powertrain systems programs, the Company records an estimate of future warranty-related costs based on the terms of the specific customer agreements, and the specific customer's [or the Company's] warranty experience.
Magna International Inc. First Quarter Report 2019 43
MAGNA INTERNATIONAL INC. NOTES TO INTERIM CONSOLIDATED FINANCIAL STATEMENTS [Unaudited] [All amounts in U.S. dollars and all tabular amounts in millions unless otherwise noted]
18. SEGMENTED INFORMATION
Magna is a global automotive supplier which has complete vehicle engineering and contract manufacturing expertise, as well as product capabilities which include body, chassis, exterior, seating, powertrain, active driver assistance, electronics, mirrors & lighting, mechatronics and roof systems. Magna also has electronic and software capabilities across many of these areas. The Company is organized under four operating segments: Body Exteriors & Structures, Power & Vision, Seating System and Complete Vehicles. These segments have been determined on the basis of technological opportunities, product similarities, and market and operating factors, and are also the Company's reportable segments. The Company's chief operating decision maker uses Adjusted Earnings before Interest and Income Taxes ["Adjusted EBIT"] as the measure of segment profit or loss, since management believes Adjusted EBIT is the most appropriate measure of operational profitability or loss for its reporting segments. Adjusted EBIT is calculated by taking net income from operations and adding back income taxes, interest expense, net, and other (income) expense, net. Certain amounts in the prior period comparatives have been restated to reflect the transfer of assets between the Company’s segments to better reflect utilization of these assets and more accurately measure their operational profitability.
44 Magna International Inc. First Quarter Report 2019
MAGNA INTERNATIONAL INC. NOTES TO INTERIM CONSOLIDATED FINANCIAL STATEMENTS [Unaudited] [All amounts in U.S. dollars and all tabular amounts in millions unless otherwise noted]
18. SEGMENTED INFORMATION (CONTINUED) [a] The following tables show segment information for the Company's reporting segments and a reconciliation of Adjusted EBIT
to the Company's consolidated income before income taxes:
Three months ended March 31, 2019
Depreciation Fixed Total External Adjusted and Equity asset sales sales EBIT [ii] amortization income additions
[i] Included in Corporate and Other Adjusted EBIT are intercompany fees charged to the automotive segments.
[ii] The following table reconciles Net income to Adjusted EBIT:
Three months ended March 31, 2019 2018
Net income $ 1,101 $ 669 Add:
Interest expense, net 31 21 Other (income) expense, net (679) 3 Income taxes 267 182
Adjusted EBIT $ 720 $ 875
Magna International Inc. First Quarter Report 2019 45
MAGNA INTERNATIONAL INC. NOTES TO INTERIM CONSOLIDATED FINANCIAL STATEMENTS [Unaudited] [All amounts in U.S. dollars and all tabular amounts in millions unless otherwise noted]
18. SEGMENTED INFORMATION (CONTINUED) [b] The following table shows Goodwill for the Company's reporting segments:
March 31, December 31, 2019 2018
Body Exteriors and Structures $ 460 $ 459 Power & Vision 1,240 1,260 Seating Systems 146 147 Complete Vehicles 111 113
Total Reportable Segments $ 1,957 $ 1,979
[c] The following table shows Net Assets for the Company's reporting segments:
March 31, December 31, 2019 2018
Body Exteriors and Structures $ 8,264 $ 7,142 Power & Vision 6,563 6,703 Seating Systems 988 815 Complete Vehicles 770 605 Corporate & Other 736 563
Total Reportable Segments $ 17,321 $ 15,828
The following table reconciles Total Assets to Net Assets: March 31, December 31, 2019 2018
Total Assets $ 27,980 $ 25,945 Deduct assets not included in segment net assets:
Cash and cash equivalents (925) (684) Deferred tax assets (264) (300) Long-term receivables from joint venture partners (70) (71) Income taxes receivable (53) (57)
Deduct liabilities included in segment net assets: Accounts payable (6,484) (6,094) Accrued salaries and wages (860) (769) Other accrued liabilities (2,003) (1,734)
Liabilities held for sale — (408)
Segment Net Assets $ 17,321 $ 15,828
46 Magna International Inc. First Quarter Report 2019
MAGNA INTERNATIONAL INC. NOTES TO INTERIM CONSOLIDATED FINANCIAL STATEMENTS [Unaudited] [All amounts in U.S. dollars and all tabular amounts in millions unless otherwise noted]
19. SUBSEQUENT EVENTS
Credit Facility Amendment
On April 26, 2019, the Company amended its $2.75 billion revolving credit facility, including an extension of the maturity date from June 22, 2023 to June 24, 2024. Acquisition of VIZA Geca SL In the fourth quarter of 2018, the Company signed an agreement to acquire 100% of the common shares and voting interest of VIZA Geca SL ["VIZA"], a Spain-based supplier of seat structures and related systems. The transaction was completed on April 29, 2019. The total consideration transferred by the Company was approximately $100 million [€89 million] in cash, net of cash acquired, and is subject to working capital and other customary purchase price adjustments. The acquisition of VIZA will be accounted for as a business combination under the acquisition method of accounting. The Company will record the assets acquired and liabilities assumed at their fair values as of the acquisition date. Due to the limited amount of time since the acquisition date, the preliminary acquisition valuation for the business combination is incomplete at this time. As a result, the Company is unable to provide the amounts recognized as of the acquisition date for the major classes of assets acquired and liabilities assumed, including the information required for valuation of intangible assets and goodwill.