Journal of Information Processing Vol.24 No.2 339–348 (Mar. 2016) [DOI: 10.2197/ipsjjip.24.339] Regular Paper Magnet or Sticky? Measuring Project Characteristics from the Perspective of Developer Attraction and Retention Kazuhiro Y amashita 1,a) Y asutaka Kamei 1,b) Shane McIntosh 2,c) Ahmed E. Hassan 3,d) Naoyasu Ubayashi 1,e) Received: June 30, 2015, Accepted: December 7, 2015 Abstract: Open Source Software (OSS) is vital to both end users and enterprises. As OSS systems are becoming a type of infrastructure, long-term OSS projects are desired. For the survival of OSS projects, the projects need to not only retain existing developers, but also attract new developers to grow. To better understand how projects retain and attract contributors, our preliminary study aimed to measure the personnel attraction and retention of OSS projects using a pair of population migration metrics, called Magnet (personnel attraction) and Sticky (retention) metrics. Be- cause the preliminary study analyzed only 90 projects and the 90 projects are not representative of GitHub, this paper extend the preliminary study to better understand the generalizability of the results by analyzing 16,552 projects of GitHub. Furthermore, we also add a pilot study to investigate the typical duration between releases to find more appro- priate release duration. The study results show that (1) approximately 23% of developers remain in the same projects that the developers contribute to, (2) the larger projects are likely to attract and retain more developers, (3) 53% of terminal projects eventually decay to a state of fewer than ten developers and (4) 55% of attractive projects remain in an attractive category. Keywords: Magnet, Sticky, Developer Transition, Open Source Software, Mining Software Repositories 1. Introduction Open source software (OSS) is vital to both end users and en- terprises. According to a survey conducted by Black Duck, 78% of enterprises run part or all of their business operations on OSS systems * 1 . For example, Red Hat, a leading company of Linux distribution, is enhancing the Linux kernel to develop Enterprise Linux (an enterprise operation system). As OSS systems are be- coming a type of infrastructure, long-term OSS projects are de- sired. The survival of OSS projects depends on their ability to retain contributors. As contributors continue working on a project, they develop more efficient approaches and perform more complicated tasks. Long Term Contributors (LTCs) are particularly important for projects, because these contributors gradually become experts who can write good codes and perform core tasks (e.g., mentoring newcomers) [44]. Besides retaining contributors, OSS projects need to attract new contributors to grow the projects. The importance of new contributors has been emphasized in some studies. According to Kraut et al. [21], new contributors provide innovation, new ideas, and novel work procedures. Qureshi et al. [28] claim that new 1 Kyushu University, Fukuoka 819–0395, Japan 2 McGill University, Montr´ eal, Qu´ ebec, Canada 3 Queen’s University, Kingston, Ontario, Canada a) [email protected]b) [email protected]c) [email protected]d) [email protected]e) [email protected]contributors promote a sustainable community to motivate, en- gage, and retain new contributors. New contributors may also become candidates of new LTCs. For these reasons, retaining contributors and attracting new contributors are crucial for OSS projects. This fact has been widely recognized in literature [21], [31], [33], [43], [45]. These studies focus on the factors that attract and retain staff. For in- stance, Zhou et al. [45] reported that a pro-community attitude is most important for cultivating LTCs in open source projects. Steinmacher et al. [33] modeled 58 social barriers of OSS projects (e.g., not receiving an answer). However, to our knowledge, no study has measured these characteristics using developer transi- tions. Therefore, in this study, we focus on the number of new and existing contributors in OSS projects. We measure the attractive- ness and retention of contributors in OSS projects by two met- rics, called Magnet and Sticky metrics [26]. The Magnet met- ric indicates the number of new developers attracted to a project and Sticky metric indicates the number of existing developers that stay with the project. The Magnet and Sticky metrics are defined in Section 2. These metrics are expected to capture the status of each project in terms of recruiting and retaining contributors. Using the two metrics, we address the following two research questions: * 1 https://www.blackducksoftware.com/future-of-open-source (accessed 2015-06-15) c 2016 Information Processing Society of Japan 339
Transcript
Journal of Information Processing Vol.24 No.2 339–348 (Mar. 2016)
[DOI: 10.2197/ipsjjip.24.339]
Regular Paper
Magnet or Sticky? Measuring Project Characteristics fromthe Perspective of Developer Attraction and Retention
Received: June 30, 2015, Accepted: December 7, 2015
Abstract: Open Source Software (OSS) is vital to both end users and enterprises. As OSS systems are becoming atype of infrastructure, long-term OSS projects are desired. For the survival of OSS projects, the projects need to notonly retain existing developers, but also attract new developers to grow. To better understand how projects retain andattract contributors, our preliminary study aimed to measure the personnel attraction and retention of OSS projectsusing a pair of population migration metrics, called Magnet (personnel attraction) and Sticky (retention) metrics. Be-cause the preliminary study analyzed only 90 projects and the 90 projects are not representative of GitHub, this paperextend the preliminary study to better understand the generalizability of the results by analyzing 16,552 projects ofGitHub. Furthermore, we also add a pilot study to investigate the typical duration between releases to find more appro-priate release duration. The study results show that (1) approximately 23% of developers remain in the same projectsthat the developers contribute to, (2) the larger projects are likely to attract and retain more developers, (3) 53% ofterminal projects eventually decay to a state of fewer than ten developers and (4) 55% of attractive projects remain inan attractive category.
Open source software (OSS) is vital to both end users and en-terprises. According to a survey conducted by Black Duck, 78%of enterprises run part or all of their business operations on OSSsystems *1. For example, Red Hat, a leading company of Linuxdistribution, is enhancing the Linux kernel to develop EnterpriseLinux (an enterprise operation system). As OSS systems are be-coming a type of infrastructure, long-term OSS projects are de-sired.
The survival of OSS projects depends on their ability to retaincontributors. As contributors continue working on a project, theydevelop more efficient approaches and perform more complicatedtasks. Long Term Contributors (LTCs) are particularly importantfor projects, because these contributors gradually become expertswho can write good codes and perform core tasks (e.g., mentoringnewcomers) [44].
Besides retaining contributors, OSS projects need to attractnew contributors to grow the projects. The importance of newcontributors has been emphasized in some studies. According toKraut et al. [21], new contributors provide innovation, new ideas,and novel work procedures. Qureshi et al. [28] claim that new
contributors promote a sustainable community to motivate, en-gage, and retain new contributors. New contributors may alsobecome candidates of new LTCs.
For these reasons, retaining contributors and attracting newcontributors are crucial for OSS projects. This fact has beenwidely recognized in literature [21], [31], [33], [43], [45]. Thesestudies focus on the factors that attract and retain staff. For in-stance, Zhou et al. [45] reported that a pro-community attitudeis most important for cultivating LTCs in open source projects.Steinmacher et al. [33] modeled 58 social barriers of OSS projects(e.g., not receiving an answer). However, to our knowledge, nostudy has measured these characteristics using developer transi-tions.
Therefore, in this study, we focus on the number of new andexisting contributors in OSS projects. We measure the attractive-ness and retention of contributors in OSS projects by two met-rics, called Magnet and Sticky metrics [26]. The Magnet met-ric indicates the number of new developers attracted to a projectand Sticky metric indicates the number of existing developers thatstay with the project. The Magnet and Sticky metrics are definedin Section 2. These metrics are expected to capture the status ofeach project in terms of recruiting and retaining contributors.
Using the two metrics, we address the following two researchquestions:
Journal of Information Processing Vol.24 No.2 339–348 (Mar. 2016)
(RQ1) What Are the Typical Distributions of Projects fromthe Magnet and Sticky Perspectives?Motivation: Applying the concepts of Magnet and Stickyin an OSS context, we seek the project distributions ofthese concepts.Result: 23% of contributors remain with a project. Lagerprojects attract larger number of new contributors thansmaller projects.
(RQ2) How do the Magnet and Sticky values change overtime?Motivation: By investigating the transitions of Magnetand Sticky values, we can capture the temporal evolutionand decay of the projects.Result: 53% of terminal projects eventually decay into astate of have fewer than ten contributors. On the otherhand, 55% of attractive projects keep their popularity.Furthermore, stagnant projects are more likely to decaythan fluctuating projects.
To answer these research questions, we conducted experimentsof 16,552 GitHub projects. GitHub is one of the largest so-cial coding platforms in the world, hosting many types of OSSprojects.
This study is an extended version of our preliminary study (asa short paper of an international conference) [42]. The largestextension is the dataset. Since the dataset that we used for pre-liminary study includes 90 projects that are not randomly selectedand not representative of GitHub *2, in this study, we use 16,552projects that have more than ten forks and developers (cf., Sec-tion 3). Furthermore, we modify the definition of sticky valueto improve the usability and investigate typical duration betweenreleases to avoid ad hoc decision about duration.
The summary of extensions is as below:• Modifying the definitions of Sticky values (Section 2).• Adding a pilot study to investigate the typical duration be-
tween releases (Section 4).• Extending the number of target projects from 90 to 16,552
(RQ1, 2).• Adopting the typical release duration as time period in our
experiments (RQ1, 2).Paper organization. The remainder of the paper is organized asfollows. Section 2 describes out measure of contributor attractive-ness and retention in OSS projects. Section 3 discusses the mo-tivations and approaches of the research questions, overview thedataset, and defines the terminology used throughout the paper.Sections 4 and 5 present the results of pilot studies investigatingthe release duration in OSS projects and studies that we conductusing the large-scale of OSS projects, respectively. Then, we dis-cuss our results in Section 6. Section 7 surveys related work, andSection 8 concludes the paper.
2. Measuring Contributor Retention and At-traction in OSS
This section describes our measurements of personnel reten-tion and attraction in OSS. In this study, we use the Magnet and
Sticky metrics defined by the Pew Research Center [26] for illus-trating the migratory trends of citizens in the United States. TheSticky metric revealed that just 28% of people are born in Alaska,but more than 75% of those born in Texas, remain in their birthstates as adults. Furthermore, the Magnet metric revealed that86% of adult residents of Nevada had migrated from a differentstate.
2.1 Magnet and Sticky in State PopulationsThe Pew Research Center report [26] defines Magnet states as
states that attract a large proportion of adults from other states.Thus, the Magnet metric of a state is the proportion of adult res-idents who were not born in that state, relative to the total statepopulation. The report also defines Sticky states as states that re-tain a large proportion of the people born in that state. Thus, theSticky metric of a state is the proportion of adult residents whowere born in that state, relative to the residents born and living inthe entire United States.
2.2 Magnet and Sticky in OSS ProjectsThe definitions of Magnet and Sticky are unambiguous in pop-
ulation studies, in which a single adult occupies only one state ata time, but are not directly applicable to open source projects, be-cause contributors can contribute to several projects at the sametime. Furthermore, the birth and current residence states of a sin-gle adult are identified from certificates of residence; however,no such document records the projects contributed by a developer.Therefore, if a developer commits to a project during a certain pe-riod, we identify that the developer has joined the project duringthat period. Therefore, the identification depends on the durationof the contribution period. In our preliminary study [42], we ten-tatively assigned the time window of the analysis as one year. Inthe present study, we more rigorously assess the time window assix months in a pilot study, see Section 4.
Using this duration, we divide time into periods. The period ofinterest is denoted the target period (pi). The periods immediatelypreceding and succeeding the target period are called the previousperiod (pi−1) and the following period (pi+1), respectively.
In our preliminary study [42], the Sticky metric was defined asthe proportion of contributors in both pi and pi+1. In this study,we modify the definition to the proportion of contributors in pi−1
and pi. In this manner, we can predict the status of the projects inpi+1 (i.e., the future status).
Therefore, we redefine the Magnet and Sticky metrics as fol-lows:Magnet projects are projects that attract a large proportion of
new contributors. Thus, the magnetism of a project is theproportion of contributors who contributed during a particu-lar period, but not during previous periods.
Sticky projects are projects in which many contributors con-tinue making contributions. Thus, the stickiness of a projectis the proportion of contributors who contributed during aparticular period and also during previous periods.
2.3 Illustrative ExampleThe quantification of our definitions is demonstrated in Fig. 1.
Journal of Information Processing Vol.24 No.2 339–348 (Mar. 2016)
Fig. 1 Calculation examples of our newly defined Magnet and Sticky val-ues.
In this example, we examine two projects during period pi. Thereare six developers (A, B, C, D, E, and F) and two projects (1 and2). Circles show the commits or pull requests contributed by thedevelopers (listed down the left-hand side). For example, whiledeveloper A makes two contributions during period pi, developerB makes no contributions during that period. To calculate theMagnet metric, we observe that three new developers (C, E, andF) join the team at pi, one of whom contributes to project 1 (C),while the others (E and F) contribute to project 2. In this case, theMagnet values of projects 1 and 2 are 1
3 and 23 , respectively.
To calculate the Sticky metrics, we note that two developers(A and B) contributed to project 1 at pi−1, one of whom (A) alsocontributes at pi. Hence, the Sticky value of project 1 is 1
2 . Onedeveloper (D) contributes to project 2 at pi−1, and three develop-ers (D, E, and F) contribute at pi. However, the Sticky metric onlyconsiders the number of contributors during pi−1 and pi. Hence,the Sticky value of project 2 is not 3
1 , but rather 11 .
3. Study Design
This section provides an overview of our study. First, we de-velop our research questions and motivations, then describe ourdataset.
3.1 Research Questions — Motivation and Approach(RQ1) What Are the Typical Distributions of Projects fromthe Magnet and Sticky Perspectives?Motivation. First, we overview the trends of Magnet and Stickyvalues in the OSS context. This research question was addressedin our preliminary study [42], but here we expand the number ofcase study projects from 90 to 16,552. We also reconsider thetime window. In this study, we established the time window assix months in a pilot study.Approach. The Magnet and Sticky values of the studied OSSprojects are calculated as described in Section 2. To visualize thedata, we plot the Magnet and Sticky values of each project againsteach other project, and (similar to Khomh et al. [20]) divide theplot into four quadrants, as done in our preliminary study [42]:Attractive projects (with high Magnet and Sticky values) suc-
cessfully attract new developers while retaining their exist-ing ones.
Fluctuating projects (with high Magnet values, and low Sticky
values) successfully attract new developers but tend to loseexisting ones.
Stagnant projects (with low Magnet values, and high Stickyvalues) retain their existing development team but struggleto attract new members.
Terminal projects (with low Magnet and Sticky values) strug-gle to retain existing developers while failing to attract newones.
The quadrant thresholds can be dynamically configured. Inthis study, we use the median Magnet and Sticky values as thethresholds, as the median is a robust measure that is not heavilyinfluenced by outliers.
As in our preliminary study [42], we focus on the latter sixmonths of the most recently completed year of historical data(i.e., from July to December of 2013). The most recent datasetincludes the largest number of projects.
Note that the Sticky value depends on the number of contrib-utors in both the target and the previous time periods (Fig. 1). Iffew developers have contributed in the previous time period issmall, the Sticky value tends to be high. Therefore, to reduce thenoise in our results, we filter out projects with less than ten de-velopers in the previous time period. We also consider the timeperiod in which the project started. The Sticky value of a start-upproject is 0, because all of the developers are new and no devel-oper has contributed during the previous time period. Therefore,we filter out new projects in the target time period.
Besides an overview of the distribution, we also show typi-cal values of differently sized projects. As mentioned above, theMagnet and Sticky metrics are influenced by the number of to-tal developers in the target and previous time periods. Therefore,we divide projects according to their number of developers, anddisplay the median Magnet and Sticky values of projects in eachsize category.(RQ2) How do the Magnet and Sticky values change overtime?Motivation. By investigating the changes in Magnet and Stickyvalues, we can capture the temporal evolution and decay of theprojects.Approach. We analyze how the aging projects transit amongthe quadrants of Fig. 3. As the quadrant boundaries will likelychange, the boundaries are recalculated in each time period. Inthis study, we track the Magnet and Sticky values from 2000 to2013 (i.e., thorough 28 time periods).
3.2 Overview of DatasetOur dataset is the GitHub dataset “GHTorrent” provided by
Gousios [12] *3. Part of this dataset is provided in the MySQLdatabase and includes diverse software evolution data from alarge collection of OSS projects, such as issue reports, pull re-quests, organizations, followers, stars and labels. We focus onthe code authorship data in the commits and pull requests tables.
GitHub has unique features such as fork and pull request forcollaborative development. GitHub describes Fork as a copy ofa repository. Forking a repository allows you to freely experi-
Journal of Information Processing Vol.24 No.2 339–348 (Mar. 2016)
Table 1 Overview of the GHTorrent dataset used in this study.
Dataset #Users #Repos #Commits #PullReqs
This Study 3,426,046 8,510,504 96,999,485 3,200,428Preliminary Study 499,485 108,718 555,325 78,955
ment with changes without affecting the original project *4. Pullrequest allows users to “tell others about changes you’ve pushedto a repository on GitHub. Once a pull request is sent, interestedparties can review the set of changes, discuss potential modifi-cations, and even push follow-up commits if necessary” *5. Atypical development process on GitHub, driven by fork and pullrequests, proceeds as follows:( 1 ) A developer forks a repository to which he or she hopes to
contribute.( 2 ) The developer makes changes to the fork repository.( 3 ) The developer sends a pull request to the original repository
to reflect his or her changes to the original repository.( 4 ) If the owner of the original repository allows the pull request,
the changes are included in the original repository.Table 1 overviews the dataset used in our study. This dataset is
800 times larger than that accessed in our preliminary study [42].Besides the higher number of repositories, the current dataset in-cludes more users, commits and pull requests than the dataset ofthe preliminary study.
As described above, the entire dataset is divided into sub-datasets covering different time periods. Therefore, we examinethe column created at. However, this column contains uninter-pretable or nonsensical dates such as ’0000-00-00’, ’0000-00-0000:00:00’, and 2025 (as the commit year). As the dates of commitand pull requests are critical to our analysis, we filtered out suchcases.
3.3 DevelopersIn this study, a developer is a person who alters software code.
In the GitHub dataset, developers can either perform the com-mit themselves or send a pull request to an upstream repositorymaintainer. Both actions are viewed as developmental activityin our Magnet and Sticky analyses. According to Kalliamvakouet al. [17], most of the accepted pull requests sent from fork repos-itories are absent in the histories of original repositories. There-fore, we mine the developer information from both the originaland fork repositories. In particular, we obtain the author infor-mation from the retrieved commits. From the pull requests, weobtain the information of actors who send (i.e., open) the pullrequests.
The GitHub system identifies authors as registered or non-registered from the email addresses of the commits *6. If the au-thor of a commit is not registered, GitHub records the author in-formation that can be obtained from Git, such as name and emailaddress, along with a unique id. In this system, some developersare assigned multiple user ids. Therefore, we clean the data using
the tool *7 that matches users with their information recorded inGitHub (e.g., login name, actual name, email address and loca-tion).
3.4 ProjectsNot all of the repositories included in our dataset are software
projects [17]. Other repository categories include, but are not lim-ited to, Experimental (e.g., examples, demonstrations and sam-ples,) and Storage (e.g., configuration files and personal use). Weassume that the number of fork repositories and developers is neg-ligible in these categories, since these repositories do not requirecollaboration with others. To identify software projects, we notethe number of fork repositories and number of developers, bothof which indicate collaborative activity. Projects with less than10 fork repositories and 10 developers are filtered out. The post-filtered dataset includes 16,552 original repositories.
Our study focuses on projects adopting the pull-based model,which excludes the 55% of the GitHub projects using sharedrepository models [13]. Moreover, we filtered projects with fewerthan 10 forks. Therefore, our findings are not generalizable toshared repository models.
4. Pilot Study
In our preliminary study [42], we tentatively assigned the targetperiod of the magnetism and retention calculations as one year.However, the validity of this assignment was not discussed. Inthe present study, the appropriate period is identified in a pilotstudy.
In defect prediction, code review and other studies relying onMining Software Repositories (MSR), experiments are conductedat the release-level [18], [24]. However, when conducting exper-iments across multiple projects, the release-level is inappropriatefor two reasons. First, we desire to compare metrics at the sametime; second, multiple projects are not released simultaneously.
Instead of the release-level, we therefore adopt the representa-tive release duration. Some of the large projects regularly updatetheir products [19]; Google Chrome and Mozilla Firefox updatetheir products every six weeks (i.e., adopt a rapid release model).If all the projects in our dataset are periodically updated at thesame rate, that period becomes a useful parameter in the mag-netism and retention calculations. Therefore, we manually in-spect some projects to determine the constancy of their updateperiods. Unfortunately, unlike Google Chrome and Mozilla Fire-fox, most projects are not regularly upgraded. Hence, to identifythe typical release period of the GitHub projects, we calculate thedurations between the releases of each project.Approach. GitHub releases the products *8 and provides theAPI to access the released information. We extract the releaseinformation (version number and published date) of all targetprojects from the GitHub API. The published and git tag datesare independent, although both dates have the same version nameand release date of the updated version onto GitHub. Although
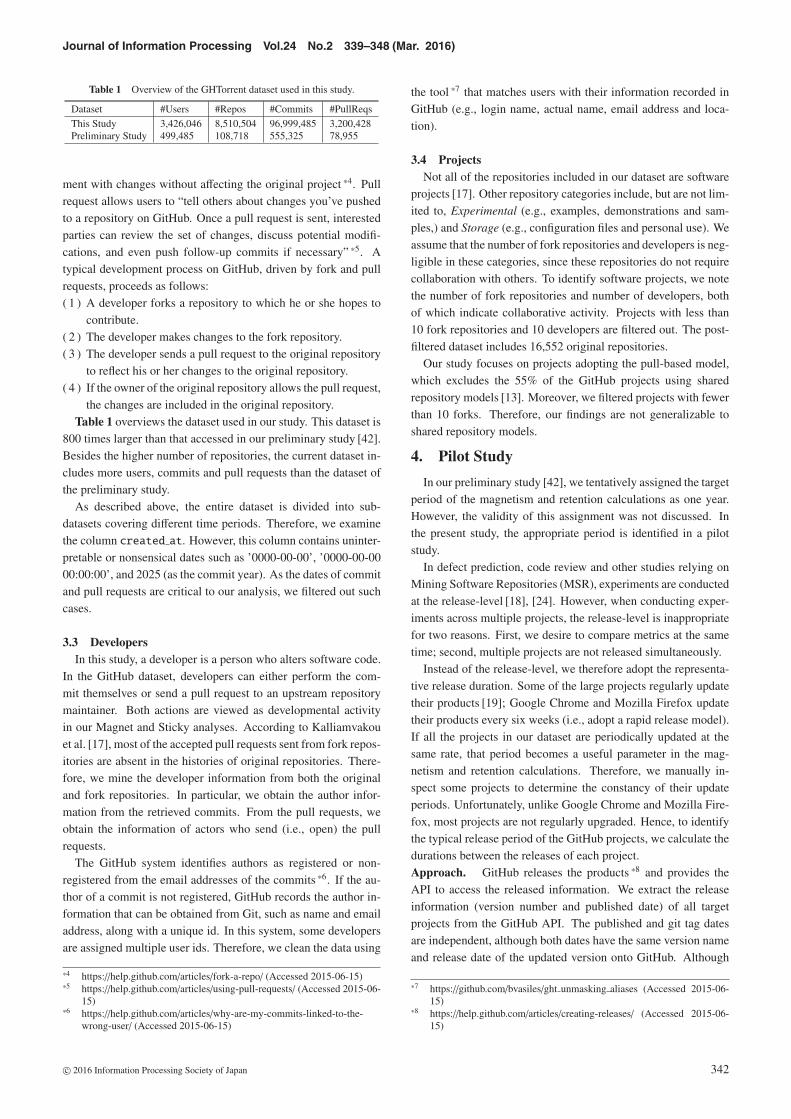
GitHub recommends the semantic labeling of new versions (inMAJOR.MINOR.PATCH number format) [27], some projects donot follow this recommendation. Projects not adopting the se-mantic versioning system are removed from our analysis. We alsoremove alpha versions and release candidates (e.g., 1.0.0-alpha,1.0.0-pre), because such versions are candidates rather than offi-cial releases. After filtering, we extract the release informationof 16,682 versions of 1,778 projects. From this information, wecalculate the durations of Major, Minor and Patch releases.
In the semantic versioning system [27], a major release denotesan update of incompatible API changes, and the version numberchanges from (x.0.0) to (x+1.0.0). Minor releases add func-tionality to a project in a backwards-compatible manner, and alterthe version number from (x.y.0) to (x.y+1.0). Patch releasescorrect backwards-compatible bugs, and are marked by versionnumber changes from (x.y.z) to (x.y.z+1).
Multiple versions (even major upgrades) were occasionally re-leased on the same day, and in different order from their versionnumbers. We presumed that such projects had been moved toGitHub from another hosting service (e.g., SourceForge), and hadbeen previously released. A developer could then release all ver-sions onto GitHub on the same day. Therefore, we filter out up-dates with durations below one day and released in different orderfrom their version numbers.Results. The duration distributions of the major, minor, andpatch updates are presented in Table 2 and Fig. 2. To improve theaccuracy of the pilot study, we focus on durations between the 1stand 3rd quantiles.
Figure 2 reveals clear duration differences between the major,minor, and patch releases. At the patch level, the durations at the
Fig. 3 Distribution of Magnet and Sticky values for the studied projects.
1st and 3rd quantiles are 6 days and 45 days, respectively, with amedian of 18 days (approximately half a month). For minor up-grades, the durations at the 1st and 3rd quantiles are 20 days and117 days, respectively, with a median of 52 days (approximatelytwo months). At the major level, the durations of the 1st and 3rdquantiles are 69 days and 316 days, respectively, and the medianis 168 days (approximately half a year).
New versions of GitHub projects are released in 18 days at
the patch level, 52 days at the minor level and 168 days at the
major level.
The pilot study revealed the typical durations of each level ofreleases. In the following study, we adopt the median duration ofthe major release as the time window, because the major releaseis the most important update of a project.
5. Study Results
(RQ1) What Are the Typical Distributions of Projects fromthe Magnet and Sticky Perspectives?
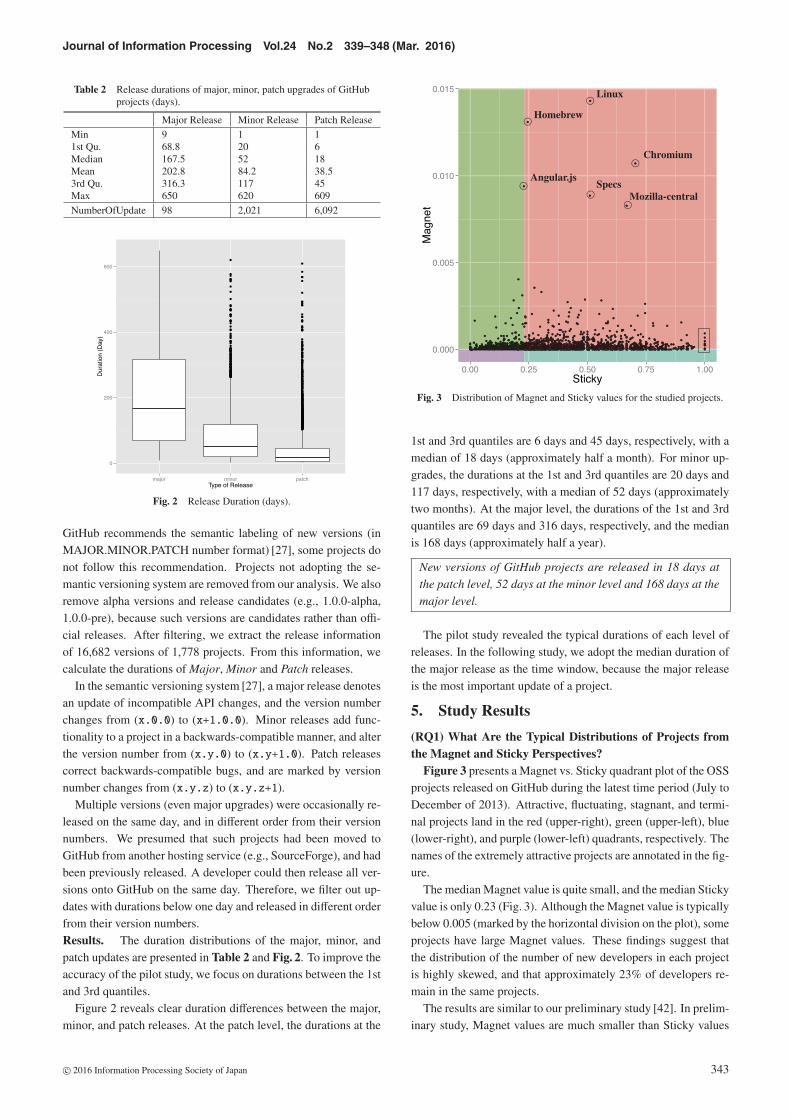
Figure 3 presents a Magnet vs. Sticky quadrant plot of the OSSprojects released on GitHub during the latest time period (July toDecember of 2013). Attractive, fluctuating, stagnant, and termi-nal projects land in the red (upper-right), green (upper-left), blue(lower-right), and purple (lower-left) quadrants, respectively. Thenames of the extremely attractive projects are annotated in the fig-ure.
The median Magnet value is quite small, and the median Stickyvalue is only 0.23 (Fig. 3). Although the Magnet value is typicallybelow 0.005 (marked by the horizontal division on the plot), someprojects have large Magnet values. These findings suggest thatthe distribution of the number of new developers in each projectis highly skewed, and that approximately 23% of developers re-main in the same projects.
The results are similar to our preliminary study [42]. In prelim-inary study, Magnet values are much smaller than Sticky values
and only a few projects have large Magnet value. Furthermore,the median Sticky value is approximately 20%.
Six of the projects have exceptionally high Magnet, namely,Linux, Homebrew, Chromium, Angular.js, Specs, andMozilla-central. Linux is among the most famous projects,and Homebrew is a popular package management tool for MacOS X. The web browser project Chromium is basis of GoogleChrome. Angular.js is the web framework for JavaScript,Specs is a repository for the public CocoaPods *9 specification,and Mozilla-central is a repository for source codes imple-mented by the Mozilla foundation such as Firefox web browser.
The Linux, Chromium, Homebrew and Mozilla-centralprojects are well-known and universally popular. Therefore,many developers are expected to join these projects.
The popularity of Angular.js and CocoaPods during theanalysis period was checked by Google Trends *10, which recordsthe number of query searches on Google in chronological order.In Refs. [6], [40], the popularity of a project is assessed fromthe numbers of web pages indexed by Google and views of theproject page. However, the popularity trends of the projects aredifficult to identify by these indicators. Therefore, we identify thepopularities of the projects thorough Google Trends. The searchnumbers of both Angular.js *11 and CocoaPods *12 were in-creasing from 2013. Therefore, we assume that as the projectsgained popularity from 2013, they increasingly attracted new-comers to their development. This finding suggests that the Mag-net and Sticky values well-indicate the fame and popularity of aproject.
Ten projects in Fig. 3 have a Sticky value of 1.0 (we put aframed box around the projects). The names of these ten projectsare listed in Table 3. To identify the reason for such high Stickyvalues, we check their web pages and the developers’ affiliationsto find out the primary developers and maintainers of the projects.If more than half of developers belong to companies, we con-sider that the projects are supported by those companies. All theprojects in Table 3 are found to be developed or supported bycompanies or laboratories. In general, non-company developersare likely to join OSS projects as hobbyists [22], but company andlaboratory developers probably join OSS projects as part of theirwork [22], [29]. Therefore, projects supported by company or
*9 CocoaPods is the dependency manager for Swift and Objective-C.*10 https://www.google.co.jp/trends/ (Accessed 2015-10-15)*11 https://www.google.co.jp/trends/explore#q=angularjs (Accessed 2015-
laboratory developers are more likely to be constantly contributedby the same developers than projects supported by non-companydevelopers.
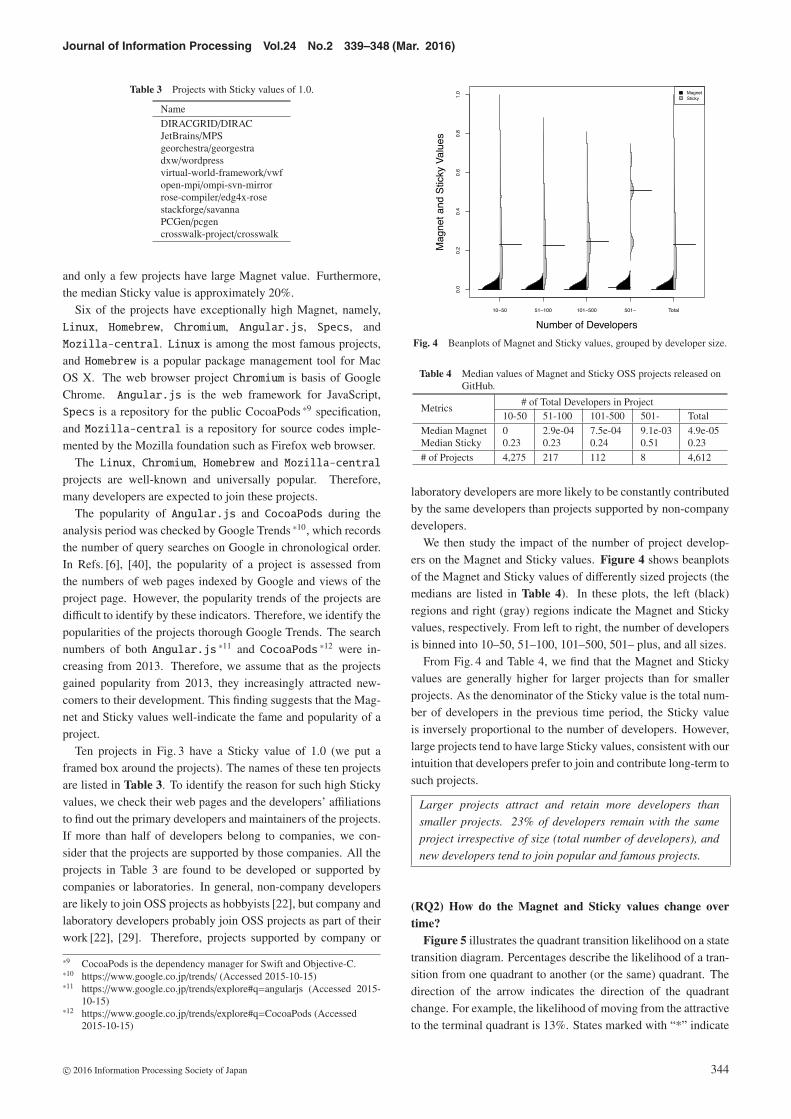
We then study the impact of the number of project develop-ers on the Magnet and Sticky values. Figure 4 shows beanplotsof the Magnet and Sticky values of differently sized projects (themedians are listed in Table 4). In these plots, the left (black)regions and right (gray) regions indicate the Magnet and Stickyvalues, respectively. From left to right, the number of developersis binned into 10–50, 51–100, 101–500, 501– plus, and all sizes.
From Fig. 4 and Table 4, we find that the Magnet and Stickyvalues are generally higher for larger projects than for smallerprojects. As the denominator of the Sticky value is the total num-ber of developers in the previous time period, the Sticky valueis inversely proportional to the number of developers. However,large projects tend to have large Sticky values, consistent with ourintuition that developers prefer to join and contribute long-term tosuch projects.
Larger projects attract and retain more developers than
smaller projects. 23% of developers remain with the same
project irrespective of size (total number of developers), and
new developers tend to join popular and famous projects.
(RQ2) How do the Magnet and Sticky values change overtime?
Figure 5 illustrates the quadrant transition likelihood on a statetransition diagram. Percentages describe the likelihood of a tran-sition from one quadrant to another (or the same) quadrant. Thedirection of the arrow indicates the direction of the quadrantchange. For example, the likelihood of moving from the attractiveto the terminal quadrant is 13%. States marked with “*” indicate
Journal of Information Processing Vol.24 No.2 339–348 (Mar. 2016)
Fig. 5 The likelihood of quadrant transitions.
projects that failed our filtering criteria (ten or more developers)during some time periods. To improve the readability of the fig-ure, we plot two “*” states, although these states are semanticallyidentical.
According to this figure, 3%, 8%, 28%, and 53% of the attrac-tive, fluctuating, stagnant, and terminal projects entered the fil-tered out state (“*”). Although any project can drop into the “*”state, the probability is much higher for terminal projects than forprojects in other quadrants. Therefore, terminal projects are verylikely to decay into the “*” state. Intuitively, we expect that as ter-minal quadrant projects are losing team members and strugglingto attract new ones, they will eventually die.
This result is different from our preliminary study [42]. In ourpreliminary study, projects decay into “*” state only from termi-nal quadrant, however, in this study, we found that projects thatare in other three quadrants decay into “*” state.
Interestingly, 28% of the stagnant projects, but only 8% of thefluctuating ones, decay into the “*” state. In both quadrants, oneof the two metrics (Magnet or Sticky) is high; therefore, we ex-pected that both quadrants would enter the “*” state with similarlikelihood. The observed asymmetry might reflect the impact ofnumber of developers. As fluctuating (stagnant) projects are char-acterized by high (low) Magnet and low (high) Sticky values, itappears that Magnet measure is more affected by number of de-velopers than Sticky.
Moreover, projects in the fluctuating, stagnant, and terminalquadrants do not easily transit to the attractive quadrant. Only18% of the projects entered the attractive quadrant from otherquadrants, but 55% of the attractive projects maintained their highmagnetism and stickiness. This phenomenon indicates that attrac-tive projects are more stable than projects in other quadrants.
In Fig. 5, we filtered start-up projects during the time period be-cause the Sticky value of such projects is 0, as earlier describedin RQ1. However, the status transitions from the first time periodto the next warrant investigation. Figure 6 shows the likelihoodof quadrant transitions from the first to the second time period.Only 13% of the projects maintained ten or more developers innext one, indicating the difficulty of retaining and acquiring de-velopers after initiating a project.
53% of the terminal projects eventually decayed into a state of
ten or fewer contributors, while 55% of the attractive projects
maintained their popularity. Only 13% of the projects identi-
fied in the first time period had maintained ten or more devel-
opers in the second period.
Fig. 6 Likelihood of quadrant transitions from the first period.
6. Discussion
This section discusses our analysis and results.
6.1 Discussion of RQ1From the result of calculating Magnet and Sticky values at lat-
est time period, we obtained the distributions of the values ofprojects such as the median Magnet value is 0.05 and Sticky valueis 0.23. The results are similar to our preliminary study [42]. Fur-thermore, we found that larger projects attract and retain largernumber of developers. These findings fit our intuition. The largeprojects are already known by many people and there are moreinformation of the projects compared to small projects. Hence,we assume that new developers can find the projects and the in-formation easily. For existing developers, contributing at fameand popular project is proud thing and motives them. From theseexpectations, we assume that both types of developers (new de-velopers and existing developers) have good motivation to con-tribute to the projects in larger projects.
Also, we showed the median of Magnet and Sticky values atthe latest time period. We assume that the values act as a gaugeof project health. If Magnet and Sticky values of a project arelower than the median values, the project faces a risk of decay-ing. In particular, Sticky value is stable across total number ofdevelopers. Hence, projects that have lower Sticky values are es-pecially risky.
6.2 Discussion of RQ2From the result of calculating likelihood of quadrant transi-
tions, we found that 53% of terminal projects eventually decayinto a state where they have fewer than ten contributors and 55%of attractive projects keep the popularity. We also revealed somedifferent trends from our preliminary study [42]. In preliminarystudy, only terminal projects decay into the “*” state, but in thisstudy, attractive, fluctuating, and stagnant projects also decayedinto the “*” state. We attribute these differences to the muchlarger dataset in this study.
We plan to study project survivability (i.e., project keep main-taining) using the transition in our future work. Chengalur-Smith et al. [4] showed that the number of developers positivelycorrelates with project survivability. Therefore, we expect thatproject survivability can be predicted from the analyzed trendsand the definition of project failure, as proposed by English and
Journal of Information Processing Vol.24 No.2 339–348 (Mar. 2016)
Schweik [11]. This estimation is planned for future work, but wemust consider the definition of project death. In this study, the“*” state represents projects with fewer than ten developers andwe consider projects moved to the “*” state as a type of obso-lete projects. However, some projects with few developers arerobustly sustained. Therefore, a small number of developers doesnot signify that the project will die (i.e., project stops its devel-opment). We must consider the definition of obsolete project infuture work.
7. Related Work
7.1 Role Migration in Open Source SoftwareSome studies have investigated the role migration in OSS.
Nakakoji et al. [25], Ye et al. [43] and Jensen and Scacchi [16]found that the extent to which each developer influences an OSSproject establishes a hierarchy among the developers. Nakakojiet al. [25] claimed that a sustainable OSS project must evolveboth the systems and the community. They identified three evo-lution patterns exploration-oriented, utility-oriented, and service-oriented. Ye et al. [43] sought to understand why people partici-pate in OSS projects. They assume that learning in practice mo-tivates OSS developers. Along with this learning process, a de-veloper’s role transformation in the OSS community provides ex-trinsic motivation. Jensen and Scacchi [16] investigated the rolemigration and project career advancement processes of OSS de-velopers, focusing on three large OSS projects. They discussedthe roles and layers in each projects and the migration betweenthe roles and layers of developers who joined the projects.
Von Krogh et al. [38], Ducheneaut [10], Herraiz et al. [14], Birdet al. [2], and Shibuya et al. [32] also studied the role immigrationprocess of OSS participants. Von Krogh et al. [38] found that newjoiners to the Freenet project will more likely undertake certainactions than long-term developers. Drawing on personal expe-rience, Deucheneaut described the six steps toward becoming aPython developer. In their experiments on three large projects,Bird et al. found that a submission history of patch upgradescan effectively elevate a joiner to developer status. Herraiz et al.discovered two groups of role migration; volunteer developerswho proceed in a step-by-step fashion, and sponsored developerswho suddenly migrate their roles. Shibuya and Tamai studied theopenness (transparency and accessibility [41]) of three projects.They found that each project facilitates participation of new de-velopers in different ways.
Similar to project roles, Robles et al. [30], Hindle et al. [15],and Vasilescu et al. [37] studied the various activities in projects.Hindle et al. distinguished four types of files and Robles et al.proposed eight different activities. Recently, Vasilescu et al. ex-tended this number to 14 activities and empirically studied howthe workloads of projects/contributors varied across the softwareecosystem.
These studies focused on the role migration in developmentprojects. In contrast, we investigate developer’s migration be-tween projects. By measuring the numbers of new and existingdevelopers, we attempt to understand the underlying characteris-tics of projects.
7.2 Success of Open Source SoftwareAfter conducting a literature review, DeLone and McLean [9]
proposed the Information Systems (IS) Success Model. They alsoreformed the model and its dimensions of information quality,system quality, service quality, use, user satisfaction, and net
benefits [8]. Crowston et al. [5] similarly conducted a literaturereview and proposed dimensions that determine the success of anOSS project. Next, they trialed their success measures by inter-viewing SlashDot developers. The interviewed developers rateddeveloper dimensions (such as developer involvement and satis-faction) most highly, followed by user dimensions (such as usersatisfaction and involvement). Crowston et al. also performed anempirical study of their success measures [6].
Based on interviews with OSS developers, English andSchweik [11] proposed six ranks of OSS success and failure.Their classes are defined by several factors, such as the number ofpublic releases, activity and age of the project. Evaluating theirclassification on SourceForge projects, and they classified only15% of the projects as “Success, Growth.”
Bonaccorsi et al. [3] claimed that two factors shape the lifecy-cle of a successful OSS project; a widely accepted leadership andeffective co-ordination among the developers.
As described above, there are many methods of evaluating thesuccess of OSS projects. In this study, we focus on developerattraction and retention (i.e., the success of developer growth).
7.3 GitHubGitHub projects have been analyzed in various studies.
Wagstrom et al. [39] proposed a dataset for investigating the rela-tionship between Ruby on Rails and ecosystems, which includesapproximately 1,000 projects. Thung et al. [34] investigated therelationships among projects and among developers, and identi-fied the most successful projects/developers by their page rank.These studies focused on the relationships among and betweenprojects and developers during a project’s evolution.
McDonald et al. [23] interviewed 10 lead and core members ofthree large OSS projects hosted on GitHub. Most of the intervie-wees measured of a project’s success by the numbers of existingand new contributors. In a quantitative analysis, Tsay et al. [36]studied two measures of a project’s success on GitHub. Betten-burg and Hassan [1] studied the effect of social interactions onsoftware quality. They found that social interactions consistentlyinfluence software quality and complexity. Dabbish et al. [7] ex-amined how GitHub users interpreted and use the information ob-tained from GitHub.
Gousios et al. [13] and Tsay et al. [35] investigated Pull Re-quests on GitHub. Gousios et al. found that most of the pull re-quests are accepted or rejected within one day, and that acceptingusers submit their pull request within very similar timeframes.Tsay et al. studied the factors affecting pull request acceptancerates. They found that highly discussed pull requests are likelyto be rejected, but, this effect is moderated by the submitter’sprior interactions. Kalliamvakou et al. [17] discussed the perilsand promises of researching on GitHub.
Our research applies Magnet and Sticky concept derived fromsocial study and the Pew Research Center (a nonpartisan think
Journal of Information Processing Vol.24 No.2 339–348 (Mar. 2016)
tank) in an OSS context, and thereby measures the attractivenessof GitHub projects.
8. Conclusion
Building on our preliminary study [42], we aimed to better un-derstand how OSS projects attract and retain contributors. First,we extended the dataset from 90 to 16,552 projects to generalizeout preliminary results. Second, we redefined the Sticky metricto better suit our purpose. Third, we experimentally identified thetypical duration between product releases.
In this study, we obtained similar and different (RQ2) resultsto our preliminary study [42]. Roughly, the results of RQ1 aresimilar and of RQ2 are different to our preliminary study.
The main results of the experiments are summarized below asfollows:• 23% of developers remain in the same projects.• Larger projects attract and retain more developers.• 53% of terminal projects eventually decay into a state of
fewer than ten contributors.• 55% of attractive projects remain in the attractive quadrant.As mentioned in Section 6, our future work will investigate the
relationship between the Magnet and Sticky metrics and projectsurvivability. We found that developers tend to abandon termi-nal projects, whereas attractive projects are frequently sustained.These findings indicate a relationship between survivability andthe proposed metrics, but cannot quantify this relationship. Inparticular, we did not define the failure of projects. Therefore,when investigating this relationship in future work, we shouldadopt a definition of project failure, as proposed English andSchweik [11].
Acknowledgments This research was partially supported byJSPS KAKENHI Grant Numbers 15H05306 and the Programfor Advancing Strategic International Networks to Accelerate theCirculation of Talented Researchers.
References
[1] Bettenburg, N. and Hassan, A.: Studying the Impact of Social Struc-tures on Software Quality, Proc. Int’l Conf. Program Comprehension(ICPC), pp.124–133 (2010).
[2] Bird, C., Gourley, A., Devanbu, P., Swaminathan, A. and Hsu, G.:Open Borders? Immigration in Open Source Projects, Proc. Int’lWorking Conf. Mining Software Repositories (MSR), pp.6–13 (2007).
[3] Bonaccorsi, A. and Rossi, C.: Why Open Source software can suc-ceed, Research Policy, Vol.32, No.7, pp.1243–1258 (2003).
[4] Chengalur-Smith, I.N., Sidorova, A. and Daniel, S.L.: Sustainabilityof Free/Libre Open Source Projects: A Longitudinal Study., Journalof the Association for Information Systems, Vol.11, No.11 (2010).
[5] Crowston, K., Annabi, H. and Howison, J.: Defining Open SourceSoftware Project Success, Proc. Int’l Conf. Information Systems(ICIS), pp.327–340 (2003).
[6] Crowston, K., Howison, J. and Annabi, H.: Information systems suc-cess in Free and Open Source Software development: Theory andmeasures, Software Process–Improvement and Practice, Vol.11, No.2,pp.123–148 (2006).
[7] Dabbish, L., Stuart, C., Tsay, J. and Herbsleb, J.: Social Coding inGitHub: Transparency and Collaboration in an Open Software Repos-itory, Proc. Conf. Computer Supported Cooperative Work (CSCW),pp.1277–1286 (2012).
[8] DeLone, W. and McLean, E.: Information Systems Success Revisited,Proc. Int’l Conf. System Sciences (HICSS), pp.238–248 (2002).
[9] DeLone, W.H. and McLean, E.R.: Information Systems Success:The Quest for the Dependent Variable, Information Systems Research,Vol.3, No.1, pp.60–95 (1992).
[10] Ducheneaut, N.: Socialization in an Open Source Software Commu-
[11] English, R. and Schweik, C.M.: Identifying Success and Tragedy ofFLOSS Commons: A Preliminary Classification of Sourceforge.netProjects, Proc. Int’l Workshop Emerging Trends in FLOSS Researchand Development (FLOSS), pp.54–59 (2007).
[12] Gousios, G.: The GHTorrent dataset and tool suite, Proc. Int’l Work-ing Conf. Mining Software Repositories (MSR), pp.233–236 (2013).
[13] Gousios, G., Pinzger, M. and van Deursen, A.: An Exploratory Studyof the Pull-based Software Development Model, Proc. Int’l Conf. Soft-ware Engineering (ICSE), pp.345–355 (2014).
[14] Herraiz, I., Robles, G., Amor, J.J., Romera, T. and GonzalezBarahona, J.M.: The Processes of Joining in Global Distributed Soft-ware Projects, Proc. Int’l Workshop Global Software Development forthe Practitioner (GSD), pp.27–33 (2006).
[15] Hindle, A., Godfrey, M. and Holt, R.: Release Pattern Discovery viaPartitioning: Methodology and Case Study, Proc. Int’l Workshop Min-ing Software Repositories (MSR), p.19 (2007).
[16] Jensen, C. and Scacchi, W.: Role Migration and Advancement Pro-cesses in OSSD Projects: A Comparative Case Study, Proc. Int’l Conf.Software Engineering (ICSE), pp.364–374 (2007).
[17] Kalliamvakou, E., Gousios, G., Blincoe, K., Singer, L., German,D.M. and Damian, D.: The Promises and Perils of Mining GitHub,Proc. Working Conf. Mining Software Repositories (MSR), pp.92–101(2014).
[18] Kamei, Y., Matsumoto, S., Monden, A., Matsumoto, K., Adams, B.and Hassan, A.E.: Revisiting Common Bug Prediction Findings UsingEffort Aware Models, Proc. Int’l Conf. Software Maintenance (ICSM),pp.1–10 (2010).
[19] Khomh, F., Adams, B., Dhaliwal, T. and Zou, Y.: Understanding theimpact of rapid releases on software quality, Empirical Software En-gineering, Vol.20, No.2, pp.336–373 (2015) (online), available from〈http://dx.doi.org/10.1007/s10664-014-9308-x〉.
[20] Khomh, F., Chan, B., Zou, Y. and Hassan, A.E.: An Entropy Evalu-ation Approach for Triaging Field Crashes: A Case Study of MozillaFirefox, Proc. Int’l Working Conf. Reverse Engineering (WCRE),pp.261–270 (2011).
[21] Kraut, R., Burke, M., Riedl, J. and Resnick, P.: The Challenges ofDealing with Newcomers, MIT Press, pp.179–230 (2012).
[22] Lakhani, K. and Wolf, R.: Why Hackers Do What They Do: Un-derstanding Motivation and Effort in Free/Open Source SoftwareProjects., MIT Press (2005).
[23] McDonald, N. and Goggins, S.: Performance and Participation inOpen Source Software on GitHub, CHI ’13 Extended Abstracts onHuman Factors in Computing Systems, pp.139–144 (2013).
[24] McIntosh, S., Kamei, Y., Adams, B. and Hassan, A.E.: The Impact ofCode Review Coverage and Code Review Participation on SoftwareQuality: A Case Study of the Qt, VTK, and ITK Projects, Proc. Work-ing Conf. Mining Software Repositories (MSR), pp.192–201 (2014).
[25] Nakakoji, K., Yamamoto, Y., Nishinaka, Y., Kishida, K. and Ye, Y.:Evolution Patterns of Open-source Software Systems and Communi-ties, Proc. Int’l Workshop on Principles of Software Evolution (IW-PSE), pp.76–85 (2002).
[26] Pew Research Social & Demographic Trends: Magnet or Sticky?: AState-by-State Typology, available from 〈http://www.pewsocialtrends.org/2009/03/11/magnet-or-sticky/〉 (accessed 2015-06-15).
[27] Preston-Werner, T.: Semantic Versioning 2.0.0, available from〈http://semver.org〉 (accessed 2015-06-15).
[28] Qureshi, I. and Fang, Y.: Socialization in Open Source SoftwareProjects: A Growth Mixture Modeling Approach, Organizational Re-search Methods, Vol.14, No.1, pp.208–238 (2011).
[29] Riehle, D., Riemer, P., Kolassa, C. and Schmidt, M.: Paid vs. Volun-teer Work in Open Source, Proc. Hawaii Int’l Conf. System Sciences(HICSS), pp.3286–3295 (2014).
[30] Robles, G., Gonzalez-Barahona, J.M. and Merelo, J.J.: BeyondSource Code: The Importance of Other Artifacts in Software Devel-opment (a Case Study), J. Syst. Softw., Vol.79, No.9, pp.1233–1248(2006).
[31] Schilling, A., Laumer, S. and Weitzel, T.: Who Will Remain? AnEvaluation of Actual Person-Job and Person-Team Fit to Predict De-veloper Retention in FLOSS Projects, Proc. Hawaii Int’l Conf. SystemScience (HICSS), pp.3446–3455 (2012).
[32] Shibuya, B. and Tamai, T.: Understanding the process of participat-ing in open source communities, Proc. Int’l Workshop on EmergingTrends in Free/Libre/Open Source Software Research and Develop-ment (FLOSS), pp.1–6 (2009).
[33] Steinmacher, I., Conte, T., Gerosa, M.A. and Redmiles, D.: So-cial Barriers Faced by Newcomers Placing Their First Contributionin Open Source Software Projects, Proc. Conf. Computer SupportedCooperative Work and Social Computing (CSCW), pp.1379–1392(2015).
Journal of Information Processing Vol.24 No.2 339–348 (Mar. 2016)
[34] Thung, F., Bissyande, T.F., Lo, D. and Jiang, L.: Network Structure ofSocial Coding in GitHub, Proc. European Conf. on Software Mainte-nance and Reengineering (CSMR), pp.323–326 (2013).
[35] Tsay, J., Dabbish, L. and Herbsleb, J.: Influence of Social and Tech-nical Factors for Evaluating Contribution in GitHub, Proc. Int’l Conf.Software Engineering (ICSE), pp.356–366 (2014).
[36] Tsay, J.T., Dabbish, L. and Herbsleb, J.: Social Media and Success inOpen Source Projects, Proc. Conf. on Computer Supported Coopera-tive Work Companion (CSCW), pp.223–226 (2012).
[37] Vasilescu, B., Serebrenik, A., Goeminne, M. and Mens, T.: On thevariation and specialisation of workload—A case study of the Gnomeecosystem community, Empirical Software Engineering, Vol.19,No.4, pp.955–1008 (2014).
[38] von Krogh, G., Spaeth, S. and Lakhani, K.R.: Community, joining,and specialization in open source software innovation: A case study,Research Policy, Vol.32, No.7, pp.1217–1241 (2003).
[39] Wagstrom, P., Jergensen, C. and Sarma, A.: A network of Railsa graph dataset of Ruby on Rails and associated projects, Proc.Int’l Working Conf. Mining Software Repositories (MSR), pp.229–232(2013).
[40] Weiss, D.: Measuring Success of Open Source Projects Using WebSearch Engines, Proc. Int’l Conf. Open Source Systems, pp.93–99(2005).
[41] West, J. and O’mahony, S.: The Role of Participation Architecture inGrowing Sponsored Open Source Communities, Industry and Innova-tion, Vol.15, No.2, pp.145–168 (2008).
[42] Yamashita, K., McIntosh, S., Kamei, Y. and Ubayashi, N.: Magnetor Sticky? An OSS Project-by-project Typology, Proc. Int’l WorkingConf. Mining Software Repositories (MSR), pp.344–347 (2014).
[43] Ye, Y. and Kishida, K.: Toward an Understanding of the MotivationOpen Source Software Developers, Proc. Int’l Conf. Software Engi-neering (ICSE), pp.419–429 (2003).
[44] Zhou, M. and Mockus, A.: Developer Fluency: Achieving True Mas-tery in Software Projects, Proc. Int’l Symposium on Foundations ofSoftware Engineering (FSE), pp.137–146 (2010).
[45] Zhou, M. and Mockus, A.: What Make Long Term Contributors: Will-ingness and Opportunity in OSS Community, Proc. Int’l Conf. Soft-ware Engineering (ICSE), pp.518–528 (2012).
Kazuhiro Yamashita is a Ph.D. candi-date at Kyushu University. He receivedhis Bachelor’s degree and Master’s de-gree from Kyushu University. His re-search interests include software engi-neering, data mining, mining softwarerepositories (MSR).
Yasutaka Kamei is an associate profes-sor at Kyushu University in Japan. He hasbeen a research fellow of the JSPS (PD)from July 2009 to March 2010. FromApril 2010 to March 2011, he was a post-doctoral fellow at Queen’s University inCanada. He received his B.E. degree inInformatics from Kansai University, and
M.E. degree and Ph.D. degree in Information Science from NaraInstitute of Science and Technology. His research interests in-clude empirical software engineering, open source software engi-neering and Mining Software Repositories (MSR). His work hasbeen published at premier venues like ICSE, FSE, ESEM, MSRand ICSM, as well as in major journals like TSE, EMSE and IST.More information is available online at http://posl.ait.kyushu-u.ac.jp/˜kamei/.
Shane McIntosh is an assistant professorin the Department of Electrical and Com-puter Engineering at McGill University.He received his Bachelor’s degree in Ap-plied Computing from the University ofGuelph and his M.Sc. and Ph.D. in Com-puter Science from Queen’s University. Inhis research, Shane uses empirical soft-
ware engineering techniques to study software build systems, re-lease engineering, and software quality. His research has beenpublished at several top-tier software engineering venues, suchas the International Conference on Software Engineering (ICSE),the International Symposium on the Foundations of Software En-gineering (FSE), and the Springer Journal of Empirical SoftwareEngineering (EMSE). More about Shane and his work is availableonline at http://shanemcintosh.org/.
Ahmed E. Hassan is a Canada ResearchChair in Software Analytics and theNSERC/Blackberry Industrial ResearchChair at the School of Computing inQueen’s University. Dr. Hassan serveson the editorial board of the IEEE Trans-actions on Software Engineering and theJournal of Empirical Software Engineer-
ing. He spearheaded the organization and creation of the MiningSoftware Repositories (MSR) conference and its research com-munity. Early tools and techniques developed by Dr. Hassan’steam are already integrated into products used by millions ofusers worldwide. Dr. Hassan industrial experience includes help-ing architect the Blackberry wireless platform, and working forIBM Research at the Almaden Research Lab and the ComputerResearch Lab at Nortel Networks. Dr. Hassan is the named inven-tor of patents at several jurisdictions around the world includingthe United States, Europe, India, Canada, and Japan. More infor-mation at: http://sail.cs.queensu.ca/.
Naoyasu Ubayashi is a professor atKyushu University since 2010. He isleading the POSL (Principles of SoftwareLanguages) research group at KyushuUniversity. Before joining Kyushu Uni-versity, he worked for Toshiba Corpora-tion and Kyushu Institute of Technology.He received his Ph.D. from the University
of Tokyo. He is a member of ACM SIGPLAN, IEEE ComputerSociety, and Information Processing Society of Japan (IPSJ). Hereceived “IPSJ SIG Research Award 2003.”