42
Magnetic Flow Meters Diagnostics and Smart Meter Verification Dan Elze Flow and Density Specialist Emerson Process Automation Emerson Confidential 2018 Conference

Magnetic Flow MetersDiagnostics and Smart Meter Verification
Dan Elze
Flow and Density Specialist
Emerson Process Automation
Emerson Confidential
2018 Conference

Magnetic Flow Meters
Emerson Confidential
Typical Measurement Points

Michael Faraday (1791 - 1867)
Magnetic Flow Meter Theory of Operation
Faraday’s Law of Electromagnetic Induction
• A voltage will be induced in a conductor moving in a magnetic field (E)
• The magnitude of that induced voltage is proportional – to the velocity of the conductor (V)
– to the length of the conductor (D)
– to the strength of the magnetic field (B)
E = k * B * D * V
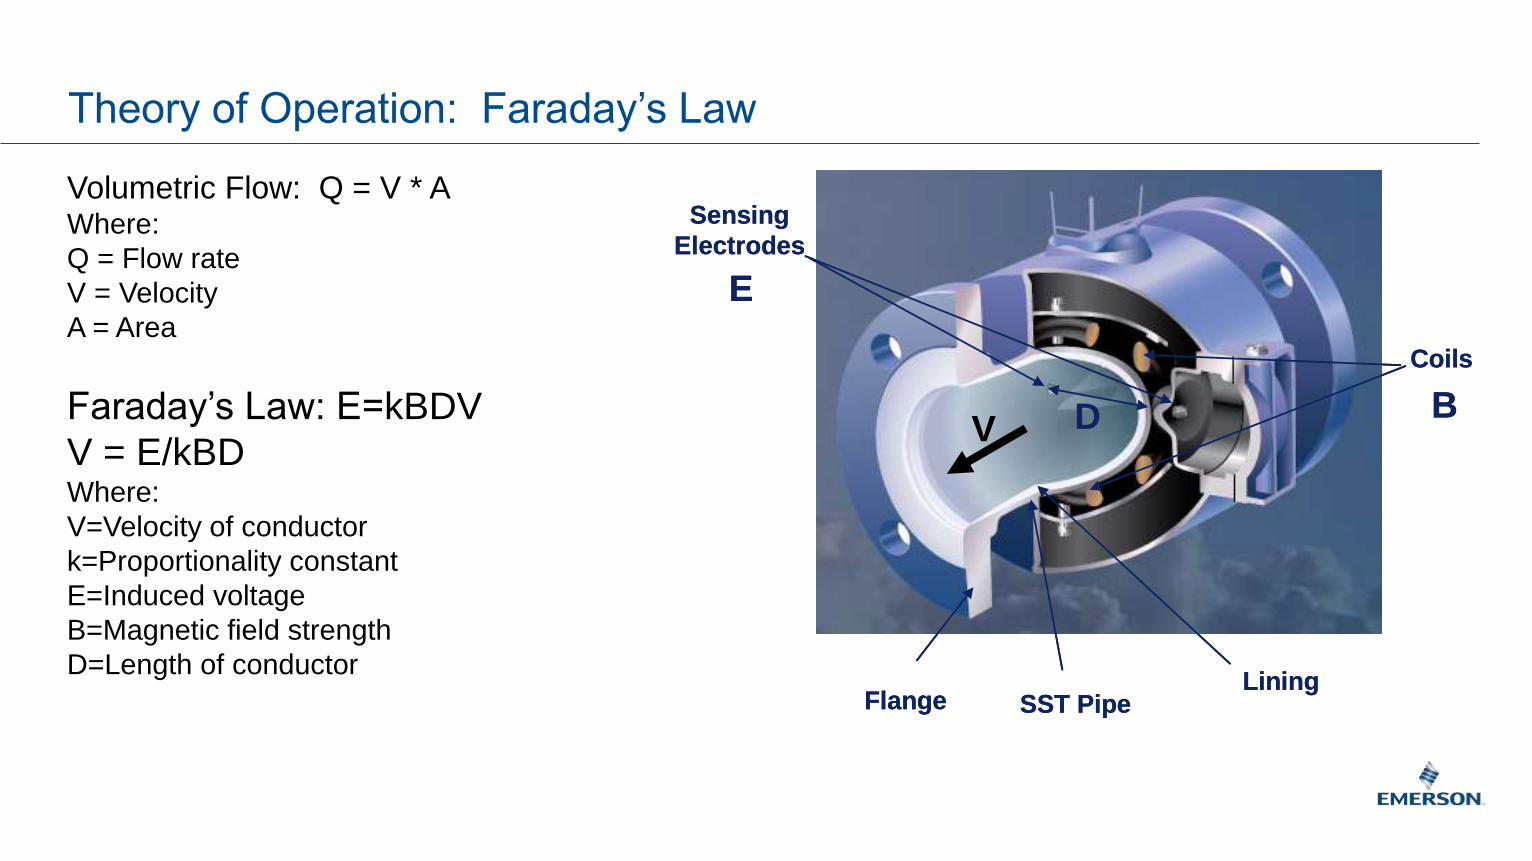
Theory of Operation: Faraday’s Law
Volumetric Flow: Q = V * AWhere:
Q = Flow rate
V = Velocity
A = Area
Faraday’s Law: E=kBDV
V = E/kBDWhere:
V=Velocity of conductor
k=Proportionality constant
E=Induced voltage
B=Magnetic field strength
D=Length of conductor
Sensing
Electrodes
Coils
LiningSST PipeFlange
E
VBD
Sensing
Electrodes
Coils
LiningSST PipeFlange
E
VBD

Magnetic Flow Meter Theory - Faraday’s Law
k= Proportionality constant
B= Magnetic field Strength
D= Length of conductor
V= Velocity of conductor
E= Induced voltage (linear with velocity)
E=kBDV
Conductive Process Fluid
Lining
Field Coils
Sensing Electrodes
SST Tube
Flange
Magnetic Field “B”(Constant Strength)
“E”
“E”
Variable Flow Rate
(Feet Per Second)
“D”
D
“V”Volumetric Flow: Q = V * A
Where:
Q = Flow rate
V = Velocity
A = Area

Magnetic Flow Meter Theory
Faraday’s Law and the Flow Rate
• Magmeters calculate fluid velocity (V) by measuring the induced voltage (E) on the electrodes
• Q = V * A
– Volumetric flow rate (Q) is velocity (V) times cross-sectional area (A)
A
v
s
E = k * B * D * V
Not effected by
changes in fluid
conductivity!

Magnetic Flow Meter Theory
Fluid Conductivity
As we will see in the upcoming slides, diagnostics can help provide inside into process as well as sensor health, upset conditions, and measurement confidence by measuring things
like electrode resistance, which includes conductivity
• Magmeters Require a Conductive Process Fluid
– No Gases
– No Entrapped Air, Foam, or Two-Phase Flow
– Minimum 5 µSiemens/cm
• Conductance is the reciprocal of Resistance and is measured in Siemens (formerly Mhos)
• 10 Siemens = 0.1 Ohm
• 5 µSiemens/cm = 200 kOhm

Diagnostics Improve Practices
• STANDARD DIAGNOSTICS
– Transmitter Hardware Fault
– Transmitter Software Fault
– Sensor Coil Fault
– Empty Pipe
DA1 HART DIAGNOSTICS
– Grounding and Wiring Fault
– High Process Noise
– Coated Electrode Detection (8732E)
DA2 HART DIAGNOSTIC
– SMART™ Meter Verification
– Continuous (8732E)
D01 DIAGNOSTICS (8732E)
– Grounding and Wiring Fault
– High Process Noise
D02 DIAGNOSTIC (8732E)
– SMART™ Meter Verification

I Would Like To Be Sure my Magmeter is Installed Right The First Time.
It Would Reduce Start-up Time and Cost.
Ground & Wiring Fault Detection Improves Installations
• Improper grounding is a leading cause of flow measurement issues with magnetic flow meters
• Rosemount Grounding and Wiring Fault Detection monitors the entire frequency spectrum to recognize if AC noise is effecting the flow reading –and alerts you if it is
ground rings

Magnetic Flow meter Diagnostic Ensures Proper Installation
• Proper grounding is critical to deliver the best measurement from magnetic flowmeters
• The magmeter as a built-in spectral analyzer to ensure no 50 or 60 Hz noise is present
ground rings

Ground & Wiring Fault Detection Ensures Proper Installation
If excessive voltage is seen at 50 or 60
Hz frequency range, an alert is given to
confirm that wiring has been done
properly

I Would Like to Reduce Valve Wear-out, But Also Improve Process Performance.
It Would Reduce Maintenance as well as variability and uncertainty
Process Noise Makes Optimization and Maintenance a Tougher Job
• Slurries create noisy output resulting in valve actuation – so high levels of damping are common
• Damping = control loop dead-time
• Damping makes the flow signal look stable - but the valve will not change position rapidly - even when real flow rates change – adding real process variability
• Rosemount High Process Noise Diagnostic and User-selectable Coil Drive provides Maximum Stability with Minimum Damping

Process Noise
• Caused by disturbance of electrolytic zone around electrodes head
– Exchange of ions between electrode and conductive process fluid
– Measuring a flow signal on the magnitude of several hundred microvolts to a few millivolts
Flow
LinerElectrode
Electrolytic Zone
++
++
+
––
––
–

Process Noise Profiles
Different Noise Profiles are Caused by different Process Conditions
Diagnostics can determine which conditions may existDrive Frequency and DSP can be used to handle and correct these conditions
1/F Noise
Spike Noise
White Noise

Typical Noise Profile (1/F)
1/F Noise– Characterized by a frequency spectrum in which the amplitude of the noise decreases with increasing
frequency
– Corner frequency usually less than 10 Hz
– Lower consistency pulp flows, chemical additions

Spike Noise Profile
Spike Noise– Characterized by large voltage spikes generated by the impact of solids on the electrode head
– Spikes can be generated at any frequency
– Medium consistency pulp flows, Large Particles
Flow Signal
Spikes

White Noise Profile
White Noise– Characterized by essentially constant high noise amplitude
– Noise covers entire frequency range (out to several hundred Hz)
– Medium/High consistency pulp flows, Hydraulic disturbances created by nearby pumps or valves

Flow Optimization
Damping in Noisy Application
FE(Flowmeter)
FC(Control Valve)
PV (Flow)
Flow PV with No Damping
Control Loop – with Damping
Flowmeter (FE)
– Looks Stable, slow to respond to real changes
Valve (FC)
– Looks stable, slow to control real changes
Process
– Very Inconsistent, out of control, varying quality
Flow PV with Significant DampingAdd
Damping
Valve Travel
Accept Significant Process Variability
Process Variability

5 Hz Frequency (Hz)
Voltage
Amplitude
Standard DC
Can’t
overcome
noise
50/60 Hz
FE(Flowmeter)
FC(Control Valve)
PV (Flow)
Frequency
37.5 Hz
High Frequency DC
Is Stable above Noise
Much higher SNR.
The higher the SNR, the more
stable the signal!
Process Noise Applications – High Frequency

FE(Flowmeter)
FC(Control Valve)
PV (Flow)
Flow PV with No Damping at 5HZ
Flow PV with No Damping at 37HzMove to
37Hz
Valve Travel
Process Variability
Flow Optimization in Noisy Applications

Digital Signal Processing
Spike recorded, but not
included in output
Typical noisy Application
Since next point is back in
band, point 2 is rejected as
spike noise.
As in point 2, value stored. As next
point stays high, they are added to
average.
Based on user-entered time-limit,
meter can “jump” to new value or ramp
in a more common way

Process Noise Applications – High Frequency
5 Hz 37.5 Hz Frequency (Hz)
Voltage
Amplitude
Standard DC
Signal
If very high levels of 1/f or white noise is
present, HIGH SIGNAL DC will be required
50/60 Hz
Very low Signal to
Noise Ratio (SNR)37 Hz will not address very high
levels of 1/f or white noise
FE(Flowmeter)
FC(Control Valve)
PV (Flow)

Process Noise Applications – High Signal DC
5 Hz 37.5 Hz Frequency (Hz)
Voltage
Amplitude
Standard DC
Signal
50/60 Hz
Very low Signal to
Noise Ratio (SNR)
FE(Flowmeter)
FC(Control Valve)
PV (Flow)
Rosemount High-Signal™
Over-powers Noise Like an AC, Delivers
zero stability of a pulsed DC
50/60 Hz
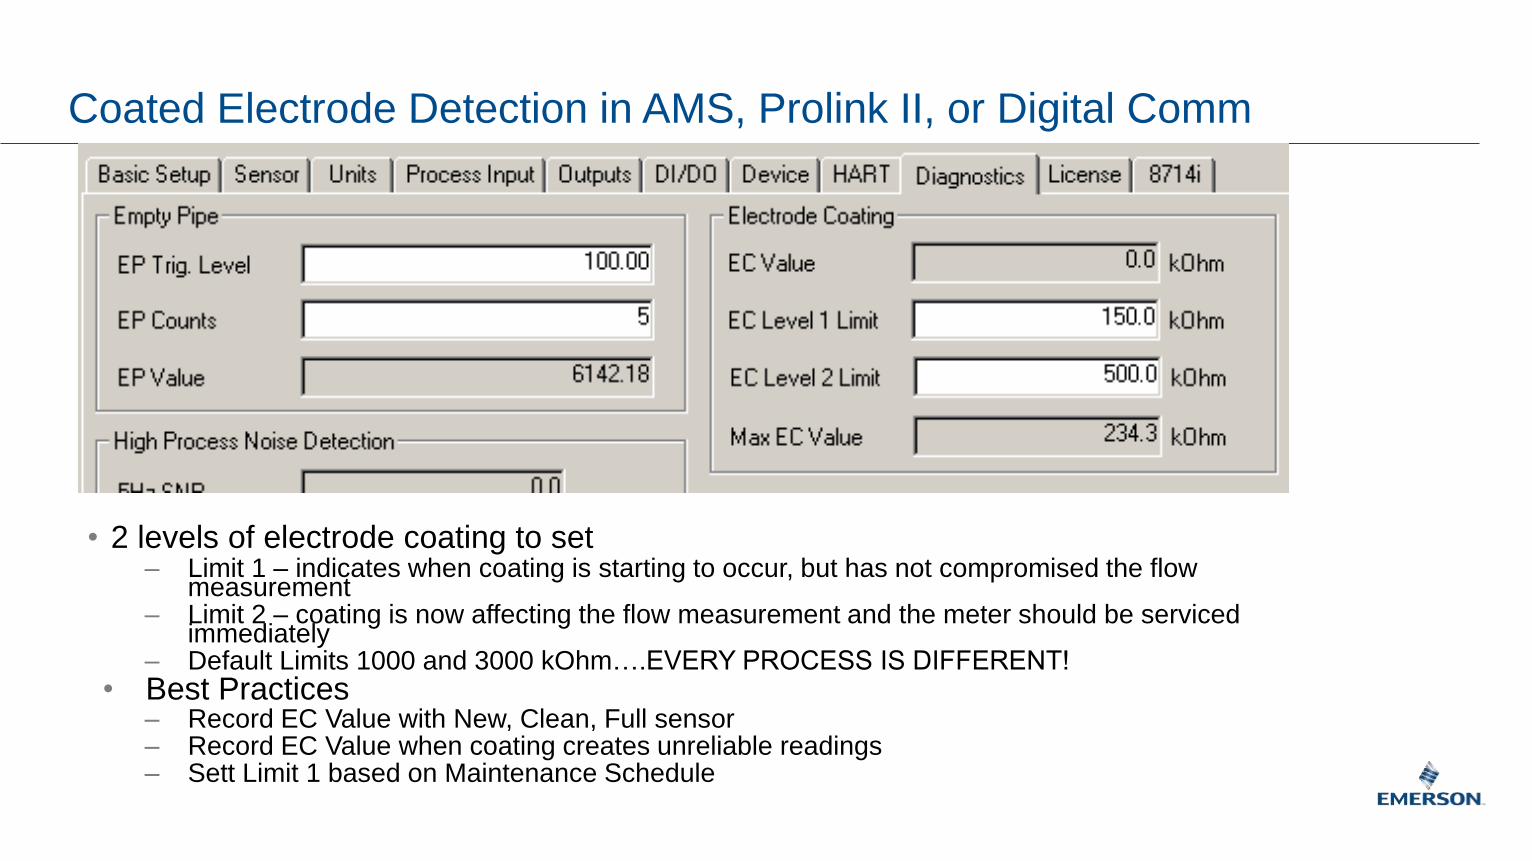
Coated Electrode Detection in AMS, Prolink II, or Digital Comm
• 2 levels of electrode coating to set– Limit 1 – indicates when coating is starting to occur, but has not compromised the flow
measurement– Limit 2 – coating is now affecting the flow measurement and the meter should be serviced
immediately– Default Limits 1000 and 3000 kOhm….EVERY PROCESS IS DIFFERENT!
• Best Practices– Record EC Value with New, Clean, Full sensor– Record EC Value when coating creates unreliable readings– Sett Limit 1 based on Maintenance Schedule

I Would Like to Verify the Magmeter Calibration Without Removing It From The Line Or Using
Extra Equipment .
It Would Reduce Maintenance Time and Cost.
• Verifying mag calibration historically involved removing the flowmeter from the line or using extra equipment
• Rosemount SMART™ Meter Verification Diagnostic provides calibration verification without removing the product from the line or requiring the purchase of extra equipment
SMART Meter Verification Greatly Reduces Calibration Verification Costs

Terminology:
Calibration, Validation, and Verification
Verification uses a secondary means to show nothing has changed to alter the calibration
Verification tests every part of the entire measurement system
Verification tests against a baseline
• Definition of terms– Calibration: Establishing the relationship between flow and signal produced by sensor.– Validation: Confirming flow performance by comparing a primary flow standard to sensor – Verification: Establishing confidence in performance by analysis of secondary variables
associated with flow
• Frequently these terms are used interchangeably• Many times calibration or validation is done when only verification is needed• Emerson baselines an indicating parameter at time of factory calibration that can be
self-checked to perform ongoing verification of the meters calibration and health– In addition to Electronics Verifications, Rosemount Magmeters use:
• Magnetic field signature (inductance)• Coil Resistance• Electrode Resistance

Historically Verifying Meters has been time-consuming and forced shutdown
Trip to field
Technical knowledge and Extra equipment
No formal report
No deviation values
More than 120 minutes
May require a process shutdown
Must shutdown,
remove meter
from the line, pay
for proving.
Prover External
Equipment

Meter Verification Theory of Operation
A Field Baseline Must Be Performed to Establish Electrode Resistance on the Process
• A baseline signature of the magnetic field is taken at the time of factory calibration
– Signature is independent of temperature and flow-rate
– Signature (and calibration) will change if there is a mechanical shift of the coils over time due to vibration, thermal cycling, etc

8714i Meter Verification
• Compares measured coil signature to baseline coil signature
• % deviation is calculated
• User assigns acceptance criteria based on application
• Verifies the health of coil and electrode circuits
Meter Verification Delivers Pass/Fail for Calibration and Health
Sensor Parameter
SignatureBaselineValues
8714i Measure Values
Deviation CriteriaPass/F
ail
Coil Signature 19.5 19.6
Coil Resistance
15.2 15.6
Electrode Resistance
260.7 245.6
Sensor Parameter
SignatureBaselineValues
8714i Measure Values
Deviation CriteriaPass/F
ail
Coil Signature 19.5 19.6 0.51% 1% Pass
Coil Resistance 15.2 15.6 Range Pass
Electrode Resistance
260.7 245.6 Range Pass
Established at factory calibration Measured in the field

Report from AMS Manual Verification ReportAvailable in Reference Manual or Rosemount.com
Meter Verification Offering Provides Options for Documentation
Prolink III Report

Continuous SMART Meter Verification is always running
Continuous Meter Verification and Analog
Loop Verification can be found here

The SMART™ Meter Verification diagnostic enabled this
wastewater treatment plant to reduce their chemical
usage and improve throughput.• Waste activated sludge
• Meter verification required for this flow point in order to
verify that biological activity was kept at correct levels
• SMART™ Meter Verification allowed this plant to
extend time between meter removal increasing the
process efficiency and reducing maintenance costs
• 00830-1200-4727
Diagnostics Matter: Proven Results

I would like to have diagnostic capabilities on my old installed base of magnetic flowmeters.
It would allow me to optimize my processes without requiring replacement of perfectly good
sensors.
• Replacement of an existing installed base is expensive and impractical, especially when the sensor is still healthy
Diagnostics not only work on Rosemount sensors they work on other manufacturers’ sensors as well
Universal™ Capabilities Extend Diagnostics to any Mag Installation

Rosemount Mag
Universal Diagnostic™ Technology
• Universal Capabilities
– Only Rosemount offers the functionality to drive tubes across a wide-ranging currents
• Scalable from 0.075 to 0.5 amps
– Can drive virtually any flow tube sensor from any manufacturers
• Simple conversion of others k-factors to Rosemount calibration numbers
– Diagnostics not only work on Rosemount flow tube sensors –they work on other manufacturers’ sensors as well.

Universal Meter Verification improves installations with other manufacturers’ sensors
Typical Meter Verification Capabilities of other Manufacturers
Rosemount Universal
Trip to field
Technical knowledge and Extra equipment
No formal report
No deviation values
More than 120 minutes
No Trip to field
No Extra equipment, simple meter verification diagnostic
Formal report
Deviation values
Approx 6 minutes

Universal Transmitters
- How do I make it work?
Making Universal Work is as easy as 1 - 2 - 3….
1. Review the application
– Verify sensor is in working condition and will work with the Universal transmitter
2. Connect the Universal transmitter to the sensor
– Wiring diagrams are provided in the reference manual
3. Determine the Universal Calibration Number
– Calibration Number Prediction
– Universal Auto Trim
– Flow lab calibration
FAQ Documents:

Determining Universal Calibration Numbers
• Universal calibration number calculation tool– Excel spreadsheet that converts sensor K-Factor to a Rosemount 16-digit calibration number
– Available for:• Foxboro 2800
• Krohne Optiflux 4000 and IFS 4000
• Yokogawa Admag and Admag AXF
• Universal Auto-trim– Calibrates Universal transmitter to current flow reading
– Requires a known flow rate
– Best option when replacing a transmitter to get access to
diagnostics• Simplifies In-Situ Calibration
• Send sensor to Rosemount for calibration– Can be supported, but not typically done as it requires removal of the sensor

Universal transmitter capabilities allowed this municipal
treatment facility to improve quality and reduce
maintenance costs• Raw feed water
• Installed flow meter was giving an erratic output
• 30-inch sensor which could not be removed from
process without shutting down the facility
• Universal transmitter capabilities allowed this user to
continue operation and provided a stable output
allowing the facility move to automatic control of
chemical feeds
• 00830-0900-4727
Universal Matters: Proven Results

What’s NEW? Sensor and Transmitter Migration from ES to EM
• Originally driven by new requirements for FM approval, but drove project to make other enhancements.
• Additional Diagnotstics 3-Build Paint System
• Improved LOI Design Field Replaceable Terminal Block (on some models)
39Emerson Confidential
Standard Process Meter Health
Configurable
Empty Pipe
Grounding / Wiring Transmitter
Verification
Coil Short High Process Noise Coil Circuit Health
Electrode Short Electrode Coating
Detection
Electrode Circuit
Health
Coil Over Current Sensor
Verification
Electrode
Saturation
Continuous Smart
Meter Verification
Electronics Failure
•3-build paint system
– Base layer conversion coating improves material adhesion and prevents corrosive spread
– Thick build epoxy mid-coat provides primary resistance to corrosion
– Polyurethane top-coat provides UV and corrosion resistance
• Surpasses NEMA 4X Testing
– Passed testing when subjected to 1500 hours of salt spray

What does this change mean for you?
• Additional Diagnostic Features
• Enhancements to 8712 wall mount to match 8732 features
• MODEL CODES will be slightly different
– Besides EM vs ES, the agency approval section of the model code may change
• When ordering parts or mixing platforms between sensor and transmitter, check with your local sales representative
40Emerson Confidential
8712ES 8712EM

For more information visit Midwest Municipal Instrumentation
41Emerson Confidential
Booths 1105-1106

Thank You
Any Questions?
Emerson Confidential


