Magnetic Moment and Anisotropy of Individual Co Atoms on Graphene F. Donati, 1 Q. Dubout, 1 G. Aute `s, 2 F. Patthey, 1 F. Calleja, 1,3 P. Gambardella, 1,4,5 O. V. Yazyev, 2 and H. Brune 1, * 1 Institute of Condensed Matter Physics (ICMP), Ecole Polytechnique Fe ´de ´rale de Lausanne (EPFL), Station 3, CH-1015, Switzerland 2 Institute of Theoretical Physics, Ecole Polytechnique Fe ´de ´rale de Lausanne (EPFL), CH-1015 Lausanne, Switzerland 3 Madrid Institute for Advanced Studies, IMDEA Nanoscience, Calle Faraday 9, Campus Cantoblanco, E-28049 Madrid, Spain 4 Catalan Institute of Nanoscience and Nanotechnology (ICN2), UAB Campus, E-08193 Barcelona, Spain 5 Department of Materials, ETH Zurich, CH-8093 Zurich, Switzerland (Received 14 August 2013; published 3 December 2013) We report on the magnetic properties of single Co atoms on graphene on Pt(111). By means of scanning tunneling microscopy spin-excitation spectroscopy, we infer a magnetic anisotropy of K ¼8:1 meV with out-of-plane hard axis and a magnetic moment of 2:2" B . Co adsorbs on the sixfold graphene hollow site. Upon hydrogen adsorption, three differently hydrogenated species are identified. Their magnetic properties are very different from those of clean Co. Ab initio calculations support our results and reveal that the large magnetic anisotropy stems from strong ligand field effects due to the interaction between Co and graphene orbitals. DOI: 10.1103/PhysRevLett.111.236801 PACS numbers: 73.22.Pr, 32.10.Dk, 75.30.Gw, 75.70.Rf Graphene is a promising material for spintronics due to the possibility of realizing controllable spin transport [1], its perfect spin filtering [2], and spin-relaxation lengths of several micrometers at room temperature [3]. Doping graphene by magnetic impurities opens further possibil- ities [4–6]. In particular, the creation of extended magnetic phases [7], quantum critical Kondo anomalies [8,9], and the strong scattering of spin currents [10] have been pre- dicted. Moreover, for 3d metal atoms on graphene, the calculated uniaxial magnetic anisotropies [11,12] are be- yond the current record value for a surface-adsorbed atom [13]. Furthermore, hydrogen adsorption has been predicted to change the spin of the adatoms [14], underlining its potential to tailor the magnetic properties. However, the predicted anisotropies and moments are highly controversial and largely depend on how electron correlations are treated. For the prototypical system of Co atoms on graphene, spin moments between 1 and 3" B and anisotropies of different signs have been calculated [12,15–17]. At present, there is only one experiment addressing the magnetic properties of transition-metal adatoms on graphene. It reports on-top adsorption, a high-spin ground state, and weak magnetic anisotropy for Co=graphene=SiCð0001Þ [18]. Here we present the first local measurement of the magnetic moment and anisotropy of individual Co atoms on graphene on Pt(111). This substrate was chosen since graphene binds very weakly to it [19], thus approaching freestanding graphene. Using scanning tunneling micros- copy (STM) spin-excitation spectroscopy [20], we find an exceptionally large magnetic anisotropy of K ¼8:1 0:4 meV with out-of-plane hard axis and a magnetic moment of 2:2 0:4 " B . Fully relativistic density func- tional theory (DFT) calculations show the anisotropy to be mainly a hybridization effect. In addition to clean Co, we identify three hydrogenated species, CoH n , n 2f1; 2; 3g, with very different magnetic behavior. The coexistence of clean and hydrogenated adatoms is expected to be a gen- eral feature of transition metal atoms on graphene that has to be considered in the interpretation of any ensemble measurement. The experiments were performed with a homebuilt STM operating at T ¼ 0:4K and in magnetic fields up to B ¼ 8:5T perpendicular to the surface. Pt(111) was pre- pared by means of Ar þ sputtering and flash annealing (1400 K) cycles until surface impurity concentrations <0:5% were reached. Graphene patches of various sizes (50–500 nm) were grown by both C segregation (1500 K, 1–3 min) and chemical vapor deposition (10 L C 2 H 4 at 1230 K). 5:0 0:5 10 3 monolayers of Co were depos- ited in situ at 16 K and p tot 8 10 10 mbar using an e-beam evaporator with a 99.995% purity Co rod. This led to individual immobile adatoms [21]. Constant-current STM images were acquired with a W tip at tunnel current I t and sample bias V t given in the figure captions. dI=dV spectra were recorded with open feedback and lock-in using the indicated peak-to-peak modulation voltage V mod at frequency f. d 2 I=dV 2 spectra were obtained by numerical differentiation. The first-principles DFT calculations used the local density approximation with a mean-field Hubbard correc- tion (LDA þ U)[22,23], as implemented in QUANTUM- ESPRESSO [24]. We chose U ¼ 4 eV for Co in agreement with previous calculations [15]. Spin-orbit effects were accounted for by using the fully relativistic norm-conserving pseudopotentials acting on valence electron wave functions represented in the two-component spinor form [25]. The CoH n , n 2f0; 1; 2; 3g, adsorption complexes were placed in a(4 4) supercell of graphene and the structures were fully relaxed. The magnetic anisotropy energy was obtained from the difference of total energies of the out-of-plane and PRL 111, 236801 (2013) PHYSICAL REVIEW LETTERS week ending 6 DECEMBER 2013 0031-9007= 13=111(23)=236801(5) 236801-1 Ó 2013 American Physical Society
Transcript
Magnetic Moment and Anisotropy of Individual Co Atoms on Graphene
F. Donati,1 Q. Dubout,1 G. Autes,2 F. Patthey,1 F. Calleja,1,3 P. Gambardella,1,4,5 O. V. Yazyev,2 and H. Brune1,*1Institute of Condensed Matter Physics (ICMP), Ecole Polytechnique Federale de Lausanne (EPFL), Station 3, CH-1015, Switzerland
2Institute of Theoretical Physics, Ecole Polytechnique Federale de Lausanne (EPFL), CH-1015 Lausanne, Switzerland3Madrid Institute for Advanced Studies, IMDEA Nanoscience, Calle Faraday 9, Campus Cantoblanco, E-28049 Madrid, Spain
4Catalan Institute of Nanoscience and Nanotechnology (ICN2), UAB Campus, E-08193 Barcelona, Spain5Department of Materials, ETH Zurich, CH-8093 Zurich, Switzerland
(Received 14 August 2013; published 3 December 2013)
We report on the magnetic properties of single Co atoms on graphene on Pt(111). By means of scanning
tunneling microscopy spin-excitation spectroscopy, we infer a magnetic anisotropy of K ¼ �8:1 meV
with out-of-plane hard axis and a magnetic moment of 2:2�B. Co adsorbs on the sixfold graphene hollow
site. Upon hydrogen adsorption, three differently hydrogenated species are identified. Their magnetic
properties are very different from those of clean Co. Ab initio calculations support our results and reveal
that the large magnetic anisotropy stems from strong ligand field effects due to the interaction between Co
Graphene is a promising material for spintronics due tothe possibility of realizing controllable spin transport [1],its perfect spin filtering [2], and spin-relaxation lengths ofseveral micrometers at room temperature [3]. Dopinggraphene by magnetic impurities opens further possibil-ities [4–6]. In particular, the creation of extended magneticphases [7], quantum critical Kondo anomalies [8,9], andthe strong scattering of spin currents [10] have been pre-dicted. Moreover, for 3d metal atoms on graphene, thecalculated uniaxial magnetic anisotropies [11,12] are be-yond the current record value for a surface-adsorbed atom[13]. Furthermore, hydrogen adsorption has been predictedto change the spin of the adatoms [14], underlining itspotential to tailor the magnetic properties. However, thepredicted anisotropies and moments are highly controversialand largely depend on how electron correlations are treated.For the prototypical system of Co atoms on graphene, spinmoments between 1 and 3�B and anisotropies of differentsigns have been calculated [12,15–17]. At present, there isonly one experiment addressing the magnetic properties oftransition-metal adatoms on graphene. It reports on-topadsorption, a high-spin ground state, and weak magneticanisotropy for Co=graphene=SiCð0001Þ [18].
Here we present the first local measurement of themagnetic moment and anisotropy of individual Co atomson graphene on Pt(111). This substrate was chosen sincegraphene binds very weakly to it [19], thus approachingfreestanding graphene. Using scanning tunneling micros-copy (STM) spin-excitation spectroscopy [20], we find anexceptionally large magnetic anisotropy of K ¼ �8:1�0:4 meV with out-of-plane hard axis and a magneticmoment of 2:2� 0:4 �B. Fully relativistic density func-tional theory (DFT) calculations show the anisotropy to bemainly a hybridization effect. In addition to clean Co, weidentify three hydrogenated species, CoHn, n 2 f1; 2; 3g,
with very different magnetic behavior. The coexistence ofclean and hydrogenated adatoms is expected to be a gen-eral feature of transition metal atoms on graphene that hasto be considered in the interpretation of any ensemblemeasurement.The experiments were performed with a homebuilt
STM operating at T ¼ 0:4 K and in magnetic fields up toB ¼ 8:5 T perpendicular to the surface. Pt(111) was pre-pared by means of Arþ sputtering and flash annealing(1400 K) cycles until surface impurity concentrations<0:5% were reached. Graphene patches of various sizes(50–500 nm) were grown by both C segregation (1500 K,1–3 min) and chemical vapor deposition (10 L C2H4 at1230 K). 5:0� 0:5� 10�3 monolayers of Co were depos-ited in situ at 16 K and ptot � 8� 10�10 mbar using ane-beam evaporator with a 99.995% purity Co rod. This ledto individual immobile adatoms [21]. Constant-currentSTM images were acquired with a W tip at tunnel currentIt and sample bias Vt given in the figure captions. dI=dVspectra were recorded with open feedback and lock-inusing the indicated peak-to-peak modulation voltageVmod at frequency f. d2I=dV2 spectra were obtained bynumerical differentiation.The first-principles DFT calculations used the local
density approximation with a mean-field Hubbard correc-tion (LDAþU) [22,23], as implemented in QUANTUM-
ESPRESSO [24]. We chose U ¼ 4 eV for Co in agreement
with previous calculations [15]. Spin-orbit effects wereaccounted for by using the fully relativistic norm-conservingpseudopotentials acting on valence electron wave functionsrepresented in the two-component spinor form [25]. TheCoHn, n 2 f0; 1; 2; 3g, adsorption complexes were placed ina (4� 4) supercell of graphene and the structures were fullyrelaxed. The magnetic anisotropy energy was obtained fromthe difference of total energies of the out-of-plane and
PRL 111, 236801 (2013) P HY S I CA L R EV I EW LE T T E R Sweek ending
6 DECEMBER 2013
0031-9007=13=111(23)=236801(5) 236801-1 � 2013 American Physical Society
in-plane spin configurations. The first-principles simulatedSTM images show the tunnel current at a constant height of
z ¼ 4 �A above the Co adatom and use the Tersoff-Hamannapproximation [26]. The atomic spin and orbital moments,as well as the electronic configuration of the Co adatom,were obtained by projecting the wave functions of the totalsystem onto atomic orbitals of the Co atom.
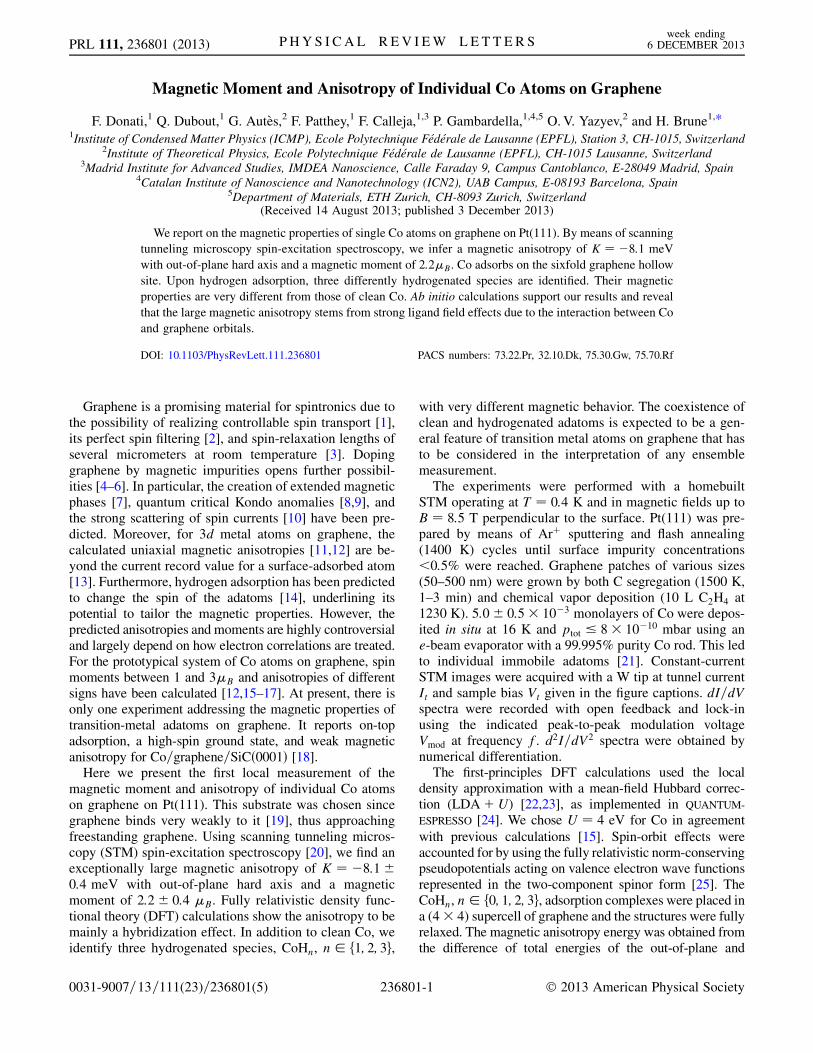
Figure 1(a) shows an atomically resolved image of thegraphene layer. It appears as a hexagonal lattice of protru-sions, one per graphene unit cell [27,28]. This can berationalized by the very small difference in substrate bindingenergy of the two C atoms in the graphene unit cell. Hence,the contrast is dominated by the difference between C6 ringsand sixfold hollow sites. The latter are imaged as protrusionswith the present tip and tunnel parameters. In addition,one distinguishes the graphene moire pattern caused bythe misfit with the Pt(111) substrate [27,29,30]. Grapheneon Pt(111) exhibits a variety of moire structures [27,30].The results presented here were obtained on the one with aperiod of (4� 4) graphene unit cells; however, they arecharacteristic of Co adatoms also on the other moirestructures.
A STM image of three Co monomers adsorbed ongraphene is shown in Fig. 1(b). The adatoms appear as
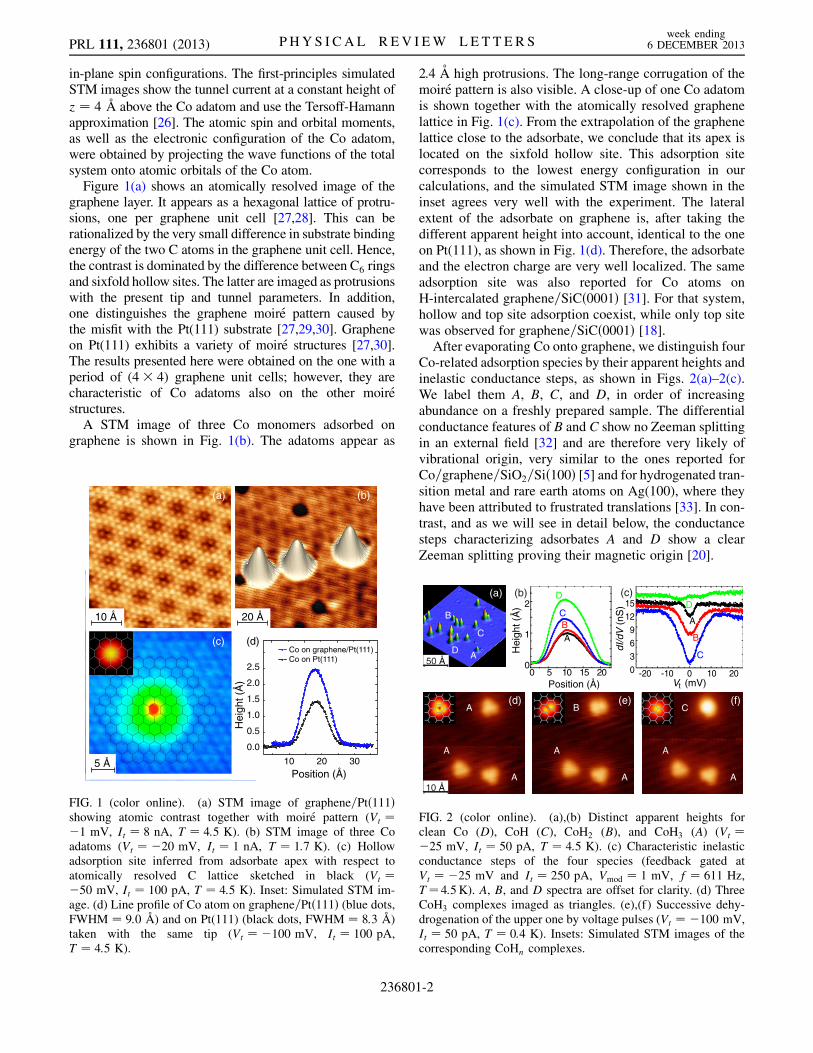
2.4 A high protrusions. The long-range corrugation of themoire pattern is also visible. A close-up of one Co adatomis shown together with the atomically resolved graphenelattice in Fig. 1(c). From the extrapolation of the graphenelattice close to the adsorbate, we conclude that its apex islocated on the sixfold hollow site. This adsorption sitecorresponds to the lowest energy configuration in ourcalculations, and the simulated STM image shown in theinset agrees very well with the experiment. The lateralextent of the adsorbate on graphene is, after taking thedifferent apparent height into account, identical to the oneon Pt(111), as shown in Fig. 1(d). Therefore, the adsorbateand the electron charge are very well localized. The sameadsorption site was also reported for Co atoms onH-intercalated graphene=SiCð0001Þ [31]. For that system,hollow and top site adsorption coexist, while only top sitewas observed for graphene=SiCð0001Þ [18].After evaporating Co onto graphene, we distinguish four
Co-related adsorption species by their apparent heights andinelastic conductance steps, as shown in Figs. 2(a)–2(c).We label them A, B, C, and D, in order of increasingabundance on a freshly prepared sample. The differentialconductance features of B and C show no Zeeman splittingin an external field [32] and are therefore very likely ofvibrational origin, very similar to the ones reported forCo=graphene=SiO2=Sið100Þ [5] and for hydrogenated tran-sition metal and rare earth atoms on Ag(100), where theyhave been attributed to frustrated translations [33]. In con-trast, and as we will see in detail below, the conductancesteps characterizing adsorbates A and D show a clearZeeman splitting proving their magnetic origin [20].
(c)
20 Å
(b)(a)
10 Å
5 Å
Co on graphene/Pt(111)Co on Pt(111)
10 20 30
0.0
0.5
1.0
1.5
2.0
2.5
Position (Å)
Hei
ght (
Å)
(d)
FIG. 1 (color online). (a) STM image of graphene=Ptð111Þshowing atomic contrast together with moire pattern (Vt ¼�1 mV, It ¼ 8 nA, T ¼ 4:5 K). (b) STM image of three Coadatoms (Vt ¼ �20 mV, It ¼ 1 nA, T ¼ 1:7 K). (c) Hollowadsorption site inferred from adsorbate apex with respect toatomically resolved C lattice sketched in black (Vt ¼�50 mV, It ¼ 100 pA, T ¼ 4:5 K). Inset: Simulated STM im-age. (d) Line profile of Co atom on graphene=Ptð111Þ (blue dots,FWHM ¼ 9:0 �A) and on Pt(111) (black dots, FWHM ¼ 8:3 �A)taken with the same tip (Vt ¼ �100 mV, It ¼ 100 pA,T ¼ 4:5 K).
(b)
-20 -10 0 10 200369
1215
50 Å0 5 10 15 20
0
1
2(c)
AD
C
B
(a)
(d) (e) (f)
D
CBA
C
B
A
D
A
A
A B C
Hei
ght (
Å)
Position (Å) V (mV)t
dI/d
V (
nS)
10 Å
A
A
A
A
FIG. 2 (color online). (a),(b) Distinct apparent heights forclean Co (D), CoH (C), CoH2 (B), and CoH3 (A) (Vt ¼�25 mV, It ¼ 50 pA, T ¼ 4:5 K). (c) Characteristic inelasticconductance steps of the four species (feedback gated atVt ¼ �25 mV and It ¼ 250 pA, Vmod ¼ 1 mV, f ¼ 611 Hz,T¼4:5K). A, B, and D spectra are offset for clarity. (d) ThreeCoH3 complexes imaged as triangles. (e),(f) Successive dehy-drogenation of the upper one by voltage pulses (Vt ¼ �100 mV,It ¼ 50 pA, T ¼ 0:4 K). Insets: Simulated STM images of thecorresponding CoHn complexes.
PRL 111, 236801 (2013) P HY S I CA L R EV I EW LE T T E R Sweek ending
6 DECEMBER 2013
236801-2
In order to identify the four species, we note that adsorp-tion complex A can be transformed into B by applyinga tunnel voltage of jVtj ¼ 155� 11 mV with the tip posi-tioned above the adsorbate. This transformation can becontinued towards type C with jVtj ¼ 180� 7 mV, andthis type is finally converted into typeDwith jVtj ¼ 454�31 mV [32]. Further increase of the tunnel voltage leadsto a jump of the adsorbate to another hollow site, withoutaltering its type D character. The irreversibility of thistransformation suggests a successive chemical modifica-tion of the adsorbed species that is terminated once type Dis reached.
Individual adsorbed transition metal atoms have beenproven to dissociate H2 with very high efficiency [34]. Weobserve that direct exposure of the sample toH2 transformsall species almost entirely into type A. Similarly, exposureto the residual gas of the UHV chamber surrounding thecryostat augments the abundance of A while D stronglydecreases [32]. This identifies type A as most and typeD asleast hydrogenated one. A comparison of high-resolutionSTM images with simulated ones identifies the intermedi-ate species. Figure 2(d) shows that type A has a triangularenvelope in striking agreement with the simulated STMimage of CoH3 shown in the inset. The upper adsorbatein Figs. 2(d)–2(f) has successively been transformed withvoltage pulses as described above, while the lower twoadsorbates remained unchanged in nature and appearance,proving that the tip apex did not change. Type B is imagedas two distinct protrusions, while C is imaged as a singleone, both in excellent agreement with the simulated STMimages for CoH2 and CoH; see insets. Altogether, theseobservations unequivocally identify species D as clean Coand C, B, A as CoHn, n 2 f1; 2; 3g. The three adsorbates inFig. 1(b) are of type D; i.e., they are clean Co adatoms.
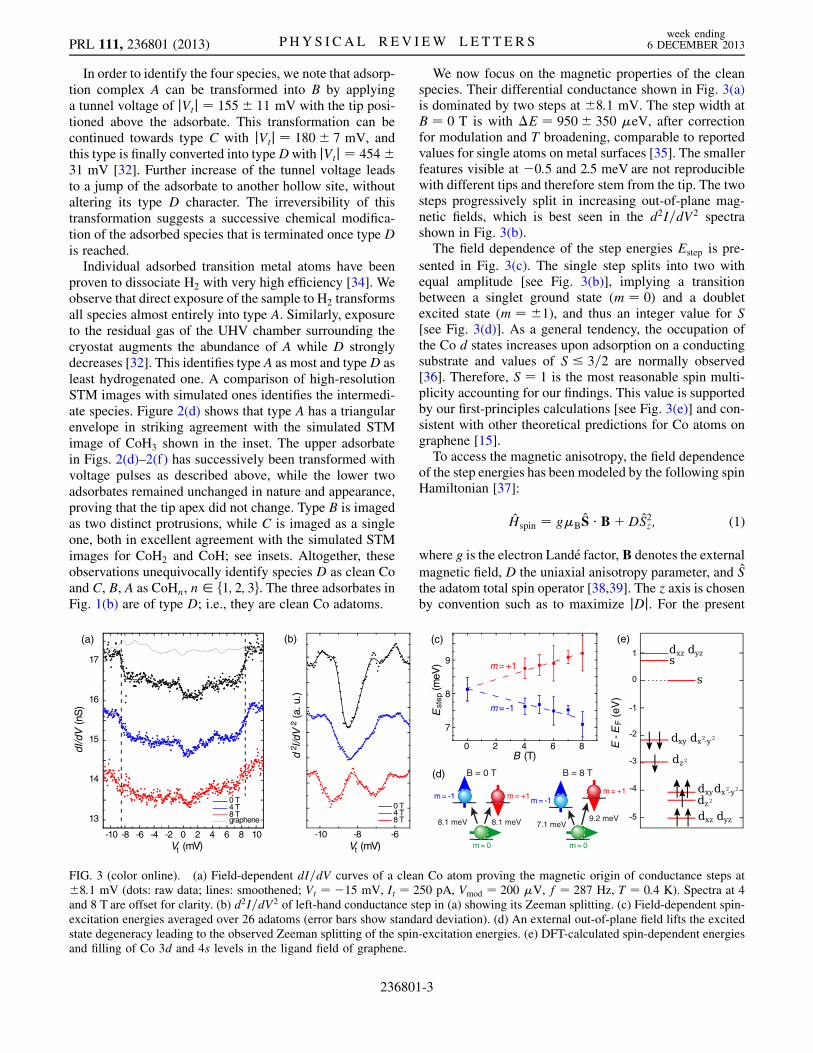
We now focus on the magnetic properties of the cleanspecies. Their differential conductance shown in Fig. 3(a)is dominated by two steps at �8:1 mV. The step width atB ¼ 0 T is with �E ¼ 950� 350 �eV, after correctionfor modulation and T broadening, comparable to reportedvalues for single atoms on metal surfaces [35]. The smallerfeatures visible at �0:5 and 2.5 meV are not reproduciblewith different tips and therefore stem from the tip. The twosteps progressively split in increasing out-of-plane mag-netic fields, which is best seen in the d2I=dV2 spectrashown in Fig. 3(b).The field dependence of the step energies Estep is pre-
sented in Fig. 3(c). The single step splits into two withequal amplitude [see Fig. 3(b)], implying a transitionbetween a singlet ground state (m ¼ 0) and a doubletexcited state (m ¼ �1), and thus an integer value for S[see Fig. 3(d)]. As a general tendency, the occupation ofthe Co d states increases upon adsorption on a conductingsubstrate and values of S � 3=2 are normally observed[36]. Therefore, S ¼ 1 is the most reasonable spin multi-plicity accounting for our findings. This value is supportedby our first-principles calculations [see Fig. 3(e)] and con-sistent with other theoretical predictions for Co atoms ongraphene [15].To access the magnetic anisotropy, the field dependence
of the step energies has been modeled by the following spinHamiltonian [37]:
Hspin ¼ g�BS �BþDS2z ; (1)
where g is the electron Lande factor,B denotes the external
magnetic field, D the uniaxial anisotropy parameter, and Sthe adatom total spin operator [38,39]. The z axis is chosenby convention such as to maximize jDj. For the present
0 2 4 6 8
7
8
9 m = +1
m = -1E
B (T)
step
(c)
(meV
)
-10 -8 -6
d I 2
/dV
2 (a
. u.)
Vt (mV)
0 T 4 T 8 T
(b)(a)
-10 -8 -6 -4 -2 0 2 4 6 8 10
13
14
15
16
17
dI/d
V (
nS)
Vt (mV)
0 T 4 T 8 T graphene
(e)
E -
EF (
eV)
(d) B = 0 T
8.1 meV 8.1 meV
m = +1 m = -1
m = 0
B = 8 T
7.1 meV9.2 meV
m = +1 m = -1
m = 0
FIG. 3 (color online). (a) Field-dependent dI=dV curves of a clean Co atom proving the magnetic origin of conductance steps at�8:1 mV (dots: raw data; lines: smoothened; Vt ¼ �15 mV, It ¼ 250 pA, Vmod ¼ 200 �V, f ¼ 287 Hz, T ¼ 0:4 K). Spectra at 4and 8 T are offset for clarity. (b) d2I=dV2 of left-hand conductance step in (a) showing its Zeeman splitting. (c) Field-dependent spin-excitation energies averaged over 26 adatoms (error bars show standard deviation). (d) An external out-of-plane field lifts the excitedstate degeneracy leading to the observed Zeeman splitting of the spin-excitation energies. (e) DFT-calculated spin-dependent energiesand filling of Co 3d and 4s levels in the ligand field of graphene.
PRL 111, 236801 (2013) P HY S I CA L R EV I EW LE T T E R Sweek ending
6 DECEMBER 2013
236801-3
case, we find that z is the out-of-plane direction. Thesinglet m ¼ 0 ground state implies a positive value of D,and thus a hard out-of-plane axis. Fitting the field-dependent excitation energies of Fig. 3(c), we obtain D ¼8:1� 0:4 meV and g ¼ 2:2� 0:4. Deviations from thefree-electron g factor of 2 can be rationalized in terms oforbital contributions to the total magnetic moment, whichcan be significant for single adatoms [36]. Assuming S ¼1, we then obtain an effective spin magnetic moment of2:2� 0:4�B and a magnetic anisotropy K¼�DS2z¼�8:1�0:4meV [40], with the sign convention thatpositive values of K signify easy out-of-plane magnetiza-tion axes.
For Co on freestanding graphene, our LDAþU calcu-lations show an out-of-plane hard axis, an anisotropy valueof K ¼ �9:55 meV, and a local spin moment of mS ¼1:84�B, all three in excellent agreement with our experi-mental findings and with one of the three possible scenar-ios formerly found by DFT [15]. The local orbital moment
is predicted to have a strong anisotropy withmkL ¼ 0:70�B
for the in-plane and m?L ¼ 0:02�B for the out-of-plane
magnetization. Our calculations further show that theeffect of the Pt(111) substrate on the magnetic propertiesof Co adatoms is very weak [32].
The absolute value of the anisotropy is within the errorbar identical to the present single atom record ofK ¼ 9:3�1:6 meV measured for Co=Ptð111Þ, where the anisotropy ismostly caused by the spin-orbit coupling of the heavysubstrate atoms [13]. Since the spin-orbit coupling is veryweak in graphene, the observed anisotropy is surprisinglyhigh. Our calculations reveal that such a high value of Koriginates from the very strong anisotropy of the orbital
moment [41]. Its calculated value mkL �m?
L ¼ 0:68�B is
significantly larger than in the case of Co adatoms onPt(111) [13]. The orbital anisotropy is mostly an effect ofthe strong hybridization between Co and graphene statesand stems from the almost pure axial symmetry of thesixfold adsorption site, which induces a large zero-fieldsplitting of the lowest Co states [15]. Evidence for stronghybridization between Co and graphene is inferred from Co-thin-film–graphene interface anisotropies [42,43] and fromthe induced magnetization found in Co-island–grapheneinterfaces [44].
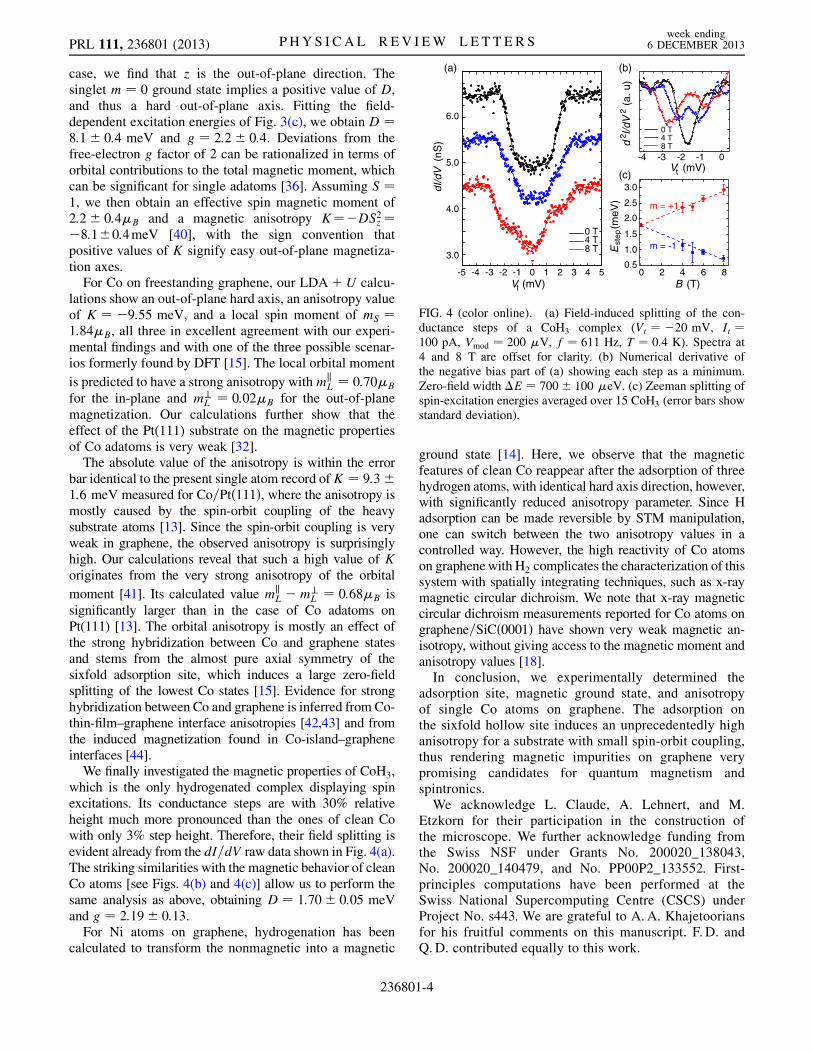
We finally investigated the magnetic properties of CoH3,which is the only hydrogenated complex displaying spinexcitations. Its conductance steps are with 30% relativeheight much more pronounced than the ones of clean Cowith only 3% step height. Therefore, their field splitting isevident already from the dI=dV raw data shown in Fig. 4(a).The striking similarities with the magnetic behavior of cleanCo atoms [see Figs. 4(b) and 4(c)] allow us to perform thesame analysis as above, obtaining D ¼ 1:70� 0:05 meVand g ¼ 2:19� 0:13.
For Ni atoms on graphene, hydrogenation has beencalculated to transform the nonmagnetic into a magnetic
ground state [14]. Here, we observe that the magneticfeatures of clean Co reappear after the adsorption of threehydrogen atoms, with identical hard axis direction, however,with significantly reduced anisotropy parameter. Since Hadsorption can be made reversible by STM manipulation,one can switch between the two anisotropy values in acontrolled way. However, the high reactivity of Co atomson graphenewithH2 complicates the characterization of thissystem with spatially integrating techniques, such as x-raymagnetic circular dichroism. We note that x-ray magneticcircular dichroism measurements reported for Co atoms ongraphene=SiCð0001Þ have shown very weak magnetic an-isotropy, without giving access to the magnetic moment andanisotropy values [18].In conclusion, we experimentally determined the
adsorption site, magnetic ground state, and anisotropyof single Co atoms on graphene. The adsorption onthe sixfold hollow site induces an unprecedentedly highanisotropy for a substrate with small spin-orbit coupling,thus rendering magnetic impurities on graphene verypromising candidates for quantum magnetism andspintronics.We acknowledge L. Claude, A. Lehnert, and M.
Etzkorn for their participation in the construction ofthe microscope. We further acknowledge funding fromthe Swiss NSF under Grants No. 200020_138043,No. 200020_140479, and No. PP00P2_133552. First-principles computations have been performed at theSwiss National Supercomputing Centre (CSCS) underProject No. s443. We are grateful to A. A. Khajetooriansfor his fruitful comments on this manuscript. F. D. andQ. D. contributed equally to this work.
(b)(a)
(c)
dI/d
V (
nS)
Est
ep(m
eV)
B (T)
V (mV)t
d I/
dV (
a. u
)2
2
m = -1
m = +1
0 T4 T8 T
0 T4 T8 T
0 2 4 6 8
-4 -3 -2 -1 0
0.5
1.0
1.5
2.0
2.5
3.0
1 2 3 4-4 -3 -2 -1 0
5.0
6.0
3.0
4.0
V (mV)t
-5 5
FIG. 4 (color online). (a) Field-induced splitting of the con-ductance steps of a CoH3 complex (Vt ¼ �20 mV, It ¼100 pA, Vmod ¼ 200 �V, f ¼ 611 Hz, T ¼ 0:4 K). Spectra at4 and 8 T are offset for clarity. (b) Numerical derivative ofthe negative bias part of (a) showing each step as a minimum.Zero-field width �E ¼ 700� 100 �eV. (c) Zeeman splitting ofspin-excitation energies averaged over 15 CoH3 (error bars showstandard deviation).
PRL 111, 236801 (2013) P HY S I CA L R EV I EW LE T T E R Sweek ending
[1] Y.W. Son, M. L. Cohen, and S. G. Louie, Nature (London)444, 347 (2006).
[2] V.M. Karpan, G. Giovannetti, P. A. Khomyakov, M.Talanana, A.A. Starikov, M. Zwierzycki, J.vandenBrink, G. Brocks, and P. J. Kelly, Phys. Rev. Lett.99, 176602 (2007).
[3] N. Tombros, C. Jozsa, M. Popinciuc, H. T. Jonkman, andB. J. van Wees, Nature (London) 448, 571 (2007).
[4] A. V. Krasheninnikov, P. O. Lehtinen, A. S. Foster, P.Pyykko, and R.M. Nieminen, Phys. Rev. Lett. 102,126807 (2009).
[5] V.W. Brar, R. Decker, H.M. Solowan, Y. Wang, L.Maserati, K. T. Chan, H. Lee, C.O. Girit, A. Zettl, S. G.Louie, M. L. Cohen, and M. F. Crommie, Nat. Phys. 7, 43(2011).
[6] Y. Wang, V.W. Brar, A.V. Shytov, Q. Wu, W. Regan, H. Z.Tsai, A. Zettl, L. S. Levitov, and M. F. Crommie, Nat.Phys. 8, 653 (2012).
[7] H. Sevincli, M. Topsakal, E. Durgun, and S. Ciraci, Phys.Rev. B 77, 195434 (2008).
[8] K. Sengupta and G. Baskaran, Phys. Rev. B 77, 045417(2008).
[9] B. Uchoa, T. G. Rappoport, and A.H. Castro Neto, Phys.Rev. Lett. 106, 016801 (2011).
[10] K.M. McCreary, A. G. Swartz, W. Han, J. Fabian, andR.K. Kawakami, Phys. Rev. Lett. 109, 186604 (2012).
[11] M. Sargolzaei and F. Gudarzi, J. Appl. Phys. 110, 064303(2011).
[12] R. J. Xiao, D. Fritsch, M.D. Kuz’min, K. Koepernik, H.Eschrig, M. Richter, K. Vietze, and G. Seifert, Phys. Rev.Lett. 103, 187201 (2009).
[13] P. Gambardella, S. Rusponi, M. Veronese, S. S. Dhesi, C.Grazioli, A. Dallmeyer, I. Cabria, R. Zeller, P. H.Dederichs, K. Kern, C. Carbone, and H. Brune, Science300, 1130 (2003).
[14] T.O. Wehling, A. I. Lichtenstein, and M. I. Katsnelson,Phys. Rev. B 84, 235110 (2011).
[15] T.O. Wehling, A.V. Balatsky, M. I. Katsnelson, A. I.Lichtenstein, and A. Rosch, Phys. Rev. B 81, 115427(2010).
[16] O. V. Yazyev and A. Pasquarello, Phys. Rev. B 82, 045407(2010).
[17] A. N. Rudenko, F. J. Keil, M. I. Katsnelson, and A. I.Lichtenstein, Phys. Rev. B 86, 075422 (2012).
[18] T. Eelbo, M. Wasniowska, P. Thakur, M. Gyamfi, B.Sachs, T. O. Wehling, S. Forti, U. Starke, C. Tieg, A. I.Lichtenstein, and R. Wiesendanger, Phys. Rev. Lett. 110,136804 (2013).
[19] J. Wintterlin and M. L. Bocquet, Surf. Sci. 603, 1841(2009).
[20] A. J. Heinrich, J. A. Gupta, C. P. Lutz, and D.M. Eigler,Science 306, 466 (2004).
[21] H. Brune, Surf. Sci. Rep. 31, 125 (1998).[22] V. I. Anisimov, J. Zaanen, and O.K. Andersen, Phys. Rev.
B 44, 943 (1991).[23] M. Cococcioni and S. de Gironcoli, Phys. Rev. B 71,
035105 (2005).
[24] P. Giannozzi et al., J. Phys. Condens. Matter 21, 395502(2009).
[25] A. Dal Corso and A. Mosca Conte, Phys. Rev. B 71,115106 (2005).
[26] J. Tersoff and D. R. Hamann, Phys. Rev. B 31, 805(1985).
[27] M. Gao, Y. Pan, L. Huang, H. Hu, L. Z. Zhang, H.M. Guo,S. X. Du, and H. J. Gao, Appl. Phys. Lett. 98, 033101(2011).
[28] M. Papagno, D. Pacile, D. Topwal, P. Moras, P.M.Sheverdyaeva, F. D. Natterer, A. Lehnert, S. Rusponi, Q.Dubout, F. Calleja, E. Frantzeskakis, S. Pons, J. Fujii, I.Vobornik, M. Grioni, C. Carbone, and H. Brune, ACSNano 6, 9299 (2012).
[29] T.A. Land, T. Michely, R. J. Behm, J. C. Hemminger, andG. Comsa, Surf. Sci. 264, 261 (1992).
[30] P. Merino, M. Svec, A. L. Pinardi, G. Otero, and J. A.Martın-Gago, ACS Nano 5, 5627 (2011).
[31] T. Eelbo, M. Wasniowska, M. Gyamfi, S. Forti, U. Starke,and R. Wiesendanger, Phys. Rev. B 87, 205443 (2013).
[32] See Supplemental Material at http://link.aps.org/supplemental/10.1103/PhysRevLett.111.236801 foradditional information about the identification and themagnetic characterization of differently hydrogenatedspecies, the threshold tunnel voltages for transformationof one species into the other, as well as the DFTcalculations of the Co adsorption sites and the influenceof the Pt substrate.
[33] M. Pivetta, M. Ternes, F. Patthey, and W.D. Schneider,Phys. Rev. Lett. 99, 126104 (2007).
[34] F. D. Natterer, F. Patthey, and H. Brune, Surf. Sci. 615, 80(2013).
[35] A. A. Khajetoorians, S. Lounis, B. Chilian, A. T. Costa, L.Zhou, D. L. Mills, J. Wiebe, and R. Wiesendanger, Phys.Rev. Lett. 106, 037205 (2011).
[36] H. Brune and P. Gambardella, Surf. Sci. 603, 1812 (2009).[37] A. Abragam and B. Bleaney, Electron Paramagnetic
Resonance of Transition Ions (Clarendon Press, Oxford,England, 1970).
[38] For the hexagonal symmetry, the first transverse anisot-ropy term is of sixth order [39]; therefore, it can beomitted in Eq. (1) for S < 3.
[39] S. K. Misra, C. P. Poole, and H.A. Farach, Appl. Magn.Reson. 11, 29 (1996).
[40] For a m ¼ 0 ! m ¼ �1 transition, D corresponds to thezero-field excitation energy and is directly measured,while K depends on the choice of S. Therefore, the valueof K inferred for S ¼ 1 represents a lower limit for themagnetic anisotropy.
[41] P. Bruno, Phys. Rev. B 39, 865 (1989).[42] C. Vo-Van, Z. Kassir-Bodon, H.X. Yang, J. Coraux, J.
Vogel, S. Pizzini, P. Bayle-Guillemaud, M. Chshiev, L.Ranno, V. Guisset, P. David, V. Salvador, and O. Fruchart,New J. Phys. 12, 103040 (2010).
[43] N. Rougemaille, A. T. N’Diaye, J. Coraux, C. Vo-Van, O.Fruchart, and A.K. Schmid, Appl. Phys. Lett. 101, 142403(2012).
[44] R. Decker, J. Brede, N. Atodiresei, V. Caciuc, S. Blugel,and R. Wiesendanger, Phys. Rev. B 87, 041403 (2013).
PRL 111, 236801 (2013) P HY S I CA L R EV I EW LE T T E R Sweek ending
Supplementary Material for“Magnetic Moment and Anisotropy of Individual Co Atoms on Graphene”
F. Donati,1, ∗ Q. Dubout,1, ∗ G. Autes,2 F. Patthey,1 F. Calleja,1, 3 P. Gambardella,1, 4, 5 O. V. Yazyev,2 and H. Brune1
1Institute of Condensed Matter Physics (ICMP),Ecole Polytechnique Federale de Lausanne (EPFL), Station 3, CH-1015, Switzerland
2Institute of Theoretical Physics (ITP), Ecole Polytechnique Federale de Lausanne (EPFL), CH-1015 Lausanne, Switzerland3Madrid Institute for Advanced Studies, IMDEA Nanoscience,
Calle Faraday 9, Campus Cantoblanco, E-28049 Madrid, Spain4Catalan Institute of Nanotechnology (ICN), UAB Campus, E-08193 Barcelona, Spain
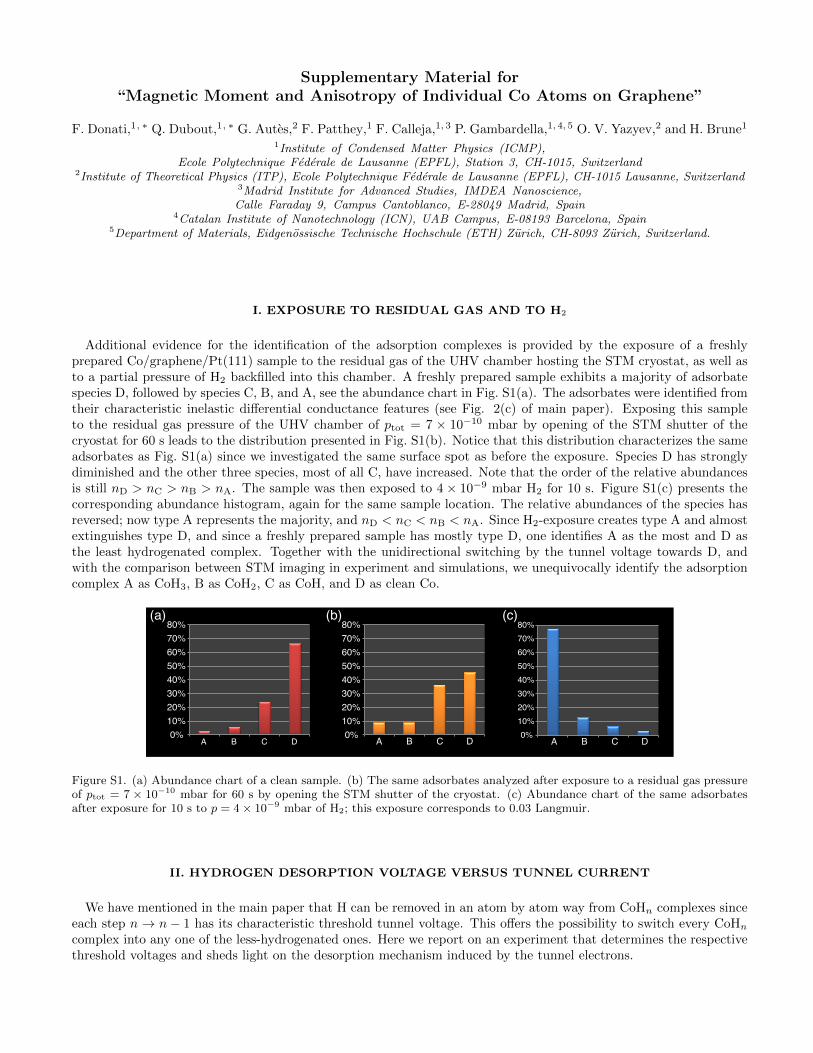
Additional evidence for the identification of the adsorption complexes is provided by the exposure of a freshlyprepared Co/graphene/Pt(111) sample to the residual gas of the UHV chamber hosting the STM cryostat, as well asto a partial pressure of H2 backfilled into this chamber. A freshly prepared sample exhibits a majority of adsorbatespecies D, followed by species C, B, and A, see the abundance chart in Fig. S1(a). The adsorbates were identified fromtheir characteristic inelastic differential conductance features (see Fig. 2(c) of main paper). Exposing this sampleto the residual gas pressure of the UHV chamber of ptot = 7 × 10⁻¹⁰ mbar by opening of the STM shutter of thecryostat for 60 s leads to the distribution presented in Fig. S1(b). Notice that this distribution characterizes the sameadsorbates as Fig. S1(a) since we investigated the same surface spot as before the exposure. Species D has stronglydiminished and the other three species, most of all C, have increased. Note that the order of the relative abundancesis still nD > nC > nB > nA. The sample was then exposed to 4× 10⁻⁹ mbar H2 for 10 s. Figure S1(c) presents thecorresponding abundance histogram, again for the same sample location. The relative abundances of the species hasreversed; now type A represents the majority, and nD < nC < nB < nA. Since H2-exposure creates type A and almostextinguishes type D, and since a freshly prepared sample has mostly type D, one identifies A as the most and D asthe least hydrogenated complex. Together with the unidirectional switching by the tunnel voltage towards D, andwith the comparison between STM imaging in experiment and simulations, we unequivocally identify the adsorptioncomplex A as CoH3, B as CoH2, C as CoH, and D as clean Co.
0%10%20%30%40%50%60%70%80%
A B C D0%
10%20%30%40%50%60%70%80%
A B C D0%
10%
20%
30%
40%
50%
60%
70%
80%
A B C D
(a) (b) (c)
Figure S1. (a) Abundance chart of a clean sample. (b) The same adsorbates analyzed after exposure to a residual gas pressureof ptot = 7 × 10⁻¹⁰ mbar for 60 s by opening the STM shutter of the cryostat. (c) Abundance chart of the same adsorbatesafter exposure for 10 s to p = 4× 10⁻⁹ mbar of H2; this exposure corresponds to 0.03 Langmuir.
II. HYDROGEN DESORPTION VOLTAGE VERSUS TUNNEL CURRENT
We have mentioned in the main paper that H can be removed in an atom by atom way from CoHn complexes sinceeach step n→ n− 1 has its characteristic threshold tunnel voltage. This offers the possibility to switch every CoHn
complex into any one of the less-hydrogenated ones. Here we report on an experiment that determines the respectivethreshold voltages and sheds light on the desorption mechanism induced by the tunnel electrons.
2
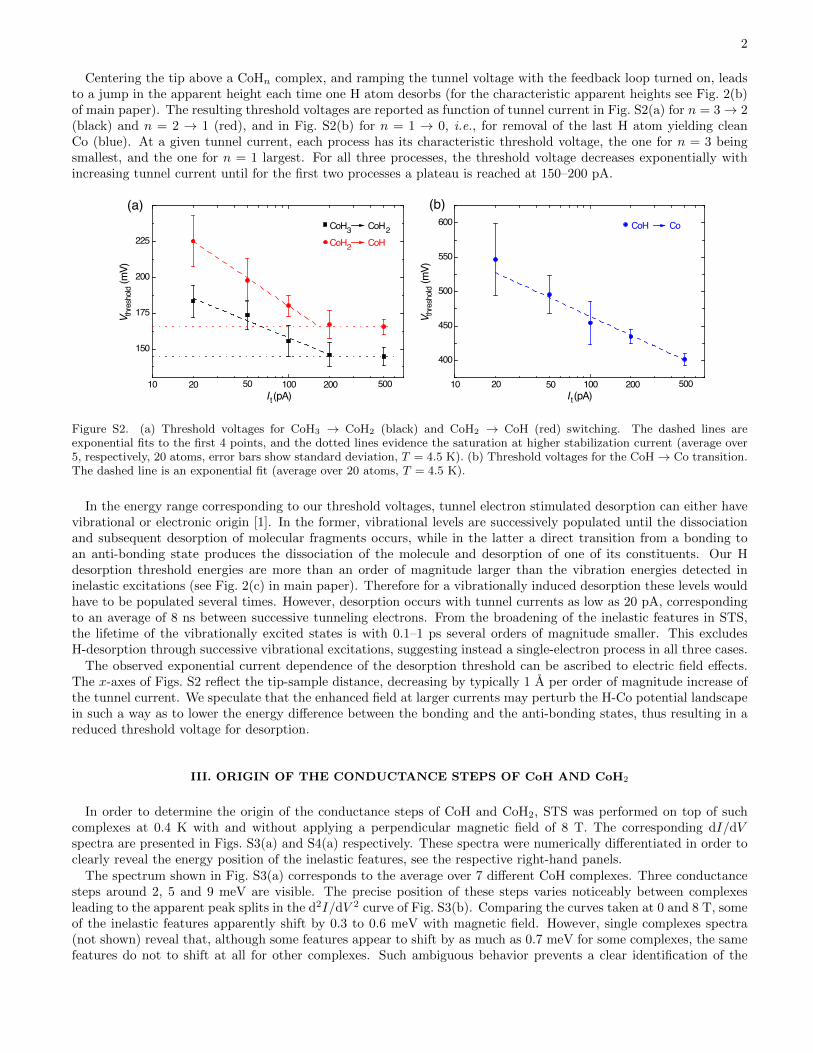
Centering the tip above a CoHn complex, and ramping the tunnel voltage with the feedback loop turned on, leadsto a jump in the apparent height each time one H atom desorbs (for the characteristic apparent heights see Fig. 2(b)of main paper). The resulting threshold voltages are reported as function of tunnel current in Fig. S2(a) for n = 3→ 2(black) and n = 2 → 1 (red), and in Fig. S2(b) for n = 1 → 0, i.e., for removal of the last H atom yielding cleanCo (blue). At a given tunnel current, each process has its characteristic threshold voltage, the one for n = 3 beingsmallest, and the one for n = 1 largest. For all three processes, the threshold voltage decreases exponentially withincreasing tunnel current until for the first two processes a plateau is reached at 150–200 pA.
(a) (b)
10 100
400
450
500
550
600
20 200 50050
V thr
esho
ld (m
V)
I t (pA)
CoH Co
CoH
CoH
10 100
150
175
200
225
CoH 2
CoH 3 2
20 20050
V thr
esho
ld (m
V)
I t (pA)500
Figure S2. (a) Threshold voltages for CoH3 → CoH2 (black) and CoH2 → CoH (red) switching. The dashed lines areexponential fits to the first 4 points, and the dotted lines evidence the saturation at higher stabilization current (average over5, respectively, 20 atoms, error bars show standard deviation, T = 4.5 K). (b) Threshold voltages for the CoH→ Co transition.The dashed line is an exponential fit (average over 20 atoms, T = 4.5 K).
In the energy range corresponding to our threshold voltages, tunnel electron stimulated desorption can either havevibrational or electronic origin [1]. In the former, vibrational levels are successively populated until the dissociationand subsequent desorption of molecular fragments occurs, while in the latter a direct transition from a bonding toan anti-bonding state produces the dissociation of the molecule and desorption of one of its constituents. Our Hdesorption threshold energies are more than an order of magnitude larger than the vibration energies detected ininelastic excitations (see Fig. 2(c) in main paper). Therefore for a vibrationally induced desorption these levels wouldhave to be populated several times. However, desorption occurs with tunnel currents as low as 20 pA, correspondingto an average of 8 ns between successive tunneling electrons. From the broadening of the inelastic features in STS,the lifetime of the vibrationally excited states is with 0.1–1 ps several orders of magnitude smaller. This excludesH-desorption through successive vibrational excitations, suggesting instead a single-electron process in all three cases.
The observed exponential current dependence of the desorption threshold can be ascribed to electric field effects.The x-axes of Figs. S2 reflect the tip-sample distance, decreasing by typically 1 A per order of magnitude increase ofthe tunnel current. We speculate that the enhanced field at larger currents may perturb the H-Co potential landscapein such a way as to lower the energy difference between the bonding and the anti-bonding states, thus resulting in areduced threshold voltage for desorption.
III. ORIGIN OF THE CONDUCTANCE STEPS OF CoH AND CoH2
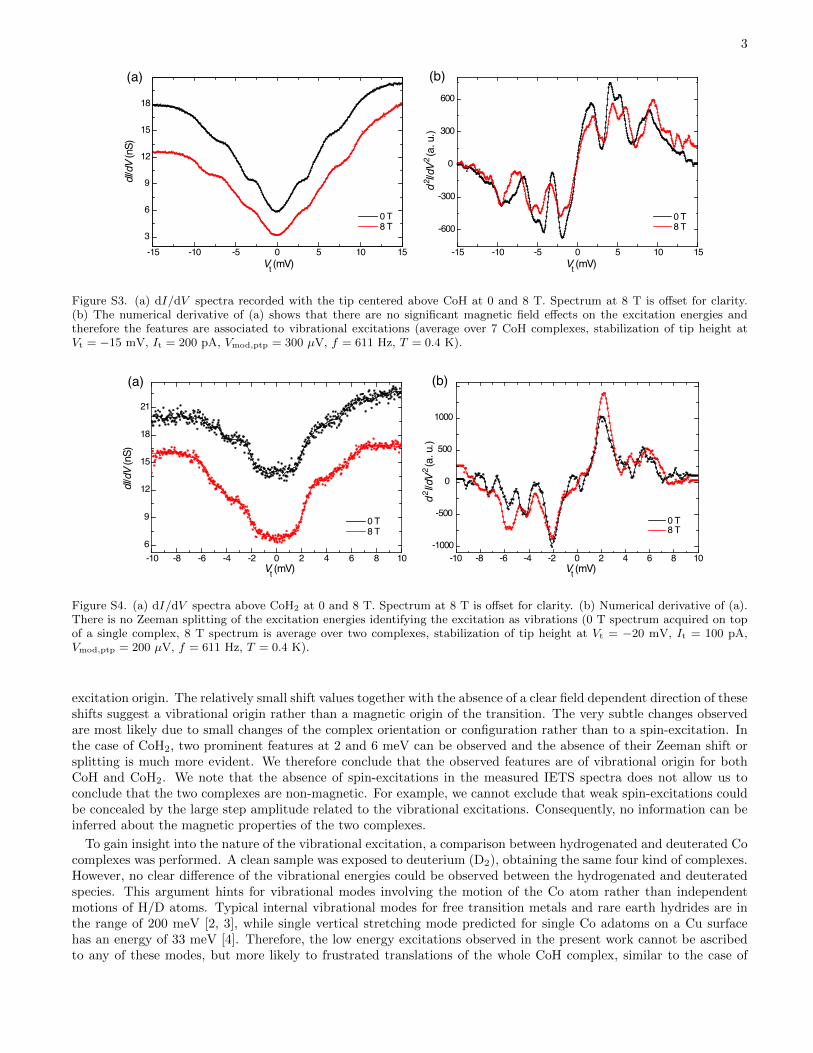
In order to determine the origin of the conductance steps of CoH and CoH2, STS was performed on top of suchcomplexes at 0.4 K with and without applying a perpendicular magnetic field of 8 T. The corresponding dI/dVspectra are presented in Figs. S3(a) and S4(a) respectively. These spectra were numerically differentiated in order toclearly reveal the energy position of the inelastic features, see the respective right-hand panels.
The spectrum shown in Fig. S3(a) corresponds to the average over 7 different CoH complexes. Three conductancesteps around 2, 5 and 9 meV are visible. The precise position of these steps varies noticeably between complexesleading to the apparent peak splits in the d2I/dV 2 curve of Fig. S3(b). Comparing the curves taken at 0 and 8 T, someof the inelastic features apparently shift by 0.3 to 0.6 meV with magnetic field. However, single complexes spectra(not shown) reveal that, although some features appear to shift by as much as 0.7 meV for some complexes, the samefeatures do not to shift at all for other complexes. Such ambiguous behavior prevents a clear identification of the
3
(a) (b)
-15 -10 -5 0 5 10 15
3
6
9
12
15
18
dI/d
V (n
S)
V (mV)
0 T 8 T
t
-15 -10 -5 0 5 10 15
-600
-300
0
300
600
d2 I/d
V2 (a
. u.)
0 T 8 T
V (mV)t
Figure S3. (a) dI/dV spectra recorded with the tip centered above CoH at 0 and 8 T. Spectrum at 8 T is offset for clarity.(b) The numerical derivative of (a) shows that there are no significant magnetic field effects on the excitation energies andtherefore the features are associated to vibrational excitations (average over 7 CoH complexes, stabilization of tip height atVt = −15 mV, It = 200 pA, Vmod,ptp = 300 µV, f = 611 Hz, T = 0.4 K).
(a) (b)
V (mV)t
-10 -8 -6 -4 -2 0 2 4 6 8 10
6
9
12
15
18
21
0 T 8 T
-10 -8 -6 -4 -2 0 2 4 6 8 10-1000
-500
0
500
1000
0 T 8 T
d2 I/d
V2 (a
. u.)
dI/d
V (n
S)
V (mV)t
Figure S4. (a) dI/dV spectra above CoH2 at 0 and 8 T. Spectrum at 8 T is offset for clarity. (b) Numerical derivative of (a).There is no Zeeman splitting of the excitation energies identifying the excitation as vibrations (0 T spectrum acquired on topof a single complex, 8 T spectrum is average over two complexes, stabilization of tip height at Vt = −20 mV, It = 100 pA,Vmod,ptp = 200 µV, f = 611 Hz, T = 0.4 K).
excitation origin. The relatively small shift values together with the absence of a clear field dependent direction of theseshifts suggest a vibrational origin rather than a magnetic origin of the transition. The very subtle changes observedare most likely due to small changes of the complex orientation or configuration rather than to a spin-excitation. Inthe case of CoH2, two prominent features at 2 and 6 meV can be observed and the absence of their Zeeman shift orsplitting is much more evident. We therefore conclude that the observed features are of vibrational origin for bothCoH and CoH2. We note that the absence of spin-excitations in the measured IETS spectra does not allow us toconclude that the two complexes are non-magnetic. For example, we cannot exclude that weak spin-excitations couldbe concealed by the large step amplitude related to the vibrational excitations. Consequently, no information can beinferred about the magnetic properties of the two complexes.
To gain insight into the nature of the vibrational excitation, a comparison between hydrogenated and deuterated Cocomplexes was performed. A clean sample was exposed to deuterium (D2), obtaining the same four kind of complexes.However, no clear difference of the vibrational energies could be observed between the hydrogenated and deuteratedspecies. This argument hints for vibrational modes involving the motion of the Co atom rather than independentmotions of H/D atoms. Typical internal vibrational modes for free transition metals and rare earth hydrides are inthe range of 200 meV [2, 3], while single vertical stretching mode predicted for single Co adatoms on a Cu surfacehas an energy of 33 meV [4]. Therefore, the low energy excitations observed in the present work cannot be ascribedto any of these modes, but more likely to frustrated translations of the whole CoH complex, similar to the case of
4
CeH/Ag(100) [5] and CO/Cu(100) [6, 7].
We finally note that no vibrational excitations were observed for CoH3. We speculate that, for this complex,frustrated translations could be forbidden by symmetry as a consequence of the three-fold H arrangement around theCo adsorbate (Fig. 2(d)), as for NH3 on fcc (111) transition metal surfaces [8].
IV. ADSORPTION SITES AND BINDING ENERGIES FROM FIRST-PRINCIPLE CALCULATIONS
We performed first-principle calculations of the total energy for the 4 adsorbed species observed in experiment (Co,CoH, CoH2 and CoH3) within the LDA+U approximation (U = 4 eV). For each adsorption complex, we comparedthe two most probable adsorption sites for Co: on top of a carbon atom (top) and in the center of a carbon hexagon(hex). The adatoms were placed in a 4 × 4 supercell of graphene and the structures were fully relaxed. From thetotal energies, we were able to identify the most favorable adsorptions sites and the binding energies of hydrogen onthe cobalt adatoms. The binding energies were calculated as Ebind(n) = ECoHn −ECoHn−1 − 1/2 EH2 , for n = 1, 2, 3.The results are summarized in Table I.
Table I. Adsorption sites and hydrogen binding energies
of Co atoms and CoHn complexes on graphene.
Adsorption site Ebind (eV)
Co hex
CoH top −1.171
CoH2 top −0.400
CoH3 hex −0.134
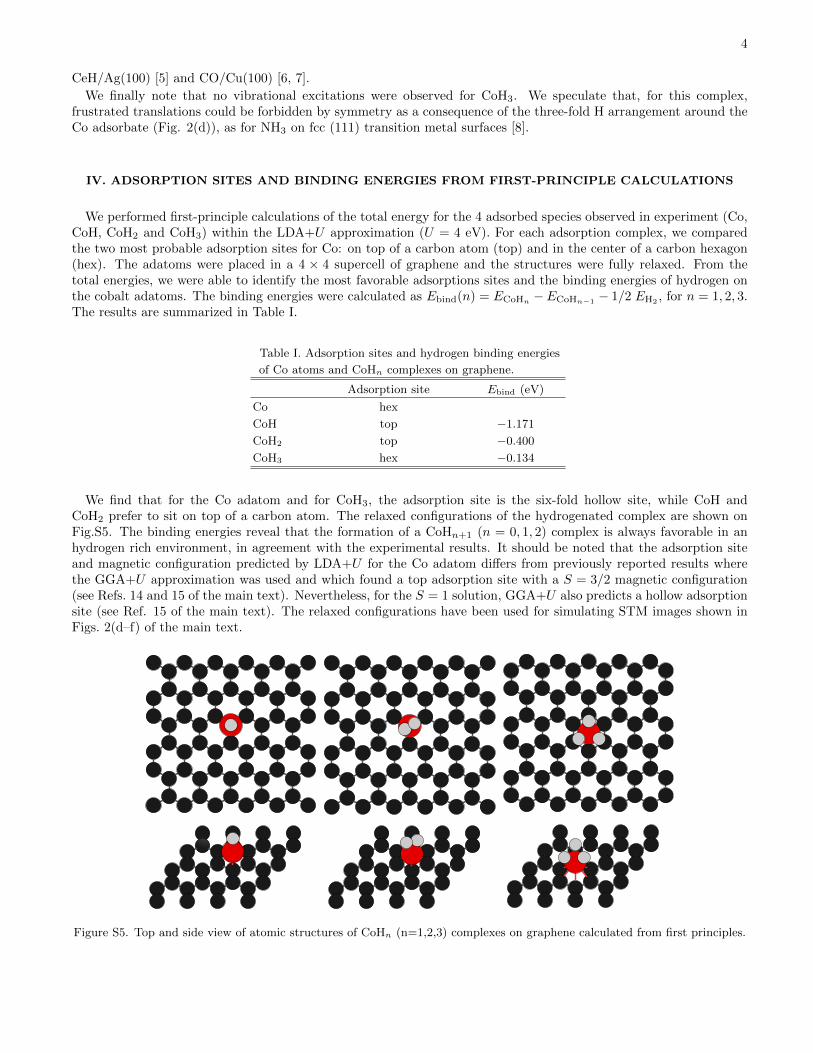
We find that for the Co adatom and for CoH3, the adsorption site is the six-fold hollow site, while CoH andCoH2 prefer to sit on top of a carbon atom. The relaxed configurations of the hydrogenated complex are shown onFig.S5. The binding energies reveal that the formation of a CoHn+1 (n = 0, 1, 2) complex is always favorable in anhydrogen rich environment, in agreement with the experimental results. It should be noted that the adsorption siteand magnetic configuration predicted by LDA+U for the Co adatom differs from previously reported results wherethe GGA+U approximation was used and which found a top adsorption site with a S = 3/2 magnetic configuration(see Refs. 14 and 15 of the main text). Nevertheless, for the S = 1 solution, GGA+U also predicts a hollow adsorptionsite (see Ref. 15 of the main text). The relaxed configurations have been used for simulating STM images shown inFigs. 2(d–f) of the main text.
Figure S5. Top and side view of atomic structures of CoHn (n=1,2,3) complexes on graphene calculated from first principles.
5
V. INFLUENCE OF THE Pt SUBSTRATE
Our DFT calculations described in the main text were performed using the free-standing graphene model. In orderto address the role of the Pt substrate we performed a systematic study of the dependence of the magnetic properties ofCo adatoms on the graphene-substrate distance. We used a 3×3 Pt(111) slab supercell with a rotated 3
√3×3√
3R30◦
layer of graphene. For this configuration, the lattice mismatch between the Pt surface and the graphene layer is only1.1 %. The Pt slab had a thickness of 3 monoatomic layers while the Co adatom was placed on the hexagonal site of agraphene layer. Due to the size of the unit cell, the calculations were only performed within the LDA approximation.The magnetic moment obtained with this method is smaller than the one obtained with the method LDA+U used inthe main text. Nevertheless, the convergence of the results with respect to the substrate/graphene distance shouldnot depend on U .
2 2.5 3 3.5dPt/Gr (Angstrom)
0
0.2
0.4
0.6
0.8
1C
o m
agne
tic m
omen
t (µ B
)
Figure S6. Calculated magnetic moment of the Co adatom as a function of the distance between the graphene layer and thePt substrate.
Figure S6 shows the magnetic moment of the Co adatom as a function of distance between the Pt substrate andthe graphene layer, dPt/Gr. We find that at small graphene-substrate distances the Co magnetic moment is strongly
reduced. Experimentally reported values of dPt/Gr range from 3.3 A [9] to 3.7 A [10]. At these distances, the magneticmoment saturates at a value of 0.98µB. This value is practically the same as the one obtained for a Co adatom onfree-standing graphene within the same level of theory. These results demonstrate that the Pt substrate has at theexperimental graphene–Pt distance no significant influence on the magnetic behavior of the Co adatoms. Thereforeour experimental system is a good approximation of free-standing graphene.
∗ These authors contributed equally to this work.[1] Ho, W. J. Chem. Phys. 117, 11033 (2002).[2] Lipus, K., Bachem, E. & Urban, W. Mol. Phys. 73, 1041 (1991).[3] Ram, R. S. & Bernath, P. F. J. Chem. Phys. 104, 6444 (1996).[4] Liu, K. & Gao, S. Phys. Rev. B 74, 195433 (2006).[5] Pivetta, M., Ternes, M., Patthey, F. & Schneider, W.-D. Phys. Rev. Lett. 99, 126104 (2007).[6] Ellis, J., Toennies, J. P. & Witte, G. J. Chem. Phys. 102, 5059 (1995).[7] Witte, G. Surf. Sci. 502, 405 (2002).[8] Salli, E., Martiskainen, S. & Martiskainen, S. J. Phys. Chem. C 116, 14960 (2012).[9] Sutter, P., Sadowski, J. T., Sutter, E. Phys. Rev. B 80, 245411 (2009).
[10] Hu, Z.-P., Ogletree, D. F., Van Hove, M. A., Somorjai, G. A. Surf. Sci. 180, 433–459 (1987).[11] STM images processed with WSxM (Horcas, I., Fernandez, R., Gomez-Rodriguez, J. M., Colchero, J., Gomez-Herrero, J.,
Baro, A. M. Rev. Sci. Instrum. 78, 013705 (2007)).