Research Collection Doctoral Thesis Magnetic Resonance Motion and Diffusion Encoding of the Heart Author(s): Stoeck, Christian T. Publication Date: 2014 Permanent Link: https://doi.org/10.3929/ethz-a-010421819 Rights / License: In Copyright - Non-Commercial Use Permitted This page was generated automatically upon download from the ETH Zurich Research Collection . For more information please consult the Terms of use . ETH Library
Transcript
Research Collection
Doctoral Thesis
Magnetic Resonance Motion and Diffusion Encoding of the Heart
Chapter 7 Second Order Motion Compensated Spin-Echo Diffusion Tensor Imaging of the Human Heart ................................................... 107
• LV rotation serves as an indicator for early cardiomyopathy in Fabry disease
[27]. • Dilated cardiomyopathy leads to reduced total rotation and torsion [28,29]. • Non-compaction cardiomyopathy results in global LV rotation instead of base-
to-apex counter rotation [29]. • Increased rotation and torsion were found upon kidney transplant indicating
an improvement of cardiac function [30].
Figure 1. Cardiac rotation patterns. Three slices from combined line tagged volumes are shown for the apical mid-ventricular and basal level. The amount of rotation perpendicular to the ventricular long-axis is plotted as function of the trigger delay.
2.1.2 Contraction
During systolic contraction the healthy heart shortens by about 30%-40% in
longitudinal direction and by 15%-20% in circumferential direction [31]. In radial
20
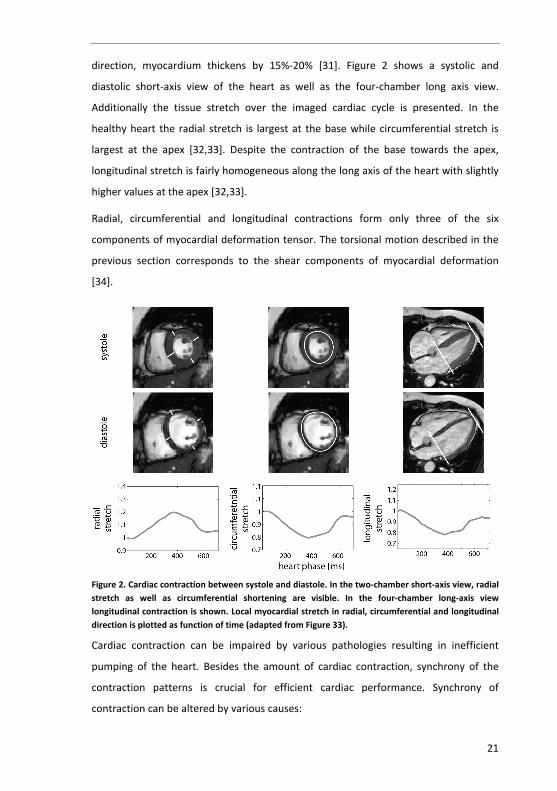
direction, myocardium thickens by 15%-20% [31]. Figure 2 shows a systolic and
diastolic short-axis view of the heart as well as the four-chamber long axis view.
Additionally the tissue stretch over the imaged cardiac cycle is presented. In the
healthy heart the radial stretch is largest at the base while circumferential stretch is
largest at the apex [32,33]. Despite the contraction of the base towards the apex,
longitudinal stretch is fairly homogeneous along the long axis of the heart with slightly
higher values at the apex [32,33].
Radial, circumferential and longitudinal contractions form only three of the six
components of myocardial deformation tensor. The torsional motion described in the
previous section corresponds to the shear components of myocardial deformation
[34].
Figure 2. Cardiac contraction between systole and diastole. In the two-chamber short-axis view, radial stretch as well as circumferential shortening are visible. In the four-chamber long-axis view longitudinal contraction is shown. Local myocardial stretch in radial, circumferential and longitudinal direction is plotted as function of time (adapted from Figure 33).
Cardiac contraction can be impaired by various pathologies resulting in inefficient
pumping of the heart. Besides the amount of cardiac contraction, synchrony of the
contraction patterns is crucial for efficient cardiac performance. Synchrony of
contraction can be altered by various causes:
21
Cardiac motion and microstructure
• In myocardial infarction cardiac output is reduced [9,35-37] and dyskinetic are-
as occur where tissue is passively stretched in an opposite direction relative to the healthy condition [38].
• In dilated cardiomyopathy circumferential contraction is reduced [39] and its magnitude more heterogeneously distributed across the LV [40].
• Impaired signal conduction such as Left Bundle Branch Blockage (LBBB) can re-sult in asynchronous myocardial contraction compromising both systolic and diastolic LV performance [42,43].
2.2 Cardiac microstructure
The arrangement of cardiomyocytes in the heart is fairly complex and subject of
ongoing research. In 1965, Grant proposed an interpretation of myocardial
microstructure and concluded: “The search for an accurate and detailed picture of the
muscular architecture of the left ventricle is by no means a trivial goal.” [44]:
• The myocardium forms a three dimensional functional syncytium of branch-ing and interconnecting myocytes.
• A description of the myocardial structure depends on the geometrical scale of investigation.
• Cell-bundles and layers of myocyte aggregates may be discerned but may not have a physiological implication.
• To appreciate the spatial levels at which myocardial structure can be ana-lyzed a statistical view should be employed.
Gilbert et al. reviewed old and novel models of cardiac architecture [45]. Their
notation is used in the following. Accordingly, myocytes and myofibers correspond to
single cells and myolaminae, band and sheet structures represent multiple
interconnected myocytes.
The principal direction of myocyte aggregates was found to follow a helical alignment
[45-47] at sub-endocardial and sub-epicardial level. In the endocardium the helix is
right-handed (positive angulation) and changes into a left-handed (negative
angulation) pattern at epicardium. Figure 3 shows a reconstruction of the helix pattern
obtained from an ex-vivo human heart using diffusion weighted MR imaging. The
transmural range of helix angles of the ex-vivo human heart has been found to vary
22
between -40° to +65° [48,49] and -72° to +63° [50] (microscopy). While the helix
pattern illustrates the arrangement of myocyte aggregates, single myocytes have a
length of only 50-150μm and a thickness of 10-20μm with considerable variation
between species [51,52].
Besides the helical pattern of myocyte aggregates, a transmural component has been
discussed implying crossing of endocardial fibers into the epicardium going from mid-
ventricular level to the apex and the base of the heart [53]. The corresponding in-plane
spiral pattern of myocyte aggregates is most clearly visible at the apex but extends
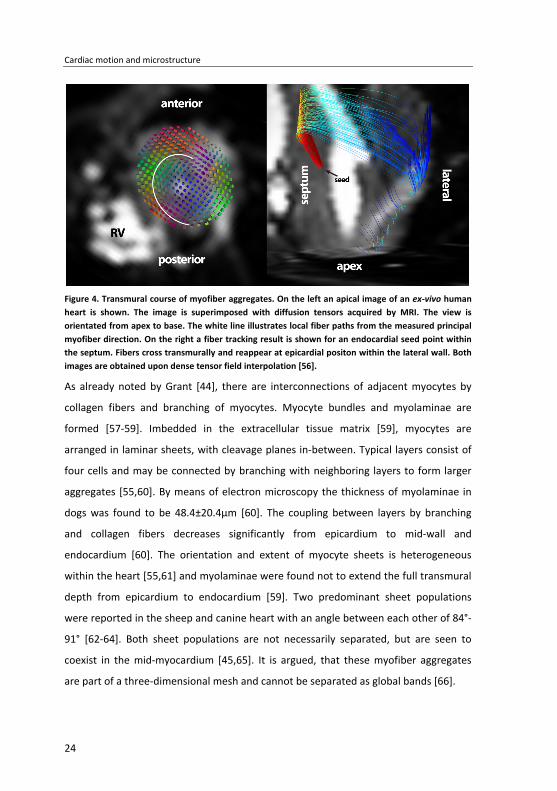
over the ventricle [46,49,54,55]. Figure 4 presents the principal fiber direction
measured by MRI at apical level along with an illustration of a fiber bundle following a
transmural course.
Figure 3. Reconstruction of the helix pattern of myocyte aggregates based on MR diffusion tensor imaging of the post mortem human heart. The antero-lateral side is shown. Color-coding corresponds to the helix angle of the tracked fibers.
23
Cardiac motion and microstructure
Figure 4. Transmural course of myofiber aggregates. On the left an apical image of an ex-vivo human heart is shown. The image is superimposed with diffusion tensors acquired by MRI. The view is orientated from apex to base. The white line illustrates local fiber paths from the measured principal myofiber direction. On the right a fiber tracking result is shown for an endocardial seed point within the septum. Fibers cross transmurally and reappear at epicardial positon within the lateral wall. Both images are obtained upon dense tensor field interpolation [56].
As already noted by Grant [44], there are interconnections of adjacent myocytes by
collagen fibers and branching of myocytes. Myocyte bundles and myolaminae are
formed [57-59]. Imbedded in the extracellular tissue matrix [59], myocytes are
arranged in laminar sheets, with cleavage planes in-between. Typical layers consist of
four cells and may be connected by branching with neighboring layers to form larger
aggregates [55,60]. By means of electron microscopy the thickness of myolaminae in
dogs was found to be 48.4±20.4μm [60]. The coupling between layers by branching
and collagen fibers decreases significantly from epicardium to mid-wall and
endocardium [60]. The orientation and extent of myocyte sheets is heterogeneous
within the heart [55,61] and myolaminae were found not to extend the full transmural
depth from epicardium to endocardium [59]. Two predominant sheet populations
were reported in the sheep and canine heart with an angle between each other of 84°-
91° [62-64]. Both sheet populations are not necessarily separated, but are seen to
coexist in the mid-myocardium [45,65]. It is argued, that these myofiber aggregates
are part of a three-dimensional mesh and cannot be separated as global bands [66].
24
2.3 Link between motion and structure
In the embryonic heart, myocyte pattern develop after onset of cardiac contraction. In
a very elaborate study conducted by Tobita et al. [67], it was found that the amount of
load influences myocyte organization. To this end, healthy embryonic chicken hearts
were compared to embryos which underwent either left atrial ligation (reduced LV
load) or banding of the pre-developed LV (increased LV load). Reduced load was found
to delay fiber organization while increased load accelerated structural LV formation
with an increasing appearance of left-handed helical structure. These findings suggest
a “form follows function” principle of myocyte arrangement. The exact nature of this
process is, however, still the subject of ongoing research.
During contraction myocytes shorten by 13% as reported for dog hearts [68]. It is,
however, noted that the corresponding thickening of the muscle cells cannot explain
myocardial wall thickening of 30 to 50% [52] unless very steep helix angles occur which
seem implausible according to histology [47]. In order to address the discrepancy it
was proposed that the cleavage planes between different myolaminae allow for sliding
of sheets with respect to each other [69]. Using MR diffusion tensor imaging the
concept of changes in myocardial sheet architecture was analyzed in explanted rat [61]
and canine [70] hearts arrested in systole and diastole. Sheet extension in transverse
orientation was found in conjunction with a more radial alignment. In diastole,
myolaminae are arranged more tangentially to the epicardial surface whereas a more
radial orientation is assumed during systole. It has been reported that sheet normal
shear accounts for 40-60% of radial thickening [70,71]. Besides the change in sheet
angle between diastole and systole, heterogeneity of sheet reorganization across the
ventricle has been noted and associated with heterogeneous radial contraction
patterns observed in the heart [70,71]. The functional importance of myolaminae
reorientation has not only been studied in healthy hearts but was also investigated in
excised mice hearts with Duchenne muscular dystrophy. Impaired calcium reuptake
leads to incomplete relaxation of the heart in diastole which was found to correlate
with a more systolic sheet arrangement [72].
Besides local reorientation of entire myocyte aggregates during contraction, their
fundamental orientation has been reported to be essential for explaining torsion and
25
Cardiac motion and microstructure
shear components of myocardial strain. In mathematical models the necessity of the
transmural course of myocytes (compare Figure 4) has been emphasized in order to
equalize myocardial strain [73,74]. In their model myocyte aggregation by collagen
structure as reported by Pope et al. [59] was not considered.
Finally, it is noted that the presence of a dissectible band structure does not exist [66].
However, the notion of local cleavage planes is accepted [55]. The presence of non-
tangential components of fiber direction has been confirmed based on histological
findings [75] and MR imaging [53].
Beyond the relation of myocardial microstructure and cardiac motion,
electrophysiological considerations are of importance. The anisotropy of the
myocardium determines the propagation direction of electrical signals, as the
propagation velocity is faster along myocytes relative to a direction perpendicular to
myocytes [76]. Upon pacing in-vivo dog hearts it was found that the activation
potential measured at the epicardial surface followed the helical alignment of the
epicardial cardiac microstructure [77]. It was even possible to map the transmural
change of helix inclination by measuring the potential propagation after pacing at
different transmural depths. In a recent study, a correlation of decreased activation
voltage with greater fiber disarray in mice with myocardial infarction was
demonstrated [78].
In almost all studies referenced herein, analysis of myocardial microstructure was
achieved with highly invasive methods ex-vivo. In the following section methods are
reviewed to analyze cardiac mechanics and microstructure non-invasively and in-vivo.
26
Chapter 3 Myocardial motion analysis techniques
3. Intracranial dynamics
Cardiovascular magnetic resonance (CMR) imaging allows investigating myocardial
motion and strain patterns non-invasively. In CMR tagging, tissue magnetization is
modulated by radio frequency (RF) irradiation resulting in defined magnitude and/or
phase patterns of the magnetization across the heart. By imaging these magnetization
patterns at different time points, the motion of material points can be tracked.
In the following chapter CMR imaging methods for assessing cardiac motion are
reviewed.
3.1 Magnitude based imaging techniques
3.1.1 Inversion recovery methods
In 1988, Zerhouni et al. [79] proposed selective inversion of longitudinal magnetization
to visualize cardiac motion. The evolution of longitudinal magnetization is governed by
a first order differential equation:
0
1
ZZ M MdMdt T
−= (3.1)
with solution:
( ) 1
00
00
1tt
TzZ
M MM t M e
M
= − −= −
(3.2)
with M0 being the magnetization at thermal equilibrium and 1T the time constant of
longitudinal relaxation. At the time point of zero-crossing of ( )ZM t tagged tissue will
appear dark in the image and hence its contrast relative to untagged tissue is
27
Myocardial motion analysis techniques
maximized. The degree of inversion and therefore the time point of zero-crossing of
the longitudinal magnetization can be manipulated by varying the flip angle of the
tagging RF pulse (Figure 5). By imaging the tagging pattern at different time points
after inversion, myocardial motion can be inferred. To capture through-plane motion,
radial tagging of the heart’s short-axis in conjunction with parallel tagging of the long
axis was suggested [33]. According to equation (3.2) and as demonstrated in Figure 5,
nulling of longitudinal magnetization by RF-inversion cannot be achieved for the entire
cardiac cycle, leading to varying contrast between tagged and untagged tissue in
diastole.
Figure 5. Flip angle of the inversion preparation pulse and resulting longitudinal magnetization as
function of the time between tagging and imaging. Simulation is based on a 1T of 1030ms for
myocardium [80].
3.1.2 SPatial Modulation of Magnetization (SPAMM)
As alternative to feature generation by slice-selective inversion, Axel et al. [81]
proposed a method of spatial modulation of magnetization by magnetic field
gradients. The SPAMM sequence diagram is shown in Figure 6 a). Accordingly,
longitudinal magnetization is tipped into the transverse plane and a field gradient
(Genc) is applied imposing a location depended magnetization phase. Thereafter,
magnetization is tipped back into the longitudinal direction resulting in cosine-
modulated longitudinal magnetization:
28
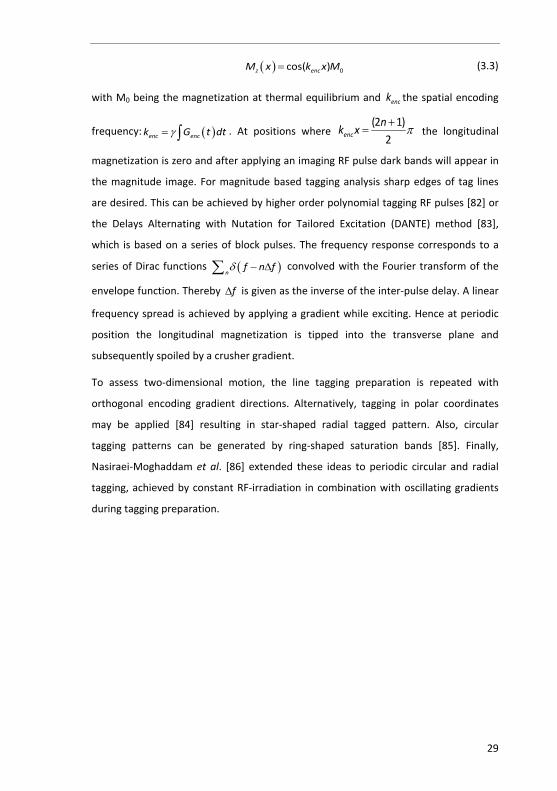
( ) 0cos( )z encM x k x M= (3.3)
with M0 being the magnetization at thermal equilibrium and enck the spatial encoding
frequency: ( )enc enck G t dtγ= ∫ . At positions where (2 1)
2encnk x π+
= the longitudinal
magnetization is zero and after applying an imaging RF pulse dark bands will appear in
the magnitude image. For magnitude based tagging analysis sharp edges of tag lines
are desired. This can be achieved by higher order polynomial tagging RF pulses [82] or
the Delays Alternating with Nutation for Tailored Excitation (DANTE) method [83],
which is based on a series of block pulses. The frequency response corresponds to a
series of Dirac functions ( )nf n fδ − ∆∑ convolved with the Fourier transform of the
envelope function. Thereby f∆ is given as the inverse of the inter-pulse delay. A linear
frequency spread is achieved by applying a gradient while exciting. Hence at periodic
position the longitudinal magnetization is tipped into the transverse plane and
subsequently spoiled by a crusher gradient.
To assess two-dimensional motion, the line tagging preparation is repeated with
orthogonal encoding gradient directions. Alternatively, tagging in polar coordinates
may be applied [84] resulting in star-shaped radial tagged pattern. Also, circular
tagging patterns can be generated by ring-shaped saturation bands [85]. Finally,
Nasiraei-Moghaddam et al. [86] extended these ideas to periodic circular and radial
tagging, achieved by constant RF-irradiation in combination with oscillating gradients
during tagging preparation.
29
Myocardial motion analysis techniques
Figure 6. Pulse sequence diagrams for motion encoded MRI. The encoding enck and decoding dek
gradients are in dark gray, while imaging, crusher and slice selection gradients are in light gray. The gradient coordinate system is aligned with the frequency encoding/readout direction (M), phase encoding direction (P) and slice select direction (S). After detection of the R-wave a tagging preparation block is applied followed by the imaging sequences for each individual heart phase. TE corresponds to the sequence’s echo time. a) 1-1 SPAMM/CSPAMM: Magnetization is spatially
modulated using encoding gradient enck . For CSPAMM imaging an additional image is required with a
180° phase shift of the second RF pulse (light gray). b) SENC imaging: Magnetization is modulated
using through-plane tagging. During read-out a demodulation gradient dek is applied. c)
DENSE/CDENSE imaging: Magnetization is modulated by 1-1 SPAMM tagging. During imaging the
modulation unwound using demodulation gradient de enck k= . d) Velocity encoding applies bipolar
waveform to encode velocity into the signal phase.
30
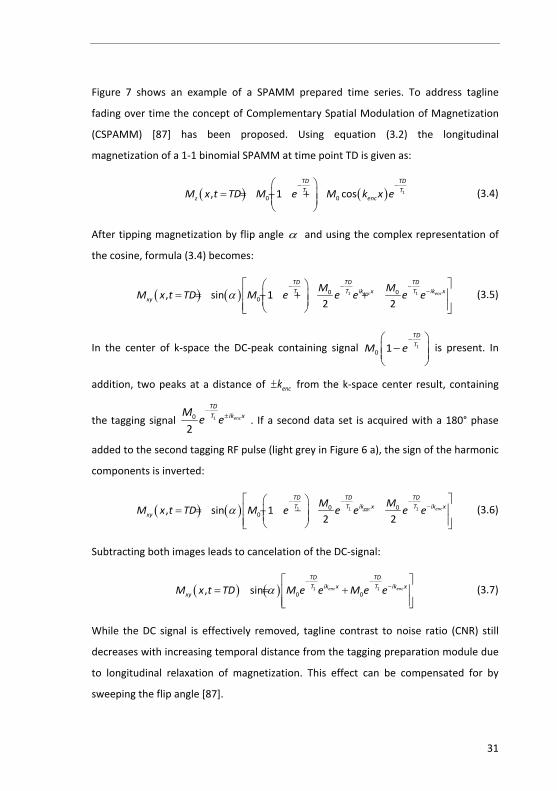
Figure 7 shows an example of a SPAMM prepared time series. To address tagline
fading over time the concept of Complementary Spatial Modulation of Magnetization
(CSPAMM) [87] has been proposed. Using equation (3.2) the longitudinal
magnetization of a 1-1 binomial SPAMM at time point TD is given as:
( ) ( )1 10 0, 1 cos
TD TDT T
z encM x t TD M e M k x e− −
= = − +
(3.4)
After tipping magnetization by flip angle α and using the complex representation of
the cosine, formula (3.4) becomes:
( ) ( ) 1 1 10 00, sin 1
2 2enc enc
TD TD TDik x ik xT T T
xyM M
M x t TD M e e e e eα− − −
−
= = − + + (3.5)
In the center of k-space the DC-peak containing signal 10 1
TDTM e
− −
is present. In
addition, two peaks at a distance of enck± from the k-space center result, containing
the tagging signal 10
2enc
TDik xTM
e e−
± . If a second data set is acquired with a 180° phase
added to the second tagging RF pulse (light grey in Figure 6 a), the sign of the harmonic
components is inverted:
( ) ( ) 1 1 10 00, sin 1
2 2enc enc
TD TD TDik x ik xT T T
xyM M
M x t TD M e e e e eα− − −
−
= = − − − (3.6)
Subtracting both images leads to cancelation of the DC-signal:
( ) ( ) 1 10 0, sin enc enc
TD TDik x ik xT T
xyM x t TD M e e M e eα− −
−
= = +
(3.7)
While the DC signal is effectively removed, tagline contrast to noise ratio (CNR) still
decreases with increasing temporal distance from the tagging preparation module due
to longitudinal relaxation of magnetization. This effect can be compensated for by
sweeping the flip angle [87].
31
Myocardial motion analysis techniques
Figure 7. SPAMM and CSPAMM tagging. Magnitude, phase and k-space images of 1-1 SPAMM tagged images for different trigger delays are shown on the left. In the first heart phase the blood pool is still present. Over time, tag lines fade. Similar in phase images the modulated phase is superimposed with the DC-phase of relaxed magnetization. While the modulated phase of SPAMM+ and SPAMM- has opposing signs (43ms) the phase of DC-magnetization has the same sign (673ms). In k-space the magnitude of the harmonic peaks is decaying while a DC-peak builds up. Upon subtraction of both SPAMM images the DC-peak is removed. It is noted that the magnitude images have been scaled individually for presentation, while k-space images have the same scaling.
Most current tagging acquisition schemes use two-dimensional imaging. The major
drawback of such an imaging strategy lies in its sensitivity to though-plane motion. The
heart contracts longitudinally, hence for different heart phases the myocardium is
imaged in different positions. Fischer et al. [88] proposed a slice tracking method,
32
which allows to image true myocardial contraction using 2D CPAMM imaging. Instead
of tagging the entire LV as in conventional 1-1 SPAMM only a thin slice is tagged while
a thick slab is excited during the imaging module thereby capturing potential through-
slice motion. Accordingly, resulting transverse magnetization is composed of the
tagged compartment, 1T relaxed signal from the tagged slice and signal from tissue
above and below the tagged slice. By employing the CSPAMM formalism only the
signal carrying the modulation is retrieved and, accordingly, potential through-plane
motion is captured. In order to quantify cardiac motion in three-dimensions, Ryf et al.
[89] introduced 3D acquisitions based on 3D tagging grids. With the introduction of 3D
tagging the problem of slice mismatch and through-slice motion was intrinsically
solved. However, initial implementations required a large number of successive breath
holds making the method cumbersome and practically challenging. Total scan
durations of 30-40min were reported, which are not practical in clinical routine. The
reason for the long scan duration lies in the fact that imaging the first harmonic peaks
requires a minimum spatial resolution which is given by:
1
2 enc
xk
∆ = (3.8)
which corresponds to half the tag-line distance. If higher order SPAMM is used, the
tagging modulation is no longer a pure cosine and, accordingly, higher order harmonics
need to be sampled. While for line tagging only two first harmonic peaks are present in
k-space for 2D grid tagging four peaks and 3D grid tagging 8 peaks need to be covered.
For 2D grid tagging, spiral readout trajectories have been proposed providing a
only sampling k-space line in the proximity of the harmonic peaks have been proposed
[89]. These sampling schemes were further improved by the use of spatiotemporal
undersampling using k-t BLAST [13]. Further refinements of the 3D CSPAMM tagging
scheme by Rutz et al. [9] allowed reducing scan durations to three consecutive breath
holds thereby enabling studies in patients. Redundancy in k-space information was
used. Instead of imaging a 3D grid, three 3D volumes are acquired with 1D line tagging
in frequency encoding direction. The three volumes are rotated by 90° with respect to
each other and acquired with an anisotropic resolution.
33
Myocardial motion analysis techniques
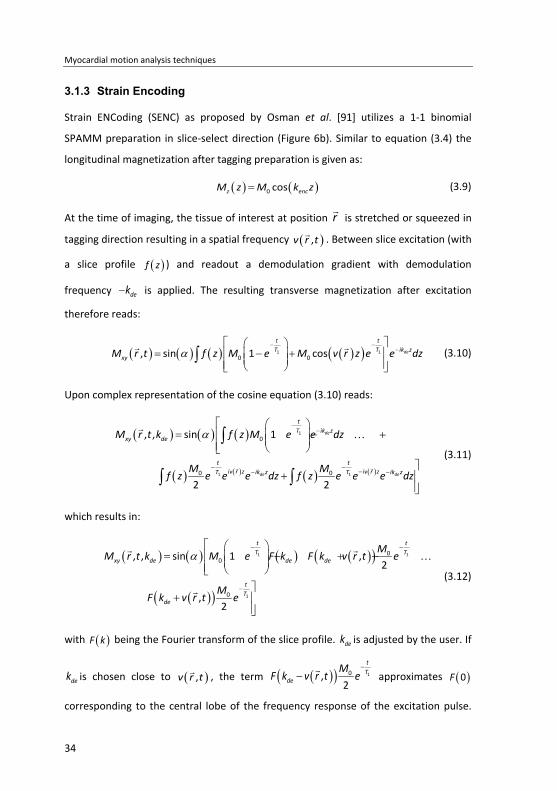
3.1.3 Strain Encoding
Strain ENCoding (SENC) as proposed by Osman et al. [91] utilizes a 1-1 binomial
SPAMM preparation in slice-select direction (Figure 6b). Similar to equation (3.4) the
longitudinal magnetization after tagging preparation is given as:
( ) ( )0 cosz encM z M k z= (3.9)
At the time of imaging, the tissue of interest at position r
is stretched or squeezed in
tagging direction resulting in a spatial frequency ( ),v r t . Between slice excitation (with
a slice profile ( )f z ) and readout a demodulation gradient with demodulation
frequency dek− is applied. The resulting transverse magnetization after excitation
therefore reads:
( ) ( ) ( ) ( )( )1 10 0, sin 1 cos de
t tik zT T
xyM r t f z M e M v r z e e dzα− −
−
= − + ∫
(3.10)
Upon complex representation of the cosine equation (3.10) reads:
( ) ( ) ( )
( ) ( ) ( ) ( )
1
1 1
0
0 0
, , sin 1
2 2
de
de de
tik zT
xy de
t tiv r z iv r zik z ik zT T
M r t k f z M e e dz
M Mf z e e e dz f z e e e dz
α−
−
− −−− −
= − +
+
∫
∫ ∫
(3.11)
which results in:
( ) ( ) ( ) ( )( )
( )( )
1 1
1
00
0
, , sin 1 ,2
,2
t tT T
xy de de de
tT
de
MM r t k M e F k F k v r t e
MF k v r t e
α− −
−
= − + − +
+
(3.12)
with ( )F k being the Fourier transform of the slice profile. dek is adjusted by the user. If
dek is chosen close to ( ),v r t , the term ( )( ) 10,
2
tT
deM
F k v r t e−
−
approximates ( )0F
corresponding to the central lobe of the frequency response of the excitation pulse.
34
Hence it becomes the dominate part in equation (3.12). Consequently the transverse
magnetization can be approximated by:
( ) ( ) ( )( ) 10, , sin ,2
tT
xy de deM
M r t k F k v r t eα−
≈ −
(3.13)
( ),v r t can be estimated by the center of mass of ( )( ),deF k v r t−
from two
measurements with dek vk < and
dek vk > . An optimal set of dek is derived in [91] and the
discrete center of mass is approximated by
( )( )( ) ( )( )( )( ) ( )( ) ( )( )
, ,, Re ,
, ,de de de de
de de
k v k v k v k v
k v k v
k F k v r t k F k v r tr t v r t
F k v r t F k v r tµ β> > < <
> <
− + − = = − + −
. Osman et al.
[91] showed, that ( )( ),v r tβ can be linearized for the expected ranges of longitudinal
strain allowing to solve for ( ),v r t .
Similar to 2D tagging techniques slice mismatch over the cardiac cycle can be
compensated in combination with slice following [92]. For 3D strain estimation SENC
has been combined with in-plane displacement encoding [11] and tagging [93].
3.1.4 Motion analysis
A range of work has been published describing semi- or fully automatic tag line
identification and tracking utilizing prior knowledge to compensate for tagline fading,
using image filters and tag templates [94-96]. To generate deformation fields, the
space between tag lines or tag line crossings needs to be interpolated. Optical flow
methods have been used to overcome the necessity to interpolate [97,98]. Recently,
Arts et al. [99] and Wang et al. [100] have proposed localized modeling of the tagging
signal using cosine functions to derive pixel-by-pixel displacement fields based on
detecting local spatial frequency change between consecutive heart phases.
3.2 Phase based imaging techniques
3.2.1 Displacement encoding
In 1999 Aletras et al. [101] proposed a scheme termed Displacement Encoding with
Stimulated Echoes (DENSE) (Figure 6c). In contrast to SPAMM tagging, an additional
35
Myocardial motion analysis techniques
decoding gradient is used during the imaging module to generate a stimulated echo.
Accordingly, tissue that has displaced between the tagging and imaging module will
have a net phase:
enck xϕ = ∆ (3.14)
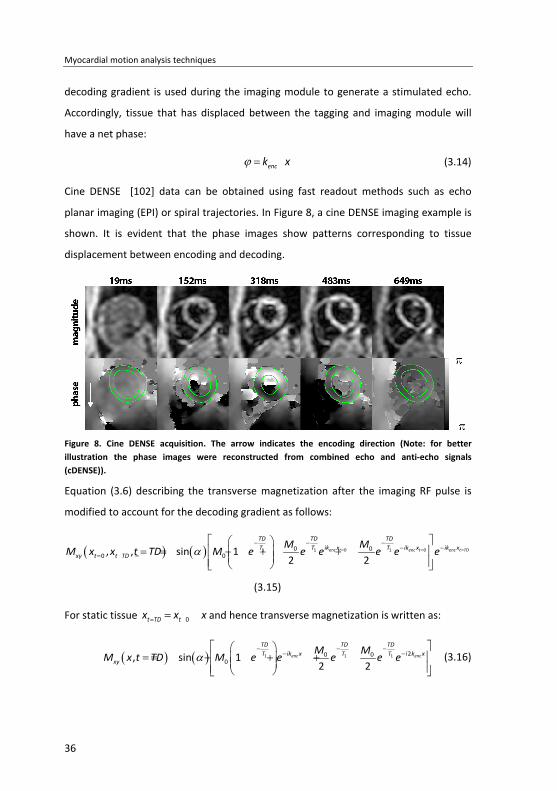
Cine DENSE [102] data can be obtained using fast readout methods such as echo
planar imaging (EPI) or spiral trajectories. In Figure 8, a cine DENSE imaging example is
shown. It is evident that the phase images show patterns corresponding to tissue
displacement between encoding and decoding.
Figure 8. Cine DENSE acquisition. The arrow indicates the encoding direction (Note: for better illustration the phase images were reconstructed from combined echo and anti-echo signals (cDENSE)).
Equation (3.6) describing the transverse magnetization after the imaging RF pulse is
modified to account for the decoding gradient as follows:
( ) ( ) 0 01 1 10 00 0, , sin 1
2 2enc t enc t enc t TD
TD TD TDik x ik x ik xT T T
xy t t TDM M
M x x t TD M e e e e e eα = = =− − −
− −= =
= = − + +
(3.15)
For static tissue 0t TD tx x x= == = and hence transverse magnetization is written as:
( ) ( ) 1 1 1 20 00, sin 1
2 2enc enc
TD TD TDik x i k xT T T
xyM M
M x t TD M e e e e eα− − −
− −
= = − + + (3.16)
36
10
2
TDTM
e−
represents the stimulated echo part located at the center of k-space. It is seen
that the magnitude of transverse magnetization decays exponentially with 1TD T and
is at best half of equilibrium magnetization.
The magnetization coming from longitudinal relaxation during the mixing time (TM)
between encoding and decoding is given by 10 1 enc
TDik xTM e e
−−
−
. It is apparent, that
this component has a phase linear in the spatial coordinate x with slope enck . According
to the Fourier shift theorem the linear phase in image space translates into a
displacement by enck in k-space. A third peak in k-space is present at position2 enck
representing the stimulated anti-echo. Given by 1 20
2enc
TDi k xTM
e e−
− the magnitude of the
stimulated anti-echo equals the magnitude of the stimulated echo. With a tissue
displacement of t TDx x x= = + ∆ , equation (3.16) can be written as:
( ) ( ) 1 1 1 20 00, , sin 1
2 2enc enc enc enc
TD TD TDik x x ik x i k x ik xT T T
xyM M
M x x t TD M e e e e e e eα− − −
− +∆ − ∆ − − ∆
∆ = = − + + (3.17)
For cardiac contraction x∆ does not correspond to a global displacement but depends
on the voxel position. Hence the additional linear phase introduced by encik xe− ∆ does
not lead to a global shift in k-space, but to a peak broadening.
37
Myocardial motion analysis techniques
Figure 9. DENSE acquisition. Echo, anti-echo, 1T and higher order harmonic peaks are present.
Depending on the size of the acquired k-space, magnitude and phase images may be contaminated by unwanted signal.
Both 1T - and anti-echo peaks can contaminate the acquired image (Figure 9). Since the
position of the undesired signal peaks depends on enck the signal can be shifted
outside the acquired k-space. However increasing enck may lead to unwanted phase
wraps for large displacements. Alternatively, the size of the acquired k-space can be
reduced by reducing the spatial resolution. With 1
enc
xk
∆ = the 1T -peak will appear at
the edge of k-space. To remove the 1T -peak complementary DENSE (cDENSE) can be
used [103]. similar to the CSPAMM approach [87]. After subtraction of the image with
complementary modulation, one obtains stimulated echo and anti-echo signals only:
( ) ( ) 1 1 20 0, , sin enc enc enc
TD TDik x i k x ik xT T
xyM x x t TD M e e M e e eα− −
− ∆ − − ∆
∆ = = +
(3.18)
38
If suppression of both 1T - and anti-echo peaks is desired the CANSEL method may be
used [104]. For this approach the phase of the second 90° pulse is not only changed
from 0° to 180° but also to ±90°. Accordingly, four images with different modulation
are acquired and equation (3.3) becomes:
( ) 0sin( )z encM x k x M= ± (3.19)
resulting in an additional cDENSE image:
( ) ( ) 1 1 20 0, , sin enc enc enc
TD TDik x i k x ik xT T
xyM M
M x x t TD e e e e ei i
α− −
− ∆ − − ∆
∆ = = −
(3.20)
After multiplication of equation (3.20) with i and addition to equation (3.18) only the
displacement encoded simulated echo signal peak remains:
( ) ( ) 10, sin 2 enc
TDik xT
xyM x t TD M e eα−
− ∆∆ = = (3.21)
A number of modifications to the original DENSE schemes have been proposed [105-
107] to improve scan efficiency and robustness to B0 field inhomogeneity. One source
of B0 inhomogeneity is deoxygenated blood inside the coronary venous system [108].
The coronary vein cross section and hence the blood volume is different for systole
and diastole [109]. To reduce the impact of venous blood induced B0 inhomogeneity it
was originally suggested to acquire an additional scan with identical parameters,
however without displacement encoding. Residual phase from this image corresponds
to local field variations and can be subtracted from the displacement encoded phase
maps for correction [101]. Alternatively the concept of peak combination HARP [110]
can be applied to DENSE. To this end, the regular DENSE acquisition is repeated with
inverted encoding/decoding gradients [111], however, doubling scan time.
Alternatively, Kim et al. proposed to remove the decoding gradient thereby using a
conventional CSPAMM imaging method [112,113]. Prior to reconstruction, the k-space
is then split into two halves containing either the stimulated echo or the stimulated
anti echo signal. After subtraction of the image phase the displacement is calculated.
39
Myocardial motion analysis techniques
3.2.2 Phase-contrast velocity encoding
In velocity encoded MRI the pulse sequence is designed to map velocity directly
[114,115]. Let us consider phase evolution of transverse magnetization in the presence
of a magnetic field gradient:
( ) ( ) ( )r t G t r t dtϕ γ= ⋅∫
(3.22)
with ( )r tϕ being the phase due to spatial trajectory ( )r t . The trajectory ( )r t
is
expanded using a Taylor series about the gradient waveform’s center of mass mt :
( ) ( ) ( ) ( )2 3( ;0)
1 1( )2 6r t m m m mG t r t r t t r t t r t t dtϕ γ = ⋅ + + + + ∫
(3.23)
For velocity encoding a gradient waveform is desired that refocuses static spins, i.e.
has zero net area and a first gradient moment ( )1m tG t dtγ= ∫ different from zero. A
bipolar gradient waveform as shown in Figure 6 d) fulfills these requirements. Its first
moment is given as 1bipolarM Gγ δ= ∆
withδ being the duration of a single gradient lobe
and ∆ the time from the beginning of the negative lobe to the beginning of the
positive lobe. With that the resulting phase is proportional to the velocity:
( )mG r tϕ γδ= ∆ ⋅ (3.24)
Storing the velocity information in the image phase, phase velocity imaging is similar to
DENSE prone to external phase perturbations, from concomitant fields, eddy currents
or B0 inhomogeneity. In order to compensate for B0 inhomogeneities, an additional
scan with a different encoding strength (different 1m
) is acquired. After calculating the
phase difference of such a 2-point acquisition, signal from static tissue and B0 induced
phase is canceled. Three-directional velocity data can be acquired using a 4-point
scheme [116]. The maximum encoded velocity without phase aliasing is given as:
1
encvmπ
γ=
∆
(3.25)
40
with 1m∆
being the difference in first gradient moments between two encoded
measurements. For cardiac imaging a encv of 10-25cm/s is typically used [117]. This
requires the application of strong velocity encoding gradients leading to unwanted
background phase offsets due to concomitant fields. Rapid switching of the velocity
encoding gradients can lead to residual eddy current induced phases. To compensate
for unwanted background phases, the phase of regions with static tissue can be used
for background phase correction [118]. Alternatively, phantom calibration may be used
[119] at the expense of additional scan time. Finally, magnetic field monitoring may be
employed to estimate the spatial-temporal behaviors of eddy currents to guide
background phase correction [120].
3.3 Magnitude and phase based imaging techniques
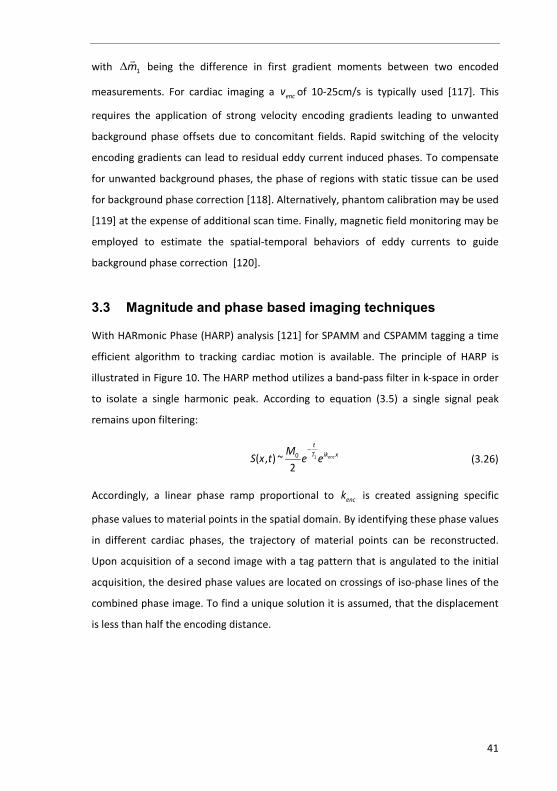
With HARmonic Phase (HARP) analysis [121] for SPAMM and CSPAMM tagging a time
efficient algorithm to tracking cardiac motion is available. The principle of HARP is
illustrated in Figure 10. The HARP method utilizes a band-pass filter in k-space in order
to isolate a single harmonic peak. According to equation (3.5) a single signal peak
remains upon filtering:
10( , ) ~2
enc
tik xTM
S x t e e−
(3.26)
Accordingly, a linear phase ramp proportional to enck is created assigning specific
phase values to material points in the spatial domain. By identifying these phase values
in different cardiac phases, the trajectory of material points can be reconstructed.
Upon acquisition of a second image with a tag pattern that is angulated to the initial
acquisition, the desired phase values are located on crossings of iso-phase lines of the
combined phase image. To find a unique solution it is assumed, that the displacement
is less than half the encoding distance.
41
Myocardial motion analysis techniques
Figure 10. HARP and peak combination HARP. CSPAMM data is filtered in k-space to separate signal of the harmonic peaks. Upon Fourier transformation a phase modulation pattern is obtained. For peak combined HARP, both images are multiplied with each other after taking the complex conjugate (†) of one of them. The phase modulation is doubled but potential off- resonance phase is canceled.
42
Similar to DENSE, HARP is sensitive to phase accumulation due to B0 inhomogeneities.
Ryf et al. [110] introduced peak combination HARP in order to make HARP more
resistant to field inhomogeneities (Figure 10). Based on CSPAMM tagging and equation
(3.7) the signal over time is given as:
( ) ( ) ( ) ( )( )00,
0sint
readout prephaseenc enci B x t G t x dt k xik x ik xS t M e e e dx
γ γα
′ ′+ −− ∫ = + ∫ (3.27)
with ( )readoutG t being the readout gradient, prephasek the prephasing modulation and
( )0 ,B x t the temporally and spatially varying B0 field. Equation (3.27) can be recast to:
( ) ( )( ) ( ) ( ) ( )0 00 0
, ,
0sint t
enc readout prephase enc readout prephaseik x i B x t G t xdt k x ik x i B x t G t xdt k xS t M e e dx
γ γα
′ ′ ′ ′ ′ ′+ + − − + + − ∫ ∫= + ∫
(3.28)
The time points at which the two harmonic peaks are sampled are defined as:
( )1
1 0:
t
readout prephase enct G t dt k kγ ′ ′ − = − ∫ (3.29)
( )2
2 0:
t
readout prephase enct G t dt k kγ ′ ′ − = ∫ (3.30)
It is evident, that the accumulated phase due to 0( , )B x t differs at the two k-space
positions by:
( )2
10 ,
t
peak tB x t dtϕ γ ′ ′∆ = ∫ (3.31)
Assuming a small change 1 20 ( )t tB x→∆ between 1t and 2t the phase difference becomes:
( )1 20 2 0 1( ) ,t t
peak B x t B x t tϕ γ → ∆ = ∆ + ∆ (3.32)
The major contribution of B0 stems from the temporal separation of consecutive heart
phases which is in the range of 20-40ms [90,110]:
( )1 20 2 0 1( ) ,HP HPt t
heartphase HP HP HPB x t B x t tϕ γ → ∆ = ∆ + ∆ (3.33)
with 2 2HPt t>> and HPt t∆ >> ∆ . Neglecting the change of B0 during single readouts, the
k-space can be divided in two separate k-spaces by HARP filtering the two harmonic
43
Myocardial motion analysis techniques
peaks and B0 phase is canceled upon taking the complex conjugate of one and
multiplication of both filtered images [110].
3.4 Motion parameters
3.4.1 Rotational motion
Rotation is measured as angular change of material points in the short-axis view
perpendicular to the LV long-axis relative to a reference heart phase. LV twist is
derived from rotation angles as:
LV apex basetwist angle angle= − (3.34)
from which LV torsion is derived as:
apex baseLV
apex base
angle angletorsion
d −
−= (3.35)
with apex based − being the distance between the apical and basal position [23].
An alternative method to estimating global rotation and LV twist parameters directly
from k-space of 2D line tagged images has been proposed. Rotation in image space
corresponds to rotation in k-space. Hence rotational motion from one heart phase to
the next can be estimated by 2D cross correlation of magnitude k-space based on the
proposed Fourier Analysis of Stimulated echoes (FAST) method [122,123].
Rotational motion has been found to be altered in patients with severe aortic stenosis
Chapter 4 Undersampled Cine 3D Tagging for Rapid Assessment of Cardiac Motion1
4. Velocity measurements with MRI
4.1 Introduction
Patients with myocardial infarction (MI), coronary artery disease (CAD) or impaired
signal conduction in the heart such as left bundle branch block (LBBB) suffer from
reduced cardiac function. In patients undergoing cardiac resynchronization therapy
(CRT) [134] it is of great interest to generate a mechanical map indicating local
dyssynchrony [135]. Among the various mechanical parameters, cardiac strain and
torsion have been shown to be valuable clinical parameters in patients with MI [26]
or aortic stenosis [23,136]. Cardiovascular magnetic resonance (CMR) offers a
functional imaging modality to assess cardiac motion pattern and synchrony of
contraction [137,138] non-invasively.
Up to date multiple approaches have been used to investigate myocardial motion
such as displacement encoding with stimulated echo (DENSE) [101,139], velocity
encoding [140-142], tagging by spatial modulation of magnetization (SPAMM) [81]
and complementary spatial modulation of magnetization (CSPAMM) [87]. These
methods can either be applied in conjunction with two dimensional (2D) or three
dimensional (3D) imaging. In 2D acquisitions, multiple slices are imaged along the
left ventricle (LV) and strain maps are calculated slice-by-slice. Two-dimensional
acquisitions require additional techniques in order to compensate for through-plane
motion. To this end, slice following [88,143], acquisition of additional orthogonal
slices [144] or the encoding of through-plane displacement [145,146] (zHARP) have
1 Published in: Stoeck CT, Manka R, Boesiger P, Kozerke S. Undersampled cine 3D tagging for rapid assessment of cardiac motion. J Cardiovasc Magn Reson 2012;14:60.
47
Undersampled Cine 3D Tagging for Rapid Assessment of Cardiac Motion0F
been proposed. While reconstruction of 3D strain patterns from two bi-planar
acquisitions does require interpolation, slice-following techniques provide only a
projection of true 3D motion onto a 2D subspace. Using zHARP additional gradients
in through-slice direction are applied to estimate through-plane displacement by
solving a set of linear equations [145].
To circumvent the need for interpolation and slice-following techniques, true 3D
tagging has been proposed [147]. By applying modulation of magnetization in all
three spatial directions, through-plane motion is intrinsically captured and hence no
slice-following is needed. Furthermore, 3D acquisition provides full LV coverage and
yields an intrinsically higher signal-to-noise (SNR) compared to 2D imaging. While
cine 2D acquisitions easily fit into a single breath hold, 3D acquisitions require
multiple breath holds with long duration [147]. Further approaches attempted to
shorten scan time to four breath holds of 21 R-R intervals each [89] by only
sampling around the harmonic peaks in k-space. These efforts, however, led to a
lower spatial resolution in the two phase encoding directions. A different approach
was proposed by Zhong et al. [105] using a 3D DENSE acquisition covering the entire
left ventricle during free breathing. However, acquisition durations of up to 20 min
[10] depending on navigator efficiency were reported and hence feasibility for
routine clinical use may be questioned. Rutz et al. [9] introduced an accelerated 3D
CSPAMM method only requiring three navigator gated breath holds of 18 R-R
intervals each. This implementation was tested in a clinical study with patients
suffering from MI and LBBB [132] providing 3D maps of synchrony and magnitude of
contraction. To address issues of different breath hold levels the data obtained
from respiratory navigators was used to correct for potential offsets. In their study
the respiratory navigator was placed onto the right hemi-diaphragm and thereby
respiratory induced displacement of the heart was approximated according to a
linear relationship between liver and heart displacement [148]. The accuracy of the
linear translation from motion of the lung liver interface to the position of the heart
is still being debated. Nehrke et al. [149] reported a strong correlation of the
displacement of the right hemi-diaphragm and the heart, but also found significant
subject dependent variability in the correction coefficients especially comparing
48
inspiration and expiration. Subject dependency of the translation of breathing
induced liver motion to bulk motion of the heart has been confirmed by Moghari et
al. [150].
In general, data acquisition can be accelerated by undersampling in spatial and
temporal dimensions. Among the various approaches, two strategies have gained
sampling and hence become applicable if a sufficient number of phase-encodes
exists. In case of one-dimensional tagging preparation, the number of Cartesian
phase-encodes orthogonal to the tag direction can be greatly reduced providing an
efficient and simple way for scan time reduction. In consequence the degrees of
freedom to generate random sampling patterns become very limited and the
application of compressed sensing appears less favorable in this particular
application.
The second acceleration strategy involves uniform spatiotemporal undersampling in
conjunction with linear reconstruction algorithms. In k-t BLAST and k-t SENSE [13]
low spatial but full temporal resolution training data is used to unfold signal aliasing
resulting from data undersampling. The drawback of these methods relates to
temporal filtering if undersampling rates increase. To address this issue, Principal
Component Analysis (PCA) of the spatial-temporal frequency domain data was
introduced and results obtained with k-t PCA show improved temporal fidelity [12].
Although k-t undersampling has been extensively applied in CMR including cine and
real-time imaging [152,153], perfusion [154-159] and phase contrast imaging [160-
162], only few attempts of applying k-t undersampling to tagging have been
reported [163,164].
The objective of the present study was to implement and test k-t undersampled
whole-heart 3D CSPAMM tagging for rapid assessment of cardiac motion. The
performance is demonstrated on simulated data, data obtained in healthy subjects
and in patients with myocardial infarction.
49
Undersampled Cine 3D Tagging for Rapid Assessment of Cardiac Motion0F
4.2 Methods
4.2.1 k-t PCA
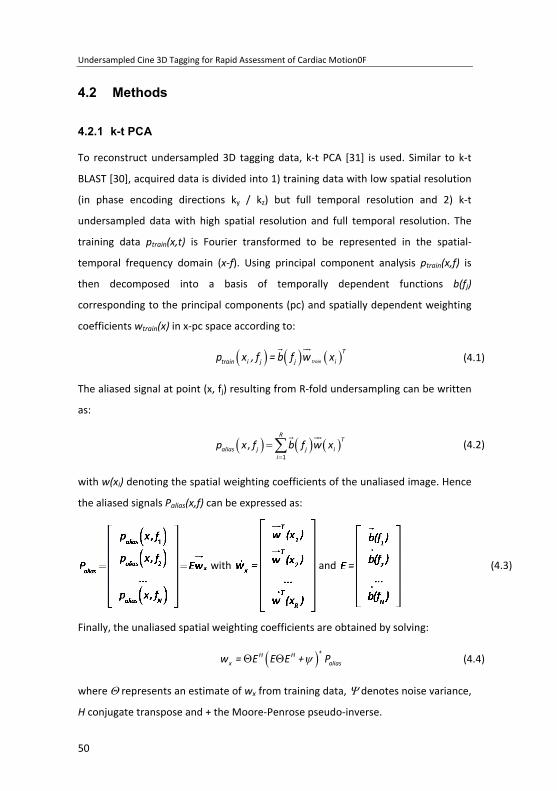
To reconstruct undersampled 3D tagging data, k-t PCA [31] is used. Similar to k-t
BLAST [30], acquired data is divided into 1) training data with low spatial resolution
(in phase encoding directions ky / kz) but full temporal resolution and 2) k-t
undersampled data with high spatial resolution and full temporal resolution. The
training data ptrain(x,t) is Fourier transformed to be represented in the spatial-
temporal frequency domain (x-f). Using principal component analysis ptrain(x,f) is
then decomposed into a basis of temporally dependent functions b(fj)
corresponding to the principal components (pc) and spatially dependent weighting
coefficients wtrain(x) in x-pc space according to:
( ) ( ) ( )train
Ttrain i j j ip x , f = b f w x
(4.1)
The aliased signal at point (x, fj) resulting from R-fold undersampling can be written
as:
( ) ( ) ( )1
,R
Talias j j i
i
p x f b f w x=
=∑
(4.2)
with w(xi) denoting the spatial weighting coefficients of the unaliased image. Hence
the aliased signals Palias(x,f) can be expressed as:
with and (4.3)
Finally, the unaliased spatial weighting coefficients are obtained by solving:
( )+H Hx aliasw = E E E + PψΘ Θ (4.4)
where Θ represents an estimate of wx from training data, Ψ denotes noise variance,
H conjugate transpose and + the Moore-Penrose pseudo-inverse.
50
4.2.2 Computer simulation
All simulations were performed in Matlab (The MathWorks, Natick, MA, USA). Three
orthogonal stacks with line tagging modulation in readout direction were generated
(Figure 11 a).
Undersampling factor
Matrix size kx×ky
Slices kz
Heart phases
Training profiles (ky×kz)
Rnet
3 65×15 15 24 25 (5×5) 2.3
4 65×20 15 24 25 (5×5) 3
5 65×20 15 24 25 (5×5) 3.5
8 65×16 15 24 25 (5×5) 4.4
Table 1. Parameters used for numerical simulation.
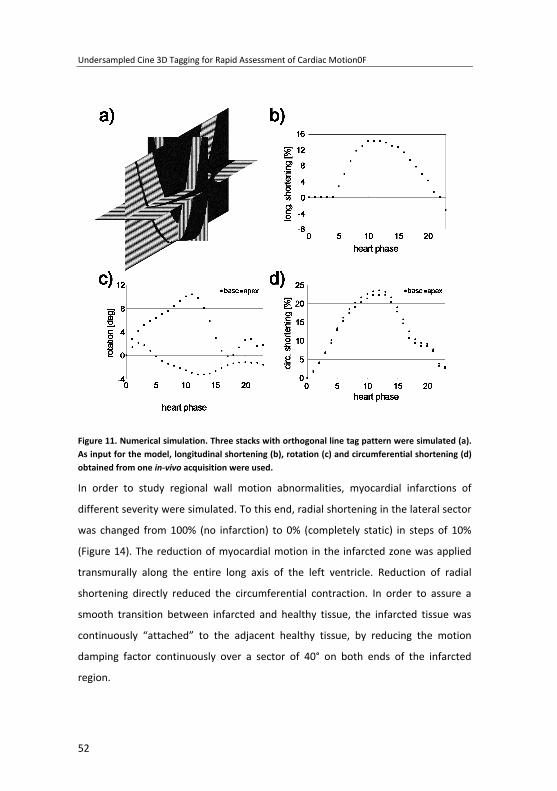
The CSPAMM method [87] was simulated to avoid tag line fading. The model
consisted of a contracting left ventricle as well as static tissue representing chest
wall and liver. Circumferential shortening and rotation as measured in a healthy
subject at basal and apical level was linearly interpolated along the long-axis to
create three-dimensional motion data. Peak circumferential shortening was 18.8%
and 17.8% for base and apex, respectively. Peak rotation was -3.2° and 10.3° for
base and apex (Figure 11 b-d). Longitudinal shortening obtained from the same in-
vivo subject was incorporated. Simulations of undersampled data acquisition were
compared to fully sampled simulated data sets with equivalent spatial and temporal
resolution. The matrix size was set according to practical values [9,132] (Table 1).
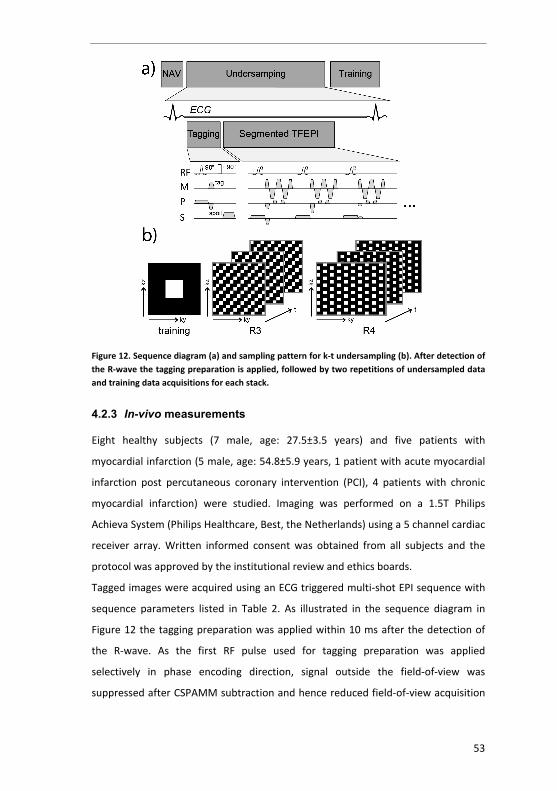
Gaussian noise was added to k-space data before undersampling resulting in a SNR
of 25 prior to undersampling. Both undersampled and training data were extracted
from the computer model (Figure 12 b). Undersampling rates of R = 3, 4, 5 and 8
were simulated. In all simulations, five training profiles were used in ky and kz
direction resulting in a total of 25 training profiles.
51
Undersampled Cine 3D Tagging for Rapid Assessment of Cardiac Motion0F
Figure 11. Numerical simulation. Three stacks with orthogonal line tag pattern were simulated (a). As input for the model, longitudinal shortening (b), rotation (c) and circumferential shortening (d) obtained from one in-vivo acquisition were used.
In order to study regional wall motion abnormalities, myocardial infarctions of
different severity were simulated. To this end, radial shortening in the lateral sector
was changed from 100% (no infarction) to 0% (completely static) in steps of 10%
(Figure 14). The reduction of myocardial motion in the infarcted zone was applied
transmurally along the entire long axis of the left ventricle. Reduction of radial
shortening directly reduced the circumferential contraction. In order to assure a
smooth transition between infarcted and healthy tissue, the infarcted tissue was
continuously “attached” to the adjacent healthy tissue, by reducing the motion
damping factor continuously over a sector of 40° on both ends of the infarcted
region.
52
Figure 12. Sequence diagram (a) and sampling pattern for k-t undersampling (b). After detection of the R-wave the tagging preparation is applied, followed by two repetitions of undersampled data and training data acquisitions for each stack.
4.2.3 In-vivo measurements
Eight healthy subjects (7 male, age: 27.5±3.5 years) and five patients with
myocardial infarction (5 male, age: 54.8±5.9 years, 1 patient with acute myocardial
infarction post percutaneous coronary intervention (PCI), 4 patients with chronic
myocardial infarction) were studied. Imaging was performed on a 1.5T Philips
Achieva System (Philips Healthcare, Best, the Netherlands) using a 5 channel cardiac
receiver array. Written informed consent was obtained from all subjects and the
protocol was approved by the institutional review and ethics boards.
Tagged images were acquired using an ECG triggered multi-shot EPI sequence with
sequence parameters listed in Table 2. As illustrated in the sequence diagram in
Figure 12 the tagging preparation was applied within 10 ms after the detection of
the R-wave. As the first RF pulse used for tagging preparation was applied
selectively in phase encoding direction, signal outside the field-of-view was
suppressed after CSPAMM subtraction and hence reduced field-of-view acquisition
53
Undersampled Cine 3D Tagging for Rapid Assessment of Cardiac Motion0F
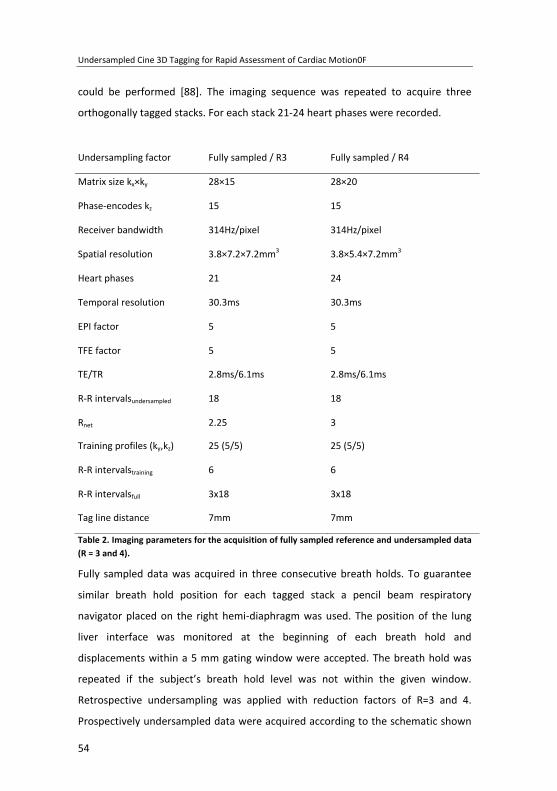
could be performed [88]. The imaging sequence was repeated to acquire three
orthogonally tagged stacks. For each stack 21-24 heart phases were recorded.
The fully sampled data was used as reference. Relative differences ± one standard
deviation are reported in % for circumferential shortening and rotation. In order to
estimate the correlation between undersampled and reference data linear
55
Undersampled Cine 3D Tagging for Rapid Assessment of Cardiac Motion0F
regression was performed correlating circumferential shortening and rotation of
reference data and undersampled data. Regression slope, offset and the
corresponding 95% confidence interval were estimated as well as the correlation
coefficient R2 and the standard error of the estimate (SEE). The SEE is given in % of
the range of motion and is defined as ( )N 2i ii=1
1SEE = x - xN - 2
′∑ with N being the
number of points, xi denoting measurement data and xi’ corresponding values
derived from linear regression. For in-vivo imaging, peak circumferential shortening
and rotation were compared using Bland Altman analysis. Mean differences and the
95% levels of agreement corresponding to 2 standard deviations (2SD) are reported.
Linear regression was performed on peak circumferential shortening and rotation.
Regression slopes, offsets, correlation coefficients and the SEE are reported.
Comparing reference data and retrospectively undersampled data, the HARP
tracking performance of contour coordinates was studied based on contour vertex
definitions in polar coordinates. Similar to the analysis of peak circumferential
shortening and rotation, Bland Altman and linear regression analysis were
performed.
Patient data are reported using bull’s-eye plots of peak circumferential shortening,
and late gadolinium enhancement (LGE). The centre of the bull’s-eye plots
represents the apex and the outer ring the base of the LV. For LGE images the
average myocardial signal intensity per slice and sector normalized to the signal
intensity measured in infarcted tissue is shown. Sectors were grouped into two
groups: 1) non-viable sectors having more than 50% of the area presenting LGE and
2) viable sectors having less or equal to 50% of the area presenting LGE. Peak
circumferential shortening was estimated for all sectors in each group and the
median, 50th percentiles and 90th percentiles were estimated and presented in box-
plots. Statistical significance of the differences in peak circumferential shortening
between both groups were estimated by a two-tailed Wilcoxon signed-rank test.
The results were Bonferroni corrected for repeated testing. A p-value less than 0.05
was considered statistically significant.
56
4.3 Results
4.3.1 Computer simulation
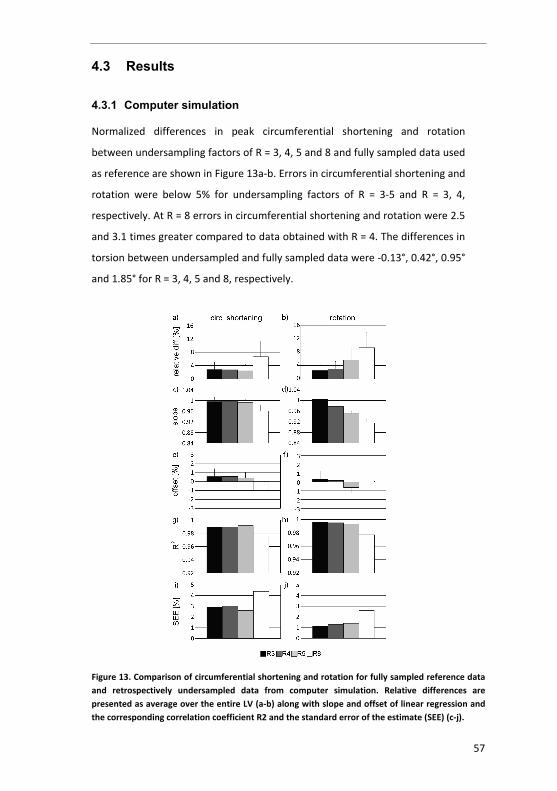
Normalized differences in peak circumferential shortening and rotation
between undersampling factors of R = 3, 4, 5 and 8 and fully sampled data used
as reference are shown in Figure 13a-b. Errors in circumferential shortening and
rotation were below 5% for undersampling factors of R = 3-5 and R = 3, 4,
respectively. At R = 8 errors in circumferential shortening and rotation were 2.5
and 3.1 times greater compared to data obtained with R = 4. The differences in
torsion between undersampled and fully sampled data were -0.13°, 0.42°, 0.95°
and 1.85° for R = 3, 4, 5 and 8, respectively.
Figure 13. Comparison of circumferential shortening and rotation for fully sampled reference data and retrospectively undersampled data from computer simulation. Relative differences are presented as average over the entire LV (a-b) along with slope and offset of linear regression and the corresponding correlation coefficient R2 and the standard error of the estimate (SEE) (c-j).
57
Undersampled Cine 3D Tagging for Rapid Assessment of Cardiac Motion0F
Figure 13c-j shows regression slope, offset, correlation coefficient and SEE for R
= 3, 4, 5 and 8. The 95% confidence intervals are presented as error bars for
fitted slopes and offsets.
Figure 14 shows the result of motion tracking in the presence of simulated
infarction. Peak circumferential shortening in an equatorial slice is plotted for
the reference vs. undersampled data. Linear regression was performed,
resulting in a slope of 1.01 (±0.04 95% confidence interval) and an offset of -
2.01% of the range of contraction (±4.79% 95% confidence interval).
Figure 14. Comparison of peak circumferential shortening from undersampled (R = 3) and fully sampled simulated data. Myocardium was divided into three groups: infarction (I), which covers a sector of 80° (22% of myocardium), healthy tissue (H) and infarct adjacent (A) tissue “attaching” infarcted to healthy tissue over a sector of 40° (11% of myocardium). For infarcted tissue, different degrees of immobilized tissue ranging from 0% to 100% were simulated.
4.3.2 In-vivo measurements
Figure 15 shows short axis slices reconstructed from fully sampled and 3- and 4-
fold retrospectively and prospectively undersampled data. Frames at 27 ms
after detection of the R-wave, at end systole (279 ms) and at mid diastole (559
ms) are shown.
Linear regression analysis performed on fully sampled and retrospectively
undersampled is shown in Figure 16. For each regression the equations of the
linear fit, the correlation coefficients R2 and the SEE are given. Figure 16 a-d
58
show the analysis of polar coordinates of tracked points and Figure 16 e-h
demonstrate sector-wise comparison of time curves of circumferential
shortening and rotation for R = 3 and 4.
Figure 15. Comparison of short-axis views reconstructed from fully sampled (ref) and 3- and 4-fold retrospectively (retrospect) and prospectively (prospect) undersampled data. Three different time points are shown.
59
Undersampled Cine 3D Tagging for Rapid Assessment of Cardiac Motion0F
Figure 16. Linear regression analysis for point-wise and sector-wise comparison of fully sampled (ref) and retrospectively undersampled (und) data in healthy volunteers (R=3 and 4). Point-wise comparison was performed for polar coordinates r (a, c) and φ (b, d). For circumferential
shortening (e, g) and rotation (f, h) entire motion curves were compared per sector across the entire LV.
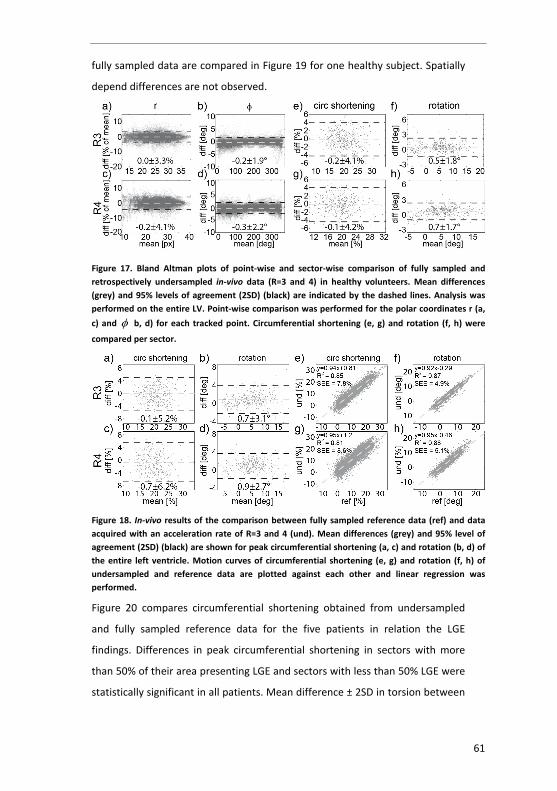
Figure 17 shows the Bland-Altman comparison of fully sampled and
retrospectively undersampled in-vivo data for R = 3 and 4. Dashed lines
represent the mean difference (light grey) and the 95% limit of agreement
(2SD) (black). Figure 17 a-d provides the comparison of radial coordinates (r =
radius and φ = angle) of tracked contour points. Mean differences ± 2SD of r
were 0.0±3.3% and -0.2±4.1% for R=3 and 4 and -0.2±1.9° and -0.3±2.2° for φ. In
Figure 17 e-h Bland-Altman plots for peak circumferential shortening and peak
rotation are given. The mean differences ± 2SD for circumferential shortening
were -0.2±4.1% and -0.1±4.2% for R=3 and 4. For rotation, mean differences ±
2SD were 0.5±1.8° and 0.7±1.7° for R=3 and 4. The mean differences of torsion
were 0.45±2.22° (p = N.S.) and 0.05±2.24° (p = N.S.) for R=3 and 4, respectively.
Figure 18 shows the resulting Bland-Altman analysis of peak motion (a-d) and
correlation between full time curves of motion (e-h) comparing fully sampled
data with data acquired with prospective undersampling (R=3 and 4). Mean
differences ± 2SD of peak circumferential shortening were -0.14±5.18% and -
0.71±6.16% for R = 3 and 4. Mean differences of peak rotation were found to
be 0.44±1.80° and 0.73±1.67° for R = 3 and 4 while differences in torsion were
0.48±4.20° (p = N.S.) and 0.03±4.48° (p=N.S.) for R = 3 and 4, respectively.
Bull’s-eye plots of peak circumferential shortening and profiles of
circumferential shortening and rotation derived from undersampled (R = 4) and
60
fully sampled data are compared in Figure 19 for one healthy subject. Spatially
depend differences are not observed.
Figure 17. Bland Altman plots of point-wise and sector-wise comparison of fully sampled and retrospectively undersampled in-vivo data (R=3 and 4) in healthy volunteers. Mean differences (grey) and 95% levels of agreement (2SD) (black) are indicated by the dashed lines. Analysis was performed on the entire LV. Point-wise comparison was performed for the polar coordinates r (a, c) and φ b, d) for each tracked point. Circumferential shortening (e, g) and rotation (f, h) were
compared per sector.
Figure 18. In-vivo results of the comparison between fully sampled reference data (ref) and data acquired with an acceleration rate of R=3 and 4 (und). Mean differences (grey) and 95% level of agreement (2SD) (black) are shown for peak circumferential shortening (a, c) and rotation (b, d) of the entire left ventricle. Motion curves of circumferential shortening (e, g) and rotation (f, h) of undersampled and reference data are plotted against each other and linear regression was performed.
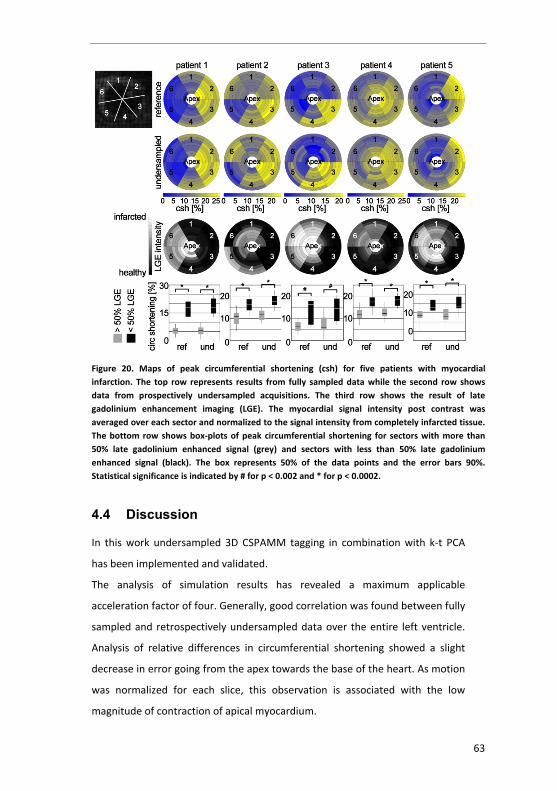
Figure 20 compares circumferential shortening obtained from undersampled
and fully sampled reference data for the five patients in relation the LGE
findings. Differences in peak circumferential shortening in sectors with more
than 50% of their area presenting LGE and sectors with less than 50% LGE were
statistically significant in all patients. Mean difference ± 2SD in torsion between
61
Undersampled Cine 3D Tagging for Rapid Assessment of Cardiac Motion0F
undersampled and fully sampled reference data in patients was 0.72±2.14°. The
SNR in the fully sampled in-vivo data was 36±12 on average.
Figure 19. Comparison of circumferential shortening for fully sampled data and 4-fold undersampled data. The first column shows maps of peak circumferential shortening for fully sampled b) and undersampled data c). Resulting motion profiles taken from an equatorial slice are shown for circumferential shortening (d, e) and rotation (f, g). The dots represent the actual data points while the line represents the polynomial fit.
62
Figure 20. Maps of peak circumferential shortening (csh) for five patients with myocardial infarction. The top row represents results from fully sampled data while the second row shows data from prospectively undersampled acquisitions. The third row shows the result of late gadolinium enhancement imaging (LGE). The myocardial signal intensity post contrast was averaged over each sector and normalized to the signal intensity from completely infarcted tissue. The bottom row shows box-plots of peak circumferential shortening for sectors with more than 50% late gadolinium enhanced signal (grey) and sectors with less than 50% late gadolinium enhanced signal (black). The box represents 50% of the data points and the error bars 90%. Statistical significance is indicated by # for p < 0.002 and * for p < 0.0002.
4.4 Discussion
In this work undersampled 3D CSPAMM tagging in combination with k-t PCA
has been implemented and validated.
The analysis of simulation results has revealed a maximum applicable
acceleration factor of four. Generally, good correlation was found between fully
sampled and retrospectively undersampled data over the entire left ventricle.
Analysis of relative differences in circumferential shortening showed a slight
decrease in error going from the apex towards the base of the heart. As motion
was normalized for each slice, this observation is associated with the low
magnitude of contraction of apical myocardium.
63
Undersampled Cine 3D Tagging for Rapid Assessment of Cardiac Motion0F
Different transmural extensions of infarcted tissue were investigated by
computer simulation. Motion analysis showed a good correlation between
undersampled and fully sampled reference data. Transmural reduction of
contraction as low as 20% could be distinguished from healthy fully contracting
tissue. Although fully infarcted tissue was simulated as well, sector-wise
analysis always showed contraction greater than 6%. This is due to the choice
of the position and size of the sectors used for analysis. Sectors with non-
contracting tissue contained slightly contracting neighbouring tissue, which
leads to a non-zero average circumferential shortening within a sector.
In-vivo comparison between fully sampled data and retrospectively
undersampled data showed good agreement as the mean difference was less
than 1% (% of range of motion). Differences between reference data and
prospectively undersampled acquisition were found to be larger in comparison
to differences seen relative to retrospectively undersampled data. This finding
is related to multiple issues. On one hand, reference data and undersampled
data were acquired in two consecutive scans. Despite the use of a gating
respiratory navigator, different breath hold levels are possible and slices used
for analysis might hence differ in position. On the other hand the fully sampled
reference data itself was acquired in three consecutive breath holds, which,
despite the use of a respiratory gating window of 5mm, can lead to stack
misalignment within the reference data. The resulting circumferential
shortening is dependent on the transmural position of the tracked contour. If
stack misalignment occurs a contour that appears to be midmural in one stack
can be positioned more epicardially or endocardially in the consecutive two
stacks from which the motion orthogonal to the first stack is derived from.
Hence a contour point is tracked at three different transmural positions.
Therefore the motion profiles obtained from fully sampled data, used as gold
standard reference in this work, might have been compromised. Image
registration was not performed in this study. The implementation of tailored
registration algorithms that can handle orthogonal tagging modulations
requires further investigation.
64
Maps of peak circumferential shortening as well as the corresponding motion
profiles were found to agree well for reference and undersampled data. The
magnitude of circumferential shortening is comparable to previously reported
values [9,132,167,168]. Besides potential motion smoothing, expressed by the
positive mean difference for rotation, a slice by slice comparison of
prospectively undersampled and fully sampled data might have been biased by
an offset in breath hold level for both acquisitions.
In this study, standard 2D single slice tagging data were not available for
reference. In order to capture through-plane motion and hence make data
comparable to 3D tagging, non-standard extensions of 2D tagging such as slice
following [143] or zHARP [145] are required. Accordingly, assessment of error in
the present work was relative to fully sampled 3D CSPAMM data only, which is
a clear limitation. Nevertheless, there have been previous records of validating
3D CSPAMM on healthy subjects and patients, which may serve as benchmark
[9,132].
Spatial resolution in each of the three orthogonal stacks in 3D CSPAMM may be
considered coarse (3.8×5.4-7.2×7.2mm3). The resolution given in readout
direction is, however, directly linked to the tagline spacing when using HARP
analysis. Higher temporal resolution (< 30ms) is desirable as this allows
separating data in x-pc space further and hence improves reconstruction
accuracy in k-t PCA. However, this results in more heart phases and hence more
RF excitations per cardiac cycle reducing the contrast-to-noise ratio of the
tagged data.
Five patients with myocardial infarction were examined using undersampled
tagging and LGE imaging. Maps of circumferential shortening derived from
reference data and prospectively undersampled data agreed well and infarcted
regions could be localized. Direct correlation of peak circumferential shortening
with the area of delayed enhancement was found to be only moderate. A
potential limitation of infarct detection is related to averaging of motion within
sectors. A six-sector per slice model [9,132] results in 16.7% of total myocardial
mass captured per sector and per slice. For example, non-viable tissue in border
zones of infarction is passively moved and compressed and hence the extent of
65
Undersampled Cine 3D Tagging for Rapid Assessment of Cardiac Motion0F
motion abnormality may be overestimated. This issue may be addressed by
increasing the number of sectors per slice and by using multiple circumferential
contours covering the entire transmural extent in future work.
Several strategies may be envisioned to shorten the relatively long breath hold
durations (~20 sec) of the present protocols. First, sampling of training data can
be fully integrated into the acquisition of undersampled data. Such a variable
density EPI approach provides shorter overall scan duration at the expense of
reduced temporal resolution. Second, the separation of training data and
undersampled data allows splitting the data acquisition into two breath holds.
Compared to the method proposed by Rutz et al. [9] the three stacks are not
acquired within three consecutive breath holds, but could be acquired within
one breath hold for high resolution undersampled and a second breath hold for
low resolution training data. Since the training data has very low spatial
resolution in the phase-encode directions (2.3×2.3 cm2), differences in breath
hold levels between acquisitions no longer pose a concern.
4.5 Conclusion
Undersampled cine 3D tagging in conjunction with k-t PCA reconstruction enables
significant reduction in scan time of whole-heart tagging and facilitates efficient
and accurate quantification of shortening, rotation and torsion of the left ventricle.
Using 3-fold undersampling the entire cine 3D tagging acquisition could be
accommodated in a single breath hold and feasibility in volunteers and patients was
demonstrated. Future work is dedicated to shorten breath hold durations further
and to apply the method in larger patient cohorts to prove clinical value.
66
Chapter 5 Imaging microstructure with MRI
5. k-t sPCA for Accelerating Cine 3D Flow Measurements
The ultimate resolution limit of MRI is dictated by the mean displacement of water
molecules due to self-diffusion [169,170]. Besides the fundamental diffusion limit,
the signal-to-noise ratio (SNR) is a key image quality criterion and scales inversely
with spatial resolution [171] according to:
y zpixel average phase phase sampleSNR x y z n n n τ∝ ∆ ∆ ∆ (5.1)
where the product x y z∆ ∆ ∆ denotes voxel volume, averagen the number of averages,
phasen the number of phase encodings in one (2D imaging) or two (3D imaging)
directions and sampleτ the sampling time. Based on equation (5.1) it follows that for
relevant scan times and SNR values, spatial resolutions on the order of a millimeter
are feasible. However, tissue is usually not composed of homogeneous material at
the scale of the imaging resolution but has structure that is much finer. Despite this
obvious limitation, insights into the microscopic structure may nevertheless be
gained, as demonstrated by Stejskal and Tanner [172] in 1965, by encoding the
diffusivity of water molecules using dedicated gradient pulses. In 1976 it was shown
that the diffusivity of water in muscle tissue does depend on the direction of
diffusion encoding gradients [173] leading to a framework of measuring anisotropic
diffusion with MRI [174].
5.1 Diffusion of water molecules
In 1905 Einstein [175] derived a unique solution to the differential equation for free
isotropic diffusion processes in solutions described by Fick [176], using the following
67
Imaging microstructure with MRI
boundary condition ( ) ( ) ( ) ( ){ }, 0; , , : 0 0 0y x t x t x t x x t= ∀ ∈ > ∪ < ∩ = and
( ),y x t dx n∞
−∞=∫ (n being the number of dissolved particles):
( )2
4,4
xDtny x t e
Dtπ
−= (5.2)
with D being the diffusion coefficient. The probability a water molecule is displaced
from x to x x+ ∆ during time t is given according to [175]:
( )( )2
41,4
x xDtp x x t e
Dtπ
+∆−
+ ∆ = (5.3)
The root mean square displacement along x direction is then determined as:
2x Dtλ = (5.4)
Equations (5.2)-(5.3) hold for free diffusion. A deviation from linearity in t in (5.4)
is expected for restricted diffusion with a spatial restriction narrower than xλ . In
case of more complex restriction the diffusion equation has to be solved with the
problem specific boundary conditions.
Assuming a short gradient pulse of duration δ after excitation in an MRI
experiment, the transverse magnetization experiences a phase accumulation
according to:
1 1G xϕ γ δ= (5.5)
If the gradient is repeated with inverted sign after a delay of δ∆ >> , while a water
molecule has traveled from 1x to 2x , the phase differenceϕ ϕ−2 1 reads:
( )2 1 2 1G x xϕ ϕ γ δ− = − (5.6)
The total transverse magnetization is given as the sum of magnetization weighted
by the probability density function p (PDF). With ( )2 1x x z− = it follows:
( ) γ δ∞ −
−∞∝ ∆∫0 , i G z
xyM M p z e dz (5.7)
68
The probability distribution can be derived using the Fourier transform of the
measured ratio 0xyM M as a function of the diffusion encoding strength q Gγ δ=
[177]. In case of a three-dimensional image and a three-dimensional probability
distribution, the parameter space has six dimensions: ( ), , , , ,x y zx y z q q q , with x, y, z
being the spatial coordinates and xq , yq , zq the coordinates in the so called q-space
[178]. A vector in q-space is represented by ( )q G t dtγ∞
−∞′ ′= ∫
with gradient G
being
prescribed in the canonical basis of the image space. To calculate the probability
distribution function, the q-space has to be populated by measurements of
Based upon work by Carr, Purcell and Hahn [169,179] describing signal attenuation
due to water self-diffusion in NMR experiments, Stejskal and Tanner [172] proposed
a spin echo based sequence with pulsed gradients (Figure 21).
Figure 21. Stejskal-Tanner diffusion encoding pulse sequence. While spatial encoding gradients are presented in light gray, diffusion encoding gradients in shown in dark gray.
If a particle is displaced, it accumulates phase according to its position in the
magnetic gradient field applied. Therefore Torrey [180] extended the Bloch
equation by a diffusion term:
69
Imaging microstructure with MRI
2
2
01
1 0 00
10 0 01
10 0
TM M B M D Mt T
MT
γ
∂
= × − + +∇ ∇ ∂
(5.8)
As derived elsewhere [181] the solution for the transverse magnetization can be
written as:
( ) ( ) ( ) ( ) ω− − −′ ′ ′−∫∝
00 2
0,t T tirk t i tk t Dk t dt T
xyM r t M e e (5.9)
where the first exponential corresponds to the signal decay due to diffusion while
the second term contains Larmor precession in the main magnetic field 0B and the
gradient as well as 2T dephasing. ( )k t
represents the diffusion encoding moment:
( ) ( )0
tk t G t dtγ
′′ ′′ ′′= ∫
. The diffusion part of (5.9) at echo formation can be simplified
for the case of isotropic diffusion:
( ) ( )′ ′ ′− −∫ =
00 0
t Tk t Dk t dt bDM e M e (5.10)
with b being the measure of the sensitivity to diffusion:
( ) ( )( )2
0 0 0
TE t tb G t dt G t dt dtγ ′ ′ ′ ′= ⋅∫ ∫ ∫
(5.11)
Neglecting gradient ramp times, for the Stejskal-Tanner experiment the b-value is
calculated as:
2 2 2
3Stejskal Tannerb G δγ δ− = ∆ −
(5.12)
In the anisotropic case ( ) ( )Tk t Dk t
has to be written in its quadratic form, yielding
a b-matrix. D corresponds to the apparent diffusion tensor with its symmetric
matrix representation:
70
=
xx xy xz
yx yy yz
zx zy zz
D D DD D D D
D D D (5.13)
The elements can be determined from six diffusion weighted ( )0b ≠ images
(corresponding to six points in q-space) and one unweighted image ( )0b = . After
rotation into its eigensystem ( )1 2 3e e e the diffusion tensor matrix is cast into a
diagonal matrix. The corresponding eigenvalues ( )1 2 3λ λ λ represent the
diffusion coefficients along the tensors principal directions (Figure 22).
Figure 22. Ellipsoidal representation of the diffusion tensor. ie
correspond to the tensor’s
eigenbasis; iλ represents the diffusion along ie
.
5.2.1 Non-Gaussian diffusion
In biological tissue diffusion is restricted due to membranes, cell components or
entire cells. Hence the PDF function may differ from a Gaussian distribution [182].
As a measure for the deviation from a Gaussian shape the distribution’s kurtosis can
be studied. Kurtosis can be assessed by sampling q-space and deriving the actual
PDF according to (5.7) [183]. This requires an excessive number of data acquisitions.
To address this issue, Jensen et al. proposed an approximative method [184]. Using
equation (5.7), ( )( ),ln x yM q
is expanded in q
up to fourth order [184,185]:
( )( ) ( )( ) 2, ,
1 1ln ln 0 ...6 3x y x y i j ij ii i j k l ijkl
i j i i j k l
M b M b n n D b D n n n nW = − + +
∑∑ ∑ ∑∑∑∑
(5.14)
71
Imaging microstructure with MRI
with in being the ith component of the normalized direction vector along which the
gradient is applied, ijD being the i,jth component of the diffusion tensor and ijklW
the kurtosis tensor:
( )( )( ) ( ) ( )
( ) ( ) ( ) ( )
3 3 32
3
3 3 3 3
9( ) , , ,,
, , , ,
ijkl i j k l i j k l
i k j l i l j k
W T P z T z z z z d z P z T z z d z P z T z z d zP z T z zd z
P z T z z d z P z T z z d z P z T z z d z P z T z z d z
= − −⋅
−
∫ ∫ ∫∫
∫ ∫ ∫ ∫
(5.15)
The kurtosis tensor has 43 81= components and from (5.15) it is seen that it is
symmetric with respect to exchanging indices. Hence to fully characterize the
kurtosis tensor, 15 independent components need to be determined. The scalar
diffusional kurtosis in a specific direction n
is calculated as:
( )( )( )( )( )
( )
( )( )
2
4 3
2 23
1, 3
3,
iii
i j k l ijkli j k l
iji j
D TP z T n z d zK T n n n nW T
P z T n z d zD T
⋅ = − =
⋅
∑∫ ∑∑∑∑∫ ∑∑
(5.16)
For a Gaussian distribution ( )K t is zero. For a plateau in the distribution it is positive
for a more pointy distribution it is negative [186]. While kurtosis has primarily been
assessed in the brain, a recent study has shown that cardiac tissue may also exhibit
non-zero kurtosis [187,188].
5.3 Quantitative parameters
Apparent Diffusion Coefficient (ADC): The ADC corresponds to the one dimensional
diffusion constant D in equation (5.10). In anisotropic media the measurement of
the ADC depends on the diffusion encoding direction. In isotropic media a single
data point is sufficient to solve (5.10) for D. Multiple sample points increase the
precision or allow for separation of diffusion and perfusion components using the
Intra-Voxel Incoherent Motion (IVIM) model [189].
72
Mean diffusivity (MD): The MD corresponds to the trace of the diffusion tensor:
( ) ( )1 2 31 13 3
MD tr D λ λ λ= = + + (5.17)
Since the trace is invariant under basis transformation, it is sufficient to sample the
ADC with three orthogonal gradient directions [190]. For isotropic diffusion
1 2 3λ λ λ= = holds.
Fractional Anisotropy (FA): The FA is a unit-free measure of deviation of the
diffusion tensor from an ideal sphere
( )2
2
32
i avgi
ii
FAλ λ
λ
−=
∑
∑ (5.18)
with avgλ being the mean of the eigenvalues. An FA>0 corresponds to anisotropic
diffusion and is an indication for the presence of structure [191].
By acquiring samples in q-space on a sphere (Q-ball) [192,193] the orientation
density function (ODF) can be derived. Q-ball imaging does not use a model as in
DTI, but assumes that the apparent diffusion is identical for individual tissue fiber
bundles and only differs in orientation. Therefore the signal can be written in
spherical coordinates as convolution:
( ) ( ) ( )ϕ θ ϕ θ θ= ∗, ,S F R (5.19)
where ( )R θ is the response function describing the signal behavior of one fiber
bundle and ( ),F ϕ θ corresponds to the orientation density function which weights
the response function by the amount of fibers that are present pointing in a specific
direction ( ),ϕ θ . ( )R θ can be approximated from pixels with highest FA [193] and
( ),F ϕ θ is obtained upon spherical deconvolution. It was shown by Tuch et al.
[192,194] that the orientation distribution function (ODF, see equation (5.21)), can
be approximated by the Funk Radon Transform of the diffusion signal sampled on a
shell with radius q :
73
Imaging microstructure with MRI
( ) ( ) 3
0q n
S qODF n d q
S⊥∈≈ ∫
(5.20)
which corresponds to the sum of the measured signals ( )
0
S qS
in directions q
orthogonal to the direction of interest n
. The model-free estimation of anisotropic
diffusion is implemented by Diffusion Spectrum Imaging (DSI) [177] and q-Space
Imaging (QSI). It is based on the Fourier relation of the MR-signal and the PDF in the
narrow pulse approximation (equation(5.7)). The ODF can be calculated from the
PDF ( ),p z ∆ by radial integration [177]:
( ) ( )0
,ODF n p rn dr∞
= ∆∫ (5.21)
When the ODF is calculated the underlying orientations of tissue structure is found
estimating the local maximal on the ODF surface for each voxel.
Given the geometry and symmetry of the left ventricle of the heart (Figure 23a), it is
appropriate to define specific angles of fiber tracts which are derived from the
eigenvectors (DTI) or from the ODF (DSI,QSI,q-Ball). The helix angle α is defined as
the angle between the projection of the myocardial fiber onto the epi/endocardial
surface and the transmural coordinate [195] while the transverse angle β is
defined as the angle between the projection of the fiber direction onto the
transmural plane and the circumferential coordinate [195] (Figure 23b). The
transmural angle β ′ is similarly defined, however, without the projection onto the
transmural plane [53].
Besides fiber bundle orientation, the angulation of myocyte aggregation in laminar
sheets can be identified based on DTI data [54,64,195]. The first and secondary
eigenvectors of the tensor point tangentially while the tertiary eigenvector
constitutes the normal vector of the myocyte sheets.
74
Figure 23. Angle definitions. a) Each position in the myocardium is represented in its cylindrical
coordinates: radial r
, circumferential c
and longitudinal z
positions. Helix α , transverse β ,
transmural β ′ and sheet γ angle definition is shown in b). The gray surfaces indicate projection
planes for the first (fiber direction) 1e
and third (sheet normal direction) 3e
eigenvector of the
diffusion tensor. The signs (±) indicate the polarity of the used angle definition.
5.4 Imaging diffusion in the beating heart
The key challenge of cardiac diffusion imaging relates to object motion. Firstly, the
heart is displaced by breathing. Secondly, the heart undergoes contraction. While
breathing motion can be compensated for by breathholding or respiratory
navigation, the compensation of effects due to cardiac contraction is more
challenging.
5.4.1 Diffusion weighted imaging using spin echoes
If the Stejskal-Tanner (Figure 21) diffusion encoding experiment is applied while the
heart is contracting, the desired signal is spoiled. This can be understood by
considering the phase accumulation of the magnetization during the application of
a magnetic field gradient:
( ) ( )0
encoding
encoding
t
t G t x t dtϕ γ= ∫ (5.22)
where encodingt is the duration of the diffusion encoding gradient, ( )G t
the gradient
waveform and ( )x t the trajectory of material points. Using Taylor approximation of
the trajectory ( )x t :
75
Imaging microstructure with MRI
( ) ( )0
0
1!
nn
n t
x t x t tt n
=
∂ = ∂ ∑ (5.23)
leads to:
20 0 00 0 0
( ) ( ) ( ) ....2γϕ γ γ= = == + + +∫ ∫ ∫
encodinγ encodinγ encodinγ
encodinγ
t t t
t t t tG t x dt G t x tdt G t x t dt (5.24)
From (5.24) it is seen that the accumulated phase can be calculated based on the
initial spatial coordinates of spins, their temporal derivatives and the gradient
moments nm
:
( )
( )
( )
( )
0 0
1 0
22 0
0
encoding
encoding
encoding
encoding
t
t
t
t nn
m G t dt
m tG t dt
m t G t dt
m t G t dt
=
=
=
=
∫∫∫
∫
(5.25)
Figure 24 shows the original Stejskal-Tanner diffusion encoding sequence as well as
a modification with a single sided (with respect to the echo pulse) waveform and
corresponding 0th to 3rd gradient moments.
It is seen that the first, second and third gradient moments are significantly
different from zero, thereby inducing sensitivity of the sequence to bulk motion. If a
single voxel, which undergoes deformation due to cardiac contraction is considered,
one can express the material stretch as a distribution of velocities across the voxels
dimension which in turn leads to a phase distribution within the voxel. Accordingly,
transverse magnetization is spoiled due to cancelation of magnetic moments with
opposing phase within a voxel according to [196]:
( ) 0sin
2
2
xy xyM M
ϕ
ϕ ϕ
∆ ∆ =∆
(5.26)
76
Hence standard diffusion encoding gradient waveforms with zero net area can only
be applied when no deformation is present i.e. tissue is either not moving or rigidly
displaced at a constant velocity. This condition is only fulfilled for very short time
windows during peak systole. Since the systolic window is only 10-20ms, sufficient
b-values can only be obtained with dedicated high-performance gradient systems
which are not available clinically.
Figure 24. Stejskal-Tanner diffusion encoding with minimal total gradient duration (top) and single sided diffusion encoding (bottom). Both diffusion encoding schemes provide a b-value of 450 s/mm2 with 80 mT/m maximum gradient strength. 0th to 3rd moments of the diffusion encoding gradient are plotted for the duration of the gradient. Gradients in light gray indicate the effective gradient including the change in sign due to the 180° refocussing pulse.
In Gamper et al. [19] it was demonstrated that the use of first-order gradient
moment nulling allows prolonging the systolic time window sufficiently to permit
mapping of 2D in-plane diffusion tensors of the in-vivo heart. A general approach to
gradient moment nulling for diffusion encoding is described by Pipe et al [197].
Figure 25 illustrates a double bipolar diffusion encoding scheme with its
corresponding 0th to 3rd gradient moments.
77
Imaging microstructure with MRI
Figure 25. First order motion compensated diffusion encoding. The 0th to 3rd order moments of the diffusion encoding gradient are shown. Gradients in light gray indicate the effective gradient including the change in sign due to the 180° refocussing pulse.
Despite its feasibility for imaging the in-vivo heart, the timing of the double bipolar
diffusion encoding scheme is challenging in that it requires a constant strain rate
over the duration of the diffusion encoding gradients. The use of a trigger delay
scout sequence [20], which sweeps through trigger delays during systolic
contraction was proposed to find an optimal timing window for diffusion encoding
along all required spatial directions [56,198].
To mitigate the residual sensitivity to motion, higher-order motion compensation
may be used at the expense of considerably longer diffusion gradient durations.
Figure 26 shows diffusion encoding schemes with first and second order moment
nulling. In the top row of Figure 26 the simplest waveform is presented while a
second, more time efficient, design is shown in the bottom row. In the latter case
the gap between the two gradient lobes is fixed to the duration of the positive part
of the first lobe. A detailed investigation of higher-order moment nulling for cardiac
DTI is presented in Chapter 7.
78
Figure 26. First and second-order motion compensation for diffusion encoding. The 0th to 3rd order moments of the diffusion encoding gradient are shown. Gradients in light gray indicate the effective gradient including the change in sign due to the 180° refocussing pulse.
5.4.1.1 Gradient field imperfections
Practical spin-echo based diffusion imaging requires careful considerations of
gradient field imperfections. To reduce eddy-current related effects, Reese et al.
[199] proposed a double spin-echo sequence to cancel eddy currents of specific
decay rates. Unfortunately, such schemes introduce non-zero first and second order
gradient moments thereby increasing their motion sensitivity. Alternatively, eddy
current fields may be measured and effects thereof corrected for in image
reconstruction [200,201].
Besides eddy-current related effects, concomitant fields may play a role. Assuming
quasi-stationary conditions the magnetic flux obeys:
0B∇⋅ =
(5.27)
0B∇× =
(5.28)
79
Imaging microstructure with MRI
The corresponding concomitant fields lead to an effective flux field developed to
second spatial order according to Bernstein et al. [202]:
( ) ( ) ( )2
2 2 2 2 20
0
1, ,2 4
zx y z x y x y y z
GB x y z B G x G x G x x y G G z G G xy G G yz
B
= + + + + + + + − −
(5.29)
with the concomitant field component:
( ) ( )2
2 2 2 2 2
0
12 4
zc x y x y y z
GB x y G G z G G xy G G yzB
= + + + − −
(5.30)
For symmetric sequences with respect to the refocussing pulse as shown in Figure
25 and Figure 26, concomitant fields cancel due to the refocussing pulse [203]. For
asymmetric sequences as shown in the bottom row of Figure 24 the quadratic terms
in (5.30) remain leading to signal dephasing.
80
5.4.2 Diffusion weighted imaging using stimulated echoes
An alternative to spin-echo based diffusion weighted imaging is the stimulated echo
acquisition mode (STEAM) [204,205]. STEAM takes advantage of the periodicity of
cardiac motion by splitting the Stejskal-Tanner diffusion encoding scheme into two
parts (Figure 27).
Figure 27. Diffusion weighted STEAM. Encoding and decoding blocks are applied at the same trigger delay (TD) in consecutive heart beats. Imaging gradients are shown in light grey and diffusion encoding gradients in dark grey. The orientation of macroscopic magnetization at different positions along the diffusion encoding direction is shown alongside for different time points within the sequence (neglecting readout gradients).
81
Imaging microstructure with MRI
Given the formation of the stimulated echo across two consecutive heart beats, the
b-value of diffusion weighted STEAM depends on the actual heart-rate. Based on
equation (5.11) the b-value is calculated:
3 3 2
2 2 2 603 30 6
b GHR
δ ζ δζγ δ
= − + −
(5.31)
with δ being the duration of the gradients slope plus its plateau, ζ the duration of
the slope and HR the heart rate (bpm). If heart rate variations occur the apparent
diffusion coefficient is given as:
actualapparent true
assumed
bD D
b= (5.32)
For example, if a heart rate of 60 bpm and a b-value of 500 s/mm2 are assumed, an
increase in heart rate by 10 bpm leads to an underestimation of D by 14%, while a
drop in heart rate by 10 bpm leads to an overestimation of D by 20%. If the current
heart rate is known for each acquisition, the diffusion tensor can be corrected for by
expanding the b-matrix in the three-dimensional case of (5.10) to multiple b-values
for each acquisition.
Besides the b-value sensitivity, the SNR of diffusion weighted STEAM is also
dependent on heart rate. Myocardial 1T is in the rage of 870 to 1300ms for 1.5T and
3T field strengths [80]. Accordingly, a considerable amount of modulated
magnetization relaxes during the R-R interval (Figure 28).
Figure 29 shows the effect of partial saturation in combination with 1T relaxation
during the mixing time for each average as a function of heart rate and field
strength. It is seen that strong signal saturation occurs after the first average
already.
82
Figure 28. Effect of T1 relaxation during the mixing time (TM). The magnetization is normalized to the thermal equilibrium value at 1.5 and 3T. On the x-axis the position of the local magnetization along the modulation and demodulation gradient is given. The time points correspond to position V (blue), VII (red) in Figure 27 as well as right before the third RF pulse (green). The loss of modulation along the longitudinal axis which translates into a reduced magnitude of transverse magnetization upon stimulated echo formation is plotted as function of the heart rate (HR).
Figure 29. Partial saturation combination with
1T relaxation during the mixing time as a function
of heart rate and field strength. Repetitive excitation leads to a 1T dependent signal saturation.
The remaining transverse magnetization relative to the thermal equilibrium magnetization at 1.5T is color-coded as a function of averages and heart rate.
83
Imaging microstructure with MRI
5.4.2.1 Strain effects
Strain effects in diffusion weighted STEAM can be separated into two components.
Firstly, different strain states of tissue during modulation and demodulation and,
secondly, the temporal evolution of myocardial strain during the mixing time
[17,18].
If the heart is not in the same contractile state during echo encoding and decoding,
a phase error occurs leading to signal attenuation unrelated to diffusion [17]. During
encoding the magnetization is modulated with spatial frequency 0k . After
deformation according to y Fx= , where F is the deformation gradient tensor, the
effective spatial encoding frequency is:
10
Teffk F k−= (5.33)
The deformation gradient tensor may be decomposed into a rotation and a stretch
component:
F RU= (5.34)
assuming that spatial rotation of tissue leads to an equivalent rotation of its
diffusion properties [18]. Magnetization upon diffusion encoding can be written as:
( ) ( ), ikxM x t M t e−= (5.35)
with the initial condition:
( ) 0,0 ikxM x M e−= (5.36)
Recalling the Bloch-Torrey equation (5.8) and neglecting relaxation one obtains:
( ) ( ), ikx TD M x t M t e k Dk−∇ ∇ = − (5.37)
and with further calculation [17]:
( ) ( )( )
( )( )0
,, ,ln
, ,T
M x tM x t D M x td t k Dkdt M M x t M x t
∂∇ ∇ ∂= = = −
(5.38)
84
It is noted that k
is assumed to be constant during the encoding duration.
Equations (5.33), (5.34) and(5.38) can now be combined and integrated over time
(note that the stretch tensor U is symmetric):
( ) ( ) ( )1 1
0 000
, 1ln TM x tk U t DU t k dt
M∆ − −
= − ∆ ∫
(5.39)
From (5.39) it is seen that the observed diffusion coefficient in the presence of
material strain differs from the true diffusion coefficient [17] by:
( ) ( )1 1
0
1observedD U t DU t dt∆ − −=
∆ ∫ (5.40)
If ( ) ( )1 10U U− −≠ ∆ it follows that observedD D≠ . Additionally Tseng et al. [206]
postulated the presence of so-called sweet-spots for imaging that fulfill the
condition ( ) 1sweet spot
sweet spot
t
tU t id−
−
+∆ − =∫ , i.e. temporal average of material strain is zero. This
condition approximately holds for two time points sweet spott − , one during systolic
contraction and one during diastolic relaxation. Unfortunately these two time
points are restrictive in terms of investigating the dynamics of diffusion tensors.
Generally, the true diffusion tensor can be estimated based on equation (5.40) if
the stretch tensor is known. In Chapter 6 methods to acquire and apply myocardial
deformation fields for diffusion tensor imaging are discussed.
85
Imaging microstructure with MRI
86
Chapter 6 Dual-Phase Cardiac Diffusion Tensor Imaging With Strain Correction2
6. Mean and Fluctuating Velocity Mapping by MRI and PTV
6.1 Introduction
The influence of myocardial fiber architecture on cardiac morphology and mechanics is
of significant interest. The helical organization of myocardial fibers [46,47,195,207] and
the formation of myocytes into sheets [60,62,64] by branching and interconnection
have been well described. While microscopy provides high-resolution images
[58,59,70], MR diffusion weighted imaging enables investigation of the intact organ.
Despite its lower spatial resolution compared to microscopy, MR has found application
in ex-vivo [64,207-217] and also in a small number of in-vivo [19,56,206,218-221]
studies of the heart. More recently, diffusion tensor imaging (DTI) has enabled
tractography of the myocardium both ex-vivo [222-224] and in-vivo [56,198,225].
In order to investigate differences in fiber configuration during the cardiac cycle, Chen
et al. [61] presented a comparison of ex-vivo pig hearts first arrested in diastole and
later fixated in systole. These ex-vivo findings were confirmed by Hales et al. [226].
Significant differences in helix angle and sheet angle distributions between systole and
diastole were found. Further investigations involved the study of sheet rearrangement
in myocardial pathologies [72,227].
In-vivo DTI of the human and animal heart has been performed using diffusion
weighted stimulated echo acquisition modes (STEAM) [17,18,206,221,228,229] and
2 Published in: Stoeck CT, Kalinowska A, von Deuster C, Harmer J, Chan RW, Niemann M, Manka R, Atkinson D, Sosnovik DE, Mekkaoui C, Kozerke S. Dual-Phase Cardiac Diffusion Tensor Imaging With Strain Correction. PLoS one 2014; 9(9):e107159
87
Dual-Phase Cardiac Diffusion Tensor Imaging With Strain Correction1F
first and second order motion compensated diffusion weighted spin-echoes
[19,56,198,220,225] in combination with echo-planar imaging readouts. While spin-
echo diffusion weighted imaging requires strong gradient systems in order to be
applied in the in-vivo heart, STEAM based sequence can be performed with standard
gradient hardware.
Early reports suggested that the impact of material strain is of significance in cardiac
DTI [17,18,206,218]. To this end, it was proposed to trigger STEAM encoding and
decoding to the so-called “sweet spots” of myocardial strain at which the temporal
mean of strain approaches zero [206]. Despite this insight, cardiac diffusion-weighted
STEAM at various time points in the cardiac cycle has been reported recently [221,230-
233].
The objective of the present work is to address the impact of material strain on the
diffusion tensor when imaging the in-vivo heart using the STEAM sequence. To this
end, a tensor correction scheme based on cine 3D tagging data is presented. In
addition, the diffusion weighted STEAM sequence is modified to allow for dual-phase
and slice-interleaved imaging thereby accelerating cardiac diffusion tensor imaging by
a factor of two relative to previous single-phase approaches. Differences in fiber and
sheet architecture between systole and diastole, without and with strain correction of
the in-vivo human heart are presented.
6.2 Methods
6.2.1 Study protocol
Ten subjects without any history of cardiac disease (4 male/6 female, age 27±8years,
weight 68±7kg, heart rate 66±11bpm) were imaged on a clinical 1.5T scanner (Achieva
system, Philips Healthcare, Best, The Netherlands). The scanner was equipped with a
gradient system delivering 40mT/m maximum strength and 200mT/m/ms maximum
slew rate per physical gradient axis. A 5-channel cardiac array coil was used for signal
detection.
88
Written informed consent was obtained from each subject prior to imaging, and the
study protocol was approved by the ethics committee of the canton of Zurich.
Obtained informed consent included imaging as well as publication of anonymized
data.
Short-axis balanced steady state free precession cine data with a temporal resolution
of 7ms were obtained in the 2-chamber and short-axis planes of the left ventricle (LV)
to identify the ventricular systolic (trigger delay: 277±19ms) and diastolic (trigger
delay: 627±85ms) standstill periods. For image-based shimming, a B0 field map was
acquired in the short-axis view covering the entire LV [234].
6.2.2 Myocardial tagging sequence
Three orthogonally orientated line tagged cine image volumes covering the entire LV
were acquired within three consecutive breath holds [9]. To compensate for
differences in breath hold levels a gating respiratory navigator was applied prior to the
acquisition of each stack (acceptance window 15mm). Resulting navigator offsets were
used for stack alignment during image reconstruction. In order to avoid tag line fading
during the cardiac cycle, complementary spatial modulation of magnetization
(CSPAMM) was applied requiring two signal averages, with inverted tagging
modulation [87]. Imaging parameters were as follows: FOV: 108×108×108mm3, spatial
reconstructed to 0.96×0.96×0.96mm3, temporal resolution: 18ms and 7mm tag line
distance. To achieve a temporal resolution of 18ms, the maximum slew rate of the
gradient system (200mT/m/ms) was used for the segmented echo planar imaging-
readout (EPI factor 7, 3 excitations per heart phase).
6.2.3 Diffusion sequence
Dual-phase cardiac STEAM was implemented using a reduced field-of-view technique
[235]. To avoid saturation in adjacent slices a tilted local-look pulse scheme was
incorporated (Figure 30) [236]. Residual signal from the edge of the field-of-view (black
triangles in Figure 30 c) was suppressed using regional saturation (rest) slabs. A
scheme to interleave slices (SL1 and SL2) and heart phases (SYS and DIA) was
implemented by applying the STEAM encoding block of slice 1 in systole (SL1 SYS) and
89
Dual-Phase Cardiac Diffusion Tensor Imaging With Strain Correction1F
slice 2 in diastole (SL2 DIA) of the first R-R interval. The corresponding STEAM decoding
block including the readout was applied in the second R-R interval, respectively. The
two paired slices had a gap of 25mm, thus avoiding cross talk from the angulated
excitation due to contraction of the heart. After acquiring all signal averages of all
diffusion encoding directions, the slice order was switched to complete the acquisition
of both heart phases for each slice. Thereby two slices were acquired in two heart
phases within a single scan, hence reducing scan time relative to sequential single-
phase, single-slice acquisition by a factor of two.
Figure 30. Dual-phase cardiac DTI acquisition scheme. The first slice is encoded in systole (STEAM 1 SL1 HP1) and the second slice in diastole (STEAM 1 SL2 HP2) with preceding fat saturation (fat sat) and regional saturation (rest) (a). Corresponding STEAM decoding and readout are performed in the second R-R interval (STEAM 2). For non-diffusion weighted imaging, FID crushers are applied in the through-plane direction (dotted area) (b) while only diffusion encoding gradients are applied otherwise (dark gray). (C) Non-coplanar excitation (tilt) is used to select two angulated slabs (red) with the first RF pulses. Slice selection within these slabs is performed with the second and third RF pulses (green). Regional saturation (blue) is used to eliminate signal from the edges (black). The final slices are represented in brown, and the measured slice distribution across the left ventricle is shown in (d). The coverage from apex to base was approximately 63mm.
The acquisition of diffusion-weighted images was divided into multiple navigator-gated
breath holds (acceptance window of 5mm). Parameters of the diffusion sequence
number of slices 6, TE/TR 18ms/2R-R intervals, partial Fourier factor 0.62. A single shot
EPI readout was used. The two heart phases in the diffusion protocol were triggered to
quiescent phases of systole and mid-diastole as defined on the cine images. Unipolar
diffusion gradients were played out in 10 directions on a unit-sphere [190] with a b-
90
value of 500s/mm2. To reduce echo time, FID crushers necessary in STEAM were
removed for b=500s/mm2 acquisitions, but kept for the b=0s/mm2 acquisition.
All eight signal averages of a diffusion weighted image were acquired within one
breath hold. Different diffusion weightings were obtained in consecutive breath holds.
The volunteers were allowed sufficient time to recover in-between breath holds to
ensure consistent heart rates among the data series. A total of 11 breath holds of 14-
16s duration each were acquired per slice and two heart phases, resulting in a 15-
18min total net acquisition time for six slices at two heart phases.
6.2.4 Tensor reconstruction
To compensate for residual slice mismatch due to inconsistency in breath hold levels
within the 5mm gating window and to account for eddy-current induced geometrical
distortions, all diffusion weighted images were registered to the b=0 image by means
of affine image registration (elastix toolbox [237]).
Systolic and diastolic diffusion tensors were estimated based on the modified Stejskal-
Tanner equations. To account for non-zero diffusion weighting of the “b=0s/mm2” scan
due to diffusion weighting introduced by the FID crusher gradients present in STEAM,
the signal equation was modified as:
†B S D=
(6.1)
with B being the modified b-matrix containing the b-values of the diffusion weighted
images b and the “b=0” image 0bSb
=:
0
2 2 21 1 1 1 1 1
2 2 2
2 2 2 1
2 2 2 10 0 0 0 0 1
b
diff diff diff diff diff diff
diffN diffN diffN diffN diffN diffN
S
bx by bz bxy bxz byz
Bbx by bz bxy bxz byz
b=
− = −
−
(6.2)
S
denotes the negative logarithm of the measured signal per pixel including the signal
of the “b=0” image 0bS = :
( )1 0lnT
diffN bS S S S = = −
(6.3)
91
Dual-Phase Cardiac Diffusion Tensor Imaging With Strain Correction1F
and D
the vector containing the unknown tensor elements and the true b=0 signal 0S :
( )2 2 2 0lnT
xy xz yzx y zD D D D D D D S =
(6.4)
where x, y and z are the coordinates of the normalized diffusion direction, T the
transpose and † the Moore-Penrose pseudo inverse.
6.2.5 Correction for material strain
Material strain effects were compensated for based on the stretch history of tissue
[17,18]. From 3D tagging data, three-dimensional displacement fields were calculated
with a custom-made software utilizing the 3D SinMod algorithm [100]. The LV was
manually masked on the tagging data as well as on the acquired b=0s/mm2 image. To
compensate for mismatch and different spatial resolution of the acquired data, the
shape of the DTI mask was mapped onto the re-sliced tagging mask by means of
coherent point drift registration [238]. Having identified the position of each diffusion
tensor estimated from the DTI acquisition within the displacement field, a cube parallel
to the canonical basis in which the displacement fields and the position of the tensors
are represented, was defined at each point and tracked over the R-R interval. The time
course of the right stretch tensor was calculated from the deformation gradient field
obtained from the tracked cubes as described by Hess et al. [11]. Stretch tensors were
calculated relative to the systolic and the diastolic time points of diffusion imaging. The
strain effect on the diffusion measurement is described by
( ) ( )1 1
0
1observed trueD U D U dτ τ τ
∆ − −=∆ ∫ (6.5)
with ( )U τ being the time course of the right stretch tensor and ∆ the duration of the
R-R interval. In accordance with [17] the equation is expanded as:
( ) ( )1 1
0
1observed trueij ik lj klD U U Dτ τ
∆ − − = ∆ ∫ (6.6)
92
For validation purposes, additional DTI data were acquired during the systolic “sweet-
spot” (trigger delay: 160ms) in one of the volunteers and compared to data in end
systole (trigger delay: 305ms) and diastole (trigger delay: 620ms).
6.2.6 Data analysis
From the six slices pairs of two were grouped for the basal, medial and apical level and
mean diffusivity (MD) and fractional anisotropy (FA) in systole and diastole were
compared for each volunteer. Additionally, helix, transverse and sheet angles were
calculated using projections of the first and third eigenvectors as described in Figure 31
(a-b) [195]. To allow tracking the transmural course of the helix angle, a local
anatomical basis was defined. To this end, the shape of the LV was mapped onto an
“ideal” circular ring by means of coherent point drift mapping [238]. This procedure
allowed the definition of a locally normalized transmural position independent of
variation of local thickness of the myocardium (Figure 31 c). The helix angle alignment
was analyzed on a slice-by-slice basis. Therefore the myocardium was separated into
five layers: epicardial, sub-epicardial, mid-wall, sub-endocardial and endocardial
similarly to previously reported helix angle analysis [221]. The transmural helix
gradient from the linear fit as well as the range of the transmural course of the helix
angle are reported for basal, medial and apical levels (Figure 31 d). Transverse and
sheet angle distributions are analyzed by means of histograms for each slice similar to
the analysis of Hales et al. [226]. The standard deviation of the transverse angle
distribution is reported as measure of coherence. Sheet angle distributions were fitted
with a quadratic function (Figure 31 e) and the coefficient of the quadratic component
is presented as a measure of sheet realignment during systolic contraction.
Additionally the mean of the absolute value of the sheet angle was calculated for
basal, medial and apical levels in systole and diastole.
The tensors shown in this study have not been interpolated as in previous works
[56,198]. Statistical differences between systolic and diastolic values were tested using
a two-tailed paired student’s t-test. A p-value < 0.05 was considered statistically
significant. All tests were Bonferroni-corrected for multiple testing.
93
Dual-Phase Cardiac Diffusion Tensor Imaging With Strain Correction1F
Figure 31. Definition of fiber and sheet angles. A local orthonormal basis is defined (a) (radial: r
,
circumferential: c
, longitudinal: z
). Helix (α), transverse (β) and sheet angle (γ) definitions are given
in (b). For angle calculation, projections of the first ( 1e
) and third ( 3e
) eigenvectors were used (grey
planes). The sign indicates the polarity of the angle. For each tensor position a normalized transmural position is defined (c). An example of the transmural course of helix angles is shown in (d) with the angle range (grey) and linear fit (green) indicated. Histograms of sheet angles (e) were fitted using a quadratic function (green line).
6.3 Results
Dual-phase cardiac DTI data was successfully acquired in all subjects. Total exam time
including subject preparation was 1.5-2 hours.
The raw data images acquired at the systolic sweet spot, in peak systole and in diastole
are presented in Figure 32. Data are shown for the “b=0”, the first three and the last
diffusion- encoding direction as well as the average of all diffusion directions. Tagging
data from the three orthogonally line-tagged stacks are given alongside. The
temporally averaged stretch tensors as calculated from the tagging data allow radial,
94
circumferential and longitudinal stretch components, which are presented as stretch
maps, to be assessed.
Figure 32. Raw data of diffusion weighted and tagging acquisitions as well as strain maps for the sweet spot, the systolic and the diastolic heart phase. The “b=0” image, the first three and the last diffusion encoding directions as well as the averaged diffusion weighted images are shown. Tagging data from the three orthogonally oriented line-tagged stacks are given alongside. The temporally averaged stretch tensors as calculated from the tagging data allow assessing radial, circumferential and longitudinal stretch components, which are presented as stretch maps.
Figure 33 a,b shows the time course of the radial, circumferential and longitudinal
stretch calculated from the right stretch tensors at the apical, medial and basal levels
for systole and diastole. The time points of acquisition of systolic and diastolic DTI data
as well as the systolic sweet spot are indicated by vertical lines in Figure 33 a,b. The
transmural course of the helix angles and transverse and sheet angle histograms in
systole (trigger delay: 305ms) and diastole (trigger delay: 620ms) (without and with
strain correction) are shown for the medial level in Figure 33 c,d. In addition, DTI data
acquired in the systolic sweet spot (trigger delay: 160ms) is overlaid. Strain correction
results in changes in the transverse and sheet angle distributions in systole. Values
obtained upon strain correction approach data acquired in the sweet spot. Differences
in diastole are found to be smaller with and without strain correction.
95
Dual-Phase Cardiac Diffusion Tensor Imaging With Strain Correction1F
Figure 33. Time course of the measured stretch tensor. The radial, circumferential and longitudinal components of the right stretch tensors are plotted as a function of time after the R-wave. The systolic (a) and diastolic (b) timing of the DTI sequence is indicated by the vertical solid line while the systolic sweet spot is marked by the vertical dashed line. The transmural course of the helix angles and the transverse and sheet angle histograms are presented for systole (c) and diastole (d) for a medial/basal level. Systolic and diastolic (black) as well as sweet-spot (gray) data are shown before (dotted line) and after (solid line) strain correction.
In Figure 34 systolic and diastolic tensor fields at a medial level with and without strain
correction are compared. The superquadric representation of the diffusion tensor
[212] was employed while glyphs were color-coded by the helix angle. It is observed
that systolic diffusion tensors have been rearranged into the natural helical alignment
after strain correction. In diastole, however, correction effects were subtler, mainly
illustrated by small changes in the main diffusivities.
MD and FA for both heart phases, with and without strain correction, are reported in
Table 3. After strain correction, the MD was increased in systole and decreased in
diastole, both with statistical significance. The FA was significantly increased upon
strain correction in systole, but remained unchanged in diastole.
96
Figure 34. Systolic and diastolic tensor maps with and without strain correction. Diffusion tensor fields acquired in systole (A,B) and diastole (C,D) are represented by superquadric glyphs and color-coded by the helix angle before and (A,C) after strain correction (B,D). The diffusion tensor fields before and after strain correction are merged (C,E) to visualize its impact. Insets demonstrate a major realignment of the tensor field into the typical helical pattern upon strain correction in systole (B). In diastole, strain correction effects are characterized mainly by small changes in the principal diffusivities (E). systole diastole
w/o correc-tion
with cor-rection
w/o correc-tion
with correc-tion
MD [10-4mm2/s]
base 8.6±1.2* 9.5±1.3 8.5±1.0* 8.2±1.0†
medial 8.8±1.4* 10.1±1.8 9.2±1.1* 8.7±1.1†
apex 9.6±0.8* 11.2±1.2 10.1±1.1* 9.4±0.9†
FA base 0.52±0.03* 0.61±0.02 0.61±0.05 0.61±0.04
medial 0.52±0.05* 0.60±0.03 0.61±0.04 0.61±0.04
apex 0.48±0.02* 0.55±0.02 0.57±0.03 0.57±0.03†
Table 3 MD, FA at basal, medial and apical level. * indicates statistical significance (p-value <0.05) between uncorrected and corrected data and † indicates statistical significance between systole and diastole.
Figure 35 displays helix angle maps and the dependency of helix angle on the
transmural depth for systole and diastole, with and without strain correction. Data are
given as mean ± one standard deviation across the study population. While in diastole
97
Dual-Phase Cardiac Diffusion Tensor Imaging With Strain Correction1F
only little change in helix angles is observed upon strain correction, helix angles at
basal level are significantly different with strain correction in systole. The mean
transmural helix angle range in diastole across the volunteers was reduced by 2.2±4.4°
at the basal level and increased by 2.2±6.1° at the medial level and 1.0±5.0° at the
apical level after strain correction. For systole, the transmural helix angle range was
decreased by 9.4±9.9° at the basal level, 1.6±5.3° at the medial level and 6.7±9.9° at
the apical level after strain correction. Differences in diastole were mostly not
statistically significant. In systole, statistically significant differences at the medial and
basal levels were found when comparing data without and with strain correction.
Figure 36 shows transverse angle maps and histograms of the study population.
Significant differences were observed before and after strain correction for both
systole and diastole, at each cardiac levels. Negative transverse angles were found at
the posterior RV-LV intersection. The distribution of the systolic transverse angle has a
lower variance after strain correction suggesting a more coherent fiber track. It is
noted that transverse angle distributions in systole and diastole show a similar
variance after strain correction.
Sheet angle maps and histograms are shown in Figure 37. The characteristic
distribution of sheet angle into two populations is well seen, particularly with strain
correction. Strain correction is observed to change systolic sheet distributions
markedly, in some cases producing almost inverted distributions of those obtained
without correction.
A comparison of helix, transverse and sheet angles for the systolic and diastolic heart
phase with and without strain-correction is provided in Table 4. Significant differences
in helix angle range between systole and diastole were seen in the medial and apical
levels while differences for transverse and sheet angles between systole and diastole
were found at the medial and basal levels of the heart. Sheet angle histograms are
broadened in systole compared to diastole.
98
Figure 35. Systolic and diastolic helix angles with and without strain correction. Helix angle maps in systole (left column) and diastole (right column) without and with strain correction (a). The transmural course of the helix angle is given at the basal, medial and apical levels (b). The error bars indicate one standard deviation across the study population. Statistically significant difference between the uncorrected (blue) and the corrected case (red) are indicated by * and between systole and diastole by †.
99
Dual-Phase Cardiac Diffusion Tensor Imaging With Strain Correction1F
Figure 36. Systolic and diastolic transverse angles with and without strain correction. Transverse angle maps in systole (left column) and diastole (right column) without and with strain correction (a). Transverse angle histograms are given at the basal, medial and apical levels (b). The error bars indicate one standard deviation across the study population. Statistically significant differences between the uncorrected (blue) and the corrected case (red) are indicated by * and between systole and diastole by †.
100
Figure 37. Systolic and diastolic sheet angles with and without strain correction. Sheet angle maps in systole (left column) and diastole (right column) without and with strain correction (a). Sheet angle histograms are given at the basal, medial and apical levels (b). The error bars indicate one standard deviation across the study population. Statistically significant differences between the uncorrected (blue) and the corrected cases (red) are indicated by * and between systole and diastole by †.significant difference between the uncorrected (blue) and the corrected case (red) are indicated by * and between systole and diastole by †.
101
Dual-Phase Cardiac Diffusion Tensor Imaging With Strain Correction1F
systole diastole
w/o correc-tion
with cor-rection
w/o cor-rection
with cor-rection
helix
ang
le
range base 72.8°±15.4°* 63.9°±11.5° 55.3°±9.3° 53.0°±9.6°
Table 4. angulation analysis. Helix transverse and sheet angle analysis at basal, medial and apical level is shown prior and after strain correction. * indicates statistical significance (p-value <0.05) between uncorrected and corrected data and † indicates statistical significance between systole and diastole.
102
6.4 Discussion
In this study, dual-heart phase cardiac DTI with strain correction was successfully
implemented and applied on 10 healthy volunteers to study differences in myofiber
architecture between systole and diastole.
The slice and phase interleaving scheme permitted a reduction in scan time by a factor
of two relative to a single-phase DTI protocol, which would need to be repeated in
systole and diastole. Given that angular diffusion resolution was encoded in separate
breath held scans with the current implementation, the number of breath holds
required per dual-slice set is dictated by the number of diffusion directions. While
breath hold durations were short (14-16sec), free-breathing acquisition is nevertheless
preferred to increase acceptance in practice. To this end, respiratory navigation in
conjunction with patient feedback could be incorporated into our approach [221], or
alternatively a modified respiratory navigation scheme to increase gating efficiency
without the need for patient feedback [229] may be applied.
Local-look excitation was used to reduce the field-of-view in phase-encode direction by
a factor of 2.5 to 3 depending on slice angulation and patient size. Alternatively,
undersampling strategies may be employed including parallel imaging [239-241] or
compressed sensing [151,242]. Further reduction of scan time could also be achieved
by combining the proposed method with simultaneous excitation of multiple slices and
subsequent unfolding using parallel imaging principles [243-245].
DTI of the heart with the stimulated echo approach has previously been performed at
sweet spots in the cardiac cycle, where the effects of strain are eliminated [206,218].
The exact locations of these sweet spots is a function of the heart rate of each
volunteer, but generally falls within mid-systole and mid-diastole. More recently, DTI
of the myocardium has been described at end-systole, where the heart reaches a
quiescent or stand-still phase [221,230,233]. With the present work, it has, however,
demonstrated that DTI of the myocardium at end-systole is significantly influenced by
strain. The effect of strain on helix angle measurements is small but its impact on
measures of sheet architecture, such as sheet angle, is extremely large. Our results
confirm those of Tseng and colleagues, who likewise showed that imaging away from
103
Dual-Phase Cardiac Diffusion Tensor Imaging With Strain Correction1F
the systolic/diastolic sweet spots produced small differences in helix angle but very
large differences in sheet angle [206,218].
The validity of strain correction was verified by comparing data acquired in systole and
diastole to data obtained in the systolic sweet spot, for which actual material strain
equals the average strain across the cardiac cycle. While no major difference was
found between the diastolic data obtained without strain correction, and the sweet
spot data, significant change was seen for systolic data upon strain correction.
In systole, longitudinal and circumferential diffusion components are underestimated
while radial diffusion components are overestimated without strain correction. This
effect leads to stretching of the diffusion tensor in radial direction and compression in
the two orthogonal directions. Consequently, after estimating the tensors’ eigenbasis,
the second and third eigenvectors are swapped leading to higher bin counts for the
sheet angle around 0°. The first eigenvector, which is predominantly aligned within the
circumferential and longitudinal plane, is rotated out of plane. Histograms of the
transverse angle demonstrate a wider spread prior to strain correction. Without strain
correction, the change in sheet angulation between systole and diastole is significantly
overestimated and fiber tracks appear less coherent. Here, the need for strain
correction in systole was clearly demonstrated.
The changes in fiber configuration between systole and diastole seen in this study
indicate a greater longitudinal alignment of myofibers during contraction. Similar
results have been described in excised rat hearts arrested in systole and diastole [61].
Likewise, histological and MR findings from excised porcine [53] and goat [209] heart
revealed that the helical fiber structure from epicardium at the apex crosses to
endocardium at a medial level and back to epicedium at the base, hypothesizing that
the presence of non-zero transverse angles are responsible for wall thickening during
contraction [53]. These findings are in agreement with the data reported here.
In the present work sheet angle histograms were generated for basal, medial and
apical levels similar to work by Hales et al. [226]. The in-vivo results presented here
show a significant change in sheet angle from systole to diastole. In the contracted
state, fewer counts of larger angulation were found, while the counts of intermediate
104
angles were increased. These results are in accordance with those of Dou et al. al
[218], who showed that sheet orientation becomes more radial in systole. Similar to
prior reports on isolated hearts [61,72,226], the changes in sheet angle histograms
were most pronounced at the basal level and less at the apical level.
A potential study limitation lies in the intrinsic coupling of the b-value of the STEAM
approach with the subject’s heart rate. While the standard deviation of heart rate
between acquisitions was only 2.6±1.1bpm, the heart rate during a breath hold
maneuver may have changed significantly. To minimize the impact of heart rate
variation on the tensor directionality, all averages of a single diffusion encoding
direction were acquired within a single breath hold.
Besides material strain, base SNR is of critical importance regarding systematic errors
in determining apparent diffusion. Magnitude averaging of the low SNR DWI data was
performed resulting in a Rician noise distribution of the averaged data. Accordingly,
signal attenuation by diffusion is biased by the SNR dependent noise floor [246]. Since
the SNR at the apex is considerably higher as compared to the base of the heart due to
its proximity to the receive coil array, the relative underestimation of apparent
diffusion measured in the apex is less compared to the value at the basal level.
6.5 Conclusion
An approach for dual-phase cardiac DTI with correction for myocardial strain has been
successfully implemented and has allowed changes in myofiber architecture between
systole and diastole to be studied in the human heart in-vivo. The results obtained with
strain correction are in agreement with experimental ex-vivo data and prior in-vivo
data in healthy volunteers. The potential of DTI to characterize myocardial anatomy in
the heart is high, but strain correction at phases other than the sweet spots will be
crucial for the accurate characterization of myocyte architecture.
105
Dual-Phase Cardiac Diffusion Tensor Imaging With Strain Correction1F
106
Chapter 7
Second Order Motion Compensated Spin-Echo Diffusion Tensor Imaging of the Human Heart3
7. Bayesian Multi-Point Velocity Encoded MRI to assess blood and CSF flow
7.1 Introduction
Ex-vivo diffusion tensor imaging (DTI) and diffusion spectrum imaging (DSI) have
provided invaluable insights into myocardial fibre architecture of the human heart
[222,247,248]. While a static view of cardiac myofiber arrangement is of interest, it
cannot address some of the crucial questions related to dynamic rearrangement of
myofiber aggregates during the cardiac cycle. Moreover, the study of longitudinal
microscopic changes of myocardium in a range of relevant cardiovascular diseases
necessitates in-vivo imaging of the human heart. Furthermore, personalized myofiber
architecture remains one of the main bottlenecks in the design of patient-specific
cardiac models for the systematic and quantitative diagnosis and prognosis of
cardiovascular patients [249,250].
Up to date only a limited number of studies have demonstrated the feasibility of
diffusion weighted imaging of the in-vivo human heart
[18,19,48,56,71,206,218,225,251-253]. The lack of data is due to the fact that in-vivo
cardiac DTI faces considerable challenges in relation to bulk motion and myocardial
strain during diffusion encoding.
Two sequence types have been investigated for in-vivo DTI. The STimulated Echo
Acquisition Mode (STEAM) was initially proposed for cardiac diffusion weighted
imaging (DWI) [228] and subsequently used to perform DTI during breath holds
[18,71,206,218] and during free breathing in combination with a dedicated visual
3 Manuscript under revision
107
Second Order Motion Compensated Spin-Echo Diffusion Tensor Imaging of the Human Heart2F
patient feedback system [254]. The advantage of STEAM based sequences is their
feasibility on standard clinical MR systems, without the need for high-performance
gradient hardware. The nature of STEAM imaging, however, requires echo encoding
across two consecutive heart beats while the position of the heart in two consecutive
heart beat is only allowed to vary within narrow limits [254]. As a consequence of this
fact and the required motion control, exam times are very long and considerable
patient cooperation is required. In addition, there is an intrinsic weighting of the
diffusion signal due to myocardial strain [17,18]. This issue may be addressed by
imaging in the so-called “sweet spots” [206] although these limit imaging to two
predefined cardiac phases which do not coincide with end-systole and end-diastole.
Alternatively, strain correction may be applied in post-processing based on the
knowledge of the time course of myocardial strain [17].
Diffusion weighted single-shot spin-echo (SE) imaging has been proposed as an
alternative to STEAM and has been demonstrated to provide diffusion tensor
information of the in-vivo human heart [19,20,48,56,252,253,255]. The acquisition
scheme permits free-breathing imaging without the need for dedicated patient
feedback systems. However, the non-rigid component of bulk motion leads to a direct
strain encoding during the application of the diffusion gradients and this needs to be
addressed. To minimize strain effects, spin-echo DWI and DTI have primarily been
applied in diastole [251,253,256].
An approach to overcome signal attenuation caused by changes in cardiac strain is to
design higher-order motion compensated diffusion gradient waveforms, which have
been proposed as part of SE schemes for diastolic DWI [256] or as part of T2 pre-pulses
in conjunction with balanced steady-state free precession sequences [257]. The latter
variant allowed separating diffusion contrast generation from imaging. However, such
a scheme may be very sensitive to residual phase due to RF pulse imperfections and
uncompensated cardiac motion components.
Finally, image post-processing methods may be employed to correct for strain-induced
signal attenuation of conventional twice-refocused diffusion weighted SE images. To
this end, diffusion weighted images are acquired at different trigger delays during the
108
diastolic rest period [251,253] and temporal filtering and projection is used to combine
image information from the set of temporally resolved images [258]. Potential
drawbacks of this approach, however, include the fact that the myocardium is thinnest
in diastole and hence partial voluming is increased. In addition, diffusion weighting is
limited to rather low b-values which reduces the diffusion related contrast and signal
attenuation due to perfusion may confound results.
Systolic cardiac DTI in humans has been proposed based on first order motion
compensated diffusion gradients incorporated into a SE sequence [19,56,259]. With
this approach, careful sequence timing is required when applied on clinical MR imaging
equipment [20]. Stronger gradient systems on animal imaging systems delivering up to
1.5T/m maximum gradient amplitudes allow for significantly reduced diffusion
gradient durations [225] and third order gradient moment nulling was investigated in
the in-vivo rat heart [260].
The objective of the present work is to propose and implement second order motion
compensated spin-echo diffusion tensor imaging of the human heart on a clinical
scanner. The reduced effect of strain on imaging fiber architecture of the in-vivo left
ventricle by second order motion compensated diffusion encoding is investigated and
compared to first order motion compensation.
7.2 Methods
7.2.1 Diffusion encoding
The signal phase accumulated during diffusion encoding is described by
( )( ) ( ) ( )0
encodingtr t G t r t dtϕ γ= ∫
with encodingt representing the duration of the diffusion
gradient, ( )G t
the gradient waveform and ( )r t
the spatial trajectory of magnetization.
Upon Taylor expansion of ( )r t
the phase can be written as:
20 0 00 0 0
( ) ( ) ( ) ....2γϕ γ γ= = == + + +∫ ∫ ∫
encodinγ encodinγ encodinγ
encodinγ
t t t
t t t tG t r dt G t r tdt G t r t dt (7.1)
with the associated nth order gradient moments nm :
109
Second Order Motion Compensated Spin-Echo Diffusion Tensor Imaging of the Human Heart2F
( )
( )
( )
( )
0 0
1 0
22 0
0
encoding
encoding
encoding
encoding
t
t
t
t nn
m G t dt
m tG t dt
m t G t dt
m t G t dt
=
=
=
=
∫∫∫
∫
From equation (7.1) it is evident that nulling of higher order moments results in phase
insensitivity to higher order motion (the derivatives of ( )r t
). To achieve higher order
gradient moment nulling whilst minimizing the overall gradient durations and echo
time for a given b-value, the maximum gradient amplitude is used. Figure 38 a)
illustrates a first order motion compensated (MC) gradient waveform [19,225] with
0 1 0m m= = at encodingt t= . In Figure 38 b), both first and second order motion
compensation is achieved and 0 1 2 0m m m= = = at encodingt t= .
110
Figure 38. First (a) and second (b) order motion compensated diffusion encoding using spin-echoes. Following a respiratory navigator (Nav), regional saturation (REST) is applied parallel to the imaging slice to saturate blood signal apically of the imaging slice. A spatial spectral pulse for fat suppression is used for reduced field of view imaging (LL). A variable rate selective excitation (VERSE) pulse is integrated for RF refocussing. The timing of gradients is given in ms. For each gradient waveform the 0th to 2nd moments (m0, m1, m2) are plotted as function of time.
111
Second Order Motion Compensated Spin-Echo Diffusion Tensor Imaging of the Human Heart2F
7.2.2 Study protocol
First and second order motion compensated diffusion tensor imaging were
implemented on a clinical 1.5T Philips Achieva System (Philips Healthcare, Best, The
Netherlands) equipped with a gradient system delivering 80mT/m per physical axis at a
a T1 of 1030ms [80]. The echo time was kept equal for both diffusion encoding
approaches. The only parameter changed was the waveform of the diffusion encoding
gradients.
Images were acquired during free breathing and gated using a respiratory navigator
with an acceptance window of 5mm. During contraction and during the first half of the
echo time blood below the imaging slice may move into the imaging plane and
experience the 180° refocussing pulse. Within the second half of the echo time, blood
within the imaging slices will move towards the aorta and exit the heart. To avoid
signal projection of the emptying blood pool onto the image, magnetization below the
imaging plane was saturated in a slab parallel to the imaging plane.
Diffusion weighted imaging was performed at trigger delay intervals of 10ms from the
shortest trigger delay possible (45ms) to peak systole (time point of maximal
circumferential contraction). At each trigger delay, eight signal averages of a
b=0s/mm2 image and three diffusion encoded images with the encoding direction in
112
the readout, phase-encoding and through-slice direction with a b-value of 450s/mm2
were acquired. Slices were positioned at basal and apical locations (Figure 2), where
rotational motion and through-plane contraction are largest.
DTI data with ten diffusion encoding directions [190] were acquired in an additional
session in five healthy volunteers (4 female, age: 25±2years, heart rate: 71±13
beats/min, min/max heart rate: 50/87 beats/min) including one volunteer on which
DWI was performed. The sequence parameters were: in plane resolution: 2.7×2.7mm2
reconstructed to 1.35×1.35mm2, slice thickness: 6mm, field of view (FOV):
230×98mm2, TR/TE: 3R-R/73ms, flip angle: 90° and 12 signal averages. To reduce total
scan time while allowing for a TR of 3R-R intervals a slice cycling scheme with non-
coplanar excitation according to [236,263] was used. Data was acquired at 38%, 47%,
56%, 66% and 75% of peak systole employing both first and second order motion
compensated gradient schemes. Imaging slices were positioned at apical level (20% of
long-axis length from the tip of the apex), mid-ventricular and basal level (20% of long-
axis length below the mitral valve).
7.2.3 Data analysis
The apparent diffusion coefficient (ADC) was calculated for each dataset for the
different trigger delays and diffusion directions acquired. The mean ADC and the
corresponding standard deviation across the myocardium were analyzed within each
slice. The trigger delay is reported as percentage values relative to peak systole (100%
corresponds to peak systole). To avoid partial voluming effects, epicardial and
endocardial voxels were not taken into account. The duration of the plateau of the
mean diffusivity (MD) as function of trigger delay was defined using a range between
the minimum MD and 2.14×10⁻⁴mm2/s above the minimum MD. The range was
derived based on the standard deviation of MD values across volunteers within 40%
and 60% peak systole for second order motion compensation at basal and apical level.
Upon calculation of the diffusion tensors, the local helix, transverse and sheet angles
were estimated [195,264]. To do so, the mask of the LV was warped onto an ideal ring
by means of coherent point drift registration [238]. Within the ring the canonical
cylindrical basis was defined and associated to every tensor coordinate inside the LV.
For the helix angle analysis the transmural depth was normalized along the radial
113
Second Order Motion Compensated Spin-Echo Diffusion Tensor Imaging of the Human Heart2F
coordinate. Upon identification of the cylindrical basis, the helix angle was defined as
the angle between the diffusion tensor’s first eigenvector projected onto the local
cylindrical surface and the imaging plane. The transverse angle was defined as angle
between the component of the first eigenvector within the imaging plane and the
circumferential direction. The third eigenvector was projected onto the radial-
longitudinal plane and the angle between the projection and the imaging plane was
defined as sheet angle. To avoid partial volume effects of bright blood signal in the
b=0s/mm2 images, the averaged image of all diffusion encoding directions was
calculated and scaled (corresponding to signal attenuation caused by an ADC of 10×10-
4mm2/s). This image was used as unweighted reference signal for myofiber angle
analysis. Helix angles were calculated for each heart phase and transmural variation is
reported in box-plots representing the helix angle distribution along the
circumferential dimension at different transmural depths. The transverse angle
histograms are reported including mean±standard deviation across the myocardium
averaged across volunteers. The first eigenvector of the resulting diffusion tensors is
visualized by whisker plots. To illustrate strain-induced deviation from the
circumferential structure, the vectors are color-coded according to the local transverse
angle. Sheet angles are visualized by rendering the plane spanned by first and second
eigenvectors.
7.3 Results
An example for first and second order motion compensated DWI acquired throughout
systole is shown in supporting Figure 39. Partial motion-induced signal voids are visible
prior to complete signal cancelation. While signal voids are readily apparent with first
order motion compensation, second order motion compensation yields a wider range
of trigger delays applicable.
114
Figure 39. Example time series of first and second order motion compensated (MC) diffusion weighted imaging throughout systole. Diffusion encoding was applied along in-plane (M,P) and through-plane (S) directions (white arrows). Earliest occurrences of motion induced signal voids are marked by white boxes.
115
Second Order Motion Compensated Spin-Echo Diffusion Tensor Imaging of the Human Heart2F
In Figure 40 ADC values based on encoding along the readout (M), phase encode (P)
and slice select (S) directions as well as mean ADC values as a function of the trigger
delay are shown. Second order motion compensated diffusion encoding yielded a
trigger delay range of 15-77% of peak systole for the apical and 15-79% for the basal
slices on average. In comparison, for first order motion compensation, the
corresponding trigger delay windows were 30-56% (apical) and 25-50% (basal).
The standard deviation of ADCs and mean ADCs across the myocardium were found to
be lower on a wider range for second order motion compensation, relative to first
order motion compensated diffusion encoding.
Figure 41 shows helix angle maps, line plots of the first eigenvector color-coded by the
corresponding transverse angle as well as sheet structure at mid-ventricular level for
38%, 47%, 56%, 66% and 75% peak systole. For first order motion compensated
diffusion encoding, the characteristic transmural variation of helix angles is absent and
patches of high angulation (dark blue/red) are found in the myocardium for trigger
delays of 66% and 75% peak systole. Patches of large deviation from the
circumferential direction for the first eigenvector (transverse angulation of ±90°) are
visible at trigger delays greater 66% peak systole. Second order motion compensation
results in better circumferential alignment of the principal diffusion direction.
Orientation of myocardial sheets is shown by local surfaces spanned by the first and
second eigenvector. The sheet structure is seen to be more consistent for adjacent
trigger delays with second order motion compensation.
Figure 42 shows the transmural helix angle box plots for basal, mid-ventricular and
apical slices pooled across all volunteers. Second order motion compensated diffusion
encoding shows a linear dependency of the helix angles as a function of transmural
depth for all trigger delays and reduced variation along the ventricular circumference.
First order motion compensated diffusion encoding matched results from second
order motion compensated acquisition best at mid-ventricular level for trigger delays
of early to mid-systole. The root mean squared difference of helix angles across
volunteers relative to the mean over all volunteers was 15.9°/5.1° (38%), 12.3°/5.0°
(47%), 18.0°/4.3° (56%), 15.0°/2.8° (66%) and 15.8°/5.2° (75%) at the base, 7.0°/4.8°
116
(38%), 8.6°/5.4° (47%), 10.1°/4.2° (56%), 5.2°/5.2° (66%) and 6.5°/5.9° (75%) at the
mid-ventricular level and 10.1°/8.2° (38%), 11.8°/5.5° (47%), 9.8°/6.3° (56%), 15.1°/4.9°
(66%) and 11.4°/3.8° (75%) at the apex for first and second order motion
compensation. The corresponding trigger delays are given in brackets.
Figure 40 Apparent Diffusion Coefficients (ADC) for in-plane (ADC M/P) and through-plane (ADC S) encoding and mean ADC for first and second order motion compensated (MC) diffusion encoding as a function of trigger delay (in % peak systole) for an apical and basal slice location. The accepted range is indicated in green and is spanned by the horizontal dotted lines (range between minimal ADC and 2.14×10⁻⁴mm2/s above). Average ADC values across the myocardium within each slice are shown (in black) along with the corresponding standard deviation (in grey). Solid lines correspond to the mean across the volunteers and dashed lines to the standard deviation across volunteers.
117
Second Order Motion Compensated Spin-Echo Diffusion Tensor Imaging of the Human Heart2F
Figure 41. Helix angle maps from a mid-ventricular slice are shown for first and second order motion compensated (MC) diffusion encoding (top rows). Corresponding line plots of the first eigenvector color-coded by the transverse angle are presented (middle row). Local sheet structure is shown by 2D planes spanned by the first and second eigenvector color-coded by the sheet angle. The view corresponds to the anterior side similar to the insets in the whisker plot for transverse angle presentation. Maps are superimposed to the corresponding mean diffusion image.
Figure 43 shows the transverse angle histograms for both motion compensation
schemes averaged across volunteers. Using second order motion compensated
gradients, the standard deviation of the transverse angle is on average 51% smaller
when compared to data obtained with first order motion compensation. A transition
from negative to positive transverse angles is found when going from apex to base.
118
Figure 42. The transmural helix angle analysis is presented for first order motion compensated (blue) and second order motion compensated (red) gradient waveforms. The box in the box-plot corresponds to the 50% percentile and the error bars to the 90% percentile of the helix angle distribution along the circumferential dimension as a function of transmural depth. Values presented correspond to the mean across volunteers.
Figure 43. Histograms of transverse angle are presented for first (light grey) and second (dark grey) order motion compensated diffusion encoding (MC). Plotted values correspond to the mean across volunteers and the error bars to the corresponding standard deviation. Values presented within the plots correspond to the mean ± one standard deviation of the plotted histograms.
119
Second Order Motion Compensated Spin-Echo Diffusion Tensor Imaging of the Human Heart2F
7.4 Discussion
In the present study, second order motion compensated cardiac diffusion imaging has
been implemented on a clinical MR system and compared to first order motion
compensation.
While MD values across the myocardium were found to be relatively constant over a
wide range of trigger delays for second order motion compensated diffusion encoding,
first order motion compensated diffusion encoding resulted in a strong dependency on
the trigger delay in accordance to previous findings [20]. Second order motion
compensated diffusion encoding not only yielded reduced variation of MD values
within the myocardium, it also reduced the standard deviation of MD values across
volunteers.
For first order motion compensated diffusion encoding, the optimal trigger delay for
DTI was found in a narrow range between 30% and 50% of peak systole, similar to
previous reports [19,20]. Tensor reconstruction suggests that the window of feasible
trigger delays is narrow. At ±30ms offset from the optimal trigger delay time, tensor
alignment deviated locally from the expected circumferential arrangement and the
characteristic transmural course of helix angles is lost in parts of the myocardium.
In this study the helix angle was calculated upon projection of the first eigenvector
onto a cylindrical surface [195]. Hence large deviations from a circumferential course
result in an overestimation of the helix angle. At the basal and mid-ventricular level,
considerable cardiac contraction in through plane direction occurs leading to a loss of
the characteristic transmural variation of helix angles for early and late systole for first
order motion compensation. The loss of transmural variation of the helix angle is also
reflected in a wider angle distribution along the circumference.
For second order motion compensated diffusion encoding, a 2.5 fold wider window of
trigger delays was found. A coherent circumferential course of myofibers with a linear
transmural course of helix angles was detected with a smaller spread in angle
distribution along the circumference. The results agree with previously reported fiber
angulations in the ex-vivo human heart [49]. The variation of transverse angles
120
between apex and base agrees with previously reported STEAM based in-vivo imaging
[264] and ex-vivo studies [53,209].
In this study, the echo time was kept the same for both diffusion encoding gradient
waveforms to ensure similar T2 weighting. For first order motion compensated
encoding the echo time may, however, be reduced by 4ms.
In the second order compensation scheme used in this study, the duration of the gap
between the pairs of gradient lobes is dependent on the b-value. There is a minimum
value for this gap as it must be wide enough to accommodate the refocussing pulse.
Note that in the 2nd order compensated scheme, because the gradient’s zeroth
moment is non-zero at this time, the FID crushers around the refocussing pulse are not
required.
In this study a clinically available high performance gradient system was employed
enabling gradient durations of 43ms/50ms for first/second order motion compensated
gradient schemes. For clinical systems with lower maximum gradient strengths such as
60mT/m or 40mT/m the total gradient durations increase to 51ms/60ms and
64ms/78ms. Prolonged gradient duration increases the sensitivity to motion, since
bulk motion is more likely to deviate from its first and second order Taylor
approximation.
Diffusion weighted imaging generally suffers from low SNR. In this study a 1.5T clinical
system was used. Increasing the main magnetic field strength leads to an increase in
SNR at the cost of larger susceptibility effects in particular in the proximity of the
posterior vein [265]. To reduce susceptibility induced image distortions, the readout
duration may be shortened using parallel imaging at the cost of SNR.
In this study a rather coarse spatial resolution was used to maintain SNR while keeping
the duration of the scan session within applicable limits. Other studies have reported a
spatial resolution of 2×2×5mm3 [56,252] which further reduces sensitivity to bulk
motion for both first [19] as well as second order motion compensation.
121
Second Order Motion Compensated Spin-Echo Diffusion Tensor Imaging of the Human Heart2F
7.5 Conclusion
In this study second order motion compensated spin-echo diffusion encoding was
implemented and compared to first order motion compensated diffusion gradient
waveforms for systolic cardiac diffusion tensor imaging. A significantly decreased
sensitivity to bulk motion compared to first order motion compensated diffusion
gradients was found, enabling cardiac DTI from base to apex at various time points
during systolic contraction.
122
Chapter 8 Discussion & Outlook
8. Summary
In this thesis, MR imaging methods have been developed, implemented and validated
which allow measuring cardiac deformation and microstructure in the beating heart.
With the new set of tools quantitative parameters such as cardiac strain and torsion as
well as helix, transverse and sheet angulation of myofiber aggregates of human hearts
have been analyzed non-invasively. The advances in the field of cardiovascular
magnetic resonance imaging presented herein are important for bench-to-bedside
translation of novel imaging approaches potentially leading to robust diagnostic tools
to monitor and guide therapy in cardiac medicine.
8.1 Discussion
In the first part of this thesis spatial-temporal undersampling of 3D myocardial tagging
was developed. Upon scan acceleration only a single breath hold was necessary to
acquire data for 3D myocardial strain analysis. Besides shortening of total scan
duration, the single breath hold acquisitions led to a reduced misalignment of image
stacks, which is of importance for data analysis. While healthy volunteers and patients
in this study tolerated the long breath hold duration, patients with shortness of breath
may have difficulties. By decomposing data acquisition into high resolution
undersampled data and low resolution training data, the benefit of better stack
alignment remains if the training data is acquired in a second breath hold. As a result
of the low spatial resolution of the training data, differences in consecutive breath
hold levels may no longer pose concerns. Alternatively, training data can be acquired
simultaneously as part of a variable density echo planar imaging (EPI) readout at the
cost of reduced temporal resolution. Besides the regular sheared grid sampling
patterns and linear reconstruction used herein, random undersampling in conjunction
123
Discussion & Outlook
with non-linear compressed sensing reconstruction may be employed. These methods
rely on the sparsity of the image content itself or an appropriate transformation
thereof. It is foreseeable that the combination of parallel imaging and cosine
transformation of tagged data may outperform linear reconstruction methods. Along
this line, future work should investigate localized spatial transforms using a harmonic
basis in conjunction with partially separable functions to further compress cine tagging
data.
Crucial to the analysis of cardiac motion remains the use of advanced post-processing
methods. In the studies herein either harmonic phase analysis (HARP) or an analysis
based on local sine wave modeling (SINMOD) was used. While HARP allows tracking
cardiac motion with respect to a reference heart phase, it requires a band pass filter in
k-space, which reduces spatial resolution. In contrast, SINMOD works on the
magnitude images and can benefit from the full spatial resolution. However, it results
in relative displacement fields from one heart phase to the next leading to noise
related error integration of motion tracking. Ultimately a combination of both
methods appears promising as it allows using HARP phase data to derive a first
approximation of deformations to subsequently guide SINMOD processing of
unfiltered magnitude data for refinement of the tracking position.
In order to avoid the need for sophisticated post-processing algorithms, tissue
displacements may be encoded directly into the signal phase. Methods such as
displacement encoding with stimulated echoes (DENSE) may be used for this purpose.
Being a phase based method, however, care has to be taken to correct for B0
inhomogeneities. Furthermore, to increase spatial resolution without increasing the
displacement encoding strength, methods to suppress DC- and higher order harmonic
peaks in k-space are required.
The second part of the thesis concerned microstructural imaging of the myocardium.
reconstructions have required sophisticated data interpolation and extrapolation
methods with some assumptions [56,252]. Further advances should be dedicated to
developing three-dimensional (3D) data acquisitions schemes. Such multi-shot imaging
approaches do, however, need to address motion-induced phase inconsistencies to
avoid severe image artifacts. Higher-order motion compensated gradients as
presented herein inherently reduce the motion-induced phase. Accordingly and in
conjunction with low-resolution phase navigators 3D cardiac diffusion weighted
imaging may indeed be attempted in the future.
125
Discussion & Outlook
From a hardware development perspective, dedicated gradient inserts have been
proposed delivering a maximum strength of 300mT/m at a slew rate of 200mT/m/ms
[269]. With such gradient systems, echo times can be reduced significantly leading to a
gain in signal-to-noise ratio. High performance gradient systems open the path for
single-sided diffusion encoding schemes [255] allowing for high spatial resolution DTI
in-vivo. With the use of very strong field gradients, however, spin dephasing due to
concomitant fields and image distortions due to eddy currents need to be addressed.
8.2 Outlook
Based on microstructural imaging of the myocardium, digital organ modeling is
envisioned, providing a unique opportunity to simulate treatment response prior to
intervention. The response of the heart to ablation, for example, can be simulated
based on digital models that rely on the individual patient’s cardiac anatomy and
microstructure. In a future setting, virtual ablations may be performed to guide
interventions by predicting the resulting changes of signal conduction within the
myocardium. Furthermore, modeling of electro-mechanical coupling may allow
extrapolating changes in mechanical efficiency of the heart upon intervention. The
study of effects of myocardial scaring due to infarction or interventions to manipulate
myocardial strain distribution is a possible scenario, which may help avoiding
undesired strain hot spots potentially leading to remodeling and failure of the heart.
From a clinical perspective, myocardial tagging as well as cardiac DTI are considered
essential tools to help furthering our understanding of cardiac pathophysiology. To this
end, it is of interest to investigate the link between function and form of the in-vivo
heart. Examples are dilated cardiomyopathy, which is associated with altered rotation
and radial contraction patterns or non-compaction and cardiac hypertrophy which
result from altered myocardial structure.
In the context of heart failure diagnosis, it is appealing to define a mechanical
efficiency index linking cardiac function to myocardial structure for individual patients.
In the pathological setting, atypical contraction pattern relate to microstructural
abnormalities. Based on in-vivo imaging the risk of progressive alteration in
126
contraction pattern may be predicted and intervention prior to the onset of symptoms
may be facilitated. Resulting myocardial remodeling and changes of cardiac motion can
be monitored non-invasively at regular intervals.
In regenerative medicine, stem cells are studied for post-infarction treatment. The
efficacy of treatment depends on cell origin, organization and cell delivery. While
histology is the gold standard to measure tissue alteration upon therapy post-mortem,
ejection fraction has been used as a measure of treatment success in-vivo. With
myocardial tagging, myocardial strain and torsion can be added to the array of
diagnostic readouts. Importantly, cardiac DTI now allows to perform “virtual histology”
and therefore myocardial microstructure can be quantified longitudinally in-vivo.
127
Discussion & Outlook
128
Abbreviations
Abbreviations in alphabetic order
ADC Apparent Diffusion Coefficient
bpm beats per minute
CAD Coronary Artery Disease
CANSEL Cosine ANd Sine acquisitions to ELiminate artifacts generating echoes
CDENSE Complementary Displacement Encoding with Stimulated Echoes
CMR Cardiovascular Magnetic Resonance
CNR Contrast to Noise Ratio
CRT Cardiac Resynchronization Therapy
CS Compressed Sensing
CSPAMM Complementary SPatial Modulation of Magnetization
DANTE Delays Alternating with Nutations for Tailored Excitation
DENSE Displacement Encoding with Stimulated Echoes
DIA DIAstole
DSI Diffusion Spectrum Imaging
DTI Diffusion Tensor Imaging
DWI Diffusion Weighted Imaging
ECG ElectroCardioGram
EF Ejection Fraction
FA Fractional Anisotropy
FAST Fourier Analysis of STimulated echoes
FID Free Induction Decay
FOV Field Of View
HARP HARmonic Phase
HF Heart Failure
129
Abbreviations
HR Heart Rate
IVIM Intra Voxel Incoherent Motion
LBBB Left Bundle Branch Block
LGE Late Gadolinium Enhancement
LV Left Ventricle
M Measurement/Frequency encoding direction
MD Mean Diffusivity
MI Myocardial Infarction
MRI Magnetic Resonance Imaging
MRT Magnet Resonanz Tomographie
N.S. Not Significant
ODF Orientation Distribution Function
P Phase encoding direction
PCA Principal Component Analysis
PDF Probability Density Function
QSI Q-Space Imaging
RF Radio Frequency
S Slice encoding direction
SD Standard Deviation
SE Spin Echo
SEE Standard Error of the Estimate
SENC Strain ENCoding
SINMOD SINe wave MODeling
SNR Signal to Noise Ratio
SPAMM SPatial Modulation of Magnetization
SPECT Single Photon Emission Computed Tomography
STEAM STimulated Echo Acquisition Mode
SYS SYStole
TE echo time
TM mixing time
TMIP Temporal Maximum Intensity Projection
TR repetition time
130
Bibliography
Bibliography
1. Go AS, Mozaffarian D, Roger VL, Benjamin EJ, Berry JD, et al. (2013) Heart disease and stroke statistics--2013 update: a report from the American Heart Association. Circulation 127: e6-e245.
2. McMurray JJ, Adamopoulos S, Anker SD, Auricchio A, B├Âhm M, et al. (2012) ESC Guidelines for the diagnosis and treatment of acute and chronic heart failure 2012 The Task Force for the Diagnosis and Treatment of Acute and Chronic Heart Failure 2012 of the European Society of Cardiology. Developed in collaboration with the Heart Failure Association (HFA) of the ESC. European heart journal 33: 1787-1847.
3. Dickstein K, Cohen-Solal A, Filippatos G, McMurray JJ, Ponikowski P, et al. (2008) ESC guidelines for the diagnosis and treatment of acute and chronic heart failure 2008: the Task Force for the diagnosis and treatment of acute and chronic heart failure 2008 of the European Society of Cardiology. Developed in collaboration with the Heart Failure Association of the ESC (HFA) and endorsed by the European Society of Intensive Care Medicine (ESICM). Eur J Heart Fail 10: 933-989.
4. Arai AE (2011) Magnetic resonance imaging for area at risk, myocardial infarction, and myocardial salvage. J Cardiovasc Pharmacol Ther 16: 313-320.
5. Botker HE, Kaltoft AK, Pedersen SF, Kim WY (2012) Measuring myocardial salvage. Cardiovasc Res 94: 266-275.
6. Schwitter J, Wacker CM, Wilke N, Al-Saadi N, Sauer E, et al. (2013) MR-IMPACT II: Magnetic Resonance Imaging for Myocardial Perfusion Assessment in Coronary artery disease Trial: perfusion-cardiac magnetic resonance vs. single-photon emission computed tomography for the detection of coronary artery disease: a comparative multicentre, multivendor trial. Eur Heart J 34: 775-781.
7. Greenwood JP, Maredia N, Younger JF, Brown JM, Nixon J, et al. (2012) Cardiovascular magnetic resonance and single-photon emission computed tomography for diagnosis of coronary heart disease (CE-MARC): a prospective trial. Lancet 379: 453-460.
8. Utz JA, Herfkens RJ, Heinsimer JA, Bashore T, Califf R, et al. (1987) Cine MR determination of left ventricular ejection fraction. AJR Am J Roentgenol 148: 839-843.
131
Bibliography
9. Rutz AK, Ryf S, Plein S, Boesiger P, Kozerke S (2008) Accelerated whole-heart 3D
CSPAMM for myocardial motion quantification. Magn Reson Med 59: 755-763.
10. Zhong X, Spottiswoode B, Meyer C, Kramer C, Epstein F (2009) Navigator-gated 3D cine DENSE: development and initial evaluation. Journal of Cardiovascular Magnetic Resonance 11: O94.
11. Hess AT, Zhong X, Spottiswoode BS, Epstein FH, Meintjes EM (2009) Myocardial 3D strain calculation by combining cine displacement encoding with stimulated echoes (DENSE) and cine strain encoding (SENC) imaging. Magn Reson Med 62: 77-84.
12. Pedersen H, Kozerke S, Ringgaard S, Nehrke K, Kim WY (2009) k-t PCA: temporally constrained k-t BLAST reconstruction using principal component analysis. Magn Reson Med 62: 706-716.
13. Tsao J, Boesiger P, Pruessmann KP (2003) k-t BLAST and k-t SENSE: dynamic MRI with high frame rate exploiting spatiotemporal correlations. Magn Reson Med 50: 1031-1042.
14. Leergaard TB, White NS, de Crespigny A, Bolstad I, D'Arceuil H, et al. (2010) Quantitative histological validation of diffusion MRI fiber orientation distributions in the rat brain. PLoS One 5: e8595.
15. Holmes AA, Scollan DF, Winslow RL (2000) Direct histological validation of diffusion tensor MRI in formaldehyde-fixed myocardium. Magn Reson Med 44: 157-161.
16. Merboldt K-D, Hanicke W, Frahm J (1985) Self-diffusion NMR imaging using stimulated echoes. Journal of Magnetic Resonance (1969) 64: 479-486.
17. Reese TG, Wedeen VJ, Weisskoff RM (1996) Measuring diffusion in the presence of material strain. Journal of Magnetic Resonance, Series B 112: 253-258.
18. Reese TG, Weisskoff RM, Smith RN, Rosen BR, Dinsmore RE, et al. (1995) Imaging myocardial fiber architecture in vivo with magnetic resonance. Magnetic Resonance in Medicine 34: 786-791.
19. Gamper U, Boesiger P, Kozerke S (2007) Diffusion imaging of the in vivo heart using spin echoes-considerations on bulk motion sensitivity. Magn Reson Med 57: 331-337.
20. Stoeck CT, Toussaint N, Boesiger P, Batchelor PG, Kozerke S. Sequence timing optimization in multi-slice diffusion tensor imaging of the beating heart 2011;19th Annual Meeting of ISMRM, Montréal, Canada. pp. 282.
21. Tavakoli V, Sahba N (2014) Assessment of subendocardial vs. subepicardial left ventricular twist using tagged MRI images. Cardiovasc Diagn Ther 4: 56-63.
22. Phillips AA, Cote AT, Bredin SS, Warburton DE (2012) Heart disease and left ventricular rotation - a systematic review and quantitative summary. BMC Cardiovasc Disord 12: 46.
23. Stuber M, Scheidegger MB, Fischer SE, Nagel E, Steinemann F, et al. (1999) Alterations in the local myocardial motion pattern in patients suffering from pressure overload due to aortic stenosis. Circulation 100: 361-368.
132
24. Nagel E, Stuber M, Burkhard B, Fischer SE, Scheidegger MB, et al. (2000) Cardiac rotation and relaxation in patients with aortic valve stenosis. Eur Heart J 21: 582-589.
25. Kirilmaz B, Asgun F, Saygi S, Ercan E (2013) Decreased left ventricular torsion in patients with isolated mitral stenosis. Herz.
26. Nagel E, Stuber M, Lakatos M, Scheidegger MB, Boesiger P, et al. (2000) Cardiac rotation and relaxation after anterolateral myocardial infarction. Coron Artery Dis 11: 261-267.
27. Rutz AK, Juli CF, Ryf S, Widmer U, Kozerke S, et al. (2007) Altered myocardial motion pattern in Fabry patients assessed with CMR-tagging. J Cardiovasc Magn Reson 9: 891-898.
28. Sade LE, Demir O, Atar I, Muderrisoglu H, Ozin B (2008) Effect of mechanical dyssynchrony and cardiac resynchronization therapy on left ventricular rotational mechanics. Am J Cardiol 101: 1163-1169.
29. van Dalen BM, Caliskan K, Soliman OI, Nemes A, Vletter WB, et al. (2008) Left ventricular solid body rotation in non-compaction cardiomyopathy: a potential new objective and quantitative functional diagnostic criterion? Eur J Heart Fail 10: 1088-1093.
30. Deng Y, Pandit A, Heilman RL, Chakkera HA, Mazur MJ, et al. (2013) Left ventricular torsion changes post kidney transplantation. J Cardiovasc Ultrasound 21: 171-176.
31. Jeung MY, Germain P, Croisille P, El ghannudi S, Roy C, et al. (2012) Myocardial tagging with MR imaging: overview of normal and pathologic findings. Radiographics 32: 1381-1398.
32. Kuijer JP, Marcus JT, Gotte MJ, van Rossum AC, Heethaar RM (2002) Three-dimensional myocardial strains at end-systole and during diastole in the left ventricle of normal humans. J Cardiovasc Magn Reson 4: 341-351.
33. Moore CC, Lugo-Olivieri CH, McVeigh ER, Zerhouni EA (2000) Three-dimensional systolic strain patterns in the normal human left ventricle: characterization with tagged MR imaging. Radiology 214: 453-466.
34. Yuan LJ, Takenaka K, Uno K, Ebihara A, Sasaki K, et al. (2014) Normal and shear strains of the left ventricle in healthy human subjects measured by two-dimensional speckle tracking echocardiography. Cardiovasc Ultrasound 12: 7.
35. Stoeck CT, Manka R, Boesiger P, Kozerke S (2012) Undersampled cine 3D tagging for rapid assessment of cardiac motion. J Cardiovasc Magn Reson 14: 60.
36. Lima JA, Ferrari VA, Reichek N, Kramer CM, Palmon L, et al. (1995) Segmental motion and deformation of transmurally infarcted myocardium in acute postinfarct period. Am J Physiol 268: H1304-1312.
37. Kramer CM, Lima JA, Reichek N, Ferrari VA, Llaneras MR, et al. (1993) Regional differences in function within noninfarcted myocardium during left ventricular remodeling. Circulation 88: 1279-1288.
133
Bibliography
38. McKay RG, Pfeffer MA, Pasternak RC, Markis JE, Come PC, et al. (1986) Left
ventricular remodeling after myocardial infarction: a corollary to infarct expansion. Circulation 74: 693-702.
39. Kar J, Knutsen AK, Cupps BP, Zhong X, Pasque MK (2014) Three-dimensional regional strain computation method with displacement encoding with stimulated echoes (DENSE) in non-ischemic, non-valvular dilated cardiomyopathy patients and healthy subjects validated by tagged MRI. J Magn Reson Imaging.
40. Young AA, Dokos S, Powell KA, Sturm B, McCulloch AD, et al. (2001) Regional heterogeneity of function in nonischemic dilated cardiomyopathy. Cardiovasc Res 49: 308-318.
41. Ennis DB, Epstein FH, Kellman P, Fananapazir L, McVeigh ER, et al. (2003) Assessment of regional systolic and diastolic dysfunction in familial hypertrophic cardiomyopathy using MR tagging. Magn Reson Med 50: 638-642.
42. Littmann L, Symanski JD (2000) Hemodynamic implications of left bundle branch block. J Electrocardiol 33 Suppl: 115-121.
43. Askenazi J, Alexander JH, Koenigsberg DI, Belic N, Lesch M (1984) Alteration of left ventricular performance by left bundle branch block simulated with atrioventricular sequential pacing. Am J Cardiol 53: 99-104.
44. Grant RP (1965) NOTES ON THE MUSCULAR ARCHITECTURE OF THE LEFT VENTRICLE. Circulation 32: 301-308.
45. Gilbert SH, Benson AP, Li P, Holden AV (2007) Regional localisation of left ventricular sheet structure: integration with current models of cardiac fibre, sheet and band structure. Eur J Cardiothorac Surg 32: 231-249.
46. Greenbaum RA, Ho SY, Gibson DG, Becker AE, Anderson RH (1981) Left ventricular fibre architecture in man. Br Heart J 45: 248-263.
47. Streeter DD, Jr., Spotnitz HM, Patel DP, Ross J, Jr., Sonnenblick EH (1969) Fiber orientation in the canine left ventricle during diastole and systole. Circ Res 24: 339-347.
48. Froeling M, Strijkers GJ, Nederveen AJ, Chamuleau SA, Luijten PR (2014) Diffusion Tensor MRI of the Heart–In Vivo Imaging of Myocardial Fiber Architecture. Current Cardiovascular Imaging Reports 7: 1-11.
49. Lombaert H, Peyrat J-M, Croisille P, Rapacchi S, Fanton L, et al. (2011) Statistical analysis of the human cardiac fiber architecture from DT-MRI. Functional Imaging and Modeling of the Heart: Springer. pp. 171-179.
50. Tezuka F (1975) Muscle fiber orientation in normal and hypertrophied hearts. Tohoku J Exp Med 117: 289-297.
51. Gerdes AM, Moore JA, Hines JM, Kirkland PA, Bishop SP (1986) Regional differences in myocyte size in normal rat heart. Anat Rec 215: 420-426.
134
52. Spotnitz HM, Spotnitz WD, Cottrell TS, Spiro D, Sonnenblick EH (1974) Cellular basis for volume related wall thickness changes in the rat left ventricle. J Mol Cell Cardiol 6: 317-331.
53. Smerup M, Agger P, Nielsen EA, Ringgaard S, Pedersen M, et al. (2013) Regional and epi- to endocardial differences in transmural angles of left ventricular cardiomyocytes measured in ex vivo pig hearts: functional implications. Anat Rec (Hoboken) 296: 1724-1734.
54. Helm P, Beg MF, Miller MI, Winslow RL (2005) Measuring and mapping cardiac fiber and laminar architecture using diffusion tensor MR imaging. Ann N Y Acad Sci 1047: 296-307.
55. Lunkenheimer PP, Niederer P (2012) Hierarchy and inhomogeneity in the systematic structure of the mammalian myocardium: towards a comprehensive view of cardiodynamics. Technol Health Care 20: 423-434.
56. Toussaint N, Sermesant M, Stoeck CT, Kozerke S, Batchelor PG (2010) In vivo human 3D cardiac fibre architecture: reconstruction using curvilinear interpolation of diffusion tensor images. Med Image Comput Comput Assist Interv 13: 418-425.
57. Caulfield J, Borg T (1979) The collagen network of the heart. Laboratory investigation; a journal of technical methods and pathology 40: 364-372.
58. Young AA, Legrice IJ, Young MA, Smaill BH (1998) Extended confocal microscopy of myocardial laminae and collagen network. J Microsc 192: 139-150.
59. Pope AJ, Sands GB, Smaill BH, LeGrice IJ (2008) Three-dimensional transmural organization of perimysial collagen in the heart. Am J Physiol Heart Circ Physiol 295: H1243-H1252.
60. LeGrice IJ, Smaill BH, Chai LZ, Edgar SG, Gavin JB, et al. (1995) Laminar structure of the heart: ventricular myocyte arrangement and connective tissue architecture in the dog. Am J Physiol 269: H571-582.
61. Chen J, Liu W, Zhang H, Lacy L, Yang X, et al. (2005) Regional ventricular wall thickening reflects changes in cardiac fiber and sheet structure during contraction: quantification with diffusion tensor MRI. Am J Physiol Heart Circ Physiol 289: H1898-1907.
62. Kung GL, Nguyen TC, Itoh A, Skare S, Ingels NB, Jr., et al. (2011) The presence of two local myocardial sheet populations confirmed by diffusion tensor MRI and histological validation. J Magn Reson Imaging 34: 1080-1091.
63. Harrington KB, Rodriguez F, Cheng A, Langer F, Ashikaga H, et al. (2005) Direct measurement of transmural laminar architecture in the anterolateral wall of the ovine left ventricle: new implications for wall thickening mechanics. Am J Physiol Heart Circ Physiol 288: H1324-1330.
64. Helm PA, Tseng HJ, Younes L, McVeigh ER, Winslow RL (2005) Ex vivo 3D diffusion tensor imaging and quantification of cardiac laminar structure. Magn Reson Med 54: 850-859.
135
Bibliography
65. Sands GB, Gerneke DA, Hooks DA, Green CR, Smaill BH, et al. (2005) Automated
imaging of extended tissue volumes using confocal microscopy. Microsc Res Tech 67: 227-239.
66. Dorri F, Niederer PF, Lunkenheimer PP, Anderson RH (2010) The architecture of the left ventricular myocytes relative to left ventricular systolic function. Eur J Cardiothorac Surg 37: 384-392.
67. Tobita K, Garrison JB, Liu LJ, Tinney JP, Keller BB (2005) Three-dimensional myofiber architecture of the embryonic left ventricle during normal development and altered mechanical loads. Anat Rec A Discov Mol Cell Evol Biol 283: 193-201.
68. Sonnenblick EH, Ross J, Jr., Covell JW, Spotnitz HM, Spiro D (1967) The ultrastructure of the heart in systole and diastole. Chantes in sarcomere length. Circ Res 21: 423-431.
69. LeGrice IJ, Takayama Y, Covell JW (1995) Transverse shear along myocardial cleavage planes provides a mechanism for normal systolic wall thickening. Circ Res 77: 182-193.
70. Costa KD, Takayama Y, McCulloch AD, Covell JW (1999) Laminar fiber architecture and three-dimensional systolic mechanics in canine ventricular myocardium. Am J Physiol 276: H595-607.
71. Dou J, Tseng WY, Reese TG, Wedeen VJ (2003) Combined diffusion and strain MRI reveals structure and function of human myocardial laminar sheets in vivo. Magn Reson Med 50: 107-113.
72. Cheng YJ, Lang D, Caruthers SD, Efimov IR, Chen J, et al. (2012) Focal but reversible diastolic sheet dysfunction reflects regional calcium mishandling in dystrophic mdx mouse hearts. Am J Physiol Heart Circ Physiol 303: H559-568.
73. Smerup M, Partridge J, Agger P, Ringgaard S, Pedersen M, et al. (2013) A mathematical model of the mechanical link between shortening of the cardiomyocytes and systolic deformation of the left ventricular myocardium. Technol Health Care 21: 63-79.
74. Bovendeerd PH, Kroon W, Delhaas T (2009) Determinants of left ventricular shear strain. Am J Physiol Heart Circ Physiol 297: H1058-1068.
75. Lunkenheimer PP, Redmann K, Kling N, Jiang X, Rothaus K, et al. (2006) Three-dimensional architecture of the left ventricular myocardium. Anat Rec A Discov Mol Cell Evol Biol 288: 565-578.
76. Sano T, Takayama N, Shimamoto T (1959) Directional difference of conduction velocity in the cardiac ventricular syncytium studied by microelectrodes. Circ Res 7: 262-267.
77. Taccardi B, Macchi E, Lux RL, Ershler PR, Spaggiari S, et al. (1994) Effect of myocardial fiber direction on epicardial potentials. Circulation 90: 3076-3090.
78. Mekkaoui C, Jackowski MP, Stoeck CT, Thiagalingam A, Kostis WJ, et al. Detection of Infarcted and Arrhythmogenic Myocardium with DTI Tractography and
136
Electroanatomical Voltage Mapping; 2014;22nd Annual Meeting of ISMRM, Milan, Italy. pp. 7836.
79. Zerhouni EA, Parish DM, Rogers WJ, Yang A, Shapiro EP (1988) Human heart: tagging with MR imaging--a method for noninvasive assessment of myocardial motion. Radiology 169: 59-63.
80. Stanisz GJ, Odrobina EE, Pun J, Escaravage M, Graham SJ, et al. (2005) T1, T2 relaxation and magnetization transfer in tissue at 3T. Magn Reson Med 54: 507-512.
81. Axel L, Dougherty L (1989) MR Imaging of Motion with Spatial Modulation of Magnetization. Radiology 171: 841-845.
82. Axel L, Dougherty L (1989) Heart wall motion: improved method of spatial modulation of magnetization for MR imaging. Radiology 172: 349-350.
83. Mosher TJ, Smith MB (1990) A DANTE tagging sequence for the evaluation of translational sample motion. Magn Reson Med 15: 334-339.
84. Bolster BD, Jr., McVeigh ER, Zerhouni EA (1990) Myocardial tagging in polar coordinates with use of striped tags. Radiology 177: 769-772.
86. Nasiraei-Moghaddam A, Finn JP (2014) Tagging of cardiac magnetic resonance images in the polar coordinate system: physical principles and practical implementation. Magn Reson Med 71: 1750-1759.
87. Fischer SE, McKinnon GC, Maier SE, Boesiger P (1993) Improved myocardial tagging contrast. Magn Reson Med 30: 191-200.
88. Fischer SE, McKinnon GC, Scheidegger MB, Prins W, Meier D, et al. (1994) True myocardial motion tracking. Magn Reson Med 31: 401-413.
89. Ryf S, Baltes C, Boesiger P. High speed 3D CSPAMM; 2004;12th Annual Meeting of ISMRM, Kyoto, Japan. pp. 657.
91. Osman NF, Sampath S, Atalar E, Prince JL (2001) Imaging longitudinal cardiac strain on short-axis images using strain-encoded MRI. Magn Reson Med 46: 324-334.
92. Ibrahim el SH, Stuber M, Fahmy AS, Abd-Elmoniem KZ, Sasano T, et al. (2007) Real-time MR imaging of myocardial regional function using strain-encoding (SENC) with tissue through-plane motion tracking. J Magn Reson Imaging 26: 1461-1470.
93. Sampath S, Osman NF, Prince JL (2009) A combined harmonic phase and strain-encoded pulse sequence for measuring three-dimensional strain. Magn Reson Imaging 27: 55-61.
94. Young AA (1999) Model tags: direct three-dimensional tracking of heart wall motion from tagged magnetic resonance images. Med Image Anal 3: 361-372.
137
Bibliography
95. Kraitchman DL, Young AA, Chang CN, Axel L (1995) Semi-automatic tracking of
myocardial motion in MR tagged images. IEEE Trans Med Imaging 14: 422-433.
96. Amini AA, Chen Y, Elayyadi M, Radeva P (2001) Tag surface reconstruction and tracking of myocardial beads from SPAMM-MRI with parametric B-spline surfaces. IEEE Trans Med Imaging 20: 94-103.
97. Prince JL, McVeigh ER (1992) Motion Estimation from Tagged MR Image Sequences. IEEE TransMedImag 11: 238-249.
98. Xu C, Pilla JJ, Isaac G, Gorman JH, 3rd, Blom AS, et al. (2010) Deformation analysis of 3D tagged cardiac images using an optical flow method. J Cardiovasc Magn Reson 12: 19.
99. Arts T, Prinzen FW, Delhaas T, Milles JR, Rossi AC, et al. (2010) Mapping displacement and deformation of the heart with local sine-wave modeling. IEEE Trans Med Imaging 29: 1114-1123.
100. Wang H, Stoeck CT, Kozerke S, Amini AA (2013) Analysis of 3D cardiac deformations with 3D SinMod. Conf Proc IEEE Eng Med Biol Soc 2013: 4386-4389.
101. Aletras AH, Ding S, Balaban RS, Wen H (1999) DENSE: displacement encoding with stimulated echoes in cardiac functional MRI. J Magn Reson 137: 247-252.
102. Kim D, Gilson WD, Kramer CM, Epstein FH (2004) Myocardial tissue tracking with two-dimensional cine displacement-encoded MR imaging: development and initial evaluation. Radiology 230: 862-871.
103. Gilson WD, Yang Z, French BA, Epstein FH (2004) Complementary displacement-encoded MRI for contrast-enhanced infarct detection and quantification of myocardial function in mice. Magn Reson Med 51: 744-752.
104. Epstein FH, Gilson WD (2004) Displacement-encoded cardiac MRI using cosine and sine modulation to eliminate (CANSEL) artifact-generating echoes. Magn Reson Med 52: 774-781.
105. Zhong X, Spottiswoode BS, Meyer CH, Kramer CM, Epstein FH (2010) Imaging three-dimensional myocardial mechanics using navigator-gated volumetric spiral cine DENSE MRI. Magn Reson Med 64: 1089-1097.
107. Aletras AH, Balaban RS, Wen H (1999) High-resolution strain analysis of the human heart with fast-DENSE. J Magn Reson 140: 41-57.
108. Reeder SB, Faranesh AZ, Boxerman JL, McVeigh ER (1998) In vivo measurement of T*2 and field inhomogeneity maps in the human heart at 1.5 T. Magn Reson Med 39: 988-998.
109. Nezafat R, Han Y, Peters DC, Herzka DA, Wylie JV, et al. (2007) Coronary magnetic resonance vein imaging: imaging contrast, sequence, and timing. Magn Reson Med 58: 1196-1206.
138
110. Ryf S, Tsao J, Schwitter J, Stuessi A, Boesiger P (2004) Peak-combination HARP: a method to correct for phase errors in HARP. J Magn Reson Imaging 20: 874-880.
111. Stoeck CT, Crean A, Greenwood JP, Boesiger P, Plein S, et al. In vivo comparison of CSPAMM and DENSE for cardiac motion analysis; 2009;17th Annual Meeting of ISMRM, Honolulu, Hawai’i, USA. pp. 1816.
112. Kim D, Kellman P (2007) Improved cine displacement-encoded MRI using balanced steady-state free precession and time-adaptive sensitivity encoding parallel imaging at 3 T. NMR Biomed 20: 591-601.
113. Kim D, Epstein FH, Gilson WD, Axel L (2004) Increasing the signal-to-noise ratio in DENSE MRI by combining displacement-encoded echoes. Magn Reson Med 52: 188-192.
114. van Dijk P (1984) Direct cardiac NMR imaging of heart wall and blood flow velocity. J Comput Assist Tomogr 8: 429-436.
115. Bryant DJ, Payne JA, Firmin DN, Longmore DB (1984) Measurement of flow with NMR imaging using a gradient pulse and phase difference technique. J Comput Assist Tomogr 8: 588-593.
116. Pelc NJ, Bernstein MA, Shimakawa A, Glover GH (1991) Encoding strategies for three-direction phase-contrast MR imaging of flow. J Magn Reson Imaging 1: 405-413.
118. Walker PG, Cranney GB, Scheidegger MB, Waseleski G, Pohost GM, et al. (1993) Semiautomated method for noise reduction and background phase error correction in MR phase velocity data. J Magn Reson Imaging 3: 521-530.
119. Chernobelsky A, Shubayev O, Comeau CR, Wolff SD (2007) Baseline correction of phase contrast images improves quantification of blood flow in the great vessels. J Cardiovasc Magn Reson 9: 681-685.
120. Giese D, Haeberlin M, Barmet C, Pruessmann KP, Schaeffter T, et al. (2012) Analysis and correction of background velocity offsets in phase-contrast flow measurements using magnetic field monitoring. Magn Reson Med 67: 1294-1302.
121. Osman NF, Kerwin WS, McVeigh ER, Prince JL (1999) Cardiac motion tracking using CINE harmonic phase (HARP) magnetic resonance imaging. Magn Reson Med 42: 1048-1060.
122. Reyhan M, Natsuaki Y, Ennis DB (2012) Fourier analysis of STimulated echoes (FAST) for the quantitative analysis of left ventricular twist. J Magn Reson Imaging 35: 587-593.
123. Reyhan M, Ennis DB (2013) Quantitative assessment of systolic and diastolic left ventricular twist using Fourier Analysis of Stimulated echoes (FAST) and CSPAMM. J Magn Reson Imaging 37: 678-683.
139
Bibliography
124. Burns AT, La Gerche A, Prior DL, Macisaac AI (2010) Left ventricular torsion
parameters are affected by acute changes in load. Echocardiography 27: 407-414.
125. Kanzaki H, Nakatani S, Yamada N, Urayama S, Miyatake K, et al. (2006) Impaired systolic torsion in dilated cardiomyopathy: reversal of apical rotation at mid-systole characterized with magnetic resonance tagging method. Basic Res Cardiol 101: 465-470.
126. Russel IK, Brouwer WP, Germans T, Knaapen P, Marcus JT, et al. (2011) Increased left ventricular torsion in hypertrophic cardiomyopathy mutation carriers with normal wall thickness. J Cardiovasc Magn Reson 13: 3.
127. Foell D, Jung B, Germann E, Staehle F, Bode C, et al. (2013) Hypertensive heart disease: MR tissue phase mapping reveals altered left ventricular rotation and regional myocardial long-axis velocities. Eur Radiol 23: 339-347.
128. Edvardsen T, Rosen BD, Pan L, Jerosch-Herold M, Lai S, et al. (2006) Regional diastolic dysfunction in individuals with left ventricular hypertrophy measured by tagged magnetic resonance imaging--the Multi-Ethnic Study of Atherosclerosis (MESA). Am Heart J 151: 109-114.
129. Moody WE, Taylor RJ, Edwards NC, Chue CD, Umar F, et al. (2014) Comparison of magnetic resonance feature tracking for systolic and diastolic strain and strain rate calculation with spatial modulation of magnetization imaging analysis. J Magn Reson Imaging.
130. Gotte MJ, van Rossum AC, Twisk JWR, Kuijer JPA, Marcus JT, et al. (2001) Quantification of regional contractile function after infarction: strain analysis superior to wall thickening analysis in discriminating infarct from remote myocardium. J Am Coll Cardiol 37: 808-817.
131. Nelson GS, Curry CW, Wyman BT, Kramer A, Declerck J, et al. (2000) Predictors of systolic augmentation from left ventricular preexcitation in patients with dilated cardiomyopathy and intraventricular conduction delay. Circulation 101: 2703-2709.
132. Rutz AK, Manka R, Kozerke S, Roas S, Boesiger P, et al. (2009) Left ventricular dyssynchrony in patients with left bundle branch block and patients after myocardial infarction: integration of mechanics and viability by cardiac magnetic resonance. Eur Heart J 30: 2117-2127.
133. Helm RH, Leclercq C, Faris OP, Ozturk C, McVeigh E, et al. (2005) Cardiac dyssynchrony analysis using circumferential versus longitudinal strain: implications for assessing cardiac resynchronization. Circulation 111: 2760-2767.
134. Bilchick KC, Lardo AC (2008) Cardiac resynchronization therapy: application of imaging to optimize patient selection and assess response. Curr Heart Fail Rep 5: 119-127.
135. Jehle A, Epstein F, Zhong X, Janiczek R, Tsai WK, et al. (2009) Cine DENSE MRI for circumferential and radial dyssynchrony in patients referred for cardiac
140
resynchronization therapy. Journal of Cardiovascular Magnetic Resonance 11: O90.
136. Sandstede JJ, Johnson T, Harre K, Beer M, Hofmann S, et al. (2002) Cardiac systolic rotation and contraction before and after valve replacement for aortic stenosis: a myocardial tagging study using MR imaging. AJR Am J Roentgenol 178: 953-958.
137. McVeigh ER (1996) MRI of myocardial function: motion tracking techniques. Magn Reson Imaging 14: 137-150.
138. Gotte MJ, Germans T, Russel IK, Zwanenburg JJ, Marcus JT, et al. (2006) Myocardial strain and torsion quantified by cardiovascular magnetic resonance tissue tagging: studies in normal and impaired left ventricular function. J Am Coll Cardiol 48: 2002-2011.
139. Spottiswoode BS, Zhong X, Lorenz CH, Mayosi BM, Meintjes EM, et al. (2008) 3D myocardial tissue tracking with slice followed cine DENSE MRI. J Magn Reson Imaging 27: 1019-1027.
140. Arai AE, Gaither CC, 3rd, Epstein FH, Balaban RS, Wolff SD (1999) Myocardial velocity gradient imaging by phase contrast MRI with application to regional function in myocardial ischemia. Magn Reson Med 42: 98-109.
142. Jung B, Zaitsev M, Hennig J, Markl M (2006) Navigator gated high temporal resolution tissue phase mapping of myocardial motion. Magn Reson Med 55: 937-942.
143. Stuber M, Spiegel MA, Fischer SE, Scheidegger MB, Danias PG, et al. (1999) Single breath-hold slice-following CSPAMM myocardial tagging. Magma 9: 85-91.
144. Moore CC, O'Dell WG, McVeigh ER, Zerhouni EA (1992) Calculation of three-dimensional left ventricular strains from biplanar tagged MR images. J Magn Reson Imaging 2: 165-175.
145. Abd-Elmoniem KZ, Stuber M, Osman NF, Prince JL (2005) ZHARP: three-dimensional motion tracking from a single image plane. Inf Process Med Imaging 19: 639-651.
146. Abd-Elmoniem KZ, Stuber M, Prince JL (2008) Direct three-dimensional myocardial strain tensor quantification and tracking using zHARP. Med Image Anal 12: 778-786.
147. Ryf S, Spiegel MA, Gerber M, Boesiger P (2002) Myocardial tagging with 3D-CSPAMM. J Magn Reson Imaging 16: 320-325.
148. Wang Y, Riederer SJ, Ehman RL (1995) Respiratory motion of the heart: kinematics and the implications for the spatial resolution in coronary imaging. Magn Reson Med 33: 713-719.
149. Nehrke K, Bornert P, Manke D, Bock JC (2001) Free-breathing cardiac MR imaging: study of implications of respiratory motion--initial results. Radiology 220: 810-815.
141
Bibliography
150. Moghari MH, Hu P, Kissinger KV, Goddu B, Goepfert L, et al. (2012) Subject-
specific estimation of respiratory navigator tracking factor for free-breathing cardiovascular MR. Magn Reson Med 67: 1665-1672.
151. Lustig M, Donoho D, Pauly JM (2007) Sparse MRI: The application of compressed sensing for rapid MR imaging. Magn Reson Med 58: 1182-1195.
152. Bo Z, Haldar JP, Brinegar C, Zhi-Pei L. Low rank matrix recovery for real-time cardiac MRI; 2010 14-17 April 2010;Biomedical Imaging: From Nano to Macro, 2010 IEEE International Symposium on. pp. 996-999.
153. Gamper U, Boesiger P, Kozerke S (2008) Compressed sensing in dynamic MRI. Magn Reson Med 59: 365-373.
154. Plein S, Ryf S, Schwitter J, Radjenovic A, Boesiger P, et al. (2007) Dynamic contrast-enhanced myocardial perfusion MRI accelerated with k-t sense. Magn Reson Med 58: 777-785.
155. Otazo R, Kim D, Axel L, Sodickson DK (2010) Combination of compressed sensing and parallel imaging for highly accelerated first-pass cardiac perfusion MRI. Magn Reson Med 64: 767-776.
156. Jung B, Honal M, Hennig J, Markl M (2008) k-t-Space accelerated myocardial perfusion. J Magn Reson Imaging 28: 1080-1085.
157. Adluru G, McGann C, Speier P, Kholmovski EG, Shaaban A, et al. (2009) Acquisition and reconstruction of undersampled radial data for myocardial perfusion magnetic resonance imaging. J Magn Reson Imaging 29: 466-473.
158. Manka R, Vitanis V, Boesiger P, Flammer AJ, Plein S, et al. (2010) Clinical feasibility of accelerated, high spatial resolution myocardial perfusion imaging. JACC Cardiovasc Imaging 3: 710-717.
159. Manka R, Jahnke C, Kozerke S, Vitanis V, Crelier G, et al. (2011) Dynamic 3-dimensional stress cardiac magnetic resonance perfusion imaging: detection of coronary artery disease and volumetry of myocardial hypoenhancement before and after coronary stenting. J Am Coll Cardiol 57: 437-444.
160. Hansen MS, Baltes C, Tsao J, Kozerke S, Pruessmann KP, et al. (2004) Accelerated dynamic Fourier velocity encoding by exploiting velocity-spatio-temporal correlations. MAGMA 17: 86-94.
161. Baltes C, Kozerke S, Hansen MS, Pruessmann KP, Tsao J, et al. (2005) Accelerating cine phase-contrast flow measurements using k-t BLAST and k-t SENSE. Magn Reson Med 54: 1430-1438.
162. Stadlbauer A, van der Riet W, Crelier G, Salomonowitz E (2010) Accelerated time-resolved three-dimensional MR velocity mapping of blood flow patterns in the aorta using SENSE and k-t BLAST. Eur J Radiol 75: e15-21.
163. Peters DC, Epstein FH, McVeigh ER (2001) Myocardial wall tagging with undersampled projection reconstruction. Magn Reson Med 45: 562-567.
164. Ryf S, Kozerke S, Tsao J, Boesiger P. 3D CSPAMM tagging accelerated with kt-BLAST; 2003;11th Annual Meeting of ISMRM, Toronto, Canada. pp. 1565.
142
165. Buehrer M, Pruessmann KP, Boesiger P, Kozerke S (2007) Array compression for MRI with large coil arrays. Magn Reson Med 57: 1131-1139.
166. Ryf S, Rutz AK, Boesiger P, Schwitter J (2006) Is post-systolic shortening a reliable indicator of myocardial viability? An MR tagging and late-enhancement study. J Cardiovasc Magn Reson 8: 445-451.
167. Kramer CM, Rogers WJ, Theobald TM, Power TP, Petruolo S, et al. (1996) Remote noninfarcted region dysfunction soon after first anterior myocardial infarction. A magnetic resonance tagging study. Circulation 94: 660-666.
168. Rosen BD, Gerber BL, Edvardsen T, Castillo E, Amado LC, et al. (2004) Late systolic onset of regional LV relaxation demonstrated in three-dimensional space by MRI tissue tagging. Am J Physiol Heart Circ Physiol 287: H1740-1746.
169. Carr HY, Purcell EM (1954) Effects of diffusion on free precession in nuclear magnetic resonance experiments. Physical Review 94: 630.
170. Callaghan PT (1991) Principles of nuclear magnetic resonance microscopy: Clarendon Press Oxford.
171. Edelstein W, Glover G, Hardy C, Redington R (1986) The intrinsic signal-to-noise ratio in NMR imaging. Magnetic Resonance in Medicine 3: 604-618.
172. Stejskal E, Tanner J (1965) Spin diffusion measurements: spin echoes in the presence of a time-dependent field gradient. The journal of chemical physics 42: 288.
173. Cleveland GG, Chang DC, Hazlewood CF, Rorschach HE (1976) Nuclear magnetic resonance measurement of skeletal muscle: anisotrophy of the diffusion coefficient of the intracellular water. Biophys J 16: 1043-1053.
174. Basser PJ, Mattiello J, LeBihan D (1994) MR diffusion tensor spectroscopy and imaging. Biophys J 66: 259-267.
175. Einstein A (1905) Über die von der molekularkinetischen Theorie der Wärme geforderte Bewegung von in ruhenden Flüssigkeiten suspendierten Teilchen. Annalen der physik 322: 549-560.
176. Fick A (1855) Ueber diffusion. Annalen der physik 170: 59-86.
177. Wedeen VJ, Hagmann P, Tseng WY, Reese TG, Weisskoff RM (2005) Mapping complex tissue architecture with diffusion spectrum magnetic resonance imaging. Magn Reson Med 54: 1377-1386.
178. Callaghan P, Eccles C, Xia Y (1988) NMR microscopy of dynamic displacements: k-space and q-space imaging. Journal of Physics E: Scientific Instruments 21: 820.
179. Hahn EL (1950) Spin echoes. Physical Review 80: 580.
180. Torrey HC (1956) Bloch equations with diffusion terms. Physical Review 104: 563.
181. Bihan DL (1995) Diffusion and perfusion magnetic resonance imaging: applications to functional MRI: Raven Press.
182. Kärger J (1985) NMR self-diffusion studies in heterogeneous systems. Advances in Colloid and Interface Science 23: 129-148.
143
Bibliography
183. Lätt J, Nilsson M, Wirestam R, Johansson E, Larsson E-M, et al. (2008) In vivo
184. Jensen JH, Helpern JA, Ramani A, Lu H, Kaczynski K (2005) Diffusional kurtosis imaging: the quantification of non-gaussian water diffusion by means of magnetic resonance imaging. Magn Reson Med 53: 1432-1440.
185. Jensen J, Chandra R (1997) Weak-diffusion theory of NMR signal in magnetically heterogeneous media. Journal of Magnetic Resonance 126: 193-199.
186. Balanda KP, MacGillivray H (1988) Kurtosis: a critical review. The American Statistician 42: 111-119.
187. Froeling M, Mazzoli V, Nederveen AJ, Luijten PR, Strijkers GJ (2014) Ex vivo cardiac DTI: on the effects of diffusion time and b-value. Journal of Cardiovascular Magnetic Resonance 16: P77.
188. Mazzoli V, Froeling M, Nederveen AJ, Nicolay K, Strijkers GJ. Cardiac diffusion MRI beyond DTI; 2014;22nd Annual Meeting of ISMRM, Milan, Italy. pp. 2434.
189. Le Bihan D, Breton E, Lallemand D, Grenier P, Cabanis E, et al. (1986) MR imaging of intravoxel incoherent motions: application to diffusion and perfusion in neurologic disorders. Radiology 161: 401-407.
190. Jones DK, Horsfield MA, Simmons A (1999) Optimal strategies for measuring diffusion in anisotropic systems by magnetic resonance imaging. Magn Reson Med 42: 515-525.
191. Basser PJ (1995) Inferring microstructural features and the physiological state of tissues from diffusion-weighted images. NMR Biomed 8: 333-344.
193. Tournier JD, Calamante F, Gadian DG, Connelly A (2004) Direct estimation of the fiber orientation density function from diffusion-weighted MRI data using spherical deconvolution. Neuroimage 23: 1176-1185.
195. Scollan DF, Holmes A, Winslow R, Forder J (1998) Histological validation of myocardial microstructure obtained from diffusion tensor magnetic resonance imaging. Am J Physiol 275: H2308-2318.
196. Bernstein MA, King KF, Zhou XJ (2004) Handbook of MRI Pulse Sequences: ElSEVIER.
197. Pipe JG, Chenevert TL (1991) A progressive gradient moment nulling design technique. Magn Reson Med 19: 175-179.
198. Toussaint N, Stoeck CT, Sermesant M, Schaeffter T, Kozerke S, et al. (2013) In vivo human cardiac fibre architecture estimation using shape-based diffusion tensor processing. Med Image Anal.
144
199. Reese TG, Heid O, Weisskoff RM, Wedeen VJ (2003) Reduction of eddy-current-induced distortion in diffusion MRI using a twice-refocused spin echo. Magn Reson Med 49: 177-182.
200. Barmet C, De Zanche N, Pruessmann KP (2008) Spatiotemporal magnetic field monitoring for MR. Magn Reson Med 60: 187-197.
201. Barmet C, De Zanche N, Wilm BJ, Pruessmann KP (2009) A transmit/receive system for magnetic field monitoring of in vivo MRI. Magn Reson Med 62: 269-276.
202. Bernstein MA, Zhou XJ, Polzin JA, King KF, Ganin A, et al. (1998) Concomitant gradient terms in phase contrast MR: analysis and correction. Magn Reson Med 39: 300-308.
203. Norris DG, Hutchison JM (1990) Concomitant magnetic field gradients and their effects on imaging at low magnetic field strengths. Magn Reson Imaging 8: 33-37.
204. Haase A, Frahm J, Matthaei D, Hanicke W, Bomsdorf H, et al. (1986) MR imaging using stimulated echoes (STEAM). Radiology 160: 787-790.
205. Merboldt KD, Hanicke W, Frahm J (1991) Diffusion imaging using stimulated echoes. Magn Reson Med 19: 233-239.
206. Tseng WY, Reese TG, Weisskoff RM, Wedeen VJ (1999) Cardiac diffusion tensor MRI in vivo without strain correction. Magn Reson Med 42: 393-403.
207. Schmid P, Jaermann T, Boesiger P, Niederer PF, Lunkenheimer PP, et al. (2005) Ventricular myocardial architecture as visualised in postmortem swine hearts using magnetic resonance diffusion tensor imaging. Eur J Cardiothorac Surg 27: 468-472.
208. Hsu EW, Muzikant AL, Matulevicius SA, Penland RC, Henriquez CS (1998) Magnetic resonance myocardial fiber-orientation mapping with direct histological correlation. Am J Physiol 274: H1627-1634.
209. Geerts L, Bovendeerd P, Nicolay K, Arts T (2002) Characterization of the normal cardiac myofiber field in goat measured with MR-diffusion tensor imaging. Am J Physiol Heart Circ Physiol 283: H139-145.
210. Tseng WY, Wedeen VJ, Reese TG, Smith RN, Halpern EF (2003) Diffusion tensor MRI of myocardial fibers and sheets: correspondence with visible cut-face texture. J Magn Reson Imaging 17: 31-42.
211. Chen J, Song SK, Liu W, McLean M, Allen JS, et al. (2003) Remodeling of cardiac fiber structure after infarction in rats quantified with diffusion tensor MRI. Am J Physiol Heart Circ Physiol 285: H946-954.
212. Ennis DB, Kindlman G, Rodriguez I, Helm PA, McVeigh ER (2005) Visualization of tensor fields using superquadric glyphs. Magn Reson Med 53: 169-176.
213. Wu EX, Wu Y, Nicholls JM, Wang J, Liao S, et al. (2007) MR diffusion tensor imaging study of postinfarct myocardium structural remodeling in a porcine model. Magn Reson Med 58: 687-695.
145
Bibliography
214. Wu Y, Chan CW, Nicholls JM, Liao S, Tse HF, et al. (2009) MR study of the effect of
infarct size and location on left ventricular functional and microstructural alterations in porcine models. J Magn Reson Imaging 29: 305-312.
215. Strijkers GJ, Bouts A, Blankesteijn WM, Peeters TH, Vilanova A, et al. (2009) Diffusion tensor imaging of left ventricular remodeling in response to myocardial infarction in the mouse. NMR Biomed 22: 182-190.
216. Hales PW, Burton RA, Bollensdorff C, Mason F, Bishop M, et al. (2011) Progressive changes in T(1), T(2) and left-ventricular histo-architecture in the fixed and embedded rat heart. NMR Biomed 24: 836-843.
217. Eggen MD, Swingen CM, Iaizzo PA (2012) Ex vivo diffusion tensor MRI of human hearts: relative effects of specimen decomposition. Magn Reson Med 67: 1703-1709.
219. Wu MT, Tseng WY, Su MY, Liu CP, Chiou KR, et al. (2006) Diffusion tensor magnetic resonance imaging mapping the fiber architecture remodeling in human myocardium after infarction: correlation with viability and wall motion. Circulation 114: 1036-1045.
220. Nguyen C, Fan Z, Sharif B, He Y, Dharmakumar R, et al. (2013) In vivo three-dimensional high resolution cardiac diffusion-weighted MRI: A motion compensated diffusion-prepared balanced steady-state free precession approach. Magn Reson Med.
221. Nielles-Vallespin S, Mekkaoui C, Gatehouse P, Reese TG, Keegan J, et al. (2013) In vivo diffusion tensor MRI of the human heart: Reproducibility of breath-hold and navigator-based approaches. Magn Reson Med 70: 454-465.
222. Sosnovik DE, Wang R, Dai G, Wang T, Aikawa E, et al. (2009) Diffusion spectrum MRI tractography reveals the presence of a complex network of residual myofibers in infarcted myocardium. Circ Cardiovasc Imaging 2: 206-212.
223. Mekkaoui C, Huang S, Chen HH, Dai G, Reese TG, et al. (2012) Fiber architecture in remodeled myocardium revealed with a quantitative diffusion CMR tractography framework and histological validation. J Cardiovasc Magn Reson 14: 70.
224. Mekkaoui C, Porayette P, Jackowski MP, Kostis WJ, Dai G, et al. (2013) Diffusion MRI tractography of the developing human fetal heart. PLoS One 8: e72795.
225. Sosnovik DE, Mekkaoui C, Huang S, Chen HH, Dai G, et al. (2014) Microstructural impact of ischemia and bone marrow-derived cell therapy revealed with diffusion tensor magnetic resonance imaging tractography of the heart in vivo. Circulation 129: 1731-1741.
226. Hales PW, Schneider JE, Burton RA, Wright BJ, Bollensdorff C, et al. (2012) Histo-anatomical structure of the living isolated rat heart in two contraction states assessed by diffusion tensor MRI. Prog Biophys Mol Biol 110: 319-330.
146
227. Chen Y, Chen J, Caruthers S, Wickline SA. Progressive Myocardial Sheet Dysfunction from 3 to 16 months in Duchene Muscular Dystrophy Mice (mdx) Defined by Diffusion Tensor MRI (DTI); 2013;21st Annual Meeting of ISMRM, Salt Lake City, Utah, USA. pp. 3077.
228. Edelman RR, Gaa J, Wedeen VJ, Loh E, Hare JM, et al. (1994) In vivo measurement of water diffusion in the human heart. Magn Reson Med 32: 423-428.
229. Harmer J, Toussaint N, Pushparajah K, Stoeck CT, Chan RW, et al. In-vivo Diffusion Tensor Imaging of the Systemic Right Ventricle at 3T; 2013;21st Annual Meeting of ISMRM, Salt Lake City, Utah, USA.
230. McGill L-A, Ismail TF, Nielles-Vallespin S, Ferreira P, Scott AD, et al. (2012) Reproducibility of in-vivo diffusion tensor cardiovascular magnetic resonance in hypertrophic cardiomyopathy. J Cardiovasc Magn Reson 14: 86.
231. Nielles-Vallespin S, Ferreira PF, Gatehouse P, Keegan J, de Silva R, et al. Time-resolved In Vivo Cardiac Diffusion Tensor MRI of the Human Heart; 2013;21st Annual Meeting of ISMRM, Salt Lake City, Utah, USA. pp. 0479.
232. Ferreira P, Kilner PJ, McGill L-A, Nielles-Vallespin S, Scott AD, et al. (2014) Aberrant myocardial sheetlet mobility in hypertrophic cardiomyopathy detected using in vivo cardiovascular magnetic resonance diffusion tensor imaging. Journal of Cardiovascular Magnetic Resonance 16: P338.
233. McGill L-A, Ferreira P, Scott AD, Nielles-Vallespin S, Silva R, et al. (2014) Comparison of cardiac DTI parameters between systole and diastole. Journal of Cardiovascular Magnetic Resonance 16: P39.
234. Schar M, Kozerke S, Boesiger P. Considerations on Shimming for Cardiac Applications at 1.5 and 3.0T; 2003; Annual Meeting of the ISMRM, Toronto.
235. Feinberg DA, Hoenninger JC, Crooks LE, Kaufman L, Watts JC, et al. (1985) Inner volume MR imaging: technical concepts and their application. Radiology 156: 743-747.
236. Reischauer C, Wilm BJ, Froehlich JM, Gutzeit A, Prikler L, et al. (2011) High-resolution diffusion tensor imaging of prostate cancer using a reduced FOV technique. Eur J Radiol 80: e34-41.
237. Klein S, Staring M, Murphy K, Viergever MA, Pluim JP (2010) elastix: a toolbox for intensity-based medical image registration. IEEE Trans Med Imaging 29: 196-205.
238. Myronenko A, Song X (2010) Point set registration: coherent point drift. IEEE Trans Pattern Anal Mach Intell 32: 2262-2275.
239. Bammer R, Keeling SL, Augustin M, Pruessmann KP, Wolf R, et al. (2001) Improved diffusion-weighted single-shot echo-planar imaging (EPI) in stroke using sensitivity encoding (SENSE). Magn Reson Med 46: 548-554.
240. Bammer R, Auer M, Keeling SL, Augustin M, Stables LA, et al. (2002) Diffusion tensor imaging using single-shot SENSE-EPI. Magn Reson Med 48: 128-136.
147
Bibliography
241. Alexander AL, Lee JE, Wu YC, Field AS (2006) Comparison of diffusion tensor
imaging measurements at 3.0 T versus 1.5 T with and without parallel imaging. Neuroimaging Clin N Am 16: 299-309, xi.
242. Menzel MI, Tan ET, Khare K, Sperl JI, King KF, et al. (2011) Accelerated diffusion spectrum imaging in the human brain using compressed sensing. Magn Reson Med 66: 1226-1233.
243. Breuer FA, Blaimer M, Heidemann RM, Mueller MF, Griswold MA, et al. (2005) Controlled aliasing in parallel imaging results in higher acceleration (CAIPIRINHA) for multi-slice imaging. Magn Reson Med 53: 684-691.
244. von Deuster C, Stoeck CT, Giese D, Harmer J, Chan RW, et al. Concurrent dual-slice cardiac DTI of the in-vivo human heart; 2013;21st Annual Meeting of ISMRM, Salt Lake City, Utah, USA.
245. Lau AZ, Tunnicliffe EM, Frost R, Koopmans PJ, Tyler DJ, et al. (2014) Accelerated human cardiac diffusion tensor imaging using simultaneous multislice imaging. Magn Reson Med.
246. Kristoffersen A (2007) Optimal estimation of the diffusion coefficient from non-averaged and averaged noisy magnitude data. J Magn Reson 187: 293-305.
247. Lombaert H, Peyrat J-M, Fanton L, Cheriet F, Delingette H, et al. (2012) Variability of the Human Cardiac Laminar Structure. 7085: 160-167.
248. Sosnovik DE, Wang R, Dai G, Reese TG, Wedeen VJ (2009) Diffusion MR tractography of the heart. J Cardiovasc Magn Reson 11: 47.
249. Lee LC, Genet M, Dang AB, Ge L, Guccione JM, et al. (2014) Applications of computational modeling in cardiac surgery. J Card Surg 29: 293-302.
250. Genet M, Lee LC, Nguyen R, Haraldsson H, Acevedo-Bolton G, et al. (2014) Distribution of normal human left ventricular myofiber stress at end diastole and end systole: a target for in silico design of heart failure treatments. J Appl Physiol (1985) 117: 142-152.
251. Rapacchi S, Wen H, Viallon M, Grenier D, Kellman P, et al. (2011) Low b-value diffusion-weighted cardiac magnetic resonance imaging: initial results in humans using an optimal time-window imaging approach. Invest Radiol 46: 751-758.
252. Toussaint N, Stoeck CT, Schaeffter T, Kozerke S, Sermesant M, et al. (2013) In vivo human cardiac fibre architecture estimation using shape-based diffusion tensor processing. Med Image Anal 17: 1243-1255.
253. Wei H, Viallon M, Delattre BM, Wang L, Pai VM, et al. (2013) Assessment of cardiac motion effects on the fiber architecture of the human heart in vivo. IEEE Trans Med Imaging 32: 1928-1938.
254. Nielles-Vallespin S, Mekkaoui C, Gatehouse P, Reese T, Keegan J, et al. (2012) Diffusion tensor MRI of the human heart In Vivo with a navigator based free breathing approach. Journal of Cardiovascular Magnetic Resonance 14: 1-2.
148
255. Stoeck CT, von Deuster C, Toussaint N, Kozerke S. High-resolution single-shot DTI of the in-vivo human heart using asymmetric diffusion encoding; 2013;21st Annual Meeting of ISMRM, Salt Lake City, Utah, USA. pp. 0480.
256. Nakamura T, Shibukawa S, Muro I, Kajihara N, Nishio H, et al. Improvement of visualization of cardiac wall in diffusion-weighted imaging using cardiac triggering and acceleration motion correction; 2014;22nd Annual Meeting of ISMRM, Milan, Italy. pp. 2417.
257. Nguyen C, Fan Z, Sharif B, He Y, Dharmakumar R, et al. (2013) In vivo three-dimensional high resolution cardiac diffusion-weighted MRI: A motion compensated diffusion-prepared balanced steady-state free precession approach. Magn Reson Med. 2013/11/22 ed.
258. Pai VM, Rapacchi S, Kellman P, Croisille P, Wen H (2011) PCATMIP: enhancing signal intensity in diffusion-weighted magnetic resonance imaging. Magn Reson Med 65: 1611-1619.
259. Toussaint N, Souplet J-C, Fillard P. MedINRIA: Medical image navigation and research tool by INRIA; 2007;Proc of MICCAI.
260. Welsh CL, Dibella EV, Hsu EW. Analysis and Design of Higher-Order Motion-Compensated Diffusion Encoding Schemes for In Vivo Cardiac DTI; 2014;22nd Annual Meeting of ISMRM, Milan, Italy. pp. 2436.
261. Meyer CH, Pauly JM, Macovski A, Nishimura DG (1990) Simultaneous spatial and spectral selective excitation. Magn Reson Med 15: 287-304.
262. Hargreaves BA, Cunningham CH, Nishimura DG, Conolly SM (2004) Variable-rate selective excitation for rapid MRI sequences. Magn Reson Med 52: 590-597.
263. Wilm BJ, Svensson J, Henning A, Pruessmann KP, Boesiger P, et al. (2007) Reduced field-of-view MRI using outer volume suppression for spinal cord diffusion imaging. Magn Reson Med 57: 625-630.
264. Stoeck CT, Kalinowska A, von Deuster C, Harmer J, Chan RW, et al. (2014) Dual-phase cardiac diffusion tensor imaging with strain correction. PLoS One 9: e107159.
265. Meloni A, Hezel F, Positano V, Keilberg P, Pepe A, et al. (2014) Detailing magnetic field strength dependence and segmental artifact distribution of myocardial effective transverse relaxation rate at 1.5, 3.0, and 7.0 T. Magn Reson Med 71: 2224-2230.
266. von Deuster C, Stoeck CT, Buehrer M, Harmer J, Chan RW, et al. Free-breathing cardiac DTI with simultaneous multi-slice excitation; 2014;22nd Annual Meeting of ISMRM, Milan, Italy. pp. 0671.
267. Froeling M, Strijkers GJ, Nederveen AJ, Chamuleau SA, Luijten PR. Feasibility of whole heart DTI and IVIM with a 15 minute acquisition protocol; 2014;22nd Annual Meeting of ISMRM, Milan, Italy. pp. 2411.
268. Harmer J, Chan RW, Stoeck CT, von Deuster C, Atkinson D, et al. Correction of Off-resonance Distortions in In-vivo Cardiac Diffusion Tensor Imaging; 2014;22nd Annual Meeting of ISMRM, Milan, Italy. pp. 4461.
149
Bibliography
269. Tisdall D, Witzel T, Tountcheva V, Mcnab JA, Cohen-Adad J, et al. Improving SNR in
High B-Value Diffusion Imaging Using Gmax = 300 MT/m Human Gradients; 2012;20th Annual Meeting of ISMRM, Melbourne, Australia. pp. 2738.
150
List of Publications
List of Publications
Journal publications 1. Stoeck CT, Kalinowska A, von Deuster C, Harmer J, Chan RW, Niemann M, Manka R,
Atkinson D, Sosnovik DE, Mekkaoui C, Kozerke S, Dual-Phase Cardiac Diffusion Ten-sor Imaging With Strain Correction, PLoS one 2014
2. Winklhofer S, Stoeck CT, Berger N, Thali M, Manka R, Kozerke S, Alkadhi H, Stolzmann P, Post-mortem cardiac diffusion tensor imaging: detection of myocardi-al infarction and remodeling of myofiber architecture, Eur Radiol. 2014
3. Chan RW, von Deuster C, Giese D, Stoeck CT, Harmer J, Aitken AP, Atkinson D, Kozerke S, Characterization and correction of eddy-current artifacts in unipolar and bipolar diffusion sequences using magnetic field monitoring, J Magn Reson. 2014
4. Sosnovik DE, Mekkaoui C, Huang S, Chen HH, Dai G, Stoeck CT, Ngoy S, Guan J, Wang R, Kostis WJ, Jackowski MP, Wedeen VJ, Kozerke S, Liao R, Microstructural impact of ischemia and bone marrow-derived cell therapy revealed with diffusion tensor magnetic resonance imaging tractography of the heart in-vivo, Circulation. 2014
5. Toussaint N, Stoeck CT, Schaeffter T, Kozerke S, Sermesant M, Batchelor PG, In-vivo human cardiac fibre architecture estimation using shape-based diffusion tensor processing, Med Image Anal. 2013
6. Wang H, Stoeck CT, Kozerke S, Amini AA, Analysis of 3D cardiac deformations with 3D SinMod, IEEE Eng Med Biol Soc. 2013
7. Weiss K, Summermatter S, Stoeck CT, Kozerke S, Compensation of signal loss due to cardiac motion in point-resolved spectroscopy of the heart, Magn Reson Med. 2013
8. Zurbuchen A, Pfenniger A, Stahel A, Stoeck CT, Vandenberghe S, Koch VM, Vogel R, Energy harvesting from the beating heart by a mass imbalance oscillation genera-tor, Ann Biomed Eng. 2013
9. Stoeck CT, Manka R, Boesiger P, Kozerke S, Undersampled cine 3D tagging for rapid assessment of cardiac motion, J Cardiovasc Magn Reson. 2012
10. Manka R, Kozerke S, Rutz AK, Stoeck CT, Boesiger P, Schwitter J, A CMR study of the effects of tissue edema and necrosis on left ventricular dyssynchrony in acute myo-cardial infarction: implications for cardiac resynchronization therapy, J Cardiovasc Magn Reson. 2012
Kozerke S, Nezafat R, Optimization of on-resonant magnetization transfer contrast in coronary vein MRI, Magn Reson Med. 2010
12. Toussaint N, Sermesant M, Stoeck CT, Kozerke S, Batchelor PG, In-vivo human 3D cardiac fibre architecture: reconstruction using curvilinear interpolation of diffusion tensor images, Med Image Comput Comput Assist Interv. 2010
1. Harmer J, Pushparajah K, Toussaint N, Stoeck CT, Chan R, Atkinson D, Razavi R, Kozerke S, In-vivo Mapping of Myofiber Architecture in the Systemic Right Ventricle, Eur Heart J. 2013
Conference proceedings 1. Stoeck CT, Kalinowska A, von Deuster C, Harmer J, Kozerke S, In-vivo dual-phase
cardiac DTI with 3D strain correction, ISMRM 2014, Milan Italy, poster presenta-tion, p. 2429
2. Deuster C, Stoeck CT, Buehrer M, Harmer J, Chan RW, Atkinson D, Kozerke S, Free-breathing cardiac DTI with simultaneous multi-slice excitation, ISMRM 2014, Milan Italy, oral presentation, p. 671
3. Harmer J, Chan RW, Stoeck CT, von Deuster C, Atkinson D, Kozerke S, Correction of Off-resonance Distortions in In-vivo Cardiac Diffusion Tensor Imaging, ISMRM 2014, Milan Italy, poster presentation, p. 4461
4. Mekkaoui C, Stoeck CT, Jackowski MP, Reese TG, Kozerke S, Sosnovik DE, Micro-structural Characterization of the Infarct Border Zone in Humans with In-vivo Diffu-sion Tensor MRI and “Gray-Zone” Late Gadolinium Enhancement, ISMRM 2014, Mi-lan Italy, oral presentation, p. 3973
5. Mekkaoui C, Jackowski MP, Stoeck CT, Thiagalingam A, Kostis WJ, Ruskin JN, Tim Reese TG, Kozerke S, Sosnovik DE, Detection of Infarcted and Arrhythmogenic Myo-
152
cardium with DTI Tractography and Electroanatomical Voltage Mapping, ISMRM 2014, Milan Italy, poster presentation, p. 0239
6. Mekkaoui C, Jackowski MP, Sakadzic S, Stoeck CT, Reese TG, Kozerke S, Ott HC, Sosnovik DE, Impact of the Connective Tissue Matrix in the Myocardium on the Re-striction of Water Revealed with Diffusion Tensor MRI of a Decellularized Human Heart, ISMRM 2014, Milan Italy, poster presentation, p. 188
7. Chan RW, von Deuster C, Stoeck CT, Harmer J, Kozerke S, Atkinson D, High-Resolution Diffusion Tensor Imaging (DTI) of the Human Kidneys using a Free-Breathing Multi-Slice Targeted-FOV Approach, ISMRM 2014, Milan Italy, poster presentation, p. 2553
8. Niemann M, Stoeck CT, Manka R, Kozerke S, Revealing Ultrastructural Morphology in Hypertrophic Cardiomyopathy using Diffusion Tensor Imaging, DGK 2014, Mann-heim Germany, poster presentation
9. Stoeck CT, Deuster C, Toussaint N, Kozerke S, High-resolution multi-slice single-shot cardiac DTI using asymmetric diffusion encoding, ISMRM 2013, Salt Lake City USA, oral presentation, p. 480, summa cum laude award
10. Wang H, Stoeck CT, Kozerke S, Amini AA, 3D Left-Ventricular Deformation Analysis from 3D CSPAMM with 3D SinMod, ISMRM 2013, Salt Lake City USA, poster presen-tation, p. 1430
11. Toussaint N, Stoeck CT, Schaeffter T, Sermesant M, and Kozerke S, Cardiac Laminae Structure Dynamics from In-vivo Diffusion Tensor Imaging, ISMRM 2013, Salt Lake City USA, oral presentation, p. 484 summa cum laude award
12. von Deuster C, Stoeck CT, Giese D, Harmer J, Chan RW, Atkinson D, and Kozerke S, Concurrent dual-slice cardiac DTI of the in-vivo human heart, ISMRM 2013, Salt Lake City USA, poster presentation, p. 2099
13. Harmer J, Toussaint N, Pushparajah K, Stoeck CT, Chan RW, Razavi R, Atkinson D, Kozerke S, In-vivo Diffusion Tensor Imaging of the Systemic Right Ventricle at 3T, ISMRM 2013, Salt Lake City USA, poster presentation, p. 3098
14. Harmer J, Stoeck CT, Chan RW, Atkinson D, Kozerke S, In-Vivo High Resolution Dif-fusion Tensor Imaging of the Human Heart at 3T:Fat Suppression in the presence of B0 field inhomogeneities, ISMRM 2013, Salt Lake City USA, poster presentation, p. 3206
15. Weiss K, Summermatter S, Stoeck CT, Kozerke S, Compensation of signal loss due to cardiac motion in point-resolved spectroscopy of the heart, ISMRM 2013, Salt Lake City USA, poster presentation, p. 1363
16. Chan RW, Kozerke S, Giese D, Harmer J, Stoeck CT, von Deuster C, Aitken A, Atkin-son D, Characterization and Correction of Eddy-Current Artifacts in Unipolar and Bi-polar Diffusion Sequences using a Field-Monitoring Approach: Application to Renal Diffusion Tensor Imaging (DTI), ISMRM 2013, Salt Lake City USA, poster presenta-tion, p. 2576
17. Schneeweis C, Schnackenburg B, Stoeck CT, Berger A, Hucko T, Fleck E, Kelle S, Messroghli D, Gebker R, Characterization of myocardium and myocardial motion in
153
List of Publications
patients considered for transaortic valve implantation (TAVI) , SCMR 2013, San Francisco USA, poster presentation
18. Stoeck CT, Toussaint N, Boesiger P, Kozerke S, Dual heart-phase cardiac DTI using Local-look STEAM, ISMRM 2012, Melbourne Australia, oral presentation, p. 227 summa cum laude award
19. Toussaint N, Stoeck CT, Kozerke S, Semesant M, Schaeffter T, Statistical Atlas of the Human Left Ventricular Fibre Architecture using In-Vivo DT-MRI, ISMRM 2012, Mel-bourne Australia, oral presentation, p. 227 magna cum laude award
20. Stoeck CT, Toussaint N, Boesiger P, Batchelor PG, Kozerke S, Sequence timing opti-mization in multi-slice diffusion tensor imaging of the beating heart, ISMRM 2011, Montréal Canada, oral presentation, p. 282
21. Stoeck CT, Nezafat R, Boesiger P, KozerkeS, 3D Whole Heart CSPAMM tagging in a single Breath hold using k-t-PCA, ISMRM 2010, Stockholm Sweden, oral presenta-tion, p. 483
22. Toussaint N, Stoeck CT, Sermesant M, Kozerke S, Batchelor P, Three-dimensional Prolate Spheroidal Extrapolation for Sparse DTI of the In-vivo Heart, ISMRM 2010, Stockholm Sweden, oral presentation, p. 758
23. Stoeck CT, Peters DC, Han Y, Kissinger KV, Goddu B, Goepfert L, Manning WJ, Kozerke S, Nezafat R, On-resonant binomial pulse preparation for magnetic transfer contrast enhanced coronary vein imaging, ISMRM 2009, Honolulu Hawaii, poster presentation, p. 1893
24. Stoeck CT, Crean A, Greenwood JP, Boesiger P, Plein S, Kozerke S, In-vivo compari-son of CSPAMM and DENSE for cardiac motion analysis, ISMRM 2009, Honolulu Hawaii, poster presentation, p. 1816
25. Hu P, Stoeck CT, Peters DC, Kissinger KV, Goddu B, Goepfert L, Rofsky N, Manning N, Nezafat R, Quantification of Pulmonary Vein Off-Resonance Frequency Through Cardiac Cycle: Implications for Non-Contrast PV MRA, ISMRM 2009, Honolulu Ha-waii, poster presentation, p. 3933
26. Stoeck CT, Kozerke S, Maredia N, Crean A, Greenwood JP, Plein S, In-vivo compari-son of DENSE and CSPAMM for cardiac motion analysis, SCMR 2009, Orlando USA, poster presentation
27. Hu P, Stoeck CT, Peters DC, Kissinger KV, Goddu B, Goepfert L, Manning WJ, Nezaf-at R, Coronary MRI with induced vasodilation using isosorbide dinitrate, SCMR 2009, Orlando USA, poster presentation
28. Stoeck CT, Peters DC, Han Y, Goddu B, Manning WJ, Kozerke S, Nezafat R, Whole Heart Coronary Vein Imaging, ISMRM 2008, Toronto Canada, poster presentation
29. Nezafat R, Stoeck CT, Bengani P, Peters DC, Hauser T, Rofsky N, Manning WJ, Non-Contrast Pulmonary Vein Angiography using Off-Resonance RF Excitation, ISMRM 2008, Toronto Canada, poster presentation
154
30. Hu P, Stoeck CT, Peters DC, Manning WJ, Nezafat R, Off-resonance effect of non-contrast pulmonary vein imaging, Magnetic Resonance Angiography Workshop 2008, Graz Austria
155
List of Publications
156
Acknowledgements
Acknowledgements
First of all I would like to thank my thesis advisor Prof. Sebastian Kozerke. Besides
guiding me through the endeavor of conducting research in a very competitive field, I
am grateful for his insights into academic politics and his help with my first steps
towards an independent academic career. He managed to keep me on track, whenever
I was wandering off different paths. My stubbornness might have led to some gray hair
though, for which I want to apologize.
I also want to thank my co-examiners Prof. Gábor Székely and Dr. David Atkinson for
agreeing on being referees for this thesis as well as providing feedback.
This thesis marks a break point of a timeline that goes back a few years. Along my
journey in MRI-science I had the ability to meet a crowd of funny, helpful and inspiring
people. I would like to thank the people responsible getting me in touch with MRI:
Prof. Markus Rudin, Dr. Christof Baltes, Dr. Thomas Müggler and the Animal Imaging
Center crew under whose supervision I made my first MR related scientific steps. Next
stop was former head of institute Prof. Peter Bösiger, who despite not having met me
before, supported my wish to conduct my master project in Boston. He deserves my
thanks and respect, also for establishing a relaxed but successful working environment,
and not to be forgotten granting me money to book the conference accommodation
for half the institute’s staff in Honolulu within the first six months of my PhD studies.
In Boston my way crossed Prof. Warren Manning’s and Prof. Reza Nezafat’s who I
thank for their warm welcome and the ongoing support. My project advisor Reza made
science look fun and easy, with his open minded and very calm approach to nearly
everything. In the end this experience contributed significantly to my conclusion of
staying in cardiac MR upon return to Zurich.
157
Acknowledgements
At this point I will break with the motto of the cardio team and throw out a
compliment: You guys rock! At first, a big Thank you to the “old” cardio squad: Verena,
Kilian, Rudi, Johannes, Lukas and Daniel, for forming my PhD-family. A big hug to
Verena, our “chief of staff” at ETZ F 61.2, and Rudi as her deputy. I would have to
thank Johannes for his continuous IT support for the entire office, but more
importantly and together with Lukas, Kilian and Daniel for their friendship beyond
office hours. Kilian, I hereby accept the draw in our fight for desk domination. I also
want to thank Nicolas Toussaint who not only added the necessary amount of chaos to
science, but also well complimented my work on data acquisition strategies by his PhD
studies on data reconstruction and evaluation. Even considering the sorrow hours
every PhD-student has to go through, I had a great time and the cardio family played a
major role. The bar has been set high for the next generation to come, but some say
that they will be capable of handling it. The “old” cardio team has been gradually
replaced by the “new” gang: Julia, Constantin, Max, Patrick, Claudio, Christian, Georg,
Adrian, Jonas, Kerem, Zsófia and Martin Genet; and I am grateful to them, that the
tradition of having a good social environment has not come to an end. A special Thanks
goes to Constantin who was brave enough to join the cardiac-DTI team, thereby
doubling its man-power, and on top joining in for the regular night shifts and weekend
scanning sessions.
I would like to thank the MDs: Robert Manka, Markus Niemann, Alexander Gotschy,
Andrei Manoliu, Maximilian Emmert, Nikola Cesarovic, Thea Fleischmann and Miriam
Lipiski for giving me insights into the medical and not-so-medical part of clinics and
veterinary medicine. Similarly I have to thank Christina Heep, Anja Struwe, Ines Bühler
and Simone Kaufmann who have always been incredibly patient whenever I was
interfering with their tight patient schedule, acquiring some extra data or crashing the
MR-system.
Thank you to the Gastro/Diffusion team: Jelena aka. Jelly, Caro, Robert and Tobias who
I consider part of the PhD-family I “grew up” with. I keep a lot of good memories!
My gratitude also goes to Marianne Berg who has been managing the institute ever
since I started here, helping me with all administrative issues in an exceptional way,
158
Roger Lüchinger for his help whenever the MRI-scanner did not agree with me and
thought of shutting down, crashing or surprising me with some arbitrary error
messages as well as Bruno Willi responsible that IT was in order. Furthermore I would
like to thank Martin Bührer and Gérard Crelier for providing their software and
software support.
The IBT-experience would not have been the same without all the fellow PhD students
at the institute. Especially without Johanna, Max and Lars who started the same time
as I did. Not to forget the Hardware and Spectro groups that contributed to the very
appealing working and post-working environment.
Finally and most of all I want to thank my family. I would not have been able to reach
this stage, without their unconditional support and efforts, which showed me that
every challenge can be overcome. I am grateful for my aunts’, my uncles’ and
especially my grandparents’ support, insuring, that none of the doors you find along
the way is locked for me. With this I would like to thank my sister Ina, for being the
most important key. Over the years I have had many opportunities to glance at the big
picture of the world, which I consider a privilege I owe my family.
Thank You!
159
Acknowledgements
160
Curriculum Vitae
Curriculum Vitae
Personal information
Name: Christian Torben Stoeck
Date of Birth: June 10th, 1984 in Hannover, Germany
Citizenship: German
Education & Affiliation
09/2008-09/2014 PhD candidate
Supervisor: Prof. Dr. Sebastian Kozerke
Institute for Biomedical Engineering
Department of Information Technology and Electrical Engineering
ETH Zurich, Zurich, Switzerland
10/2007-10/2013 Associate in Medicine
Harvard Medical School Boston, USA
09/2007-03/2008 Diploma in Physics
ETH Zurich, Zurich, Switzerland
10/2007- 03/2008 Diploma thesis
Title: “Optimization of Coronary Vein MRI using on-resonance Magnetization Transfer”
Supervision: Prof. Dr. Sebastian Kozerke, Prof. Dr. Reza Nezafat
Beth Israel Deaconess Medical Center
Division of Cardiology
Harvard Medical School Boston, USA.
161
Curriculum Vitae
06/2005-07/2006 ERASMUS exchange
The Royal Institute of Technology / KTH Stockholm, Sweden
05/2003 High-School
Friedrich-Hecker-Gymnasium, Radolfzell am Bodensee, Germany