Magneto-optic Response of the Metallic Antiferromagnet Fe 2 As to Ultrafast Temperature Excursions Kexin Yang, 1, 2 Kisung Kang, 2, 3 Zhu Diao, 2, 4, 5 Arun Ramanathan, 6, 7 Manohar H. Karigerasi, 6, 7 Daniel P. Shoemaker, 6, 7 Andr´ e Schleife, 6, 7, * and David G. Cahill 6, 7, † 1 Department of Physics, University of Illinois at Urbana-Champaign, Urbana, Illinois, 61801 2 Materials Research Laboratory, University of Illinois at Urbana-Champaign, Urbana, Illinois, 61801 3 Materials Science and Engineering, University of Illinois at Urbana-Champaign, Urbana, Illinois, 61801 4 Department of Physics, Stockholm University, SE-106 91 Stockholm, Sweden 5 School of Information Technology, Halmstad University, P.O. Box 823, SE-301 18 Halmstad, Sweden 6 Materials Research Laboratory, University of Illinois at Urbana-Champaign 7 Materials Science and Engineering, University of Illinois at Urbana-Champaign (Dated: November 12, 2019) The linear magneto-optical Kerr effect (MOKE) is often used to probe magnetism of ferromagnetic materials, but MOKE cannot be applied to collinear antiferromagnets due to the cancellation of sub-lattice magnetization. Magneto-optical constants that are quadratic in magnetization, however, provide an approach for studying antiferromagnets on picosecond time scales. Here, we combine transient measurements of linear birefringence and optical reflectivity to study the optical response of Fe2As to small ultrafast temperature excursions. We performed temperature dependent pump- probe measurements on crystallographically isotropic (001) and anisotropic (010) faces of Fe2As bulk crystals. We find the largest optical signals arise from changes in the index of refraction along the z-axis, perpendicular to the N´ eel vector. Both real and imaginary parts of the transient optical birefringence signal approximately follow the temperature dependence of the magnetic heat capacity, as expected if the changes in dielectric function are dominated by contributions of exchange interactions to the dielectric function. I. INTRODUCTION Antiferromagnetic materials are under intense investi- gation as a new generation of spintronic materials be- cause of their robustness to external magnetic fields and ultrafast dynamics, as it manifests itself, for instance, in a higher resonance frequency, compared to ferromagnets [1–5]. Characterization of the structure and dynamics of the magnetic order parameter is essential for spintron- ics research but is difficult to achieve in antiferromagnets (AFs). Magneto-optical effects are often a valuable tool for probing magnetic order; for example, much of what is known about the dynamics of ferromagnetic and fer- rimagnetic materials comes from studies that make use of the linear magneto-optical Kerr effect (MOKE) [6, 7]. Linear MOKE is also an essential tool for imaging the structure of magnetic domains [6, 8]. For typical AFs, however, linear MOKE is absent. Application of linear MOKE in the study of AFs is mostly limited to AFs with weak ferromagnetism due to canted magnetic mo- ments, e.g., in orthoferrites [9]. More recently, relatively large linear magneto-optic effects were observed in the non-collinear AF Mn 3 Sn [10, 11]. The structure and dynamics of the order parameter of AFs can be probed using interactions that are quadratic in the magnetization. For example, anisotropic magne- toresistance (AMR) depends on contributions to elec- tronic relaxation times that are quadratic in magneti- * [email protected]† [email protected]zation; AMR is sensitive to the domain structure of AFs [12]. More recently, AMR was used to read the spin con- figuration of antiferromagnetic CuMnAs[13] and Mn 2 Au [14]. At X-ray wavelengths, magnetic linear dichroism (XMLD) probes the anisotropy of charge distributions that are quadratic in magnetization [15]. Magnetic linear birefringence and magnetic linear dichroism refers to anisotropies in the optical frequency dielectric function that are generated by terms that are second-order in the magnetization. The dielectric function and the second-order terms of magnetization are both second rank tensors; therefore, the quadratic magneto-optic coefficients form a fourth-rank tensor. Since changes in optical phase accumulate over the op- tical path length, weak magneto-optic effects are easier to study in transmission through optically transparent materials than in reflection from the surface of opaque materials [16]. For transparent materials, experimentalists usually study magnetic linear birefringence because polarimetry [16] can sensitively detect differences between the op- tical path lengths for light polarized along orthogonal directions of the sample. In cubic crystals, this experi- mental design can isolate the anisotropic contributions to the magneto-optic coefficients, i.e., contributions to the magneto-optic tensor that depend on the orientation of the N´ eel vector. Isotropic contributions to the dielectric function—i.e., contributions to the magneto-optic ten- sor that are independent of the orientation of the N´ eel vector—can also be significant and lead to effects that are often referred to as magneto-refraction [17]. The ori- entation of the magnetization of a material with a net
Transcript
Magneto-optic Response of the Metallic Antiferromagnet Fe2As to UltrafastTemperature Excursions
Karigerasi,6, 7 Daniel P. Shoemaker,6, 7 Andre Schleife,6, 7, ∗ and David G. Cahill6, 7, †
1Department of Physics, University of Illinois at Urbana-Champaign, Urbana, Illinois, 618012Materials Research Laboratory, University of Illinois at Urbana-Champaign, Urbana, Illinois, 61801
3Materials Science and Engineering, University of Illinois at Urbana-Champaign, Urbana, Illinois, 618014Department of Physics, Stockholm University, SE-106 91 Stockholm, Sweden
5School of Information Technology, Halmstad University, P.O. Box 823, SE-301 18 Halmstad, Sweden6Materials Research Laboratory, University of Illinois at Urbana-Champaign
7Materials Science and Engineering, University of Illinois at Urbana-Champaign(Dated: November 12, 2019)
The linear magneto-optical Kerr effect (MOKE) is often used to probe magnetism of ferromagneticmaterials, but MOKE cannot be applied to collinear antiferromagnets due to the cancellation ofsub-lattice magnetization. Magneto-optical constants that are quadratic in magnetization, however,provide an approach for studying antiferromagnets on picosecond time scales. Here, we combinetransient measurements of linear birefringence and optical reflectivity to study the optical responseof Fe2As to small ultrafast temperature excursions. We performed temperature dependent pump-probe measurements on crystallographically isotropic (001) and anisotropic (010) faces of Fe2Asbulk crystals. We find the largest optical signals arise from changes in the index of refractionalong the z-axis, perpendicular to the Neel vector. Both real and imaginary parts of the transientoptical birefringence signal approximately follow the temperature dependence of the magnetic heatcapacity, as expected if the changes in dielectric function are dominated by contributions of exchangeinteractions to the dielectric function.
I. INTRODUCTION
Antiferromagnetic materials are under intense investi-gation as a new generation of spintronic materials be-cause of their robustness to external magnetic fields andultrafast dynamics, as it manifests itself, for instance, ina higher resonance frequency, compared to ferromagnets[1–5]. Characterization of the structure and dynamics ofthe magnetic order parameter is essential for spintron-ics research but is difficult to achieve in antiferromagnets(AFs). Magneto-optical effects are often a valuable toolfor probing magnetic order; for example, much of whatis known about the dynamics of ferromagnetic and fer-rimagnetic materials comes from studies that make useof the linear magneto-optical Kerr effect (MOKE) [6, 7].Linear MOKE is also an essential tool for imaging thestructure of magnetic domains [6, 8]. For typical AFs,however, linear MOKE is absent. Application of linearMOKE in the study of AFs is mostly limited to AFswith weak ferromagnetism due to canted magnetic mo-ments, e.g., in orthoferrites [9]. More recently, relativelylarge linear magneto-optic effects were observed in thenon-collinear AF Mn3Sn [10, 11].
The structure and dynamics of the order parameter ofAFs can be probed using interactions that are quadraticin the magnetization. For example, anisotropic magne-toresistance (AMR) depends on contributions to elec-tronic relaxation times that are quadratic in magneti-
zation; AMR is sensitive to the domain structure of AFs[12]. More recently, AMR was used to read the spin con-figuration of antiferromagnetic CuMnAs[13] and Mn2Au[14]. At X-ray wavelengths, magnetic linear dichroism(XMLD) probes the anisotropy of charge distributionsthat are quadratic in magnetization [15].
Magnetic linear birefringence and magnetic lineardichroism refers to anisotropies in the optical frequencydielectric function that are generated by terms thatare second-order in the magnetization. The dielectricfunction and the second-order terms of magnetizationare both second rank tensors; therefore, the quadraticmagneto-optic coefficients form a fourth-rank tensor.Since changes in optical phase accumulate over the op-tical path length, weak magneto-optic effects are easierto study in transmission through optically transparentmaterials than in reflection from the surface of opaquematerials [16].
For transparent materials, experimentalists usuallystudy magnetic linear birefringence because polarimetry[16] can sensitively detect differences between the op-tical path lengths for light polarized along orthogonaldirections of the sample. In cubic crystals, this experi-mental design can isolate the anisotropic contributions tothe magneto-optic coefficients, i.e., contributions to themagneto-optic tensor that depend on the orientation ofthe Neel vector. Isotropic contributions to the dielectricfunction—i.e., contributions to the magneto-optic ten-sor that are independent of the orientation of the Neelvector—can also be significant and lead to effects thatare often referred to as magneto-refraction [17]. The ori-entation of the magnetization of a material with a net
2
magnetic moment can often be manipulated by an ex-ternal magnetic field; control of the orientation of theNeel vector of collinear AFs is more difficult. Therefore,the various elements of the fourth-rank tensor are moreaccessible to experiments on ferromagnets and weak fer-romagnets than AFs.
In 2017, Saidl et al. [18] reported their studies of thetime-resolved magneto-optic response of AF CuMnAs toa large temperature excursion, ∆T ∼ 100 K. CuMnAsfilms were grown epitaxially on GaP(001) substrates withthe z-axis, the hard magnetic axis of CuMnAs, parallel tothe surface normal. The magnetic structure of tetrago-nal CuMnAs has two degenerate magnetic domains withperpendicular Neel vectors in the x-y plane. For a 10nm thick CuMnAs layer, the authors observed a rota-tion of the polarization of the optical probe beam that isconsistent with magnetic linear birefringence. They ob-served that changes in the angle of polarization followed∆θ ∝ sin 2α, where α is the angle between the Neel vec-tor and the polarization of the probe beam.
In our work, we studied transient changes in the opticalfrequency dielectric function of the metallic AF Fe2As,produced by a small temperature excursion, ∆T ≈ 3 K.We acquired data for changes in birefringence and reflec-tivity using techniques that we refer to as time-domainthermo-birefringence (TDTB) and time-domain thermo-reflectance (TDTR). TDTB and TDTR signals are ac-quired using a pump-probe apparatus based on a highrepetition rate Ti:sapphire laser oscillator operating ata wavelength near 785 nm. We also measured the totalheat capacity of Fe2As as a function of temperature andisolated the magnetic contribution to the measured heatcapacity by subtracting the electronic and phonon heatcapacities calculated by density functional theory (DFT).
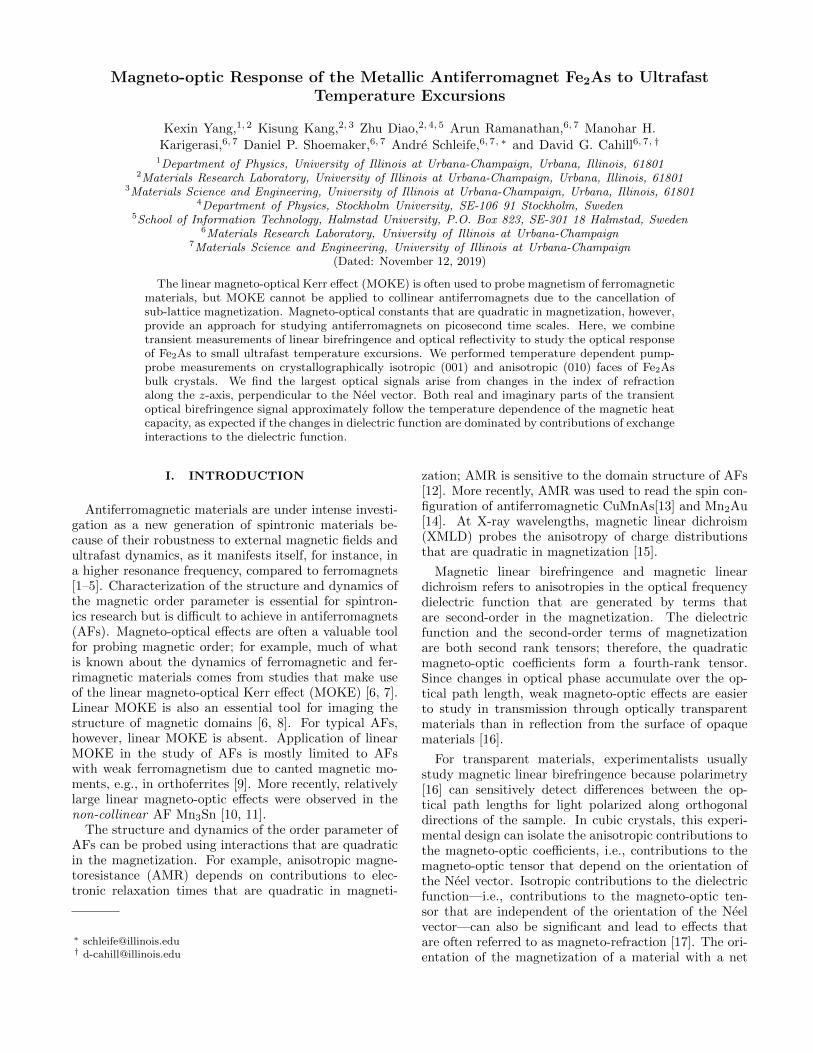
Fe2As crystallizes in the Cu2Sb tetragonal crystalstructure as shown in Fig. 1a [19]. Early neutron diffrac-tion studies showed that the spin magnetic momentsof Fe2As lie in x-y plane [19]. Subsequent studies bytorque magnetometry [20] at liquid nitrogen temperatureshowed that the vector has two degenerate orientationsin the x and y directions. The magnetic point group ofthis magnetic structure is mmm1′ [21]. The equivalenceof the x-axis and y-axis was supported by the magneticfield dependence of neutron diffraction at room temper-ature and close to the Neel temperature [22]. This typeof magnetic structure is typically referred to as a tetrag-onal “easy-plane” antiferromagnet [16]. The term “easy-plane” refers to the fact that the lowest energy orienta-tions of the Neel vector lie in the x-y plane. The term“easy-plane” does not exclude the possibility of small dif-ferences in energy for different orientations of the Neelvector within the x-y plane.
In the absence of magnetic order, the dielectric tensorof a tetragonal crystal is isotropic in the x-y plane. How-ever, if the Neel vectors have a preferred direction in thex-y plane, the dielectric function is anisotropic on lengthscales smaller or comparable to the characteristic size ofthe magnetic domains. We expect that the Neel vector of
different magnetic domains are randomly oriented alongthe x and y directions and that our laser beam size islarge compared to the domain size. Therefore, the dielec-tric function we measure in the x-y plane is isotropic. Weindeed do not observe a significant TDTB signal for the(001) surface of Fe2As. However, on the crystallograph-ically anisotropic (010) surface of the tetragonal crystal,we observed a strong TDTB signal for light polarized atan angle of 45 between the x and z axis of the crystal.We gain complementary insight by measuring the TDTRsignals for light polarized along the x and z axes.
Often, magnetic linear birefringence of magnetic ma-terials is attributed to the Voigt effect. The Voigt effectrefers to anisotropic contributions to the dielectric ten-sor that are parallel to the magnetization [16, 23]. How-ever, our data implies that the most significant changein the dielectric function is perpendicular to the Neelvector: ∆ε33 ∆ε11. Furthermore, the dependence ofthe TDTB signal on the sample temperature closely re-sembles the magnetic heat capacity, suggesting a pro-portionality between the temperature dependence of theexchange energy and the temperature dependence of thez-element of the dielectric function ε33.
Our experiments also provide insight into the ultra-fast magnetization dynamics of Fe2As. By comparingchanges in the magneto-optical response at short andlong time-scales, we also evaluate the importance of mag-netostriction to magnetic linear birefringence in this ma-terial.
II. EXPERIMENTS
A. Experimental Details
Single crystals of Fe2As were synthesized from themelt. Stoichiometric amounts of elemental Fe and As(99.8% and 99.999%, Alfa Aesar) were ground inside anargon filled glove box in an agate mortar and pestle. Thepowder mixture was loaded in a 6 mm-diameter fused sil-ica tube and sealed under vacuum. The tube was heatedto 700C and held for 24 h, then 1000C for 2 h, with5C/min ramp rate. The tube was cooled to 900C in20 h, then cooled at 5C/min to obtain shiny gray crys-tals of Fe2As. The phase purity of the sample was con-firmed using powder X-ray diffraction on a Bruker D8diffractometer with Mo Kα source and LYNXEYE XEdetector in the transmission geometry. Rietveld refine-ments were performed using TOPAS 5. The lattice con-stants at room temperature are a = 3.63 A, c = 5.98 A.
Before optical measurements, the Fe2As sample waspolished along the (001) and (010) orientation with an Al-lied Multiprep automatic polisher with diamond lappingfilms down to 0.3 µm. The orientation was observed viaX-ray diffraction pole figures. The miscut of the surfacesis within 10. After polishing, the sample was ion-milledfor 5 min using a broad-beam Ar ion source operating at250 V and 60 mA.
3
TDTB and TDTR measurements were done with apump-probe system that employs a Ti:sapphire laser witha 80 MHz repetition rate and 783 nm center wavelength.The spectral linewidth of the output of the laser is 12nm. We use sharp-edge optical filters to spectrally sep-arate the pump and probe [24]. The full-width-half-maximum of the pump-probe correlation is 1.1 ps. Thepump beam is modulated at 10.8 MHz and the probebeam is modulated at 200 Hz. A half-wave plate wasplaced in the probe beam path to orient the polarizationof probe beam. For TDTB experiments, the transientchange in the polarization or ellipticity of the probe wascaptured by a balanced photodetector; in TDTR experi-ments, the transient reflection was measured by a singleSi photodetector [25]. The 1/e laser spot size of both thefocused pump and probe beams is 5.5 µm. The fluenceof the pump is 0.22 J/m2, which created a steady-stateheating of ≈ 13 K and transient heating of ≈ 3 K on thesample surface. The zero of time delay was determinedwith a GaP two-photon photodetector. For temperature-dependent measurements, the sample was mounted on atemperature-controlled microscope stage in a vacuum of∼ 1 mTorr.
We performed first-principles calculations using den-sity functional theory (DFT) as implemented in the Vi-enna Ab-Initio Simulation Package [26–28] (VASP). Thegeneralized-gradient approximation (GGA) formulatedby Perdew, Burke, and Ernzerhof [29] (PBE) is usedto describe exchange and correlation. The projector-augmented wave [30] (PAW) scheme is used to describethe electron-ion interaction. To sample the Brillouinzone, a 15 × 15 × 5 Monkhorst-Pack (MP) [31] k-pointgrid is used and the Kohn-Sham states are expanded intoplane waves up to a cutoff energy of 600 eV. Total en-ergies are converged to self-consistence within 10−6 eV.Noncollinear magnetism and spin-orbit coupling are in-cluded and the magnetic unit cell of Fe2As is used to com-pute relaxed atomic geometries, electronic structure, andoptical properties. Phonon dispersion is computed usingfinite displacement method as implemented in VASP andextracted using the phonopy package [32]. After conver-gence test, a 3× 3× 2 supercell and 4× 4× 4 MP k-pointgrid is used. For the phonon calculations, non-collinearmagnetism and spin-orbit coupling is included.
B. Optical and Thermal Properties
First, we discuss measurements of refractive index,electrical conductivities, heat capacity, and thermal con-ductivities of Fe2As. We use the refractive indexto describe the optical properties of the material andto make connections between thermo-reflectance andthermo-birefringence data. We measure the total heatcapacity and use density function theory to calculate theelectronic and phonon contributions to the total heatcapacity. We attribute the heat capacity that is unac-counted for by electrons and phonons to the magnetic
(a)
(b)
FIG. 1: (a) Tetragonal magnetic unit cell of Fe2As.Arsenic atoms are depicted as green spheres; Fe asbrown spheres. Arrows denote the local magnetic
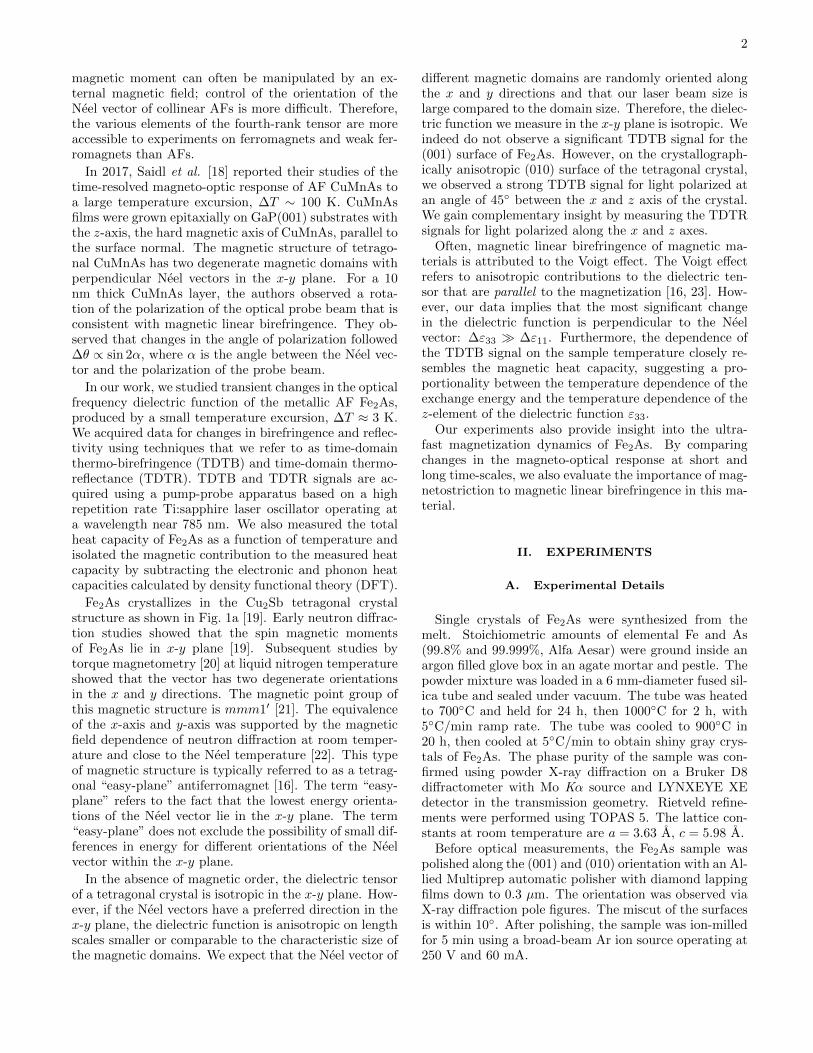
moment of the Fe atoms. Fe atoms labelled with thesame color arrows (blue or pink) are crystallographicallyequivalent. The Cartesian coordinates x, y, z are alignedalong the crystallographic a, b, c axes. (b) Experimental
geometry for time-domain thermo-birefringence(TDTB) and time-domain thermoreflectance (TDTR)experiments with the probe beam normal to the (010)face of the Fe2As crystal. In TDTR measurements, the
polarization of the probe is along x or z. In TDTBmeasurements, the polarization of the electric field E of
the probe is at an angle of 45 from the x axis.
heat capacity and compare the magnetic heat capacity tothe temperature dependent TDTB data. From the heatcapacity and thermal conductivity, we model the time-evolution of the temperature excursion created by thepump optical pulse. Finally, the combination of the mea-sured electrical conductivity and the Wiedemann-Franzlaw allows us to separate the electronic and lattice con-tributions to the total thermal conductivity.
First-principles density functional theory (DFT) cal-culations give the ground-state lattice parameters asa = 3.624 A and c = 5.860 A, within 2% of powder
4
X-ray diffraction measurements at room temperature,a = 3.628 A and c = 5.978 A. The magnetic unit cellused in the calculation is twice as long in the z direction.The Neel vector in ground-state DFT calculations is ori-ented along the x direction of the lattice. We confirmedthe easy-plane magnetic structure by measuring the tem-perature dependent magnetic susceptibilities along the xand z crystallographic directions with a vibrating samplemagnetometer.
We measured an effective isotropic refractive index ofFe2As by spectroscopic ellipsometry of the (001) and(010) faces of the crystal. Immediately prior to the ellip-sometry measurements, which take place under ambientconditions, we removed surface oxides and contaminantsusing argon ion beam milling. The effective isotropic re-fraction index is n = 2.9+i3.3 at a wavelength of λ = 780nm. The optical reflectance calculated from this index ofrefraction is 0.56. The measured optical reflectance forboth the (001) and (010) surfaces of the crystal at normalincidence and λ = 780 nm is 0.50. The optical absorptiondepth, λ/(4πk), is 19 nm. The refractive index computedusing DFT, for light polarized along the x, y and z-axis ofthe crystal is ni =
√εii = 4.295 + i3.496, 4.300 + i3.501
and 3.381 + i4.039 at 0 K, with a reflectance of 0.573,0.574 and 0.619, respectively.
The electrical resistivity of a polycrystalline sampleof Fe2As was reported previously as ρ ≈ 220 µΩ cm atT = 300 K [33]. The electrical resistivity has a shal-low maximum near room temperature and decreases to≈ 125 µΩ cm at T = 1 K. The electrical resistivity of oursamples near room temperature is ρ = 240 µΩ cm; theresidual resistivity ratio (RRR), the resistivity at 300 Kdivided by the resistivity at 7 K, is 1.7. We attribute thesmall RRR to Fe vacancies. The stoichiometry of Fe2Aswas evaluated using Rutherford backscattering spectrom-etry and Rietveld refinements to synchrotron X-ray andneutron diffraction data (see Supplemental Materials).These measurements converge on a Fe deficiency of 0.05to 0.08 out of 2. This value also agrees with the nominalFe:As ratio used during synthesis (1.95:1). (Nominally2.00:1 samples exhibit metallic Fe impurities.)
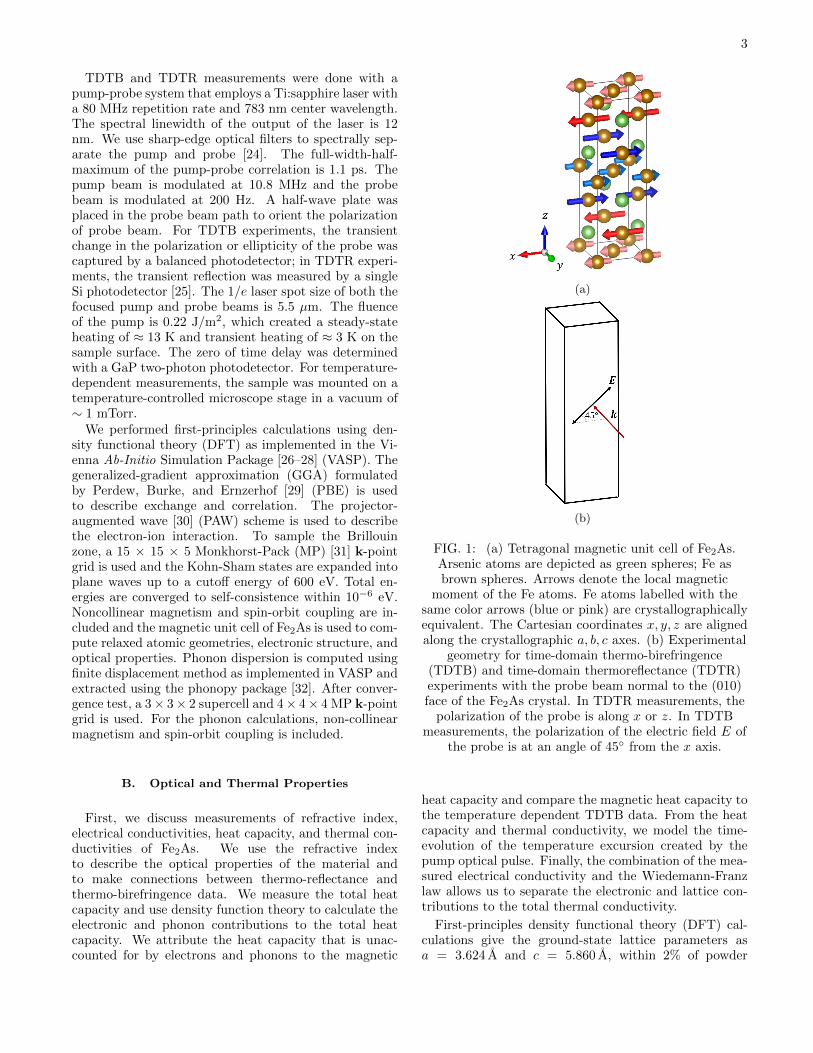
We measured the total heat capacity of a 35.5 mg sam-ple of Fe2As with a Quantum Design Physical PropertyMeasurement System (PPMS), see Fig. 2a. As we dis-cuss below, we expect that the temperature derivative ofthe magnetic contribution to the dielectric function willbe proportional to the magnetic heat capacity. The to-tal heat capacity includes, however, contributions fromelectrons, phonons, and magnetic excitations. We isolatethe magnetic contribution Cm to the measurement of thetotal heat capacity Ctot by subtracting the electron andphonon heat capacities calculated with density functionaltheory (DFT). Cm = Ctot−Ce−Cph. We computed theelectronic density of states using Mermin DFT [34] andfinite electronic temperatures between 0 K and 400 K,see Fig. 3a for 300 K. From this data we calculate theelectronic heat capacity Ce and electronic specific heatγ=7.41 mJ K−2 mol−1. The phonon heat capacity Cph
is calculated from the phonon density of states (DOS)of the ground state crystal structure and magnetic or-der, see Fig. 3b. The Debye temperature derived fromthe calculated phonon DOS is 286 K. Zocco et al. [33]reported a Debye temperature of 296 K for Fe2As froma linear fit of their data to C/T versus T 2.
Because lattice heat capacity dominates the total heatcapacity except at low temperatures, T < 15 K, smallerrors in the measurement of the total heat capacity, orsmall errors in the calculation of the phonon heat ca-pacity, produce large uncertainties in the magnetic heatcapacity. We do not yet understand the origin of thesmall peak in the heat capacity data near 110 K.
We also measured the thermal conductivity of Fe2Asnormal to the (001) and (010) faces of the crystal usingconventional TDTR measurements and modeling [35] asshown in Fig. 2b. An 80 nm thick Al film was sput-tered on the sample to serve as the optical transducerin the thermal conductivity measurement. The electri-cal contribution to the thermal conductivity was esti-mated using the combination of the Wiedemann-Franzlaw and the measured electrical resistivity. The ther-mal conductivity shows a small anisotropy at T > 300 K(see Fig. 2b). Contributions to the thermal conductivityfrom phonons and electronic excitations are comparable.The phonon contribution, i.e. the difference between themeasurement and the electronic contribution, is approxi-mately 3.6 W K−1 m−1 and independent of temperature.
C. Time-domain Thermo-birefringence andTime-domain Thermoreflectance
Time-domain thermo-birefringence (TDTB) and time-domain thermoreflectance (TDTR) probe transientchanges in the optical frequency dielectric function ofFe2As induced by excitation of the sample by the pumpbeam. We use TDTR to measure changes in the diagonalelements of the dielectric tensor by fixing the probe po-larization along various crystallographic directions andmeasuring transient changes in the intensity of the re-flected probe pulse. We use TDTB to measure changesin differences between diagonal elements of the dielectrictensor through transient changes in the polarization ofthe reflected probe pulse. For both TDTB and TDTR,the strongest signals we have observed are for pump andprobe beams at normal incidence on the crystallograph-ically anisotropic (010) surface of Fe2As.
The dielectric function tensor of Fe2As is diagonal inthe coordinate system defined by the crystal axes; off-diagonal elements of dielectric tensor are zero [21] forthe mmm1′ magnetic point group. In our experiments,heating by the pump optical pulse creates changes in thethermal distribution of magnetic excitations. In otherwords, in our experiments, the excitations created bythe pump are incoherent. The situation is different inpump-probe experiments that create coherent excitationsof magnons. For example, in a recent study of the cubic
5
10 10010-3
10-2
10-1
100
101
T (K)
Ce
Cm
Cph
Ctot
C (J
K-1
cm
-3)
(a)
200 250 300 350 4000
2
4
6
8
10
L (W
K-1
m-1
)
Temperature (K)
(001) face
(100) face
Electrical contribution
(b)
FIG. 2: Heat capacity and thermal conductivity of Fe2As.(a) The measured total heat capacity Ctot of Fe2As andcontributions to Ctot from excitations of electrons (e),
phonons (ph), and magnons (m). The electronic and phononcontributions are calculated by density functional theory
(DFT). The magnon contribution is derived by subtractingthe calculated phonon and electronic contributions from Ctot
. (b) The thermal conductivity in the direction normal tothe (001) face (black circles) and (100) face (blue circles)
shows a small anisotropy. The electrical contribution to thethermal conductivity (green circles) is calculated from theWiedemann-Franz law and measurements of the electrical
conductivity.
collinear antiferromagnet KNiF3 [36], both diagonal andoff-diagonal elements of the dielectric tensor contributeto magnetic linear birefringence because the circularly-polarized pump pulse excites a coherent magnon thatbreaks the underlying magnetic symmetry.
The TDTB measurement geometry is shown in Fig. 1band the measurement results for the Fe2As (010) face areshown in Fig. 4. In the discussion that follows, the sym-bol ∆ indicates a transient quantity. To measure tran-sient changes in the real part of the polarization rota-tion, Re[∆Θ] = ∆θ, we null the balanced detector witha half-wave plate. (This half-wave plate is positionedimmediately before the Wollaston prism that splits the
!"
#
"
#
$%&'(
)*+&,
-
. / 0 . 1 2 3 1 4"!#"567
(a)
!
"
#
$
%
!
&'()*(+,-./0123
4 5 6 47 8 9 7 !:!;<=
(b)
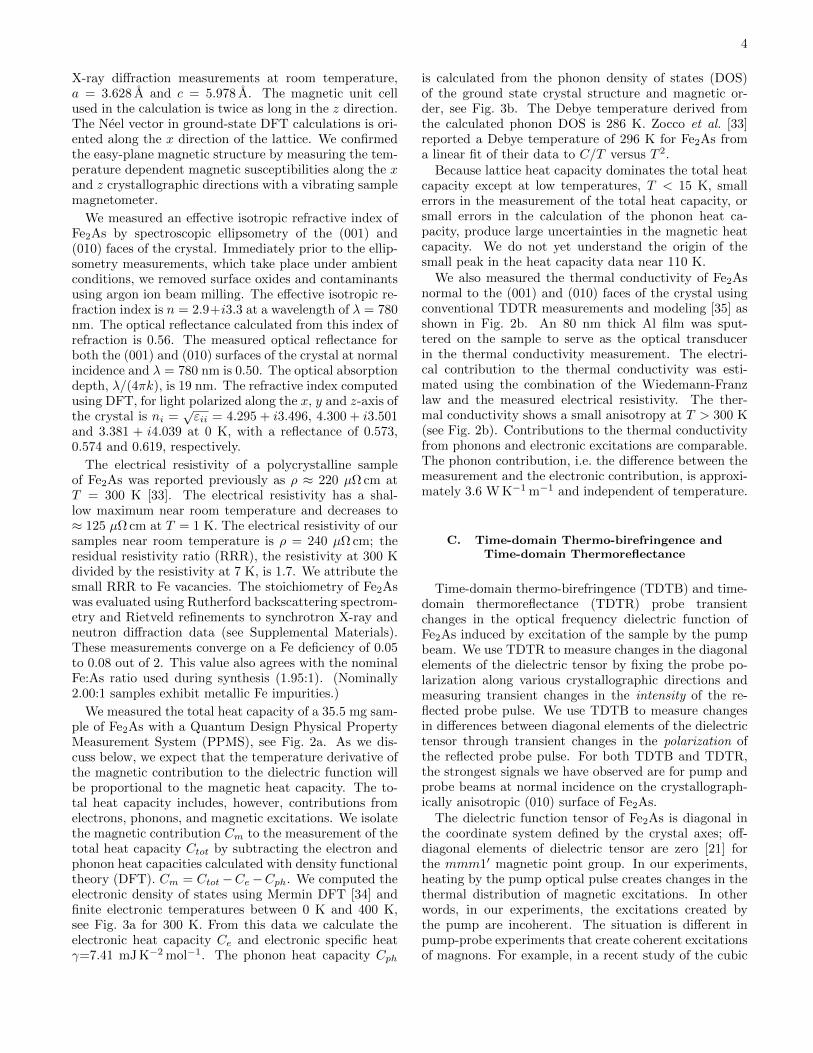
FIG. 3: (a) Calculated electronic band structure andelectronic density of states (DOS) of Fe2As. The
electronic band structure includes spin-orbit couplingeffects through a non-collinear magnetism calculation.(b) Calculated phonon dispersion and phonon DOS ofFe2As. For (a), the units of the electronic DOS are thenumber of states per magnetic unit cell per eV; for (b),the units of the phonon DOS are the number of states
per magnetic unit cell per THz.
orthogonal polarizations into two paths that are focusedonto the two photodiodes of the balanced detector [25].)To measure transient changes in the imaginary part ofthe rotation, i.e., the ellipticity Im[∆Θ] = ∆κ, we nullthe balanced detector with a quarter-wave plate. Thepolarization of the probe-beam is in the x-z plane and45 from the x axis. Corresponding TDTR data for the(010) face of Fe2As is shown for the two orthogonal po-larizations in Fig. 5.
Optical reflectance R is the ratio of the intensity of thereflected electrical field to the intensity of the incidentelectric field: Rz = |rz|2 and Rx = |rx|2 where rz and rxare the Fresnel reflection coefficients for light polarizedalong the z and x directions, respectively. ri = (ni −1)/(ni + 1) with n2i = εii; εii are the diagonal elementsof the dielectric tensor.
The birefringence of Fe2As is relatively small. Wetherefore define average quantities n = (nx + nz)/2;ε = n2; and r = (n − 1)/(n + 1). The complex rotationof the polarization of the reflected probe light is then
Θ ≈ (rx − rz)2r
≈ (nz − nx)
(1− n2)≈ (εzz − εxx)
2√ε(1− ε)
. (1)
6
We use Eq. 1 to relate the polarization rotation angle todifferences in the index of refraction or differences in thedielectric function. We evaluate Eq. 1 using the mea-sured refractive index n = 2.9 + i3.3. The real and imag-inary parts of the TDTB signal can then be written as∆θ = 0.005(∆ε′zz − ∆ε′xx) − 0.003(∆ε′′zz − ∆ε′′xx) and∆κ = 0.003(∆ε′zz −∆ε′xx) + 0.005(∆ε′′zz −∆ε′′xx), whereε′ii and ε′′ii are the real and imaginary parts of the relativedielectric tensor.
Because the reflectance Ri is a function of the com-plex dielectric function εii, the TDTR signal can beexpanded as ∆R = ∂R
∂ε′ ∆ε′ + ∂R
∂ε′′ ∆ε′′. After taking
partial derivative of reflectance and inserting the di-electric function calculated from the measured refrac-tive index, the transient reflectance can be written asa linear combination of transient dielectric functions,∆Ri = −0.01∆ε′ii + 0.007∆ε′′ii.
We note that the difference in the TDTR measure-ments along x and z closely resembles the real part ofthe TDTB signal, ∆θ. This is because the linear coef-ficients of the transient changes in the elements of thedielectric tensor that contribute to ∆Rx − ∆Rz are ap-proximately twice the linear coefficients of the transientchanges in the elements of the dielectric tensor that con-tribute to ∆θ. In other words, ∆θ ≈ −(∆Rz −∆Rx)/2.Alternatively, if we write the complex TDTB signal asan amplitude and phase in the form ∆Θ = |z|eiδ, thereal part of the TDTB signal is ∆θ = |z| cos δ, while inTDTR measurement, ∆Rz −∆Rx = 2|z|.
The per pulse heating, i.e., the temperature excursionproduced by a single optical pulse of the pump beam,is ∆ ≈ 3 K. Due to the small temperature excursion,the change in the sublattice magnetization ∆M is smallcompared to the sublattice magnetization M , except forT very close to TN . This justifies a description of theexperiment in terms of linear response, except for T veryclose to TN .
Since the (010) face of a tetragonal crystal is funda-mentally anisotropic, we cannot directly interpret thesignals plotted in Fig. 4 as the result of changes in mag-netization with temperature. However, two aspects ofthe data suggest a prominent role of magnetism andmagneto-optic effects. First, the real part of the TDTBsignal (see Fig. 4a), and the TDTR signal measured withthe probe polarization along the z axis (see Fig. 5a), showa significantly slower response when the sample temper-ature is close to the Neel temperature, TN The transferof thermal energy in a magnetic material is often de-scribed by a three temperature model, in which energyis transferred between electrons, phonons, and magnonson ultrafast time-scales [6, 37]. Since the magnon con-tribution to heat capacity reaches a maximum at TN ,the temperature rise of the magnon system in responseto heating of the electronic system by the pump opticalpulse is expected to be slower at temperatures near TN .We attribute the slower response at T ≈ TN to this effectand conclude that the real part of the TDTB signal, andthe TDTR signal measured with polarization along the
0.1 1 10 100 10000
20
40
60 213 K 273 K 313 K 338 K 363 K 383 K
Time delay (ps)
Dq (m
rad)
(a)
0.1 1 10 100 10000
5
10
15
20
Dk (m
rad)
Time delay (ps)
243 K 273 K 313 K 349 K 363 K 383 K
(b)
FIG. 4: (a) The real part of the time-domainthermo-birefringence (TDTB) signal measured on the (010)
face of Fe2As; and (b) the imaginary part of the TDTBsignal. The temperature in the legend is the temperature ofthe sample stage; the spatially averaged temperature of the
area of the sample that is measured in the TDTBexperiment is the sum of the stage temperature and the
steady-state heating of 13 K. When stage temperature is at338 K, the temperature of the measured region of the
sample is close to TN = 350 K. Empty symbols denote dataacquired at T < TN ; filled circles are data for T > TN . Weattribute the slower response at T ≈ TN to the peak in the
magnetic heat capacity at TN .
z-axis, are dominated by changes in the magnon tem-perature. The slowing down of the demagnetization ofantiferromagnetic Fe2As at T ≈ TN is reminiscent of theslowing down of the demagnetization of ferromagneticFePt:Cu at T ≈ TC where TC is the Curie temperature[37].
Second, the temperature dependence of the transientTDTB and TDTR signals at fixed time delays closely fol-lows the magnetic heat capacity. In Fig. 6, we comparethe complex thermo-birefringence signals ∆Θ/∆T for the(010) plane of Fe2As and the magnetic heat capacity de-rived from Cm = Ctot − Cph − Ce. (Ctot is measured by
7
experiment and Cph and Ce are calculated by DFT.) Weuse TDTB data acquired at pump-probe delay times near100 ps when the electrons, magnons, and phonons are inthermal equilibrium, and the strain and temperature gra-dients within an optical absorption depth of the surfaceare small. As we discuss in more detail below, we expectthat for a single mechanism, the magnetic contributionto the dielectric function of an antiferromagnetic mate-rial will scale with the magnetic energy and, therefore,transient changes in the dielectric function produced bya small temperature excursion will scale with the mag-netic heat capacity Cm. At T ≈ TN , we expect that∆Θ/∆T will be more smoothly varying with T than Cmbecause of the inhomogeneous temperature distributionacross the lateral extent of the pump and probe beamsin the experiment.
In Fig. 6 we also include data for the temperaturedependence of ∆θ measured on the crystallographicallyisotropic (001) plane. We consistently observe a smallsignal that is approximately independent of position. Webelieve there are two mechanisms that contribute to thisnull result. For the (001) plane of Fe2As, the two degener-ate domain orientations should produce a cancellation ofany TDTB signal when measured on a length scale largecompared to the characteristic domain size. We have notyet determined the domain structure of our Fe2As crys-tals but evidence from related materials [38, 39] suggestthat the domain size is typically in the sub-micron rangewhile the 1/e2 radius of the pump and probe laser beamsis ≈ 5.5 µm. Furthermore, the lack of a significant TDTRsignal for light polarized along the x direction of the (010)face suggests that magnetic contributions to the εxx andεyy elements of the dielectric tensor are small. We ten-tatively attribute the small transient birefringence signalthat we observe on the (001) face to a small, uncontrolledmiscut of the sample, i.e., a small misorientation betweenthe surface normal and the c-axis of the crystal.
Since both the real ∆θ and imaginary ∆κ parts of theTDTB signals measured on the (010) face have a tem-perature dependence that resembles the magnetic heatcapacity, we conclude that both ∆θ and ∆κ have sig-nificant magnetic contributions. However, ∆θ and ∆κdo not have the same dynamics, see Fig. 4. In the ∆θdata set, with the exception of data collected at T ≈ TN ,the signal reaches a peak response at short delay timeson the order of 1 ps. We interpret this signal as aris-ing from the same type of out-of-equilibrium ultrafastdemagnetization that is typically observed for ferromag-netic materials using pump-probe measurements of first-order magneto-optic Kerr effects. However, we cannotyet reliably distinguish between magnetic, electronic, lat-tice temperature, and lattice strain contributions to ∆θor ∆κ.
In the ∆κ data set, the signal reaches a peak responseon a time-scale on the order of 10 ps. We interpret thistime scale as characteristic of the time needed to fully re-lax the thermoelastic stress within the near surface regionof the crystal that determines the reflection coefficients
of the probe beam. This interpretation is supported bythe character of the TDTR signal measured on the (001)face, see Fig. 6, that also includes a large variation in thesignal at t < 20 ps.
In most studies of the optical properties of materials,the thermal expansion of the material contributes to thetemperature dependence of the dielectric tensor. Our ex-periments take place in a different regime. Thermal stressis generated when the pump optical pulse is partially ab-sorbed by the near-surface region of the sample. Thermalstrain in the in-plane direction is strongly suppressed ina pump-probe experiments because the thermal penetra-tion depth, i.e., the depth of the heated region, is smallcompared to the lateral extent of the laser spot.
On the other hand, strain in the out-of-plane direc-tion can contribute to TDTB and TDTR signals. Theprobe beam is sensitive to the dielectric tensor of thenear-surface layer of the crystal that lies within an opti-cal absorption depth of the surface. On this length scale,strain normal to the surface evolves on a time scale givenby the optical absorption depth divided by the longitu-dinal speed of sound. The longitudinal speed of soundfrom our DFT calculations is ≈ 5 nm/ps. Therefore, thecharacteristic time-scale is ≈ 4 ps. At t 4 ps, strainnormal to the surface is negligible; at t 4 ps, stressnormal to the surface is negligible. On long time scales,the decay of the strain normal to the surfaces will followthe decay of the surface temperature as heat diffuses intothe bulk of the sample.
III. DISCUSSION
TDTB and TDTR signals are linearly related to tran-sient changes in the dielectric function, see Eq. 1. Thedielectric function tensor of magnetic materials can bewritten as [40]
εij = ε0ij +KijkMk
+GMMijklMkMl +GML
ijklMkLl +GLLijklLkLl , (2)
where the first term is the non-magnetic contribution toεij , Kijk are the first-order magneto-optical coefficients,andGijkl are the second-order magneto-optic coefficients.M is net magnetization , and L is the Neel vector. Be-cause the net magnetization is zero in a collinear AF, thelinear term, MkMl term and MkLl term can be neglectedhere, and we will use Gijkl to represent GLL
ijkl in whatfollows. We assume an equal population of magnetic do-mains with Neel vectors in the x and y directions.
To simplify the notation in the discussion below, weadopt the Voigt notation with, for example, G11, G12,and G31 replacing G1111, G1122, and G3311, respectively.The tetragonal point group symmetry of Fe2As has 6independent and non-zero elements of the second-ordermagneto-optic tensor: G11 = G22, G12 = G21, G13 =G23 = G31 = G32, G33, G44 = G55, and G66. We assume
8
0.1 1 10 100 10000
50
100
150
200
250
300
DRz/R
(ppm
)
Time delay (ps)
213 K 273 K 313 K 333 K 363 K 383 K
(a)
0.1 1 10 100 10000
5
10
15
20
25
30
DRx/R
(ppm
)
Time delay (ps)
213 K 273 K 313 K 333 K 363 K 383 K
(b)
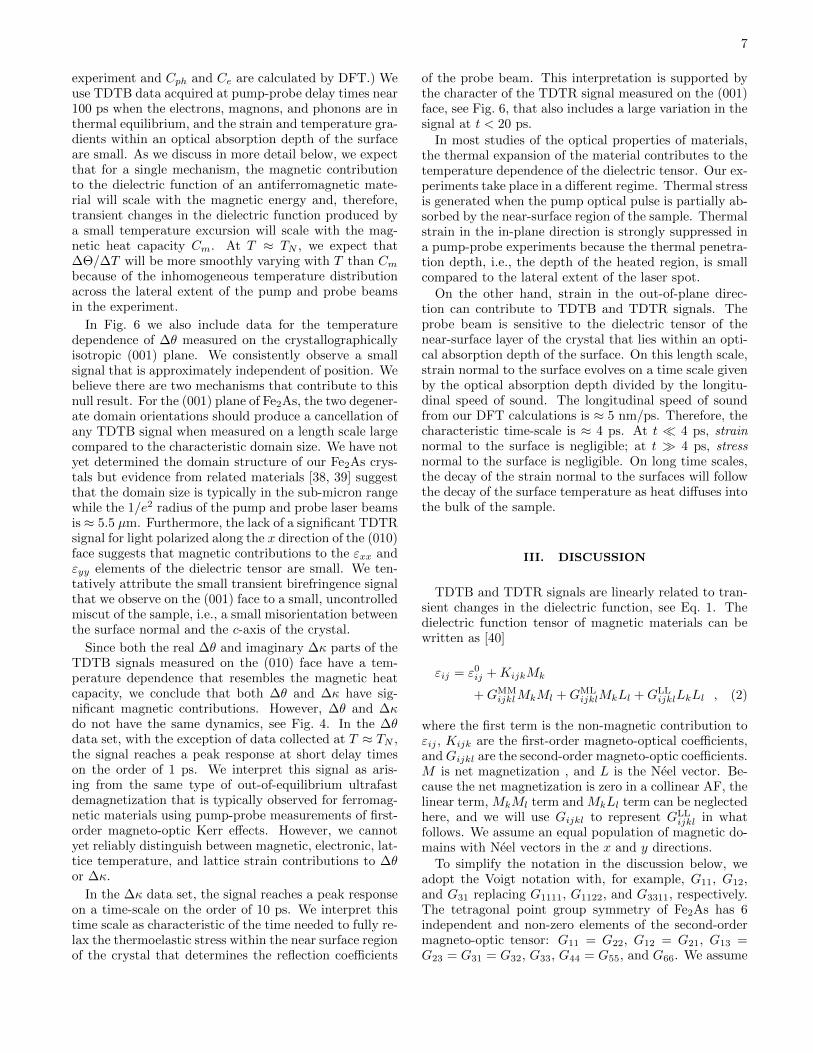
FIG. 5: (a) Time domain thermoreflectance (TDTR) datafor the (010) face of Fe2As with (a) probe polarization
aligned along the z-axis and (b) probe polarization alignedalong the x-axis. TDTR data for ∆Rz/∆T shown in panel
(a) is approximately an order of magnitude larger thanTDTR data for ∆Rx/∆T shown in panel (b). The
temperature in the legend is the temperature of the samplestage; the spatially averaged temperature of the area of the
sample that is measured in the TDTR experiment is thesum of stage temperature and the steady-state heating of 13
K. Empty symbols denote data for temperatures T < TN ;filled symbols are for data acquired at T > TN .
that there is no correlation in the sublattice magnetiza-tion along the z axis; therefore, terms that involve thez-component of magnetization are small and we do notneed to consider G33 or G44. With the Neel vectors con-strained to the x and y directions, the dielectric tensoris diagonal in the coordinate system of the crystal axesand we can also neglect G66. The remaining contribu-tions to the dielectric tensor involve three elements ofthe magneto-optic tensor:
ε11 = G11L21 +G12L
22 + ε011
ε22 = G11L22 +G12L
21 + ε022
ε33 = G31(L21 + L2
2) + ε033 .
(3)
The microscopic mechanisms that contribute to thesecond-order magneto-optic coefficients Gijkl include ex-change interactions, spin-orbit coupling, and magne-tostriction [16]. (Magnetostriction can be further dividedinto changes in the lattice parameters and, if the symme-try of the lattice is low enough, changes of the atomicpositions within a unit cell [41].) Exchange interactionsare usually assumed to dominate the isotropic contribu-tions to the elements of Gijkl, i.e., magnetic contributionsthat are independent of the orientation Neel vector. (Theterm “isotropic” does not imply that the magnetic con-tributions are the same for all elements of the dielectrictensor.) Spin-orbit interactions are usually assumed todominate anisotropic contributions to Gijkl, i.e., contri-butions that depend on the orientation of the Neel vec-tor. Isotropic contributions are larger than anisotropiccontributions in most materials [16, 42]. In collinear AFswith cubic symmetry, the anisotropic contribution to thedielectric function can be isolated from the isotropic con-tribution because birefringence can only be generated byanisotropic terms [16, 17].
Within the easy-plane of AFs with cubic, tetragonal,or hexagonal symmetry, optical birefringence can some-times be used to image magnetic domains [43] becausethe anisotropy of the dielectric tensor is coupled to theorientation of the Neel vector. In a recent study oftetragonal CuMnAs [18], the transient birefringence sig-nal measured in the x-y plane demonstrated the potentialof using the anisotropic Voigt effect for determining themagnetic domain structure of tetragonal AFs. We find,however, that the Voigt effect is small for Fe2As at thewavelength of our laser, λ = 783 nm, and we have notyet been able to use TDTB signals to study the magneticdomain structure.
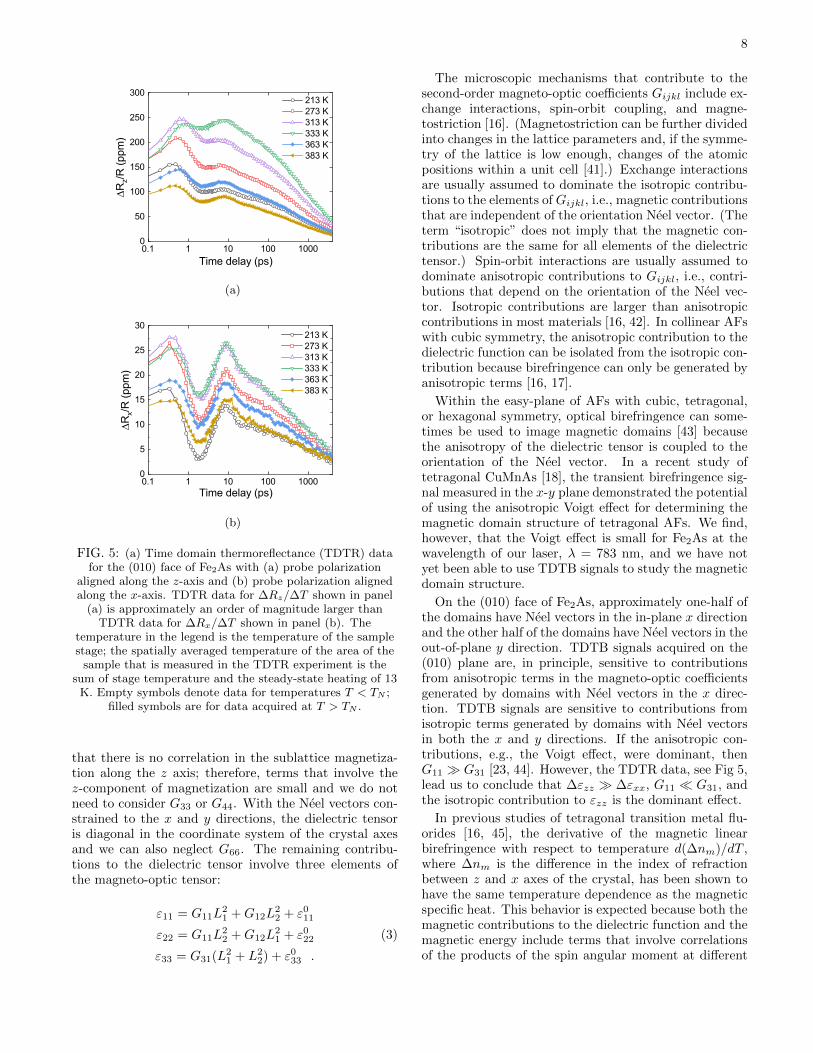
On the (010) face of Fe2As, approximately one-half ofthe domains have Neel vectors in the in-plane x directionand the other half of the domains have Neel vectors in theout-of-plane y direction. TDTB signals acquired on the(010) plane are, in principle, sensitive to contributionsfrom anisotropic terms in the magneto-optic coefficientsgenerated by domains with Neel vectors in the x direc-tion. TDTB signals are sensitive to contributions fromisotropic terms generated by domains with Neel vectorsin both the x and y directions. If the anisotropic con-tributions, e.g., the Voigt effect, were dominant, thenG11 G31 [23, 44]. However, the TDTR data, see Fig 5,lead us to conclude that ∆εzz ∆εxx, G11 G31, andthe isotropic contribution to εzz is the dominant effect.
In previous studies of tetragonal transition metal flu-orides [16, 45], the derivative of the magnetic linearbirefringence with respect to temperature d(∆nm)/dT ,where ∆nm is the difference in the index of refractionbetween z and x axes of the crystal, has been shown tohave the same temperature dependence as the magneticspecific heat. This behavior is expected because both themagnetic contributions to the dielectric function and themagnetic energy include terms that involve correlationsof the products of the spin angular moment at different
9
200 250 300 350 400
1
10
100
Re(010)
Temperature (K)
DQ/D
T (m
rad
K-1
) at 1
00 p
s
Cm
Im(010)
Re(001)0.01
0.1
1
Cm
(J c
m-3
K-1
)
FIG. 6: Comparison between ∆Θ/∆T and magneticspecific heat as a function of sample temperature. The
values for ∆Θ are for 100 ps delay time. For eachsample temperature T , ∆T at 100 ps at is calculated
from a thermal model that uses the measured total heatcapacity and thermal conductivity of Fe2As as inputs to
the model. The sample temperature T includes theeffects of steady-state heating of measurement area that
is created by the absorbed laser power. The real andimaginary parts ∆Θ/∆T measured for the (010) face
have a similar temperature dependence as the magneticspecific heat Cm.
lattice sites. Contributions to the magneto-optic coeffi-cients from various terms in the Hamiltonian could, how-ever, have different constants of proportionality. Further-more, in our time-domain thermo-birefringence (TDTB)measurements of the (010) face of the Fe2As crystal, thereare non-magnetic contributions to the TDTB signals thatcome from thermal excitations of electrons and phonons.The fact that the TDTB signals closely resemble the tem-perature dependence of the magnetic heat capacity sup-ports our conclusion that the TDTB signals are domi-nated by a magnetic contribution with a single underly-ing mechanism.
If we assume that the magnetic contribution dominatesthe temperature-dependence of ε33, the magneto-opticalcoefficient G31 can be estimated by using the value of∆ε33 and ∆(M2
A), where MA is sublattice magnetizationof the AF. We estimate ∆(M2
A) from our magnetic heatcapacity data as described in the supplementary docu-ment. Because the sublattice magnetization is alwaysreal, the magneto-optic coefficient G31 is complex since
∆ε33 is a complex number.
G31 =∆ε33/∆T
2∆(M2A)/∆T
=(∆ε′33 + i∆ε′′33)
2∆(M2a )
. (4)
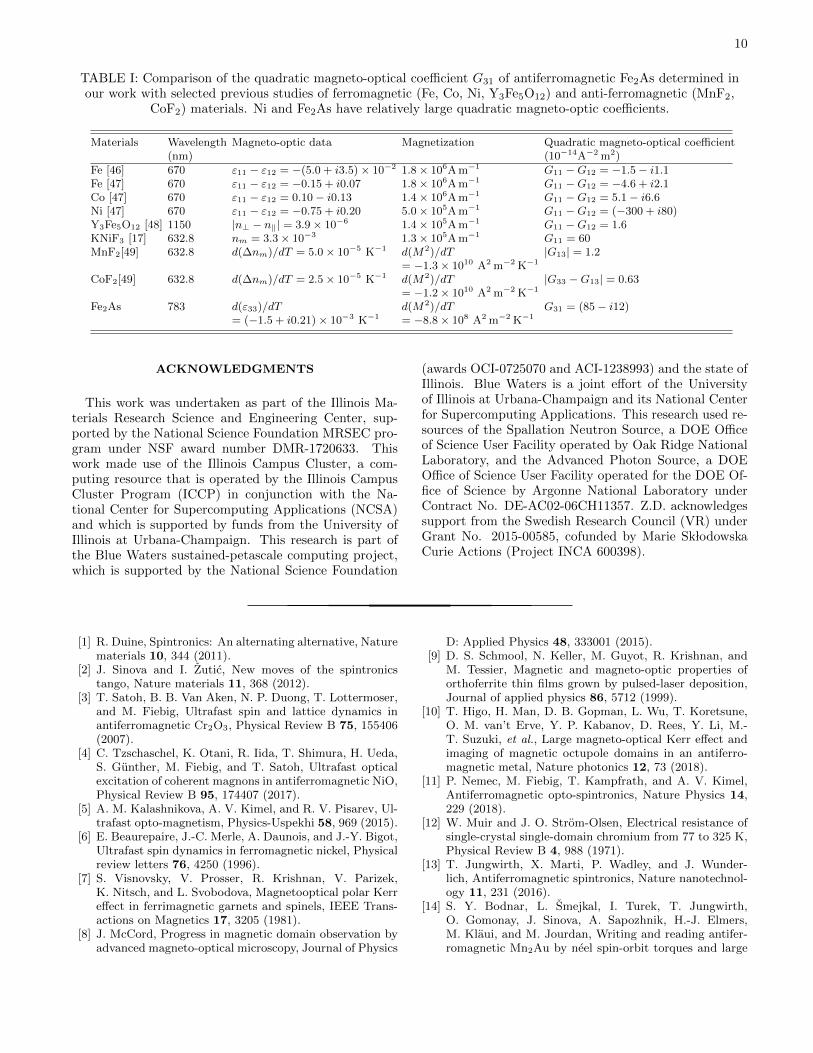
Inserting the value of the transient dielectric functionand the temperature excursion of 1.5 K at a delay timeof 100 ps and ambient temperature, 293 K, we find G31 =(0.85 − i0.12) × 10−12A−2 m2. We emphasize that thisvalue for G31 should be consider an estimate because wehave assumed that the magnetic contribution dominatesthe temperature dependence of ε33.
Finally, we compare the magnitude of our result forG31 of Fe2As with the quadratic magneto-optic coeffi-cients of several more commonly studied magnetic ma-terials, see Table I. In Table I, G tensors are GMM forferromagnets and GLL for antiferromagnets. In studiesof ferromagnetic materials (Fe, Co, Ni, and Y3Fe5O12),the magnetization vector can be manipulated with an ex-ternal field and therefore the elements of the quadraticmagneto-optic tensor Gij can be calculated using Eq. 3and M2 = M2
s , where Ms is the saturation magnetiza-tion. In studies of antiferromagnetic materials (MnF2,CoF2, and Fe2As), typically, the Neel vector cannot becontrolled with an external field and the values of Gijare more difficult to determine. The measurements ofantiferromagnetic MnF2 and CoF2 reported in Ref. [49]are collected from a crystallographic anisotropic plane;therefore, the magnetic birefringence data that we usein this analysis are the temperature derivatives of thebirefringence data with the additional assumption thatthe magnetic birefringence has a stronger dependenceon temperature than the crystalline birefringence. Weused M2 = M2
A to calculate the Gij tensor for antifer-romagnets, where MA is sublattice magnetization. Typ-ically, G11 and G13 or G12 cannot be determined sepa-rately based on birefringence data alone. Compared tothe other materials listed in Table I, Fe2As and Ni haverelatively large quadratic magneto-optic coefficients.
IV. CONCLUSION
In collinear antiferromagnetic materials, the contribu-tion to the diagonal elements of the dielectric tensor thatare quadratic in sublattice magnetization can be probedwith transient birefringence or reflectance measurements.In our measurement of time-domain thermo-birefringence(TDTB) and thermo-reflectance (TDTR) of Fe2As, weobserve that the dominant response of the dielectric ten-sor is in the z direction and perpendicular to the Neel vec-tor. The temperature dependence of the TDTB signalsclosely follow the temperature dependence of the mag-netic heat capacity, as expected if the exchange interac-tion is the dominant magnetic contribution to the dielec-tric function. In comparison to other magnetic materials,Fe2As has relatively large quadratic magneto-optical co-efficient at 783 nm.
10
TABLE I: Comparison of the quadratic magneto-optical coefficient G31 of antiferromagnetic Fe2As determined inour work with selected previous studies of ferromagnetic (Fe, Co, Ni, Y3Fe5O12) and anti-ferromagnetic (MnF2,
CoF2) materials. Ni and Fe2As have relatively large quadratic magneto-optic coefficients.
Materials Wavelength Magneto-optic data Magnetization Quadratic magneto-optical coefficient(nm) (10−14A−2 m2)
This work was undertaken as part of the Illinois Ma-terials Research Science and Engineering Center, sup-ported by the National Science Foundation MRSEC pro-gram under NSF award number DMR-1720633. Thiswork made use of the Illinois Campus Cluster, a com-puting resource that is operated by the Illinois CampusCluster Program (ICCP) in conjunction with the Na-tional Center for Supercomputing Applications (NCSA)and which is supported by funds from the University ofIllinois at Urbana-Champaign. This research is part ofthe Blue Waters sustained-petascale computing project,which is supported by the National Science Foundation
(awards OCI-0725070 and ACI-1238993) and the state ofIllinois. Blue Waters is a joint effort of the Universityof Illinois at Urbana-Champaign and its National Centerfor Supercomputing Applications. This research used re-sources of the Spallation Neutron Source, a DOE Officeof Science User Facility operated by Oak Ridge NationalLaboratory, and the Advanced Photon Source, a DOEOffice of Science User Facility operated for the DOE Of-fice of Science by Argonne National Laboratory underContract No. DE-AC02-06CH11357. Z.D. acknowledgessupport from the Swedish Research Council (VR) underGrant No. 2015-00585, cofunded by Marie Sk lodowskaCurie Actions (Project INCA 600398).
[1] R. Duine, Spintronics: An alternating alternative, Naturematerials 10, 344 (2011).
[2] J. Sinova and I. Zutic, New moves of the spintronicstango, Nature materials 11, 368 (2012).
[3] T. Satoh, B. B. Van Aken, N. P. Duong, T. Lottermoser,and M. Fiebig, Ultrafast spin and lattice dynamics inantiferromagnetic Cr2O3, Physical Review B 75, 155406(2007).
[4] C. Tzschaschel, K. Otani, R. Iida, T. Shimura, H. Ueda,S. Gunther, M. Fiebig, and T. Satoh, Ultrafast opticalexcitation of coherent magnons in antiferromagnetic NiO,Physical Review B 95, 174407 (2017).
[5] A. M. Kalashnikova, A. V. Kimel, and R. V. Pisarev, Ul-trafast opto-magnetism, Physics-Uspekhi 58, 969 (2015).
[6] E. Beaurepaire, J.-C. Merle, A. Daunois, and J.-Y. Bigot,Ultrafast spin dynamics in ferromagnetic nickel, Physicalreview letters 76, 4250 (1996).
[7] S. Visnovsky, V. Prosser, R. Krishnan, V. Parizek,K. Nitsch, and L. Svobodova, Magnetooptical polar Kerreffect in ferrimagnetic garnets and spinels, IEEE Trans-actions on Magnetics 17, 3205 (1981).
[8] J. McCord, Progress in magnetic domain observation byadvanced magneto-optical microscopy, Journal of Physics
D: Applied Physics 48, 333001 (2015).[9] D. S. Schmool, N. Keller, M. Guyot, R. Krishnan, and
M. Tessier, Magnetic and magneto-optic properties oforthoferrite thin films grown by pulsed-laser deposition,Journal of applied physics 86, 5712 (1999).
[10] T. Higo, H. Man, D. B. Gopman, L. Wu, T. Koretsune,O. M. van’t Erve, Y. P. Kabanov, D. Rees, Y. Li, M.-T. Suzuki, et al., Large magneto-optical Kerr effect andimaging of magnetic octupole domains in an antiferro-magnetic metal, Nature photonics 12, 73 (2018).
[11] P. Nemec, M. Fiebig, T. Kampfrath, and A. V. Kimel,Antiferromagnetic opto-spintronics, Nature Physics 14,229 (2018).
[12] W. Muir and J. O. Strom-Olsen, Electrical resistance ofsingle-crystal single-domain chromium from 77 to 325 K,Physical Review B 4, 988 (1971).
[13] T. Jungwirth, X. Marti, P. Wadley, and J. Wunder-lich, Antiferromagnetic spintronics, Nature nanotechnol-ogy 11, 231 (2016).
[14] S. Y. Bodnar, L. Smejkal, I. Turek, T. Jungwirth,O. Gomonay, J. Sinova, A. Sapozhnik, H.-J. Elmers,M. Klaui, and M. Jourdan, Writing and reading antifer-romagnetic Mn2Au by neel spin-orbit torques and large
[15] S. S. Dhesi, G. van der Laan, and E. Dudzik, Determiningelement-specific magnetocrystalline anisotropies using x-ray magnetic linear dichroism, Applied physics letters 80,1613 (2002).
[16] J. Ferre and G. A. Gehring, Linear optical birefringenceof magnetic crystals, Reports on Progress in Physics 47,513 (1984).
[17] P. A. Markovin, R. V. Pisarev, G. A. Smolensky, andP. P. Syrnikov, Observation of isotropic magnetic contri-bution to the refractive index of ABF3-type cubic crys-tals, Solid State Communications 19, 185 (1976).
[18] V. Saidl, P. Nemec, P. Wadley, V. Hills, R. P. Campion,V. Novak, K. W. Edmonds, F. Maccherozzi, S. S. Dhesi,B. L. Gallagher, et al., Optical determination of the neelvector in a CuMnAs thin-film antiferromagnet, NaturePhotonics 11, 91 (2017).
[19] H. Katsuraki and N. Achiwa, The magnetic structure ofFe2As, Journal of the Physical Society of Japan 21, 2238(1966).
[20] N. Achiwa, S. Yano, M. Yuzuri, and H. Takaki, Mag-netic anisotropy in the c-plane of Fe2As, Journal of thePhysical Society of Japan 22, 156 (1967).
[21] J. M. Perez-Mato, S. V. Gallego, E. S. Tasci, L. Elcoro,G. de la Flor, and M. I. Aroyo, Symmetry-based compu-tational tools for magnetic crystallography, Annual Re-view of Materials Research 45, 217 (2015).
[22] L. M. Corliss, J. M. Hastings, W. Kunnmann, R. J. Be-gum, M. F. Collins, E. Gurewitz, and D. Mukamel, Mag-netic phase diagram and critical behavior of Fe2As, Phys-ical Review B 25, 245 (1982).
[23] H. Le Gall, T. K. Vien, and B. Desormiere, Theory ofthe elastic and inelastic scattering of light by magneticcrystals. II. Second-order processes, physica status solidi(b) 47, 591 (1971).
[24] K. Kang, Y. K. Koh, C. Chiritescu, X. Zheng, and D. G.Cahill, Two-tint pump-probe measurements using a fem-tosecond laser oscillator and sharp-edged optical filters,Review of Scientific Instruments 79, 114901 (2008).
[25] J. Kimling, A. Philippi-Kobs, J. Jacobsohn, H. P. Oepen,and D. G. Cahill, Thermal conductance of interfaces withamorphous SiO2 measured by time-resolved magneto-optic Kerr-effect thermometry, Physical Review B 95,184305 (2017).
[26] G. Kresse and J. Furthmuller, Efficient iterative schemesfor ab initio total-energy calculations using a plane-wavebasis set, Phys. Rev. B 54, 11169 (1996).
[27] G. Kresse and D. Joubert, From ultrasoft pseudopoten-tials to the projector augmented-wave method, Phys.Rev. B 59, 1758 (1999).
[28] M. Gajdos, K. Hummer, G. Kresse, J. Furthmuller, andF. Bechstedt, Linear optical properties in the projector-augmented wave methodology, Phys. Rev. B 73, 045112(2006).
[29] J. P. Perdew, K. Burke, and M. Ernzerhof, Generalizedgradient approximation made simple, Phys. Rev. Lett.77, 3865 (1996).
[30] P. E. Blochl, Projector augmented-wave method, Phys.Rev. B 50, 17953 (1994).
[31] H. J. Monkhorst and J. D. Pack, Special points forbrillouin-zone integrations, Phys. Rev. B 13, 5188 (1976).
[32] A. Togo and I. Tanaka, First principles phonon calcula-tions in materials science, Scr. Mater. 108, 1 (2015).
[33] D. A. Zocco, D. Y. Tutun, J. J. Hamlin, J. R. Jeffries,S. T. Weir, Y. K. Vohra, and M. B. Maple, High pres-sure transport studies of the LiFeAs analogs CuFeTe2and Fe2As, Superconductor Science and Technology 25,084018 (2012).
[34] N. D. Mermin, Thermal properties of the inhomogeneouselectron gas, Phys. Rev. 137, A1441 (1965).
[35] D. G. Cahill, Analysis of heat flow in layered structuresfor time-domain thermoreflectance, Review of scientificinstruments 75, 5119 (2004).
[36] D. Bossini, A. M. Kalashnikova, R. V. Pisarev, T. Rasing,and A. V. Kimel, Controlling coherent and incoherentspin dynamics by steering the photoinduced energy flow,Physical Review B 89, 060405 (2014).
[37] J. Kimling, J. Kimling, R. Wilson, B. Hebler, M. Al-brecht, and D. G. Cahill, Ultrafast demagnetization ofFePt:Cu thin films and the role of magnetic heat capac-ity, Physical Review B 90, 224408 (2014).
[38] M. J. Grzybowski, P. Wadley, K. W. Edmonds, R. Beard-sley, V. Hills, R. Campion, B. L. Gallagher, J. S.Chauhan, V. Novak, and e. a. Jungwirth, T, Imagingcurrent-induced switching of antiferromagnetic domainsin CuMnAs, Physical review letters 118, 057701 (2017).
[39] A. Sapozhnik, M. Filianina, S. Y. Bodnar, A. Lami-rand, M.-A. Mawass, Y. Skourski, H.-J. Elmers, H. Zabel,M. Klaui, and M. Jourdan, Direct imaging of antiferro-magnetic domains in Mn2Au manipulated by high mag-netic fields, Physical Review B 97, 134429 (2018).
[40] V. V. Eremenko, N. Kharchenko, Y. G. Litvinenko, andV. M. Naumenko, Magneto-optics and spectroscopy ofantiferromagnets (Springer Science & Business Media,2012).
[41] W. Jauch, Structural origin of magnetic birefringence inrutile-type antiferromagnets, Physical Review B 44, 6864(1991).
[42] S. Borovik-Romanov, N. M. Kreines, A. A. Pankov, andM. A. Talalayev, Magnetic birefringence of light in an-tiferromagnetic transition-metal fluorides, JETP 37, 890(1973).
[43] N. B. Weber, C. Bethke, and F. U. Hillebrecht, Imagingof antiferromagnetic domains at the NiO(100) surface bylinear dichroism in near UV photoemission microscopy,Journal of magnetism and magnetic materials 226, 1573(2001).
[44] N. Tesarova, P. Nemec, E. Rozkotova, J. Subrt, H. Re-ichlova, D. Butkovicova, F. Trojanek, P. Maly, V. Novak,and T. Jungwirth, Direct measurement of the three-dimensional magnetization vector trajectory in gamnasby a magneto-optical pump-and-probe method, AppliedPhysics Letters 100, 102403 (2012).
[45] I. Jahn and H. Dachs, Change of the optical birefringenceassociated with the antiferromagnetic ordering of MnF2,FeF2, CoF2, and NiF2, Solid State Communications 9,1617 (1971).
[46] J. H. Liang, X. Xiao, J. X. Li, B. Zhu, J. Zhu, H. Bao,L. Zhou, and Y. Z. Wu, Quantitative study of thequadratic magneto-optical Kerr effects in Fe films, Opticsexpress 23, 11357 (2015).
[47] J. Hamrlova, D. Legut, M. Veis, J. Pistora, and J. Ham-rle, Principal spectra describing magnetooptic permittiv-ity tensor in cubic crystals, Journal of Magnetism andMagnetic Materials 420, 143 (2016).
[48] R. V. Pisarev, I. G. Sinii, N. N. Kolpakova, and Y. M.Yakovlev, Magnetic birefringence of light in iron garnets,
12
Sov. Phys. JETP 33, 1175 (1971). [49] I. R. Jahn, Linear magnetic birefringence in the antifer-romagnetic iron group difluorides, physica status solidi(b) 57, 681 (1973).