Page 1
Magneto-optic Studies of Spin Dynamics and
Spin Torque in High Spin-Orbit Materials
Roland Kawakami
Department of Physics
The Ohio State University
Topological Spintronics Workshop, May 13, 2016
Page 2
Students & Postdocs
Beth Bushong
Yunqiu Kelly Luo
Dante O’Hara
Michael Newburger
Simranjeet Singh
Adam Ahmed
Igor Pinchuk
Collaborators
Kathleen McCreary (NRL)
Berend Jonker (NRL)
Acknowledgements
Page 3
• Overview
• Spin Torque Dynamics in FM/HM bilayers
• Spin Dynamics in Transition Metal Dichalcogenides
• Summary
Outline
Page 4
Low spin-orbit coupling is good for spin transport
Graphene exhibits spin transport at room temperature
with spin diffusion lengths up to tens of microns
Picture of
W. Han, RKK, M. Gmitra, J. Fabian, Nature Nano. 9, 794–807 (2014)
Overview: Spin-Orbit Coupling in 2D Materials
Page 5
Overview: Spin-Orbit Coupling in 2D Materials
Weak SPIN ORBIT COUPLING Strong
Graphene (C) Silicene (Si) Germanene (Ge) Stanene (Sn) MoS2 (TMD)
• Long spin lifetimes
• Spin Transport at RT
Transition Metal
Dichalcogenides (TMD)Heavy Graphene
• Spin Hall effect
• Quantum spin Hall effect
A wide range of spin-dependent phenomena can be a
realized in 2D materials by tuning spin-orbit coupling
Page 6
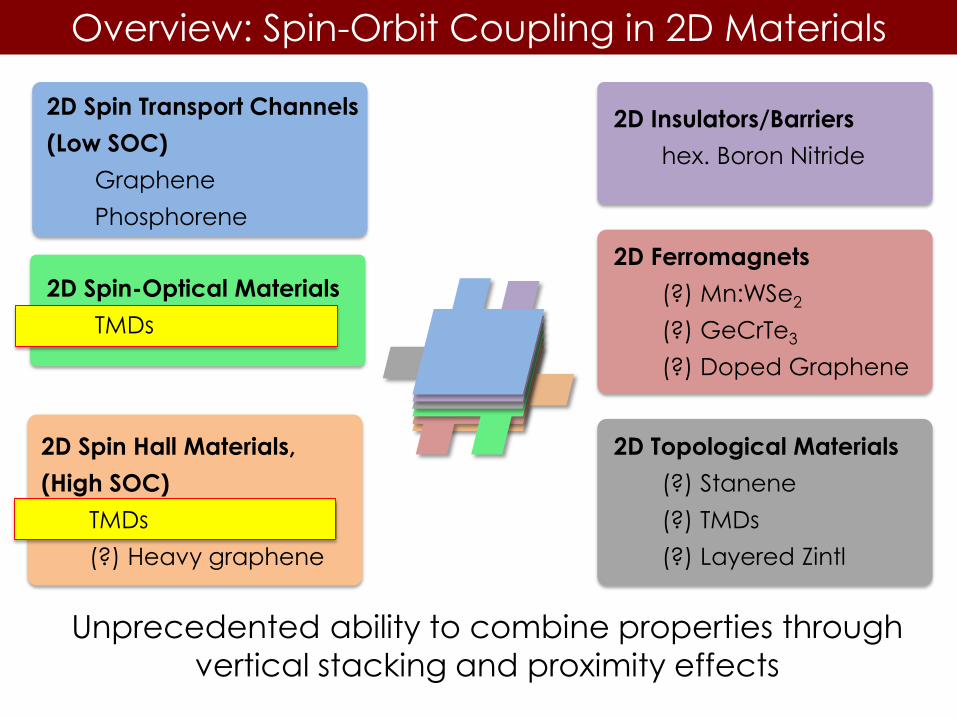
Overview: Spin-Orbit Coupling in 2D Materials
Unprecedented ability to combine properties through
vertical stacking and proximity effects
2D Insulators/Barriers
hex. Boron Nitride
2D Topological Materials
(?) Stanene
(?) TMDs
(?) Layered Zintl
2D Spin Transport Channels
(Low SOC)
Graphene
Phosphorene
2D Ferromagnets
(?) Mn:WSe2
(?) GeCrTe3
(?) Doped Graphene
2D Spin-Optical Materials
TMDs
2D Spin Hall Materials,
(High SOC)
TMDs
(?) Heavy graphene
Page 7
• Overview
• Spin Torque Dynamics in FM/HM bilayers
• Spin Dynamics in Transition Metal Dichalcogenides
• Summary
Outline
Page 8
Monolayer Transition Metal Dichalcogenide
WS2
Monolayer TMD, such as WS2, with hexagonal structure and inversion symmetry breaking
Spin-valley coupling due to large spin-orbit interaction
Page 9
Monolayer Transition Metal Dichalcogenide
Berry curvature Valley Hall Effect
+ spin-valley coupling Linear Probe
Circular Pump
100xObjective
θK
0 2 4 8 10
0.5
0.0
2.0
1.0
0.0 -20 0 20 40
Time Delay Dt (ns)
Dt (ps)
Kerr
Rota
tio
n q
K (a.u
.)
qK (
a.u
.)
6
Figure1.TimeresolvedKerrrota4ononhighqualityCVDWS2monolayers.a,(le$)TheatomicstructureofWS2;tungstenisthecentralblueatom,andthesulfuratomsareyellow.(right)Theschema?cbandstructureofmonolayerWS2attheKand-Kpoints.Thespin-valleycouplingallowsonetoselec?velyexcitespinsineithertheKor-Kvalley.b,Op?calmicrographofoneofthetriangularislandsusedinthisstudy.c,PhotoluminescencespectroscopyofmonolayerWS2measuredat6K.d,DiagramoftheTRKRmicroscopyset-up.e,Representa?veKerrrota?onasafunc?onofpump-probe?medelayformonolayerWS2at6Kandzeromagne?cfield.Theredcurveisabi-exponen?alfityielding?meconstantsof320psand5.4ns.Inset:Kerrrota?onatshort?medelays.Anexponen?alfittothefastdecay(greencurve)yieldsa?meconstantof3.0ps.
5 μm
(a) (b)
(c) (d)
1.0 (e)
Inte
nsity (
a.u
.) 10000
5000
0 600 700 800 900 1000
Wavelength (nm)
6 K
6 K
Γ
K -K
K
K
-K
-K
-K K
σ+σ-
Spin Hall Effect
Experiment: K. F. Mak et al, Science 344, 1489 (2014)
Theory: D. Xiao et al, PRL 108, 196802 (2012)
Page 10
Ultrafast Optical Microscopy of Spin Dynamics in
Transition Metal Dichalcogenides
What is the spin lifetime of WS2?
Strong Berry curvature for spin/valley Hall effect.
How are the spin and valley degrees of freedom
coupled?
WS2
Linear Probe
Circular Pump
100xObjective
θK
0 2 4 8 10
0.5
0.0
2.0
1.0
0.0 -20 0 20 40
Time Delay Dt (ns)
Dt (ps)
Ke
rr R
ota
tio
n q
K (a.u
.)
qK (
a.u
.)
6
Figure1.TimeresolvedKerrrota4ononhighqualityCVDWS2monolayers.a,(le$)TheatomicstructureofWS2;tungstenisthecentralblueatom,andthesulfuratomsareyellow.(right)Theschema?cbandstructureofmonolayerWS2attheKand-Kpoints.Thespin-valleycouplingallowsonetoselec?velyexcitespinsineithertheKor-Kvalley.b,Op?calmicrographofoneofthetriangularislandsusedinthisstudy.c,PhotoluminescencespectroscopyofmonolayerWS2measuredat6K.d,DiagramoftheTRKRmicroscopyset-up.e,Representa?veKerrrota?onasafunc?onofpump-probe?medelayformonolayerWS2at6Kandzeromagne?cfield.Theredcurveisabi-exponen?alfityielding?meconstantsof320psand5.4ns.Inset:Kerrrota?onatshort?medelays.Anexponen?alfittothefastdecay(greencurve)yieldsa?meconstantof3.0ps.
5 μm
(a) (b)
(c) (d)
1.0 (e)
Inte
nsity (
a.u
.) 10000
5000
0 600 700 800 900 1000
Wavelength (nm)
6 K
6 K
Γ
K -K
K
K
-K
-K
-K K
σ+σ-
Page 11
Chemical Vapor Deposition Grown WS2
High quality, large area,
single layer flakes
n-type WS2
From collaborators at
Naval Research
Laboratory (NRL),
Kathleen McCreary and
Berry Jonker20 mm
Page 12
Monolayer WS2 Photoluminescence
532 nm excitation
Monolayer TMDs show
strong PL, with no PL at
lower energies
Lower energy peaks
indicate an indirect gap
transition, characteristic of
multi-layer WS2
PL peak is at 630 nm (A
exciton)
no indirect
transition
6.2 K
Page 13
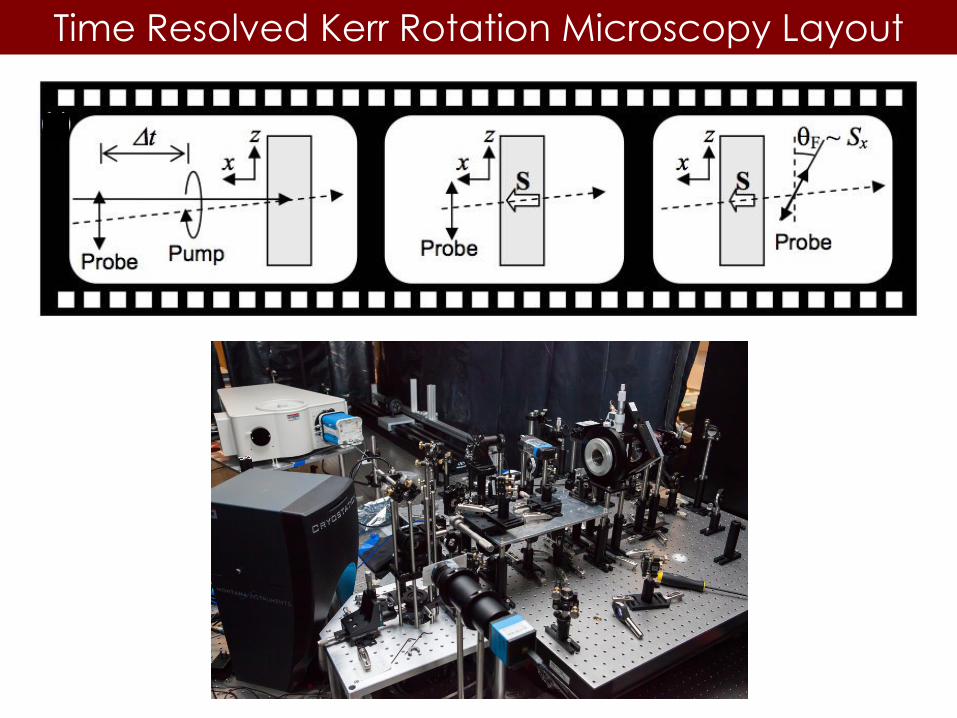
Time Resolved Kerr Rotation Microscopy Layout
Delay line to adjust
pump-probe time delay
625 nm wavelength
76 MHz rep rate
150 fs pulse width
Page 14
Time Resolved Kerr Rotation Microscopy Layout
Page 15
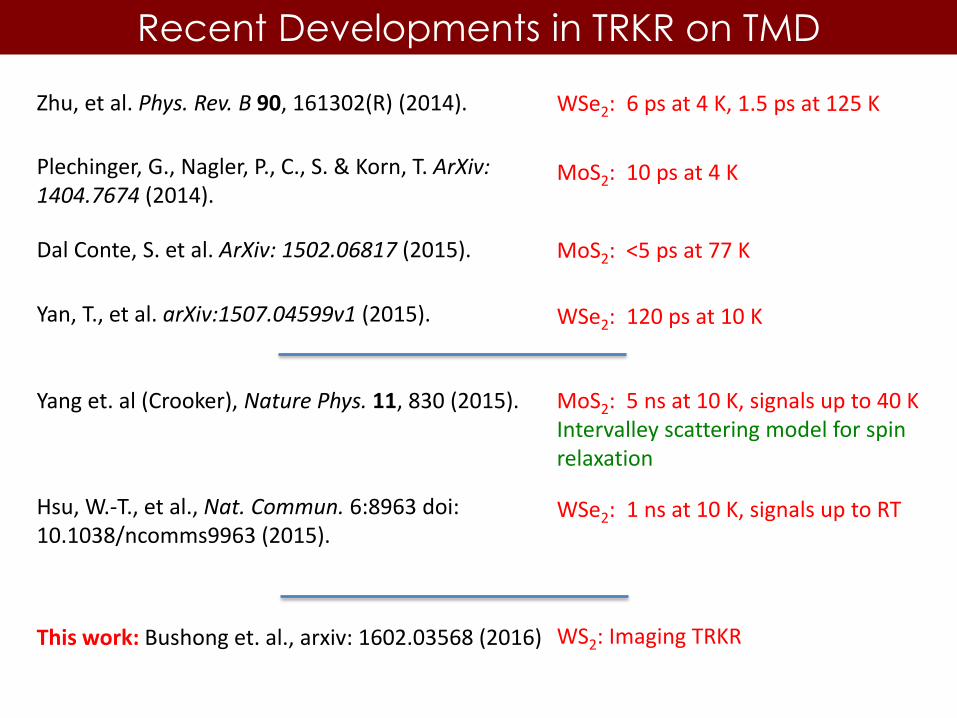
Recent Developments in TRKR on TMD
Yang et. al (Crooker), Nature Phys. 11, 830 (2015). MoS2: 5 ns at 10 K, signals up to 40 KIntervalley scattering model for spin relaxation
Zhu, et al. Phys. Rev. B 90, 161302(R) (2014).
Plechinger, G., Nagler, P., C., S. & Korn, T. ArXiv: 1404.7674 (2014).
WSe2: 6 ps at 4 K, 1.5 ps at 125 K
MoS2: 10 ps at 4 K
Hsu, W.-T., et al., Nat. Commun. 6:8963 doi: 10.1038/ncomms9963 (2015).
WSe2: 1 ns at 10 K, signals up to RT
This work: Bushong et. al., arxiv: 1602.03568 (2016) WS2: Imaging TRKR
Yan, T., et al. arXiv:1507.04599v1 (2015).
Dal Conte, S. et al. ArXiv: 1502.06817 (2015). MoS2: <5 ps at 77 K
WSe2: 120 ps at 10 K
Page 16
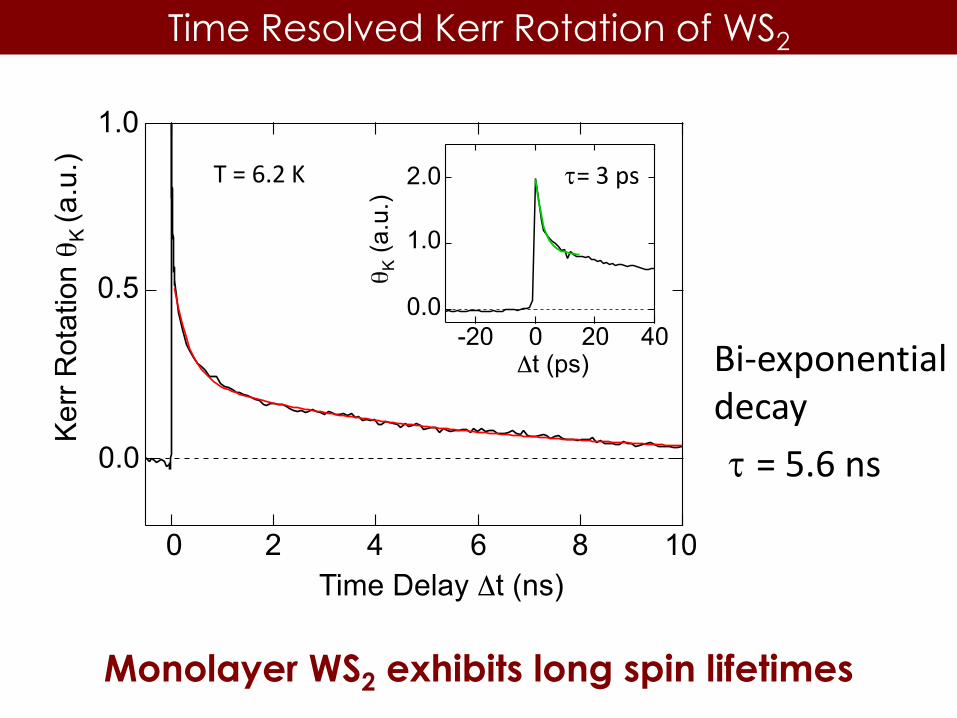
Time Resolved Kerr Rotation of WS2
Monolayer WS2 exhibits long spin lifetimes
T = 6.2 K t= 3 ps
t = 5.6 ns
Bi-exponential decay
Page 17
Spatial Mapping of the Kerr Rotation
Δt = 300 ps
Spatial variation of spin polarization in WS2
Page 18
Time Resolved Kerr Rotation Mapping
Spatial variation of spin density in WS2
Page 19
High Resolution Imaging of Spin Dynamics
Images appear to be more symmetrical with
increasing time delay
Dt = 11000 ps Dt = 4000 ps Dt = 2000 ps
Dt = 600 ps Dt = 250 ps Dt = 80 ps
5mm Kerr Rotation
(a.u.)
0.0
0.5
1.0
1.5
Page 20
Dt = 11000 ps Dt = 4000 ps Dt = 2000 ps
Dt = 600 ps Dt = 250 ps Dt = 80 ps
5mm Kerr Rotation
(a.u.)
0.0
0.5
1.0
1.5
Spatially Resolved Photoluminescence
Kerr Rotation
Photoluminescence
Page 21
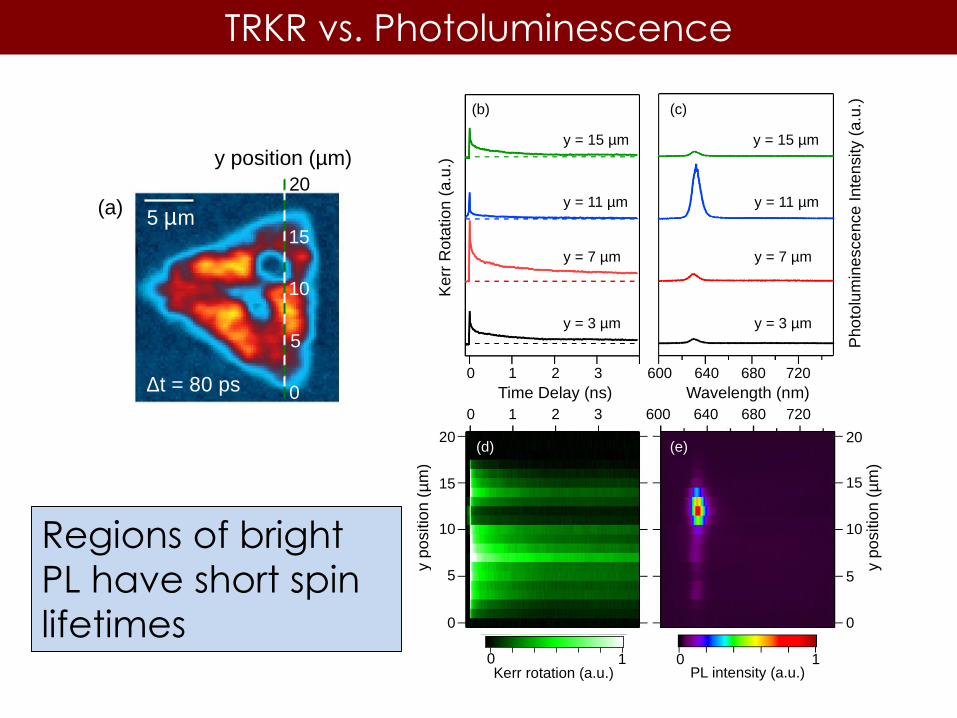
TRKR vs. Photoluminescence
Regions of bright
PL have short spin
lifetimes
600 640 680 720
Wavelength (nm)
0 1 2 3
Time Delay (ns)
Pho
tolu
min
esce
nce I
nte
nsity (
a.u
.)
Ke
rr R
ota
tio
n (
a.u
.)
0
5
10
15
20
y p
ositio
n (
mm
)
y p
ositio
n (
mm
)
y = 3 mm
y = 7 mm
y = 15 mm
y = 11 mm
y = 3 mm
y = 7 mm
y = 15 mm
y = 11 mm
0 1 2 3
0
5
10
15
20
600 640 680 720
Figure3.An4correla4onofphotoluminescenceand4meresolvedKerrrota4on.a,Thedashedlineindicatestheline-cutwhereTRKRandPLarecompared.b-c,TRKRdelayscansandPLspectrameasuredat6Katrepresenta?vepointsalongtheline-cut.Theposi?onwiththebrightestphotoluminescencehaslowestspindensity.d-e,Detailedspa?aldependenceofTRKRandPLalongtheline-cut.
Kerr rotation (a.u.) PL intensity (a.u.)
(b) (c)
(d) (e)
3.0
2.5
2.0
1.5
1.0
0.5
0.0
x10-3
Dt = 80 ps
5mm
y position (mm)
(a)
0
10
5
15
20
0 1 0 1
600 640 680 720
Wavelength (nm)
0 1 2 3
Time Delay (ns)
Ph
oto
lum
ine
sce
nce I
nte
nsity (
a.u
.)
Ke
rr R
ota
tio
n (
a.u
.)
0
5
10
15
20
y p
ositio
n (
mm
)
y p
ositio
n (
mm
)
y = 3 mm
y = 7 mm
y = 15 mm
y = 11 mm
y = 3 mm
y = 7 mm
y = 15 mm
y = 11 mm
0 1 2 3
0
5
10
15
20
600 640 680 720
Figure3.An4correla4onofphotoluminescenceand4meresolvedKerrrota4on.a,Thedashedlineindicatestheline-cutwhereTRKRandPLarecompared.b-c,TRKRdelayscansandPLspectrameasuredat6Katrepresenta?vepointsalongtheline-cut.Theposi?onwiththebrightestphotoluminescencehaslowestspindensity.d-e,Detailedspa?aldependenceofTRKRandPLalongtheline-cut.
Kerr rotation (a.u.) PL intensity (a.u.)
(b) (c)
(d) (e)
3.0
2.5
2.0
1.5
1.0
0.5
0.0
x10-3
Dt = 80 ps
5mm
y position (mm)
(a)
0
10
5
15
20
0 1 0 1
Page 22
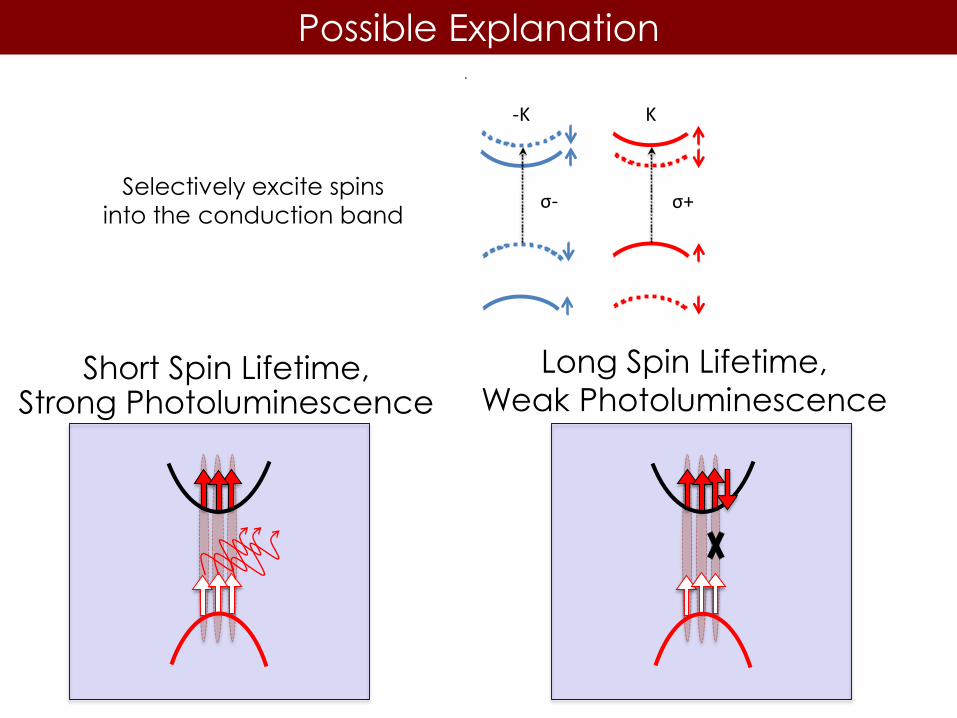
Possible Explanation
Short Spin Lifetime,Strong Photoluminescence
Selectively excite spins
into the conduction band
Long Spin Lifetime,
Weak Photoluminescence
Linear Probe
Circular
Pump
100xObjective
θK
0 2 4 8 10
0.5
0.0
2.0
1.0
0.0 -20 0 20 40
Time Delay Dt (ns)
Dt (ps)
Ke
rr R
ota
tio
n q
K (a
.u.)
qK (
a.u
.)
6
Figure1.TimeresolvedKerrrota4ononhighqualityCVDWS2monolayers.a,(le$)TheatomicstructureofWS2;tungstenisthecentralblueatom,andthesulfuratomsareyellow.(right)Theschema?cbandstructureofmonolayerWS2attheKand-Kpoints.Thespin-valleycouplingallowsonetoselec?velyexcitespinsineithertheKor-Kvalley.b,Op?calmicrographofoneofthetriangularislandsusedinthisstudy.c,PhotoluminescencespectroscopyofmonolayerWS2measuredat6K.d,DiagramoftheTRKRmicroscopyset-up.e,Representa?veKerrrota?onasafunc?onofpump-probe?medelayformonolayerWS2at6Kandzeromagne?cfield.Theredcurveisabi-exponen?alfityielding?meconstantsof320psand5.4ns.Inset:Kerrrota?onatshort?medelays.Anexponen?alfittothefastdecay(greencurve)yieldsa?meconstantof3.0ps.
5 μm
(a) (b)
(c) (d)
1.0 (e)
Inte
nsity (
a.u
.) 10000
5000
0 600 700 800 900 1000
Wavelength (nm)
6 K
6 K
Γ
K -K
K
K
-K
-K
-K K
σ+σ-
Page 23
Role of spin-orbit splitting Sp
in L
ife
tim
e (
ns)
0
2
4
6
8
0 200 400 600 800
Magnetic Field (mT)
Time Delay (ns)
Ke
rr R
ota
tio
n (
a.u
.)
0 2 4 6 8
0 mT
100 mT
300 mT
500 mT
700 mT
Figure4.Spin-orbitstabilizedspinsinWS2.a,Adiagramoftheini?alspindirec?onS(redarrow)andtransversemagne?cfieldBext(bluearrow)appliedintheplaneoftheWS2island.b,Spinlife?measafunc?onofspin-orbitfield,calculatedforfixedBextusingthemodelinreference12.c,Atlowspin-orbitcoupling,thespinsexhibitconven?onalbehaviorandprecessaboutBext(bluecurve).Atmuchlargerspin-orbitcoupling,Bextdoesnotinducespinprecession(orangecurve)andthespinlife?meisrobustagainstexternalfields.d,Kerrrota?onasafunc?onof?medelayfordifferentBext.Thenon-precessingdecaycurvesarecharacteris?cofthespin-orbit-stabilizedregime(orangecurveinc).e,Spinlife?measafunc?onofBext,obtainedbyfiX ngtheTRKRdatain(d).Thespinlife?meisrobusttoanexternalmagne?cfieldupto700mT,indica?ngthatWS2isinthespin-orbitstabilizedregime.f,Spinlife?measafunc?onoftemperature.Theinsetshowsrepresenta?vedelayscansatdifferenttemperatures. Themagne?cfieldandtemperaturedependencesweremeasuredondifferentsamples.
BSO (T)
Time Delay (ns) Time Delay (ns)
0
Spin
Life
tim
e (
ns)
Temperature (K)
0.5 0 2 1
0
1
-1
Ca
lcu
late
d
Lifetim
e (
ns)
0
Ca
lcu
late
d S
Z (
a.u
.)
0 200 50 100 150
3
4
2
1
0
30 K 60 K 110 K 180 K K
err
R
ota
tio
n (
a.u
.)
0 4 Time Delay (ns)
2
(a)
(b) 5
0 20 10 30
1 1.5 3 4 5
(c)
(d) (e)
(f)
BSO = 2 T BSO = 25 T
2
Conventional Spin-Orbit Stabilized
Sp
in L
ife
tim
e (
ns)
0
2
4
6
8
0 200 400 600 800
Magnetic Field (mT)
Time Delay (ns)
Ke
rr R
ota
tio
n (
a.u
.)
0 2 4 6 8
0 mT
100 mT
300 mT
500 mT
700 mT
Figure4.Spin-orbitstabilizedspinsinWS2.a,Adiagramoftheini?alspindirec?onS(redarrow)andtransversemagne?cfieldBext(bluearrow)appliedintheplaneoftheWS2island.b,Spinlife?measafunc?onofspin-orbitfield,calculatedforfixedBextusingthemodelinreference12.c,Atlowspin-orbitcoupling,thespinsexhibitconven?onalbehaviorandprecessaboutBext(bluecurve).Atmuchlargerspin-orbitcoupling,Bextdoesnotinducespinprecession(orangecurve)andthespinlife?meisrobustagainstexternalfields.d,Kerrrota?onasafunc?onof?medelayfordifferentBext.Thenon-precessingdecaycurvesarecharacteris?cofthespin-orbit-stabilizedregime(orangecurveinc).e,Spinlife?measafunc?onofBext,obtainedbyfiX ngtheTRKRdatain(d).Thespinlife?meisrobusttoanexternalmagne?cfieldupto700mT,indica?ngthatWS2isinthespin-orbitstabilizedregime.f,Spinlife?measafunc?onoftemperature.Theinsetshowsrepresenta?vedelayscansatdifferenttemperatures. Themagne?cfieldandtemperaturedependencesweremeasuredondifferentsamples.
BSO (T)
Time Delay (ns) Time Delay (ns)
0
Spin
Life
tim
e (
ns)
Temperature (K)
0.5 0 2 1
0
1
-1
Ca
lcu
late
d
Life
tim
e (
ns)
0
Calc
ula
ted
SZ (
a.u
.)
0 200 50 100 150
3
4
2
1
0
30 K 60 K 110 K 180 K K
err
R
ota
tio
n (
a.u
.)
0 4 Time Delay (ns)
2
(a)
(b) 5
0 20 10 30
1 1.5 3 4 5
(c)
(d) (e)
(f)
BSO = 2 T BSO = 25 T
2
Conventional Spin-Orbit Stabilized
Linear Probe
Circular
Pump
100xObjective
θK
0 2 4 8 10
0.5
0.0
2.0
1.0
0.0 -20 0 20 40
Time Delay Dt (ns)
Dt (ps)
Ke
rr R
ota
tio
n q
K (a
.u.)
qK (
a.u
.)
6
Figure1.TimeresolvedKerrrota4ononhighqualityCVDWS2monolayers.a,(le$)TheatomicstructureofWS2;tungstenisthecentralblueatom,andthesulfuratomsareyellow.(right)Theschema?cbandstructureofmonolayerWS2attheKand-Kpoints.Thespin-valleycouplingallowsonetoselec?velyexcitespinsineithertheKor-Kvalley.b,Op?calmicrographofoneofthetriangularislandsusedinthisstudy.c,PhotoluminescencespectroscopyofmonolayerWS2measuredat6K.d,DiagramoftheTRKRmicroscopyset-up.e,Representa?veKerrrota?onasafunc?onofpump-probe?medelayformonolayerWS2at6Kandzeromagne?cfield.Theredcurveisabi-exponen?alfityielding?meconstantsof320psand5.4ns.Inset:Kerrrota?onatshort?medelays.Anexponen?alfittothefastdecay(greencurve)yieldsa?meconstantof3.0ps.
5 μm
(a) (b)
(c) (d)
1.0 (e)
Inte
nsity (
a.u
.) 10000
5000
0 600 700 800 900 1000
Wavelength (nm)
6 K
6 K
Γ
K -K
K
K
-K
-K
-K K
σ+σ-
Yang et. al (Crooker), Nature Phys. 11, 830 (2015).
Intervalley scattering model for spin relaxation
Page 24
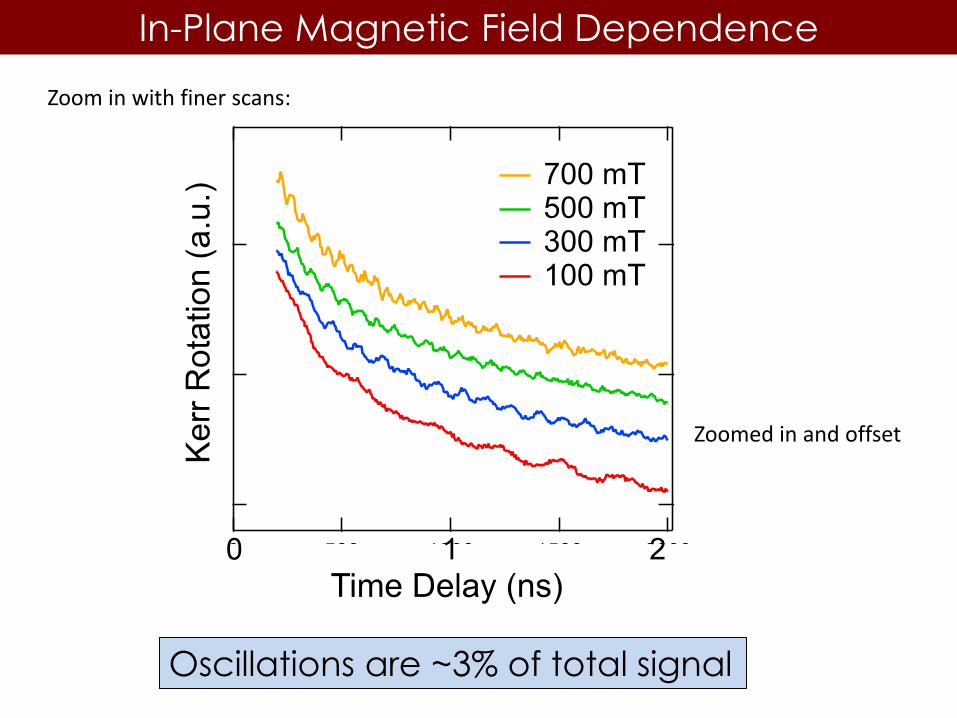
In-Plane Magnetic Field Dependence
Non-precessing spin in the spin-orbit stabilized regime
Page 25
In-Plane Magnetic Field Dependence
Oscillations are ~3% of total signal
Zoom in with finer scans:
Zoomed in and offset
Page 26
In-Plane Magnetic Field Dependence
Small population of precessing spins
0.5
1.5
0.0
1.0
1/T
2*
(GH
z)
10
0
20
nL (
GH
z)
6 8 0 200 400 600 800
Magnetic Field (mT) 0 200 400 600 800
Magnetic Field (mT)
Page 27
Temperature Dependence
Sp
in L
ifetim
e (
ns)
0
2
4
6
8
0 200 400 600 800
Magnetic Field (mT)
Time Delay (ns)
Ke
rr R
ota
tion
(a
.u.)
0 2 4 6 8
0 mT
100 mT
300 mT
500 mT
700 mT
Figure4.Spin-orbitstabilizedspinsinWS2.a,Adiagramoftheini?alspindirec?onS(redarrow)andtransversemagne?cfieldBext(bluearrow)appliedintheplaneoftheWS2island.b,Spinlife?measafunc?onofspin-orbitfield,calculatedforfixedBextusingthemodelinreference12.c,Atlowspin-orbitcoupling,thespinsexhibitconven?onalbehaviorandprecessaboutBext(bluecurve).Atmuchlargerspin-orbitcoupling,Bextdoesnotinducespinprecession(orangecurve)andthespinlife?meisrobustagainstexternalfields.d,Kerrrota?onasafunc?onof?medelayfordifferentBext.Thenon-precessingdecaycurvesarecharacteris?cofthespin-orbit-stabilizedregime(orangecurveinc).e,Spinlife?measafunc?onofBext,obtainedbyfiX ngtheTRKRdatain(d).Thespinlife?meisrobusttoanexternalmagne?cfieldupto700mT,indica?ngthatWS2isinthespin-orbitstabilizedregime.f,Spinlife?measafunc?onoftemperature.Theinsetshowsrepresenta?vedelayscansatdifferenttemperatures. Themagne?cfieldandtemperaturedependencesweremeasuredondifferentsamples.
BSO (T)
Time Delay (ns) Time Delay (ns)
0
Sp
in L
ife
tim
e (
ns)
Temperature (K)
0.5 0 2 1
0
1
-1
Calc
ula
ted
Lifetim
e (
ns)
0
Calc
ula
ted
SZ (
a.u
.)
0 200 50 100 150
3
4
2
1
0
30 K 60 K 110 K 180 K K
err
R
ota
tio
n (
a.u
.)
0 4 Time Delay (ns)
2
(a)
(b) 5
0 20 10 30
1 1.5 3 4 5
(c)
(d) (e)
(f)
BSO = 2 T BSO = 25 T
2
Conventional Spin-Orbit Stabilized
Page 28
Outlook
Linear Probe
Circular
Pump
100xObjective
θK
0 2 4 8 10
0.5
0.0
2.0
1.0
0.0 -20 0 20 40
Time Delay Dt (ns)
Dt (ps)
Ke
rr R
ota
tio
n q
K (a
.u.)
qK (
a.u
.)
6
Figure1.TimeresolvedKerrrota4ononhighqualityCVDWS2monolayers.a,(le$)TheatomicstructureofWS2;tungstenisthecentralblueatom,andthesulfuratomsareyellow.(right)Theschema?cbandstructureofmonolayerWS2attheKand-Kpoints.Thespin-valleycouplingallowsonetoselec?velyexcitespinsineithertheKor-Kvalley.b,Op?calmicrographofoneofthetriangularislandsusedinthisstudy.c,PhotoluminescencespectroscopyofmonolayerWS2measuredat6K.d,DiagramoftheTRKRmicroscopyset-up.e,Representa?veKerrrota?onasafunc?onofpump-probe?medelayformonolayerWS2at6Kandzeromagne?cfield.Theredcurveisabi-exponen?alfityielding?meconstantsof320psand5.4ns.Inset:Kerrrota?onatshort?medelays.Anexponen?alfittothefastdecay(greencurve)yieldsa?meconstantof3.0ps.
5 μm
(a) (b)
(c) (d)
1.0 (e)
Inte
nsity (
a.u
.) 10000
5000
0 600 700 800 900 1000
Wavelength (nm)
6 K
6 K
Γ
K -K
K
K
-K
-K
-K K
σ+σ-
EF
Tune Fermi level
Next steps
Image Dynamics of Spin Hall Effect
Page 29
• Overview
• Spin Torque Dynamics in FM/HM bilayers
• Spin Dynamics in Transition Metal Dichalcogenides
• Summary
Outline
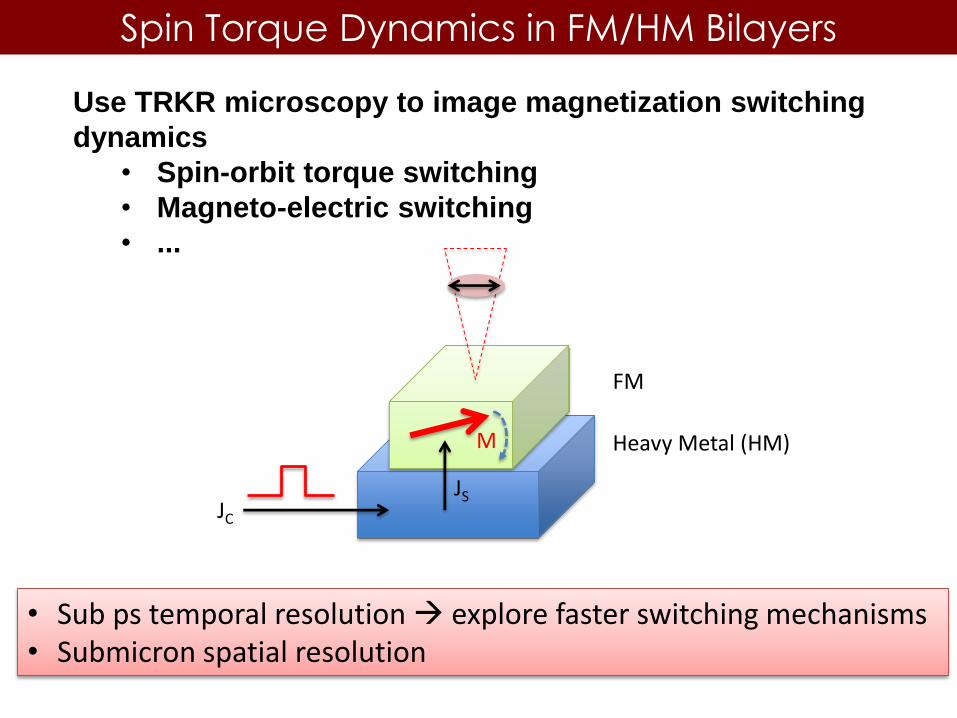
Page 30
Use TRKR microscopy to image magnetization switching
dynamics
• Spin-orbit torque switching
• Magneto-electric switching
• ...
Spin Torque Dynamics in FM/HM Bilayers
JC
• Sub ps temporal resolution explore faster switching mechanisms• Submicron spatial resolution
FM
Heavy Metal (HM)
JS
M
Page 31
Quantifying spin-orbit torques
Quantify the Anti-Damping Torque and Field-Like Torque
Spin-orbit torques change the equilibrium direction of M
Page 32
-20 -10 0 10 2040
50
60
70
80
90
V (
mV
)
Magnetic Field (mT)
-20 -10 0 10 208.8
8.9
9.0
9.1
9.2
V (
mV
)
Magnetic Field (mT)
Quantifying spin-orbit torques
John Xiao’s data: Pt(5nm)/CoFeB(0.85nm)
Our data: Pt(6nm)/Fe(4nm)
Dmpolar = hSOT + hoersted
hSOT ~ tT (m x s)
Heff+Meff
SOT polar MOKE
Regular Longitudinal MOKE hysteresis loop
10 mA
SOT polarMOKE
12 mA
Page 33
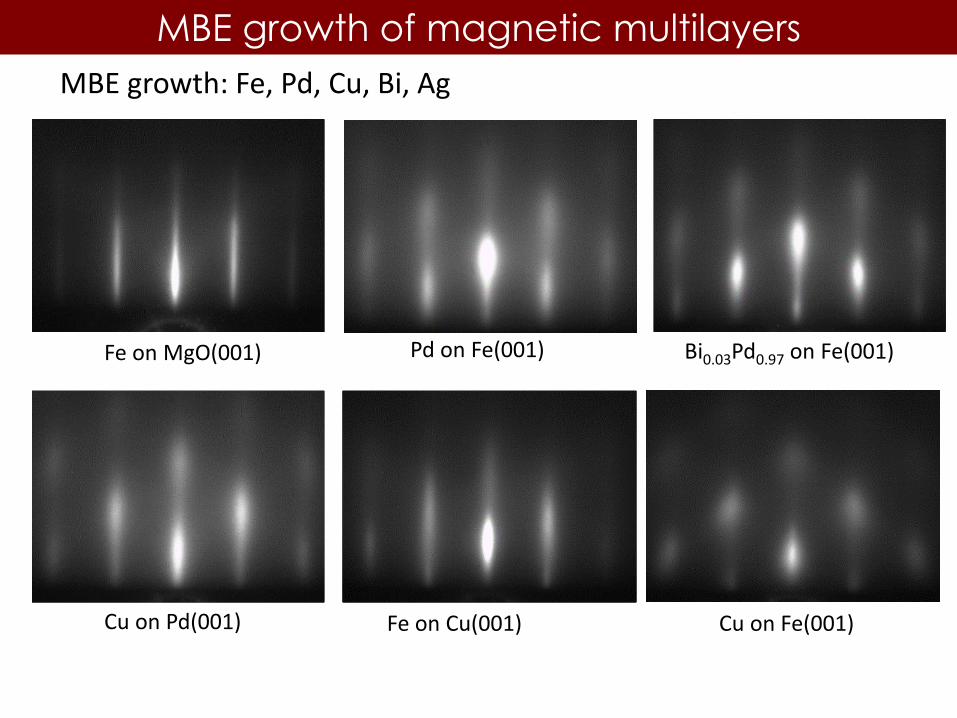
MBE growth of magnetic multilayers
MBE growth: Fe, Pd, Cu, Bi, Ag
Fe on MgO(001) Pd on Fe(001) Bi0.03Pd0.97 on Fe(001)
Cu on Pd(001) Fe on Cu(001) Cu on Fe(001)
Page 34
• Observed complex spatial depedence of spin density in WS2
• Anticorrelation between PL and TRKR in WS2
• Spin in WS2 are stabilized by spin-orbit against external fields and thermal fluctuations
• Progress on spin-orbit torques in FM/HM bilayers
Summary