29
IN VESTO R P R E S E N TATIO N 1Q 2015 OPERATIONALRESULTS published on April 22, 2015
| Date post: | 15-Aug-2015 |
| Category: |
Data & Analytics |
| Upload: | magnit-ir-team |
| View: | 260 times |
| Download: | 0 times |
INVESTOR PRESENTATION
1Q 2015 OPERATIONAL RESULTS published on April 22, 2015
2
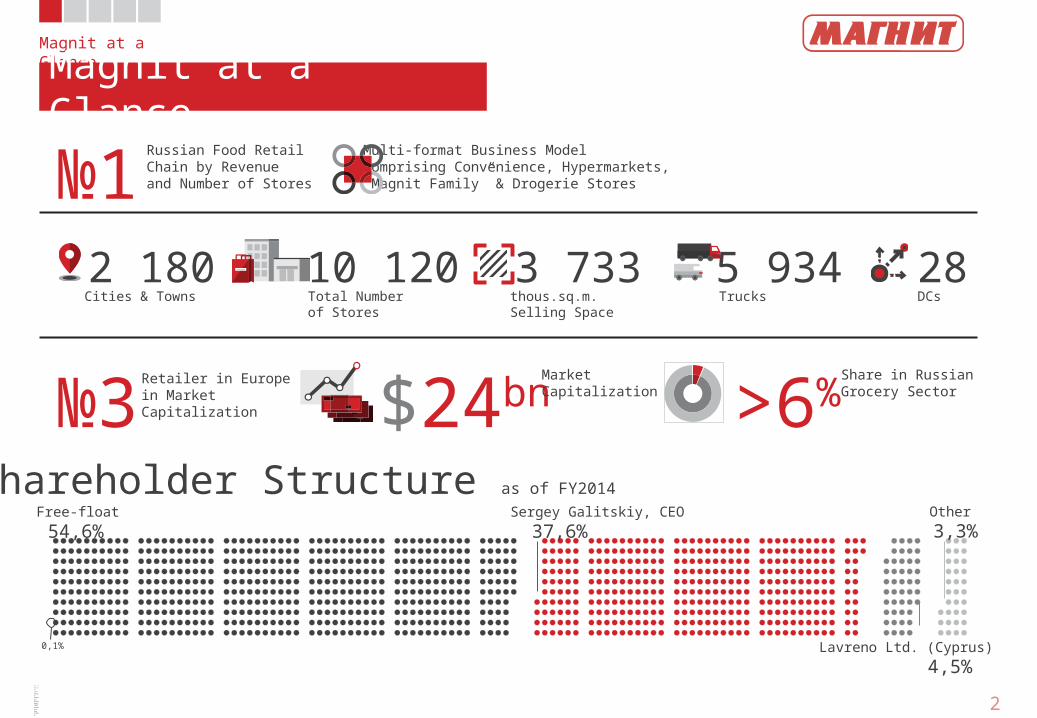
Magnit at a Glance
Magnit at a Glance
As of March 31, 2015 Source: Company, Bloomberg, IFRS accounts for FY2014
2 180Cities & Towns
№1Russian Food RetailChain by Revenueand Number of Stores
10 120Total Numberof Stores
3 733thous.sq.m.Selling Space
28DCs
5 934Trucks
Multi-format Business ModelComprising Convenience, Hypermarkets,“Magnit Family” & Drogerie Stores
№3Retailer in Europein MarketCapitalization $24bn
MarketCapitalization >6%
Share in RussianGrocery Sector
Shareholder Structure as of FY2014
54,6%Free-float
37,6%Sergey Galitskiy, CEO
3,3%Other
4,5%Lavreno Ltd. (Cyprus)0,1
%
Source: IFRS accounts for FY2014, Company’s Estimates
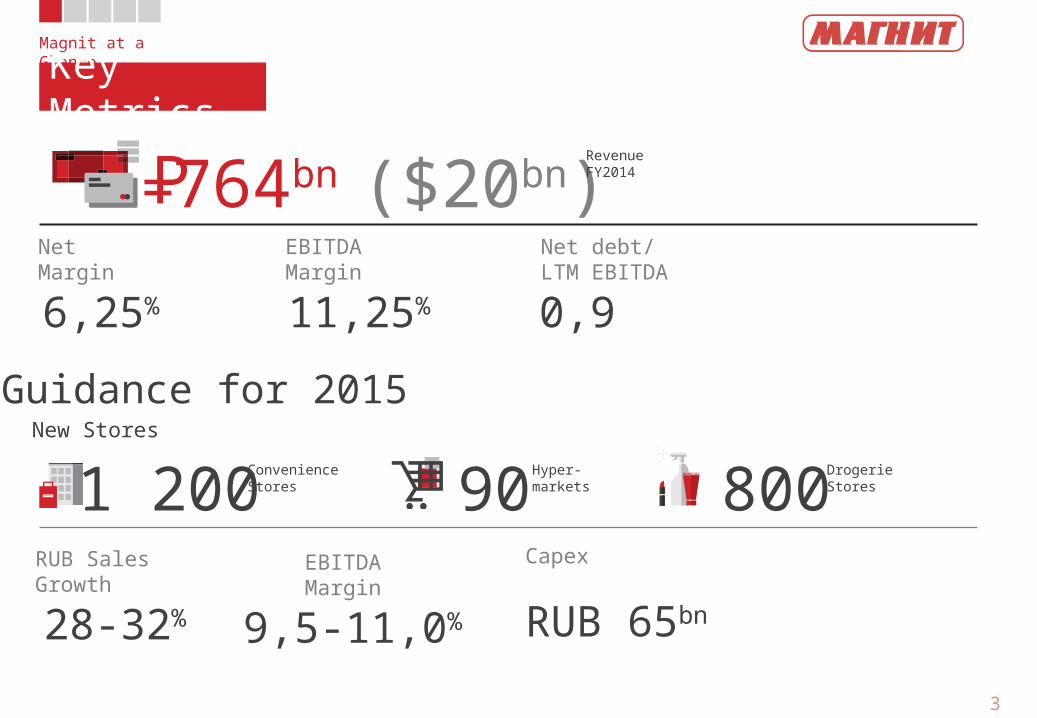
Magnit at a GlanceKey Metrics
3
Guidance for 2015New Stores
764bn ($20bn)RevenueFY2014
6,25%
NetMargin
11,25%
EBITDAMargin
0,9
Net debt/LTM EBITDA
1 200ConvenienceStores 90
Hyper-markets 800
Drogerie Stores
28-32%
RUB SalesGrowth
9,5-11,0%
EBITDAMargin
RUB 65bn
Capex
P=

4
Magnit at a GlanceStrategy
Growth
Value Efficiency
Multi-format OrganicStore Growth
GeographicScope
Density of StoreCoverage
LowPrices
HighQuality
Assortment CostManagement
VerticalIntegration
Centralization
5
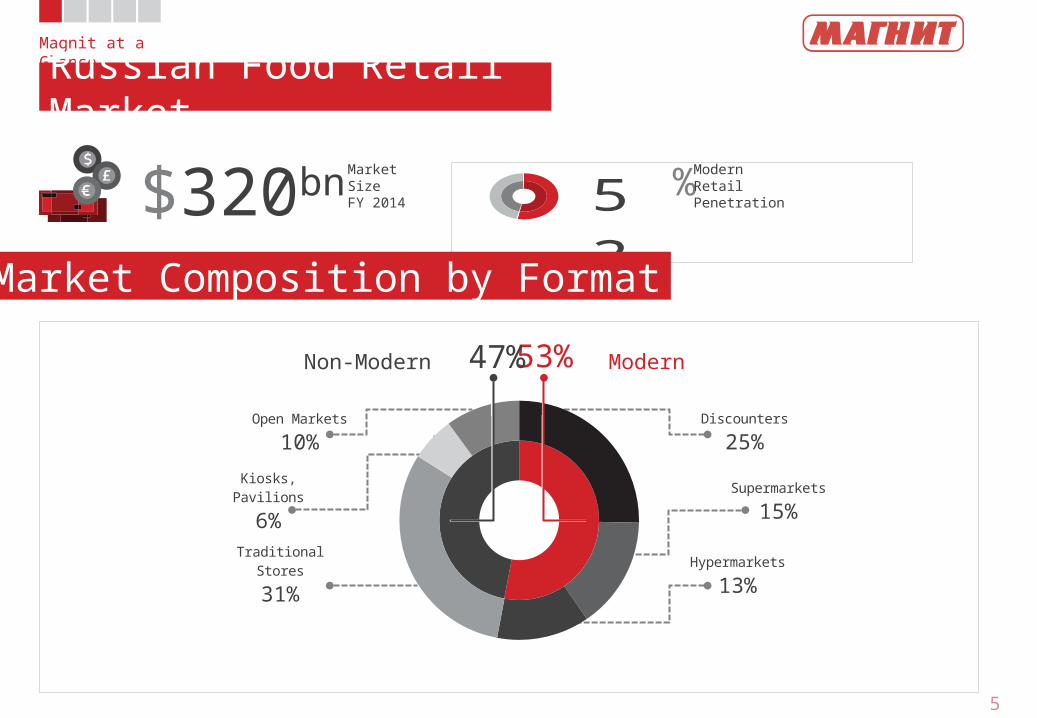
53
53%
47%
Discounters
25%
Super-markets
15%
Hyper-markets
13%
Traditional Stores
31%
Kiosks, Pavil-ions
6%
Open Markets
10%
Magnit at a GlanceRussian Food Retail Market
Market Composition by Format
$320bnMarketSizeFY 2014 % Modern
RetailPenetration
Non-Modern Modern
Source: Sberbank CIB Estimates for FY2014
6
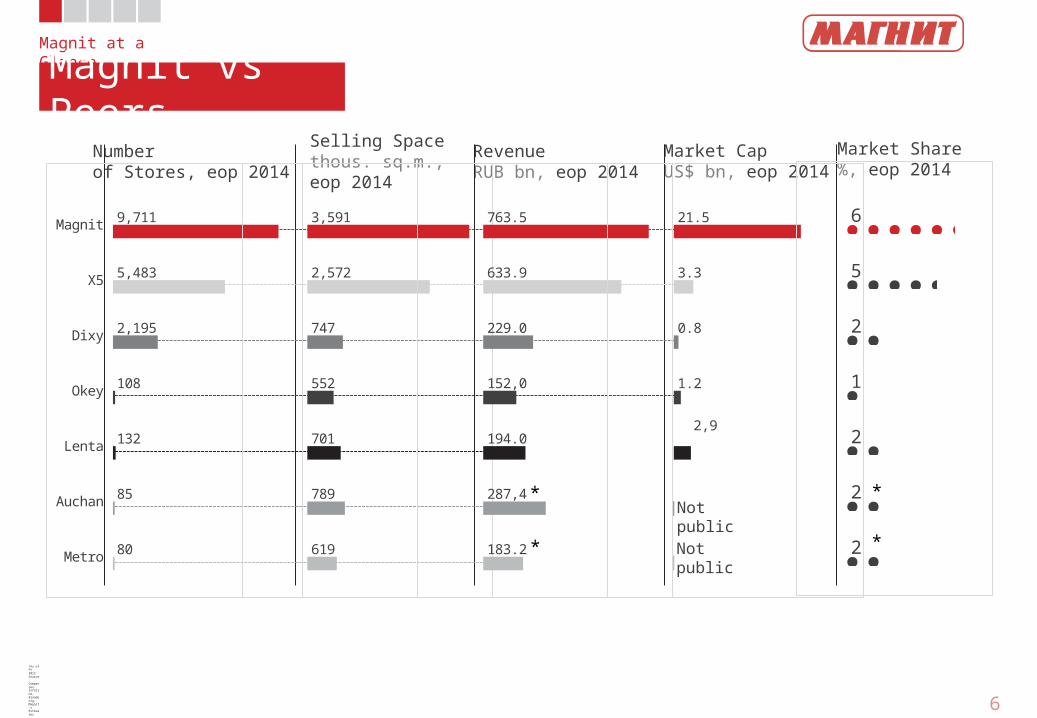
Magnit at a GlanceMagnit vs Peers
*As of FY 2013Source: Companies, Infoline, Bloomberg, Magnit’s Estimates
Numberof Stores, eop 2014
Selling Spacethous. sq.m., eop 2014
RevenueRUB bn, eop 2014
Market CapUS$ bn, eop 2014
Market Share%, eop 2014
Magnit
X5
Dixy
Okey
Lenta
Auchan
Metro
9,711
5,483
2,195
108
132
85
80
3,591
2,572
747
552
701
789
619
763.5
633.9
229.0
152,0
194.0
287,4
183.2
21.5
3.3
0.8
1.2
2,9
6
5
2
1
2
2
2
Not public
Not public
*
*
*
*
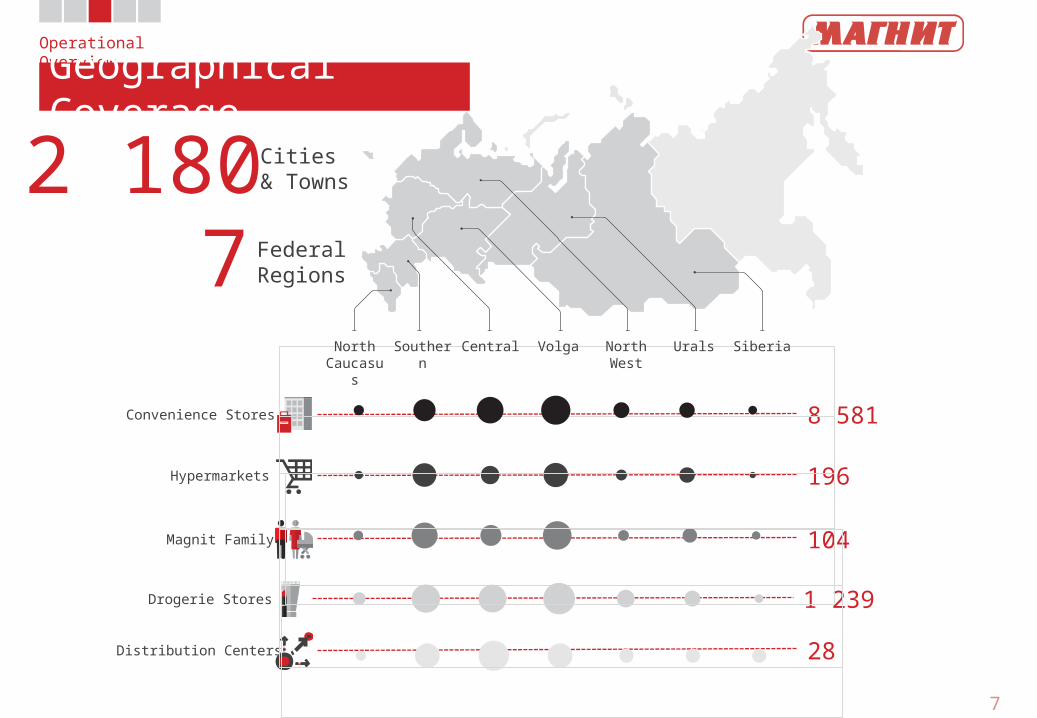
Source: Company, as of March 31, 2015 7
1 239Drogerie Stores
8 581Convenience Stores
196Hypermarkets
104Magnit Family
28Distribution Centers
Operational OverviewGeographical Coverage
2 180Cities& Towns
7 FederalRegions
North Caucasu
s
Southern Volga North West
Urals SiberiaCentral
Source: Company, as of March 31, 2015 8
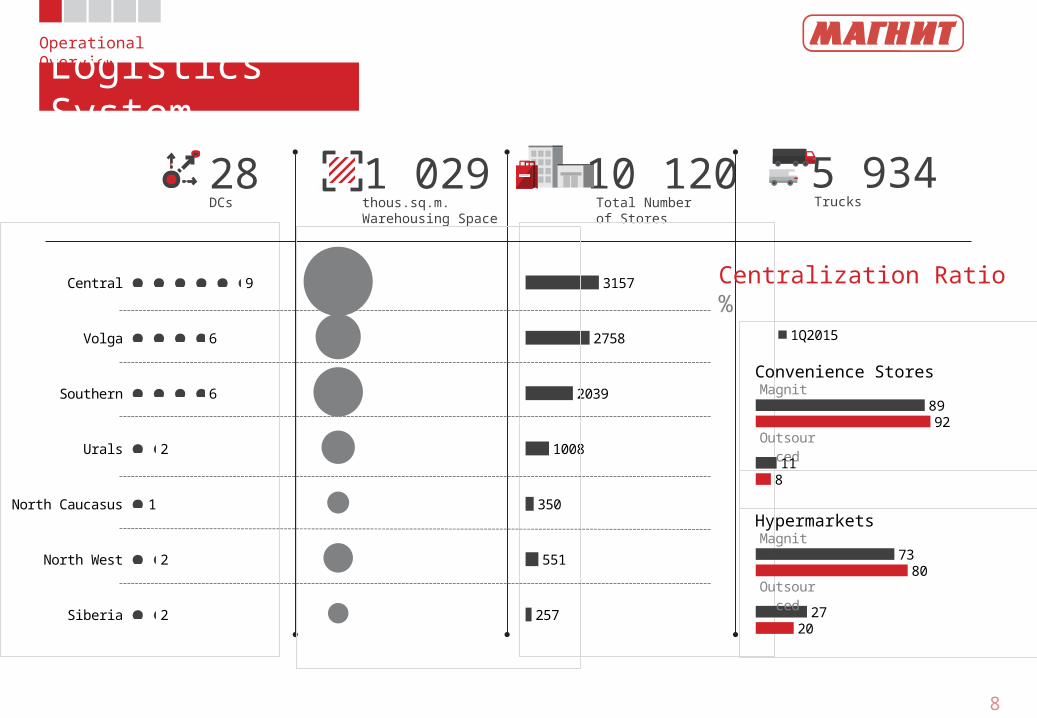
Operational OverviewLogistics System
10 120Total Numberof Stores
1 029thous.sq.m.Warehousing Space
28DCs
5 934Trucks
Central
Volga
Southern
Urals
North Caucasus
North West
Siberia
9
6
6
2
1
2
2
3157
2758
2039
1008
350
551
257
Centralization Ratio%
Magnit
Out-sourced
89
11
92
8
Convenience Stores
1Q2015
Magnit
Out-sourced
73
27
80
20
Hypermarkets
Source: Company, as of December 31, 2014 9
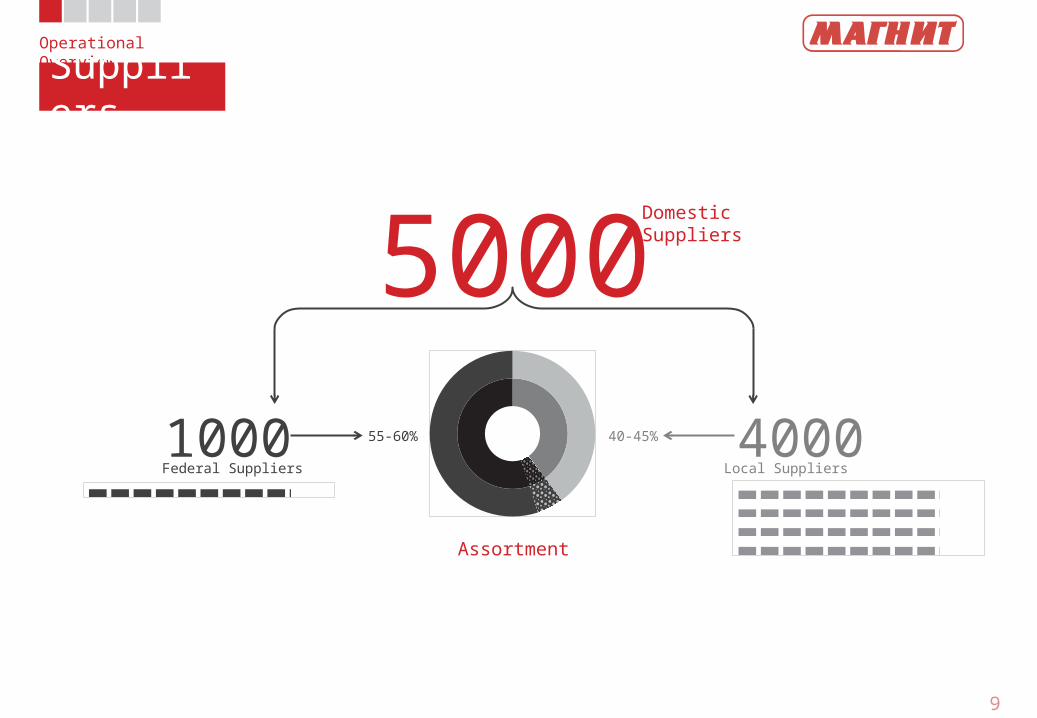
Operational OverviewSuppliers
5000DomesticSuppliers
4000Local Suppliers
1000Federal Suppliers
Assortment
55-60% 40-45%
10
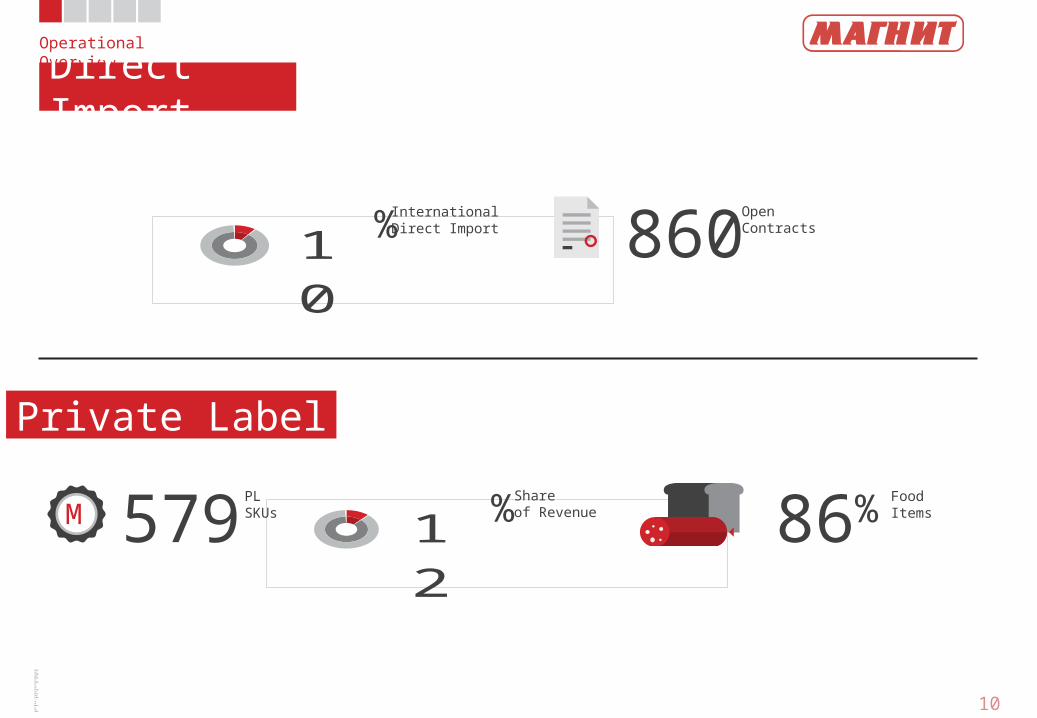
Operational OverviewDirect Import
Source: Company, Direct Import - as of FY2014; Private Label – as of March 31, 2015
12
% Shareof Revenue579
PLSKUsM 86% Food
Items
Private Label
10 % International
Direct Import 860OpenContracts
11
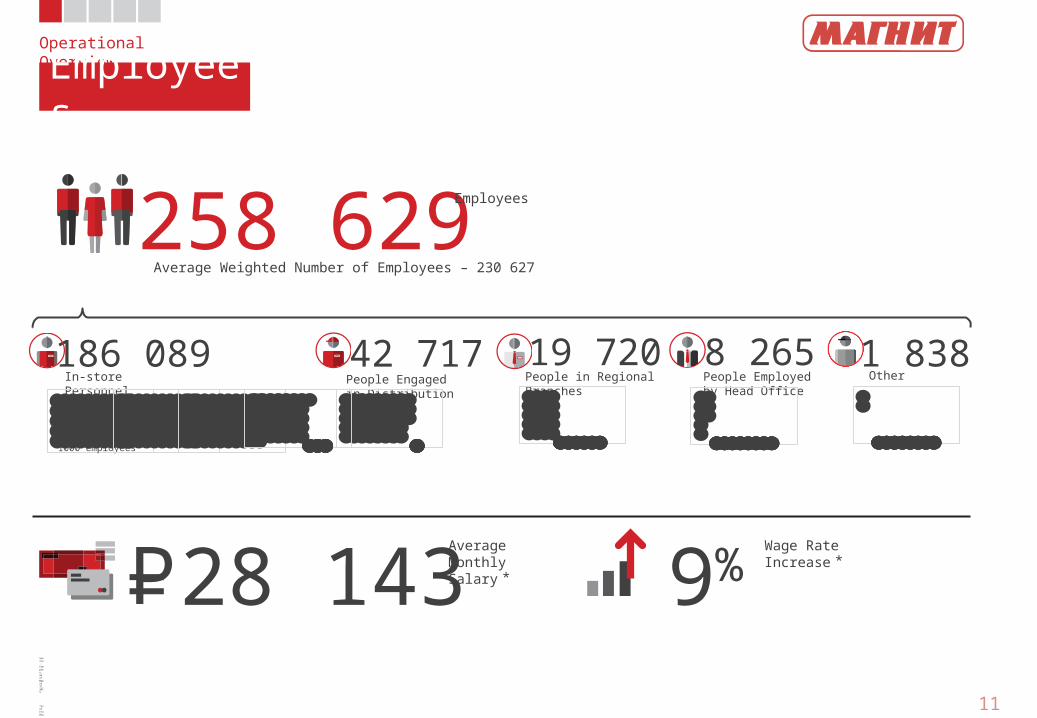
Operational OverviewEmployees
Source: Company, as of March 31, 2015 *as of FY2014
258 629Employees
28 143AverageMonthlySalary ⃰� 9%
Wage RateIncrease ⃰�P=
186 089In-storePersonnel
42 717People Engagedin Distribution
19 720People in RegionalBranches
8 265People Employedby Head Office
1000 employees
Average Weighted Number of Employees – 230 627
1 838Other
12
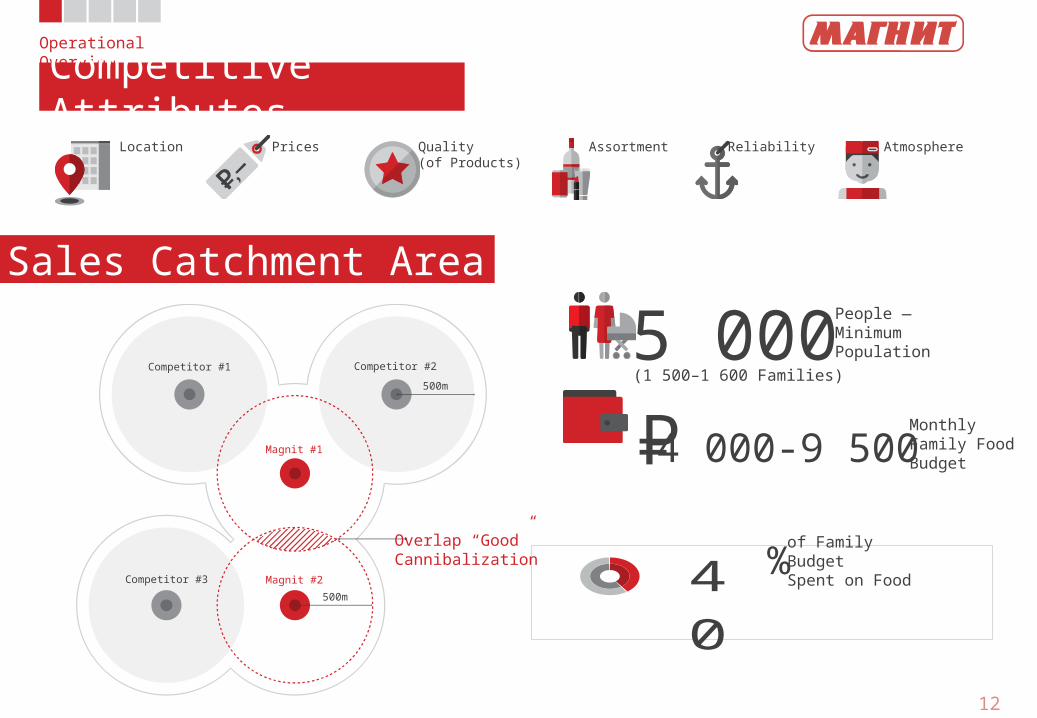
Operational OverviewCompetitive Attributes
40 %
of FamilyBudgetSpent on Food
Location Quality(of Products)
Assortment Reliability AtmospherePrices
5 000People —MinimumPopulation
(1 500–1 600 Families)
4 000-9 500MonthlyFamily FoodBudgetP=
Overlap “Good”Cannibalization
Magnit #1
Magnit #2
500m
Competitor #1 Competitor #2
Competitor #3
500m
Sales Catchment Area
Source: Company’s Estimates
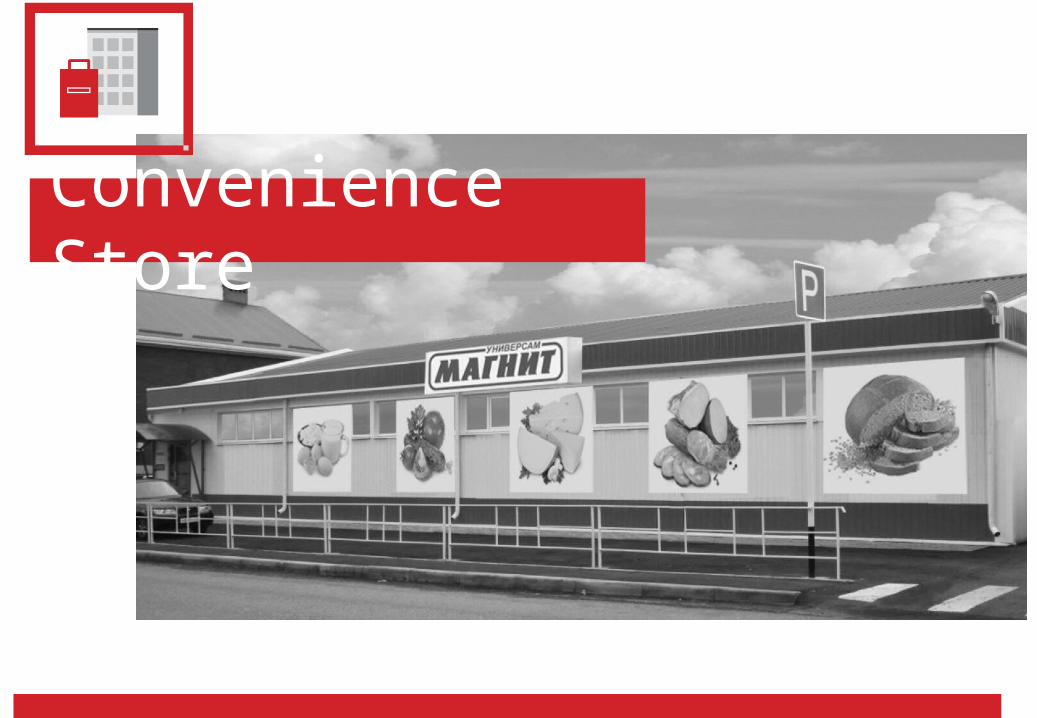
Convenience Store
Source: Company, as of March 31, 2015 14
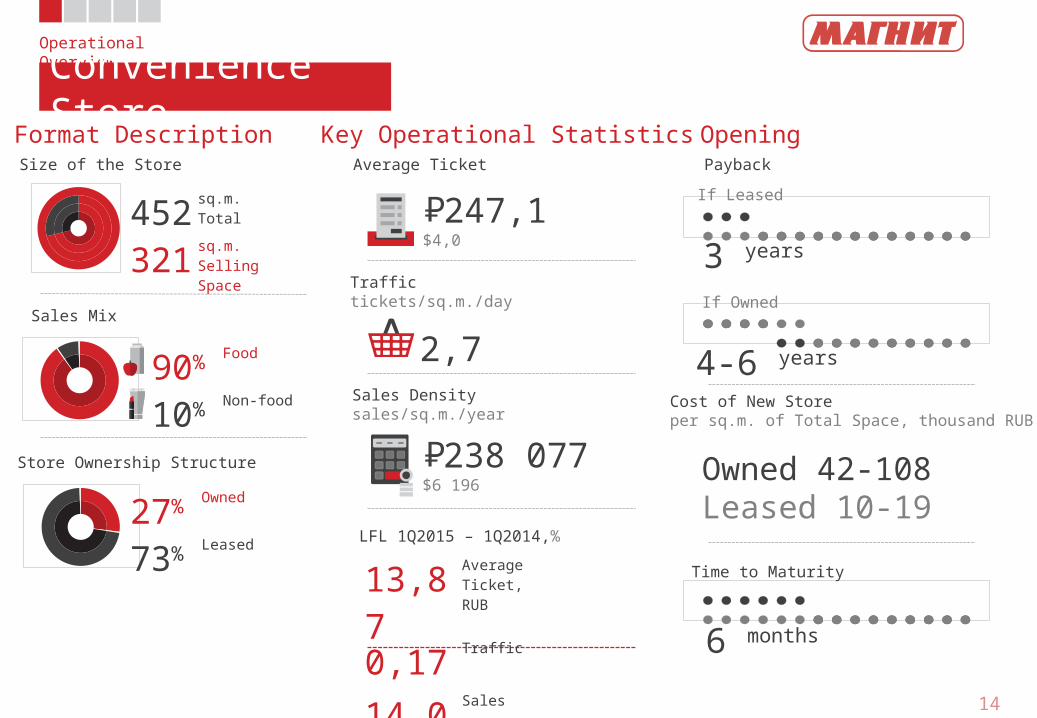
Operational OverviewConvenience Store
452
sq.m.Total
321
sq.m.Selling Space
90% Food
10% Non-food
27% Owned
73% Leased
Format Description Key Operational Statistics OpeningSize of the Store Average Ticket Payback
Store Ownership Structure
Sales Mix
Traffictickets/sq.m./day
Sales Densitysales/sq.m./year
LFL 1Q2015 – 1Q2014,%
247,1P=$4,0
238 077P=$6 196
13,87
AverageTicket, RUB
0,17 Traffic
14,06
Sales
2,7
3 years
If Leased
If Owned
Cost of New Storeper sq.m. of Total Space, thousand RUB
Time to Maturity
6 months
4-6 years
Owned 42-108Leased 10-19
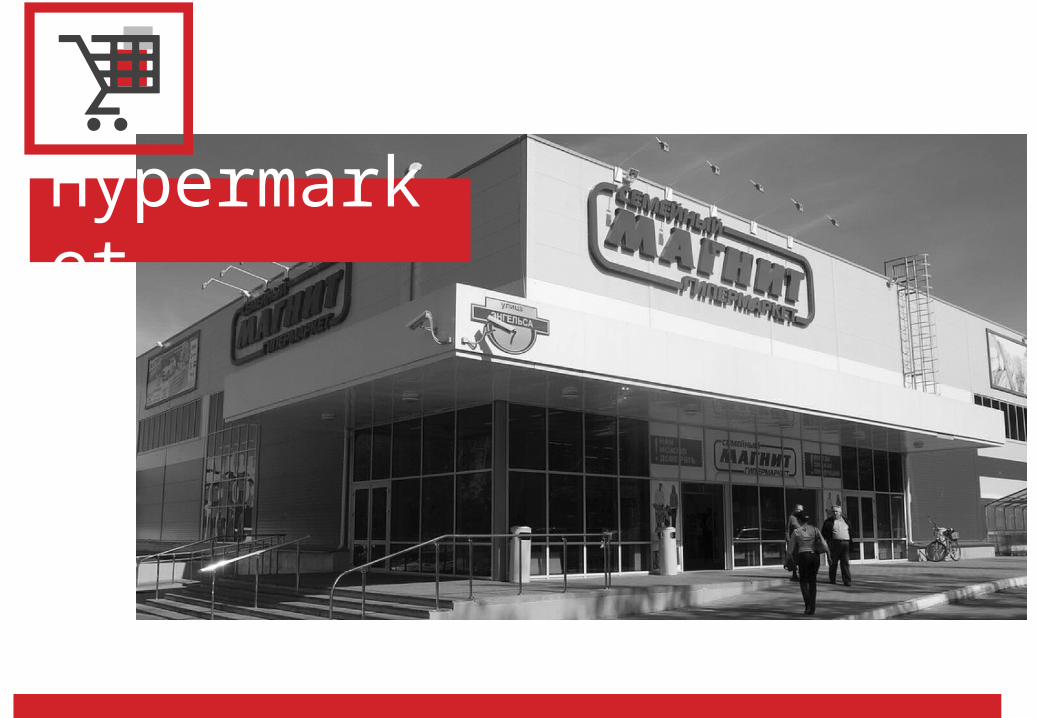
Hypermarket
Source: Company, as of March 31, 2015 16
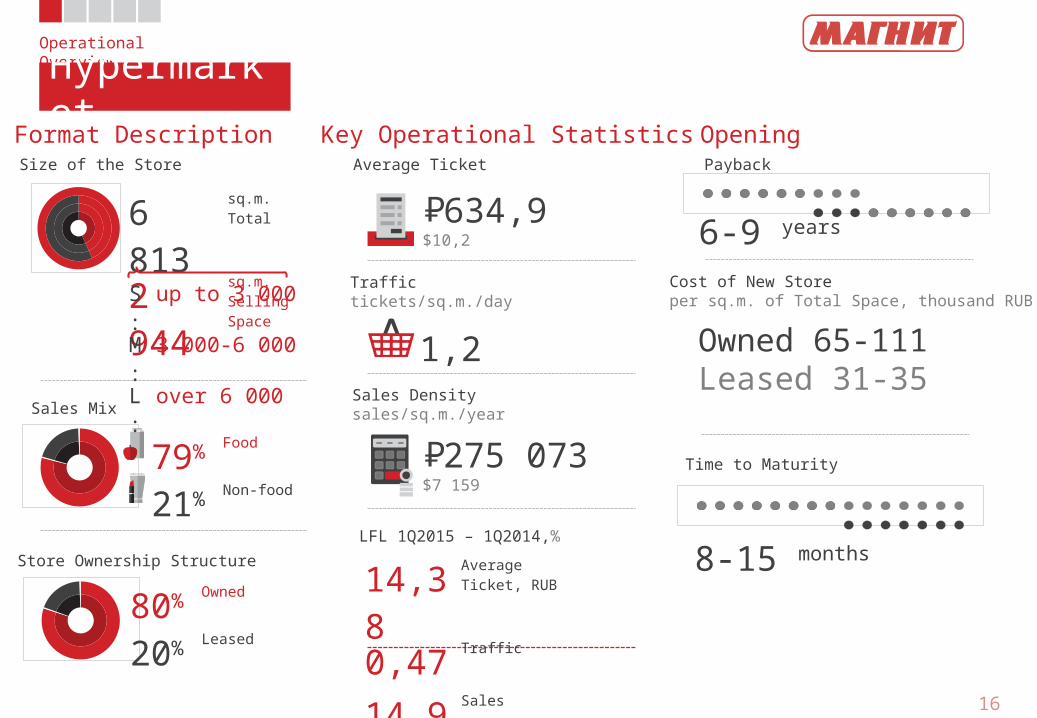
Operational OverviewHypermarket
79% Food
21% Non-food
80% Owned
20% Leased
Format Description Key Operational StatisticsSize of the Store Average Ticket
Store Ownership Structure
Sales Mix
Traffictickets/sq.m./day
Sales Densitysales/sq.m./year
LFL 1Q2015 – 1Q2014,%
634,9P=$10,2
275 073P=$7 159
1,2
6 813
sq.m.Total
2 944
sq.m.Selling Space
14,38
AverageTicket, RUB
0,47 Traffic
14,91
Sales
OpeningPayback
6-9 years
Cost of New Storeper sq.m. of Total Space, thousand RUB
Owned 65-111Leased 31-35
8-15 months
Time to Maturity
S: up to 3 000M:
3 000-6 000
L: over 6 000
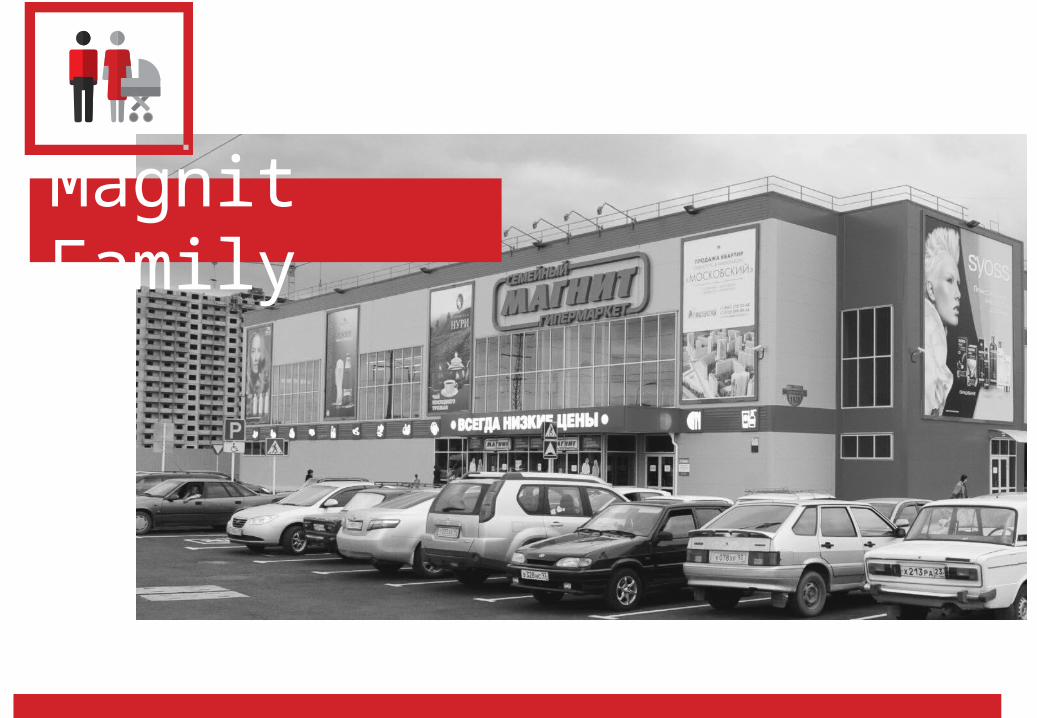
Magnit Family
Source: Company, as of March 31, 2015 18
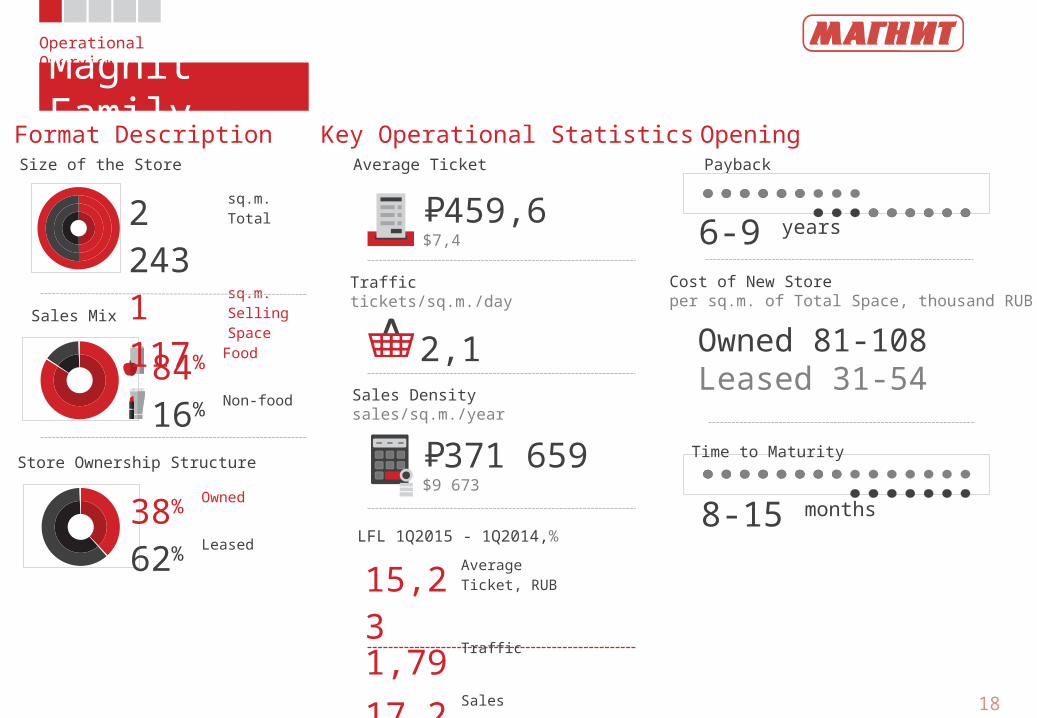
Operational OverviewMagnit Family
2 243
sq.m.Total
1 117
sq.m.Selling Space
84% Food
16% Non-food
38% Owned
62% Leased
Format Description Key Operational Statistics OpeningSize of the Store Average Ticket Payback
Store Ownership Structure
Sales Mix
Traffictickets/sq.m./day
Sales Densitysales/sq.m./year
LFL 1Q2015 - 1Q2014,%
459,6P=$7,4
371 659P=$9 673
2,1
6-9 years
Cost of New Storeper sq.m. of Total Space, thousand RUB
Owned 81-108Leased 31-54
8-15 months
15,23
AverageTicket, RUB
1,79 Traffic
17,29
Sales
Time to Maturity
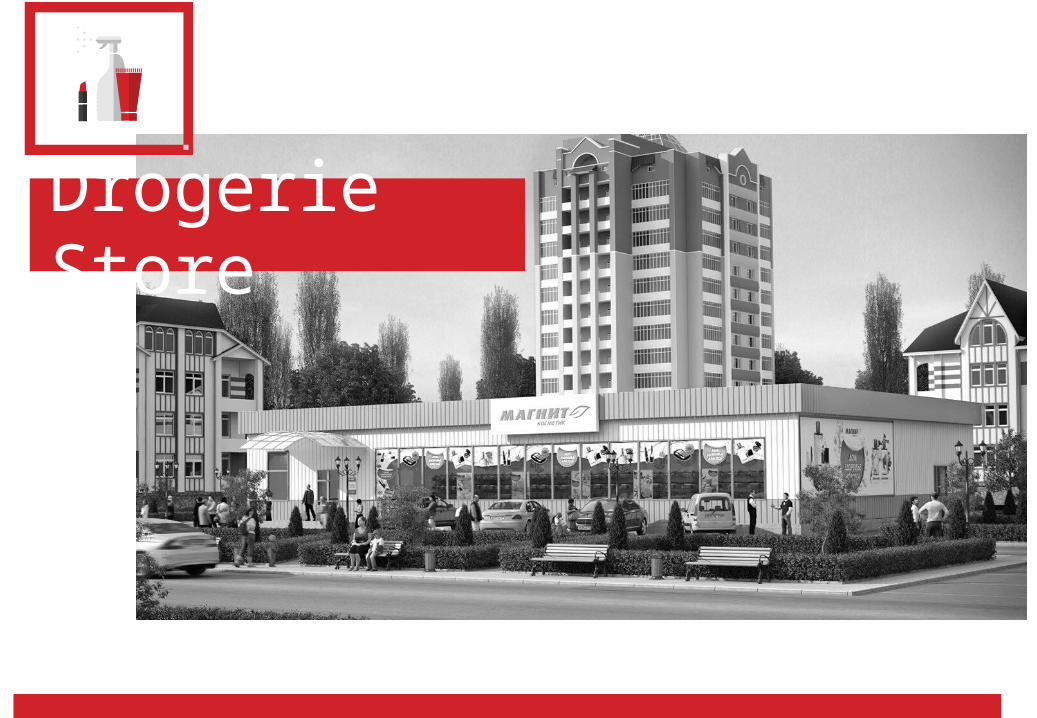
Drogerie Store
Source: Company, as of March 31, 2015 20
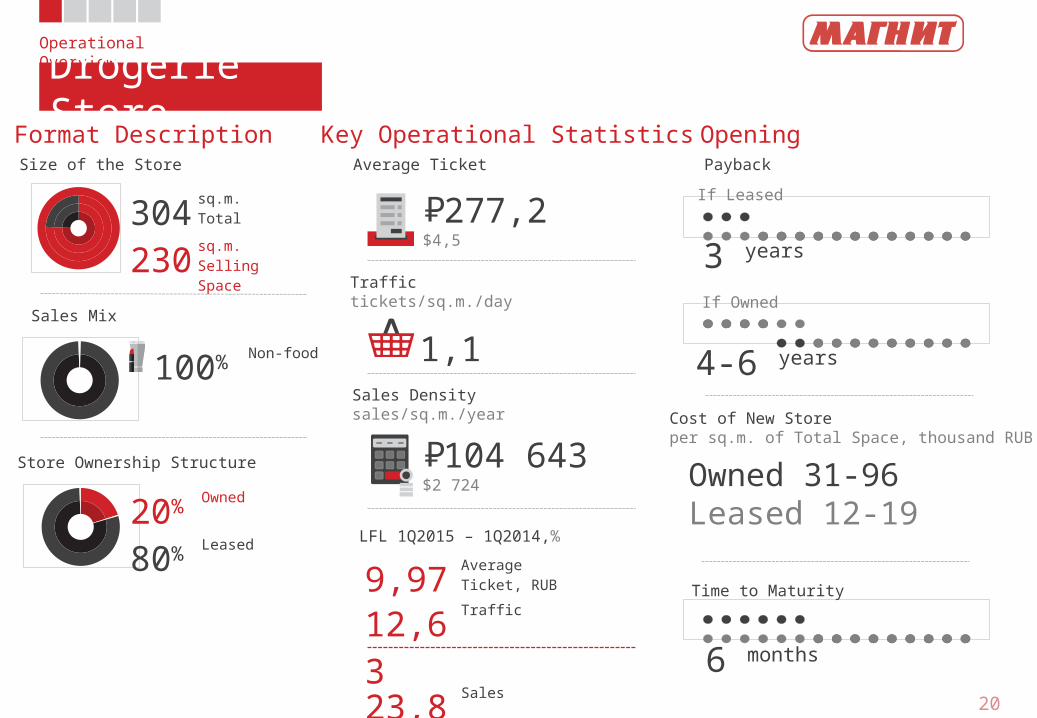
Operational OverviewDrogerie Store
304
sq.m.Total
230
sq.m.Selling Space
100% Non-food
20% Owned
80% Leased
Format Description Key Operational Statistics OpeningSize of the Store Average Ticket Payback
Store Ownership Structure
Sales Mix
Traffictickets/sq.m./day
Sales Densitysales/sq.m./year
LFL 1Q2015 – 1Q2014,%
277,2P=$4,5
104 643P=$2 724
9,97 AverageTicket, RUB
12,63
Traffic
23,86
Sales
1,1
3 years
If Leased
If Owned
Cost of New Storeper sq.m. of Total Space, thousand RUB
Time to Maturity
6 months
Owned 31-96Leased 12-19
4-6 years
21
Sizeof the Store
sq.m.
AverageTicket
TrafficTickets/
sq.m./day
DensitySales/
sq.m./year
SalesMix
LFL 1Q2015-1Q2014
%
Store Owner-
ship Structure
PaybackYears
Cost of New Store
per sq.m.of Total Space
Timeto Maturity
Months
• Total• Selling Space
• Food• Non-food
• Av.ticket• Traffic/ Sales
• Owned• Leased
20%80%
38%
62%
80%20%
27%73%
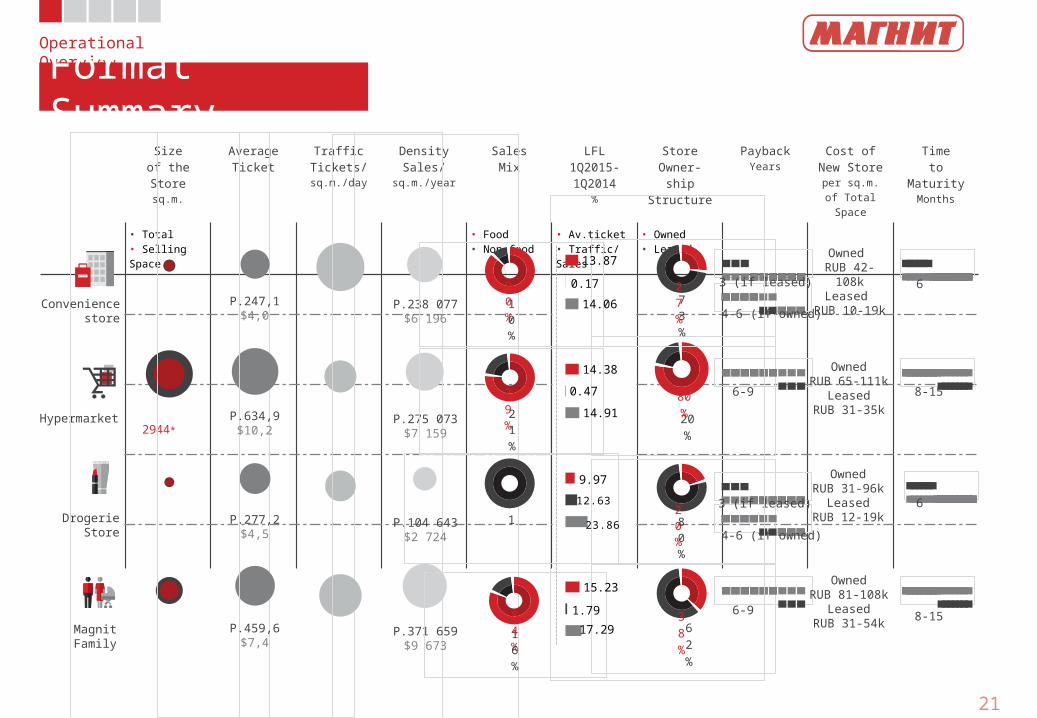
Operational OverviewFormat Summary
Source: Company, as of March 31, 2015; * Excludes selling space designated for leases
Hypermarket
DrogerieStore
MagnitFamily
2944*
Owned RUB 42-
108kLeased
RUB 10-19kP.247,1
$4,0
P.634,9$10,2
P.277,2$4,5
P.459,6$7,4
P.238 077$6 196
P.275 073$7 159
P.104 643$2 724
P.371 659$9 673
79%21%
1
84%16%
90%10%
Conveniencestore
6
8-15
6
8-15
3 (if leased)
6-9
3 (if leased)
6-9
4-6 (if owned)
4-6 (if owned)
13.87
14.38
9.97
15.23
0.17
0.47
12.63
1.79
14.06
14.91
23.86
17.29
OwnedRUB 65-111k
LeasedRUB 31-35k
OwnedRUB 31-96k
LeasedRUB 12-19k
OwnedRUB 81-108k
LeasedRUB 31-54k
22
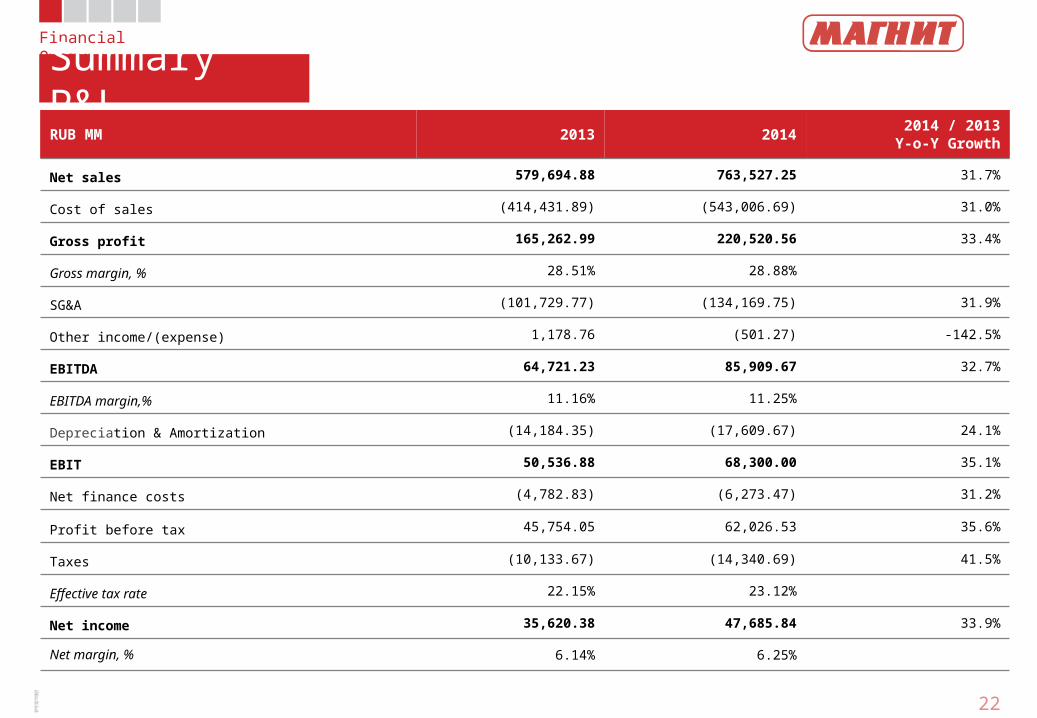
Financial OverviewSummary P&L
SG&A is presented net of Depreciation & Amortization (except for Depreciation of production fixed assets which was included in the Cost of sales)Source: Audited IFRS accounts for 2013 – 2014Please note: there may be small variations in calculation of totals, subtotals, and/or percentage change due to rounding of decimals
RUB MM 2013 2014 2014 / 2013Y-o-Y Growth
Net sales 579,694.88 763,527.25 31.7%
Cost of sales (414,431.89) (543,006.69) 31.0%
Gross profit 165,262.99 220,520.56 33.4%
Gross margin, % 28.51% 28.88%
SG&A (101,729.77) (134,169.75) 31.9%
Other income/(expense) 1,178.76 (501.27) -142.5%
EBITDA 64,721.23 85,909.67 32.7%
EBITDA margin,% 11.16% 11.25%
Depreciation & Amortization (14,184.35) (17,609.67) 24.1%
EBIT 50,536.88 68,300.00 35.1%
Net finance costs (4,782.83) (6,273.47) 31.2%
Profit before tax 45,754.05 62,026.53 35.6%
Taxes (10,133.67) (14,340.69) 41.5%
Effective tax rate 22.15% 23.12%
Net income 35,620.38 47,685.84 33.9%
Net margin, % 6.14% 6.25%
Source: IFRS accounts for FY2012–2014 23
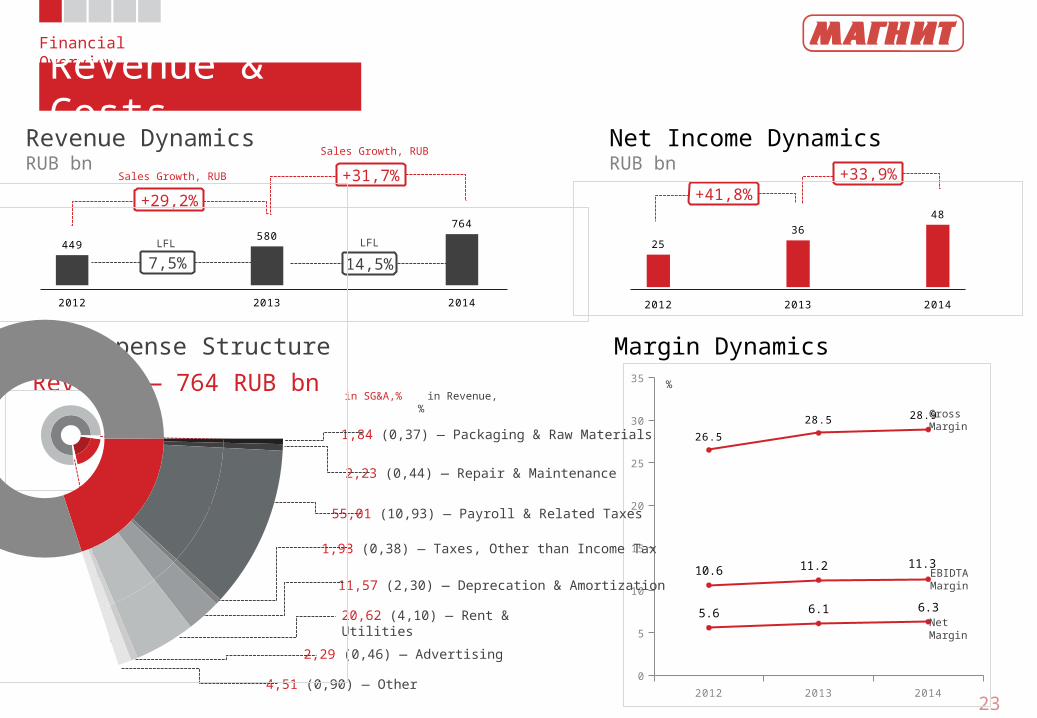
Financial OverviewRevenue & Costs
2012 2013 2014
0
5
10
15
20
25
30
35
26.5
28.5 28.9
10.6 11.2 11.3
5.6 6.1 6.3
Revenue DynamicsRUB bn
Net Income DynamicsRUB bn
Margin DynamicsSG&A Expense Structure
Revenue — 764 RUB bnGrossMargin
EBIDTAMargin
NetMargin
%
+29,2%
7,5% 14,5%
+31,7%+41,8%
+33,9%
LFLLFL
Sales Growth, RUB
Sales Growth, RUB
2012 2013 2014
449580
764
2012 2013 2014
2536
48
1,84 (0,37) ― Packaging & Raw Materials
2,23 (0,44) ― Repair & Maintenance
55,01 (10,93) ― Payroll & Related Taxes
1,93 (0,38) ― Taxes, Other than Income Tax
11,57 (2,30) ― Deprecation & Amortization
20,62 (4,10) ― Rent & Utilities
4,51 (0,90) ― Other
in SG&A,% in Revenue, %
2,29 (0,46) ― Advertising
20%
151 719 RUB mn
Source: IFRS accounts for FY2012 – 2014 24
GM2012
Trading Margin Transport Losses GM2013
Trading Margin Transport Losses GM2014
15
17
19
21
23
25
27
29
31
33
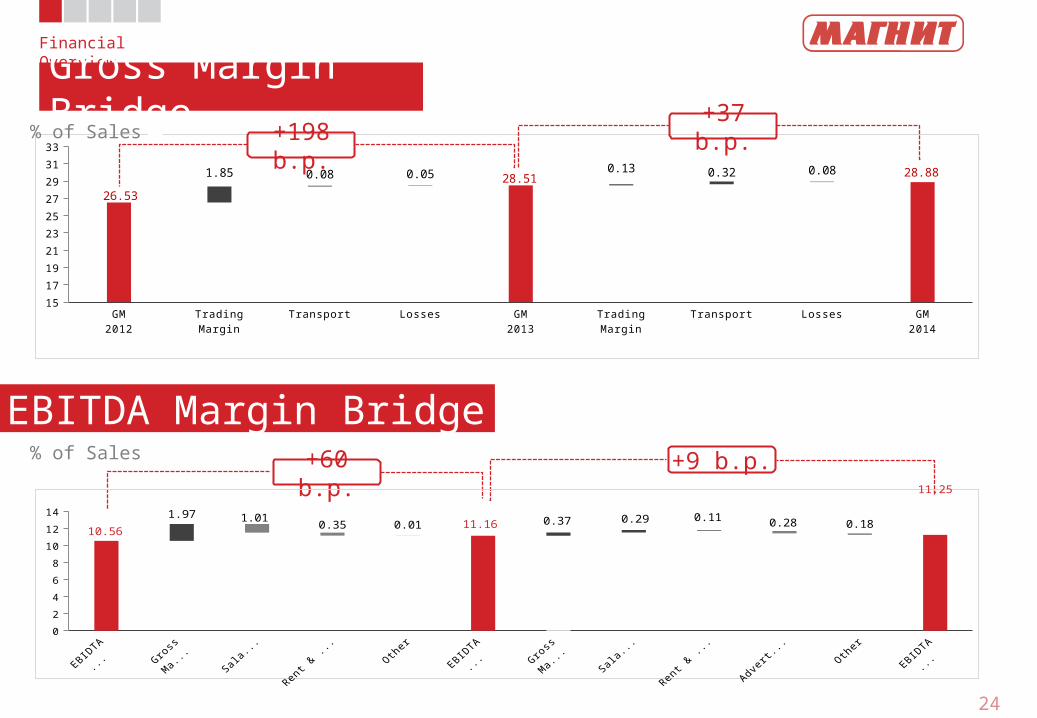
26.53
28.51 28.881.85 0.08 0.050.13 0.32 0.08
Financial OverviewGross Margin Bridge
EBITDA Margin Bridge
% of Sales
% of Sales
+198 b.p.
+37 b.p.
+60 b.p. +9 b.p.
EBIDTA2012
GrossMargin
Salaries Rent & Utilites
Other EBIDTA2013
GrossMargin
Salaries Rent & Utilites
Advertising Other EBIDTA2014
0
2
4
6
8
10
12
14
10.5611.16
11.25
1.970.37 0.291.01
0.35 0.010.11 0.28 0.18
Source: IFRS accounts for FY2013–2014 25
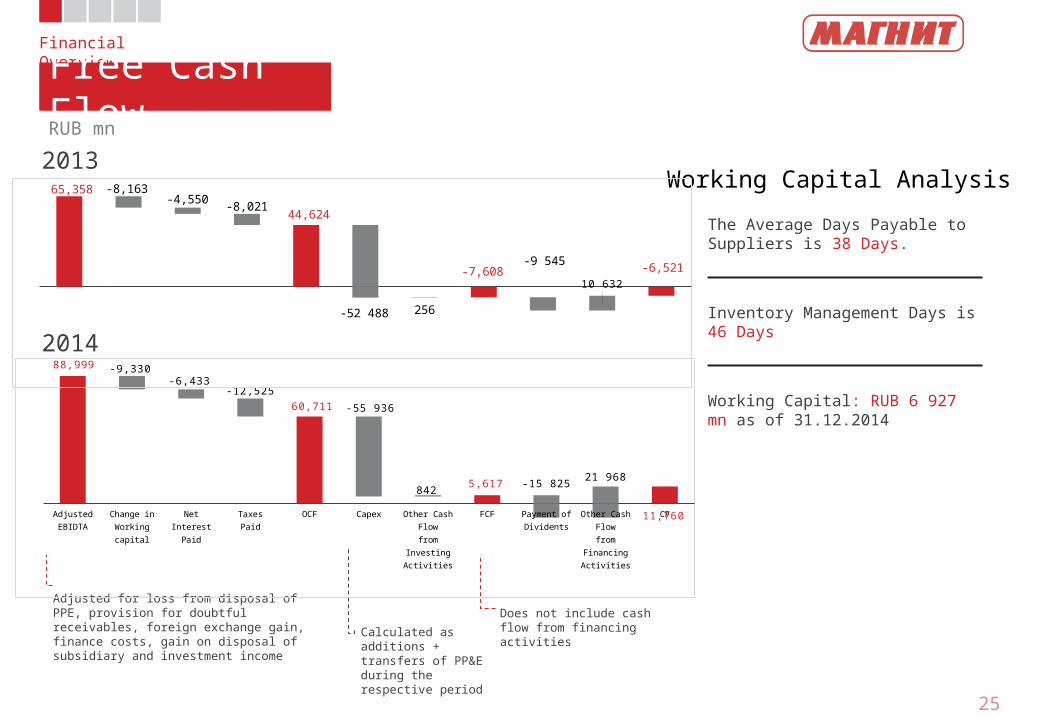
Financial OverviewFree Cash Flow
Working Capital Analysis
The Average Days Payable to Suppliers is 38 Days.
Inventory Management Days is 46 Days
Working Capital: RUB 6 927 mn as of 31.12.2014
RUB mn
2013
2014
Adjusted for loss from disposal of PPE, provision for doubtful receivables, foreign exchange gain, finance costs, gain on disposal of subsidiary and investment income
Calculated as additions + transfers of PP&E during the respective period
Does not include cash flow from financing activities
Adjust
ed
EBIDTA
Change in
Work
ing c
apital
Net Inte
rest
Paid
Taxe
s
Paid OCF
Capex
Other C
ash F
low
from
Inve
stin
g
Activ
ities
FCF
Paym
ent of D
ivid
ents
Other C
ash F
low
from
Fin
ancing
Activ
ities
CF
88,999
60,711
5,617
11,760
-9,330-6,433
-12,525
-55 936
-15 82521 968
842
65,358
44,624
-7,608 -6,521
-8,163-4,550
-8,021
-52 488 256
-9 545
10 632
26
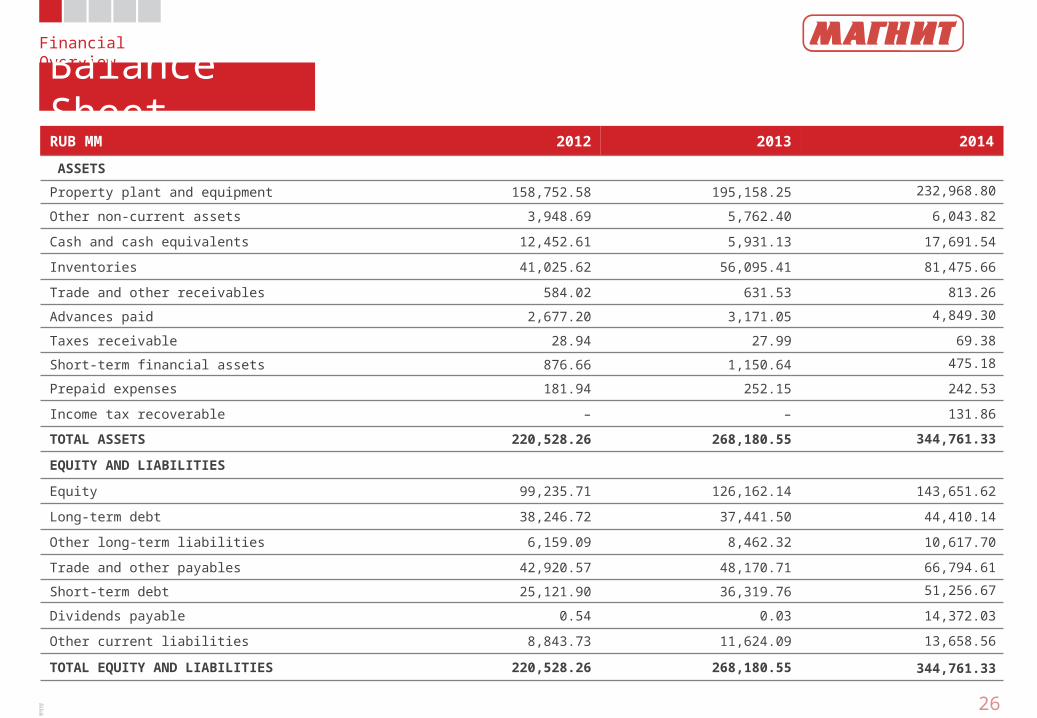
Financial OverviewBalance Sheet
Source: Audited IFRS accounts for FY2012 - 2014Please note: there may be small variations in calculation of totals, subtotals, and/or percentage change due to rounding of decimals
RUB MM 2012 2013 2014
ASSETS
Property plant and equipment 158,752.58 195,158.25 232,968.80
Other non-current assets 3,948.69 5,762.40 6,043.82
Cash and cash equivalents 12,452.61 5,931.13 17,691.54
Inventories 41,025.62 56,095.41 81,475.66
Trade and other receivables 584.02 631.53 813.26
Advances paid 2,677.20 3,171.05 4,849.30
Taxes receivable 28.94 27.99 69.38
Short-term financial assets 876.66 1,150.64 475.18
Prepaid expenses 181.94 252.15 242.53
Income tax recoverable – – 131.86
TOTAL ASSETS 220,528.26 268,180.55 344,761.33
EQUITY AND LIABILITIES
Equity 99,235.71 126,162.14 143,651.62
Long-term debt 38,246.72 37,441.50 44,410.14
Other long-term liabilities 6,159.09 8,462.32 10,617.70
Trade and other payables 42,920.57 48,170.71 66,794.61
Short-term debt 25,121.90 36,319.76 51,256.67
Dividends payable 0.54 0.03 14,372.03
Other current liabilities 8,843.73 11,624.09 13,658.56
TOTAL EQUITY AND LIABILITIES 220,528.26 268,180.55 344,761.33
27
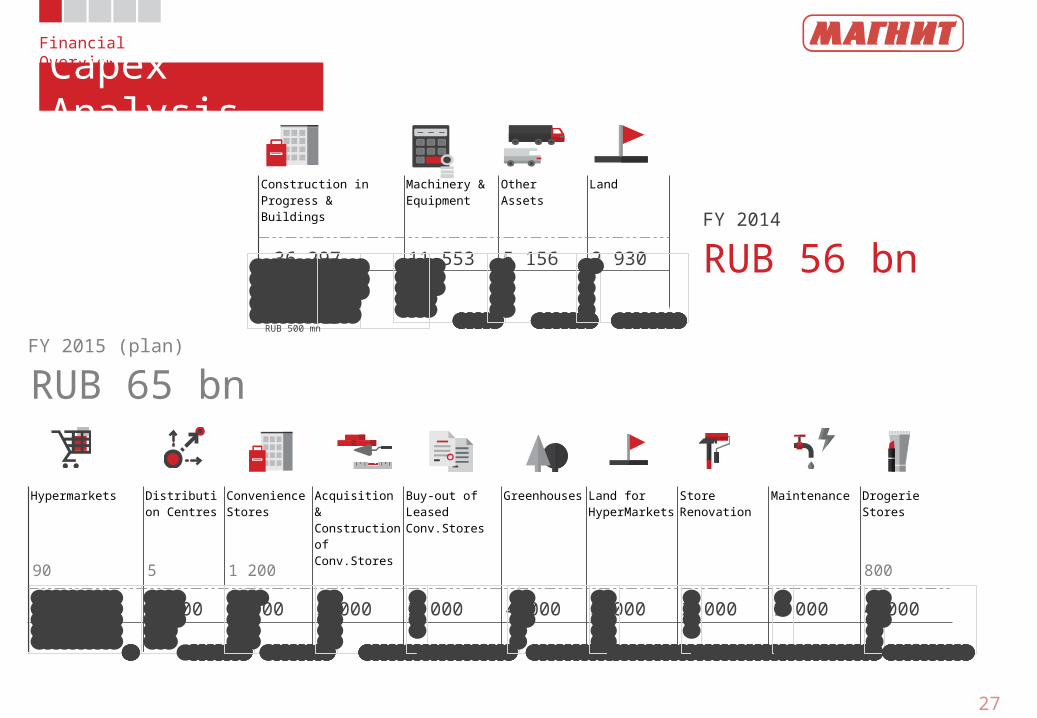
Financial OverviewCapex Analysis
Source: Company, as of December 31, 2014; Company’s Estimates
Construction in Progress & Buildings
Machinery & Equipment
Other Assets Land
36 297 11 553 5 156 2 930
FY 2014
RUB 56 bn
FY 2015 (plan)
RUB 65 bn
RUB 500 mn
Hypermarkets Distribution Centres
Convenience Stores
Acquisition & Construction of Conv.Stores
Buy-out of Leased Conv.Stores
Greenhouses Land for HyperMarkets
Store Renovation
Maintenance Drogerie Stores
90 5 1 200 800
25 000 9 000 8 000 5 000 2 000 4 000 5 000 2 000 1 000 4 000
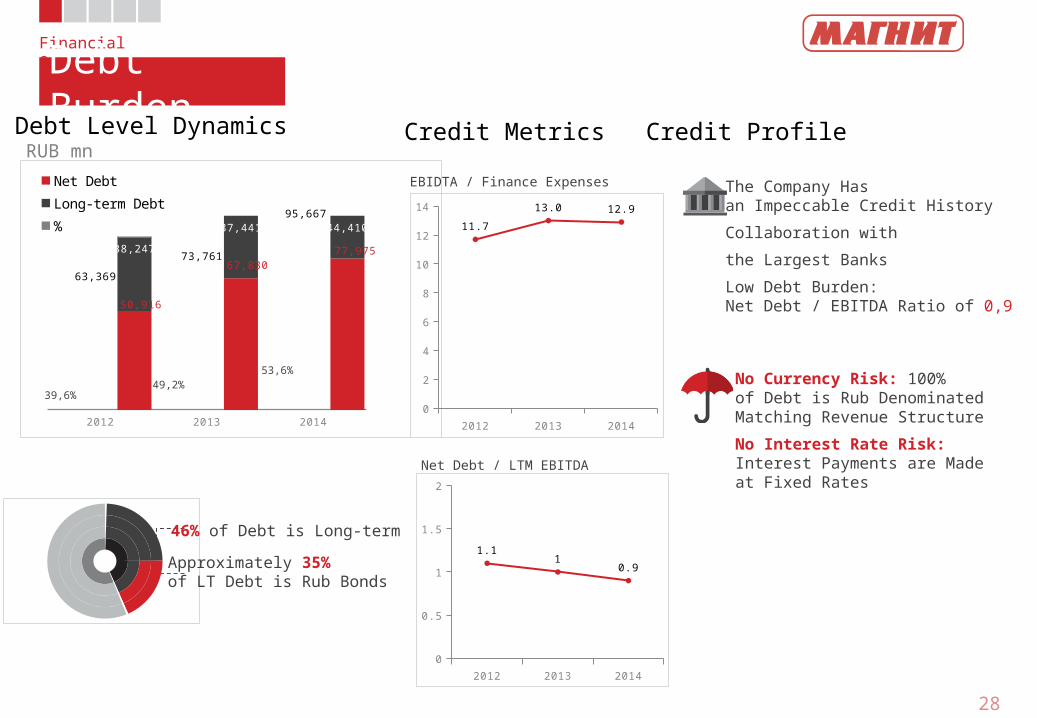
Source: IFRS accounts for FY 2012 - 2014 28
2012 2013 2014
63,369
73,761
95,667
50,916
67,83077,97538,247
37,441 44,410
Net Debt
Long-term Debt
%
Financial OverviewDebt Burden
2012 2013 2014
0
2
4
6
8
10
12
14
11.7
13.0 12.9
2012 2013 2014
0
0.5
1
1.5
2
1.11
0.9
Debt Level Dynamics RUB mn
Credit Metrics Credit Profile
EBIDTA / Finance Expenses
Net Debt / LTM EBITDA
The Company Hasan Impeccable Credit History
Collaboration with
the Largest Banks
Low Debt Burden:Net Debt / EBITDA Ratio of 0,9
No Currency Risk: 100%of Debt is Rub DenominatedMatching Revenue Structure
No Interest Rate Risk:Interest Payments are Madeat Fixed Rates
39,6%49,2%
53,6%
46% of Debt is Long-term
Approximately 35%of LT Debt is Rub Bonds
29
Contact InformationContact Information
Timothy PostHead of Investor Relations
+7 (961) [email protected]://ir.magnit.com
15/2 Solnechnaya StreetKrasnodar, 350072Russian Federation


