An Intervention Program for Promoting Healthy Eating & Physical Activity among Palestinian Female Schoolchildren. Maha Nubani Husseini (Ph.D. Candidate) Braun School of Public Health. Hadassah–Hebrew University Medical Center. Outline. Introduction Methodology Need Assessment - PowerPoint PPT Presentation
Maha Nubani Husseini (Ph.D. Candidate) Braun School of Public Health. Hadassah–Hebrew University Medical Center An Intervention Program for Promoting Healthy Eating & Physical Activity among Palestinian Female Schoolchildren
Transcript
Maha Nubani Husseini (Ph.D. Candidate)
Braun School of Public Health.Hadassah–Hebrew University Medical Center
An Intervention Program for Promoting Healthy Eating & Physical Activity
among Palestinian Female Schoolchildren
Outline• Introduction
• Methodology
• Need Assessment
• The Intervention
• Post intervention results
Problem OverviewHealthy eating and regular physical activity play a powerful
role in preventing chronic diseases among adults.
Obesity has been regarded as an epidemic and one of the public health challenges in the 21st century.
Obesity prevalence among Palestinian adolescent is 16.5%. (HBSC 2004)
Effective preventive measures are needed to address the epidemic of obesity. As well as an intervention programme to promote healthy eating and physical activity among school children. (WHO What Works)
Why Schools?
Children spend most of their day in school .Schools teachers influence students’ eating habits
and physical activity.
Why Parents?
Have important role in their children’s nutrition and physical activity
They affect a child’s knowledge, beliefs, attitudes and practice
Research Goals
To develop, implement and evaluate a school-based intervention program in East Jerusalem.
To increase Knowledge and improve practice among female schoolchildren, their mothers and teachers regarding healthy eating habits and physical activity.
Research Objectives• Baseline assessment
To assess Knowledge and Practices regarding eating habits and physical activity among schoolchildren and their mothers.
To assess teachers’ eating behavior and physical activity. As well as their readiness / capacity to participate and implement the intervention program.
To assess the level of involvement in health promotion and willingness of the school principal to implement the intervention program at the school.
Research Objectives(cont)
• Evaluation
To evaluate the effectiveness of health promotion intervention program in changing school children’s, their mothers’ and their teachers’ eating habits and physical activity in comparison to control schools.
To evaluate the improvement of teachers’ capacity to deal with health promotion intervention program compared to control schools.
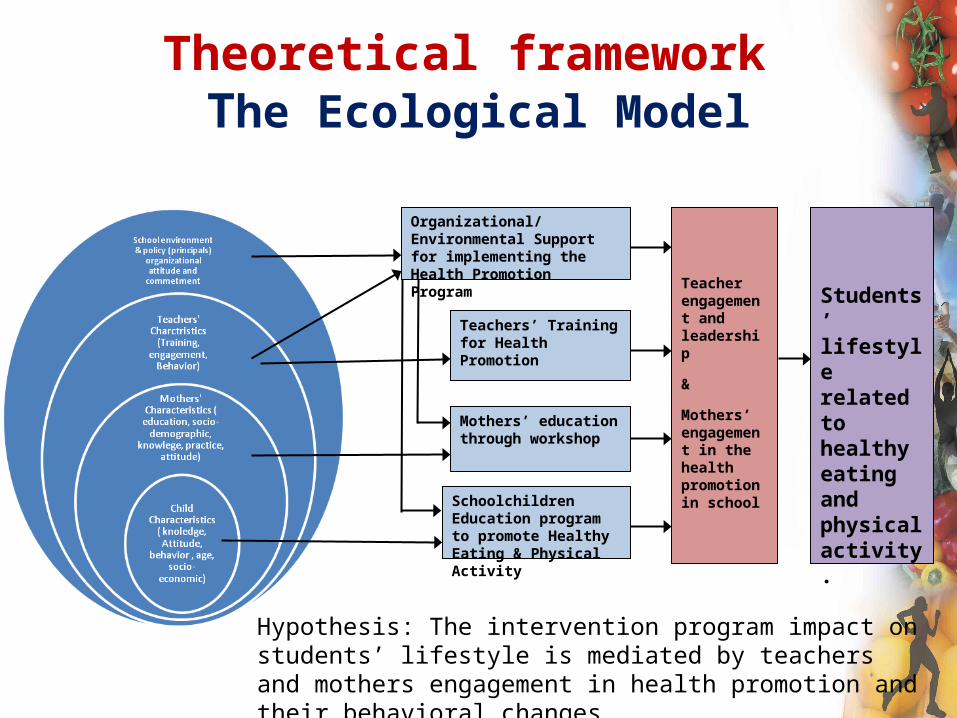
Theoretical framework The Ecological Model
Organizational/ Environmental Support for implementing the Health Promotion Program
Teachers’ Training for Health Promotion
Mothers’ education through workshop
Schoolchildren Education program to promote Healthy Eating & Physical Activity
Teacher engagement and leadership
&
Mothers’ engagement in the health promotion in school
Students’ lifestyle related to healthy eating and physical activity.
Hypothesis: The intervention program impact on students’ lifestyle is mediated by teachers and mothers engagement in health promotion and their behavioral changes.
Study design
A randomized control intervention program trial.
• The study has three stages: Assessment.Implementation and Monitoring.Evaluation.
Intervention Program
Intervention Program
End-point Evaluation
Regular School Curriculum
Regular School
Curriculum
End-point Evaluation
Study Design
Need AssessmentSchools: n=14
Period: April-June 2011
Interventionn=7
Controln=7
Sep – June 2012 Sep – June 2013 Feb – April 2013
Process Evaluation
• Sampling was made in two stages: – School Selection: Stratified random sampling
according to the school ownership. Provision: 13% of students in each stratum.
– Students Selection: Grade 4 and 5 randomly selected, one class of each grade irrespective to branches.
• The post intervention sampling:– Another cross-sectional for grades 4 and 5
schoolchildren.
Sampling Method
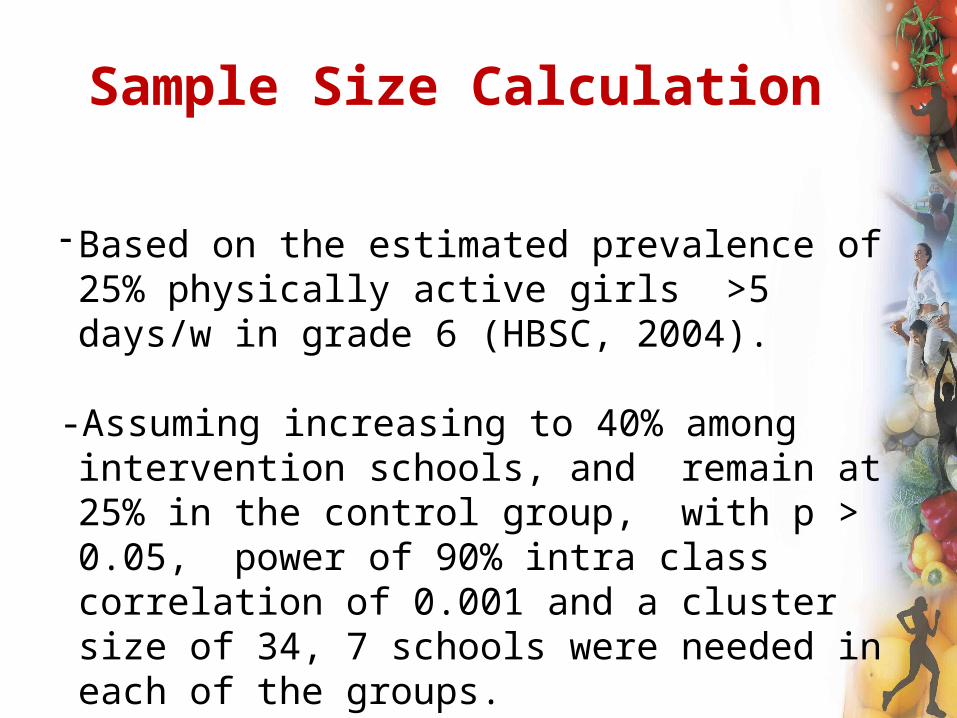
Sample Size Calculation
- Based on the estimated prevalence of 25% physically active girls >5 days/w in grade 6 (HBSC, 2004).
-Assuming increasing to 40% among intervention schools, and remain at 25% in the control group, with p > 0.05, power of 90% intra class correlation of 0.001 and a cluster size of 34, 7 schools were needed in each of the groups.
Number of Female Students in Grade 4 & 5 by School Ownership
School Type Number of Schoolchildren Number of Mothers #Number of TeachersTotal number of
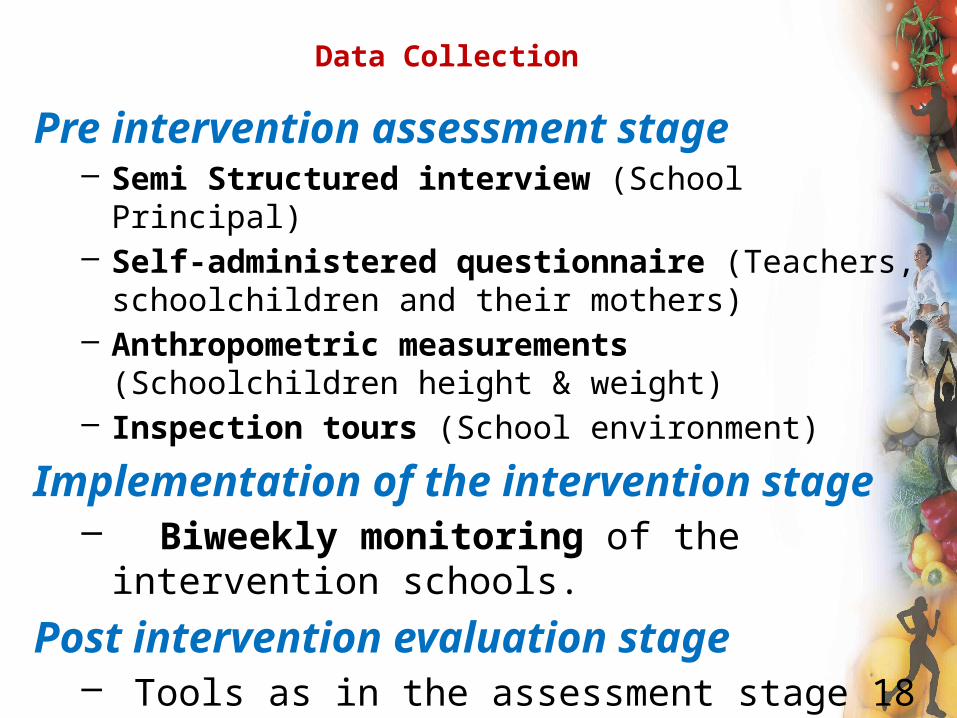
and their mothers)– Anthropometric measurements (Schoolchildren height &
weight)– Inspection tours (School environment)
Implementation of the intervention stage– Biweekly monitoring of the intervention
schools.
Post intervention evaluation stage– Tools as in the assessment stage 18 months after.
Data Collection
• Equal proportion from grades 4 & 5: 50%• Mean age: 10 years• Mean order in the family: 3.32 ± 2.01• Mean number of siblings: 4.38 ±1.98• Crowding Index: 58.3% are living between 1-2 CI• Religion: 94.3% were Muslims
Socio-demographic characteristics of the study populationSchoolchildren
MothersSocio-demographic characteristics of the study population
• Mean age: 36.3 ±5.75• Number of children: 56.9% have ≥5 children• Religion: Mostly Muslims• Education: 38.2% had less than secondary school
level of education while 34.1% had secondary education and 18.2%% had diploma or higher
• Employment: 3/4 housewives
Teachers
• Mean age: 36.9 ±8.64• Gender: Mostly Females• Years of experience: 12.6 ±8.16• Religion: Mostly Muslims
Socio-demographic characteristics of the teachers in the study population
The Intervention
Though the assessment and evaluation included grades 4 and 5, the intervention encompassed the whole school setting.
• Strategy and Structure
Establishing school health steering committee: representatives of teachers, mothers, schoolchildren and the owner of the canteen (8-10 persons), which had periodic meetings (every 4-6 weeks)
School-teacher coordinator who implement and run the program in her school.
• Capacity Building – Teachers
Trained to promote healthy eating and physical activity
Developed a school health promotion program based on the school needs and assets.
Tasks were assigned accordingly.
Trained to integrate healthy terms in the subjects they teach.
• Education and Involvement – Mothers
Educated about the importance of healthy eating and physical activity
Engaged in the schools’ health activities through their participation in preparing healthy meals for schoolchildren.
Participated with their schoolchildren in an open day physical activity program.
Trained to provide their children with a healthy meal including fruits and vegetables on daily bases.
Physical Environment – School Activities
Healthy messages were delivered with the help of a clown.
School morning announcements.
The use of a promoting checklist was introduced.
Healthy messages as part of the wall magazine.
A Healthy corner in each class.
Physical Environment – School Activities Cont.
Schools’ hallways and play grounds were utilized to increase healthy eating and physical activity awareness.
Morning aerobics was introduced.
Utilization of an active break was introduced.School canteens were restricted from selling unhealthy
items.
Characteristics of Students Pre/Post InterventionDifference Between Intervention Schools
Difference Between Control Schools DID (%) p-value