MAHARASHTRA STATE BOARD OF TECHNICAL EDUCATION (Autonomous) (ISO/IEC - 27001 - 2005 Certified) Subject Code: 17530 WINTER– 14 EXAMINATION Model Answer Page 1 of 20 Important Instructions to examiners: 1) The answers should be examined by key words and not as word-to-word as given in the model answer scheme. 2) The model answer and the answer written by candidate may vary but the examiner may try to assess the understanding level of the candidate. 3) The language errors such as grammatical, spelling errors should not be given more Importance (Not applicable for subject English and Communication Skills. 4) While assessing figures, examiner may give credit for principal components indicated in the figure. The figures drawn by candidate and model answer may vary. The examiner may give credit for any equivalent figure drawn. 5) Credits may be given step wise for numerical problems. In some cases, the assumed constant values may vary and there may be some difference in the candidate’s answers and model answer. 6) In case of some questions credit may be given by judgement on part of examiner of relevant answer based on candidate’s understanding. 7) For programming language papers, credit may be given to any other program based on equivalent concept. Q1. A) Attempt any three. a) List any four objectives of metrology. 1) To ensure that the product is as per quality standard. 2) To enhance total customer satisfaction. 3) To reduce rework and rejections. 4) To increase profitability of organization. 5) It helps in manufacture of interchangeable parts. 6) Overcome the short coming in the production process.(Any 4) 1 mark each b) Explain the term Selective assembly. 1. The consumer not only wants quality, precision and trouble free products but also he wants them at attractive prices. 2. This has become possible only by adopting automatic gauging for selective assembly whereby parts manufactured to rather wide tolerances fit and function as though they were precisely manufactured in precision laboratory to very close tolerances. 3. This is a concept which does away with old idea of inspection in which part in identified as ‘good’ or ‘bad’; good part being used for assembly and bad used to be scraped. 4. In selective assembly the components produced by a machine are classified into several groups according to size. 5. This is done both for hole and shaft and then the corresponding groups will match properly. 6. If some parts (shaft and holes) to be assembled are manufactured to normal tolerances of 0.01 mm (and both are within the curve of normal distribution),
Transcript
MAHARASHTRA STATE BOARD OF TECHNICAL EDUCATION (Autonomous)
(ISO/IEC - 27001 - 2005 Certified)
Subject Code: 17530 WINTER– 14 EXAMINATION Model Answer
Page 1 of 20
Important Instructions to examiners: 1) The answers should be examined by key words and not as word-to-word as given in the model answer scheme. 2) The model answer and the answer written by candidate may vary but the examiner may try to assess the understanding level of the candidate. 3) The language errors such as grammatical, spelling errors should not be given more Importance (Not applicable for subject English and Communication Skills. 4) While assessing figures, examiner may give credit for principal components indicated in the figure. The figures drawn by candidate and model answer may vary. The examiner may give credit for any equivalent figure drawn. 5) Credits may be given step wise for numerical problems. In some cases, the assumed constant values may vary and there may be some difference in the candidate’s answers and model answer. 6) In case of some questions credit may be given by judgement on part of examiner of relevant answer based on candidate’s understanding. 7) For programming language papers, credit may be given to any other program based on equivalent concept.
Q1. A) Attempt any three.
a) List any four objectives of metrology.
1) To ensure that the product is as per quality standard.
2) To enhance total customer satisfaction.
3) To reduce rework and rejections.
4) To increase profitability of organization.
5) It helps in manufacture of interchangeable parts.
6) Overcome the short coming in the production process.(Any 4) 1 mark each
b) Explain the term Selective assembly.
1. The consumer not only wants quality, precision and trouble free products but also he wants them at
attractive prices.
2. This has become possible only by adopting automatic gauging for selective assembly whereby parts
manufactured to rather wide tolerances fit and function as though they were precisely manufactured
in precision laboratory to very close tolerances.
3. This is a concept which does away with old idea of inspection in which part in identified as ‘good’ or
‘bad’; good part being used for assembly and bad used to be scraped.
4. In selective assembly the components produced by a machine are classified into several groups
according to size.
5. This is done both for hole and shaft and then the corresponding groups will match properly.
6. If some parts (shaft and holes) to be assembled are manufactured to normal tolerances of 0.01 mm
(and both are within the curve of normal distribution),
MAHARASHTRA STATE BOARD OF TECHNICAL EDUCATION (Autonomous)
(ISO/IEC - 27001 - 2005 Certified)
Subject Code: 17530 WINTER– 14 EXAMINATION Model Answer
Page 2 of 20
7. an automatic gauge can segregate them into ten different groups with a 0.001 mm limit for selective
assembly of the individual parts. Proper explanation 4 marks.
c) Define :
i) Frequency Distribution :-
Frequency distribution is a tabulation of data obtained from measurement, arranged in ascending
or descending order according to size.
ii) Central Tendency:-
The sample data is that most of the observations tend to concentrate in the center of the
distribution. This characteristic of distribution is known as Central Tendency.
iii) Dispersion:-
The extent to which the data is scattered about the zone of central tendency is known as
dispersion.
iv) Variance:-
it is the sum of the squares of the deviations from the arithmetic mean divided by the number of
observations. 1 mark for each definition
d) Draw the conventional diagram of limits and fits and define the term: i)Basic size. ii)Fundamental
Deviation.
2marks
Basic size:-
It is the standard size of a part, with reference to which all the limits of variations of size
are determined. 1 mark
Fundamental Deviation:-
The algebraic difference between size and corresponding basic size is known as deviation.
1 mark
Q1. B) Attempt any one.
MAHARASHTRA STATE BOARD OF TECHNICAL EDUCATION (Autonomous)
(ISO/IEC - 27001 - 2005 Certified)
Subject Code: 17530 WINTER– 14 EXAMINATION Model Answer
Page 3 of 20
A) Explain with neat sketch how angle of a work piece is measured with the help of angle
dekkor.
This is also a type of an autocollimator. It contains a small illuminated scale in the focal
plane of the objective lens (collimating lens). This scale in normal position is outside the
view of the microscope eyepiece . The illuminated scale is projected as a parallel beam by the
collimating lens which after striking a reflector below the instrument is refocused by the lens
in the field of view of the eye-piece.
In the field of view of microscope there is another datum scale fixed across the center of
screen and the reflected image of the illuminated scale is received at right angle to this fixed
scale as shown in fig. and the two scales, in this position intersect each other.
Thus the reading on the illuminated scale measures angular devotions form one axis at
900
to the optical axis and the reading on the fixed datum scale measures the deviation about
an axis mutually perpendicular to the other two. In other words, changes in angular position
of the reflector in two planes are indicated by changes in the point of intersection of the two
scales. Readings from scale are read direct to 1 without the use of a micrometer.
It is mostly used as a comparator. The instrument measures by comparing the readings
obtained from a standard, a sine bar or combination of angle gauges with that form the work
under test. Though this is not a precise instrument in comparison to autocollimator, it has
wide field of application for general angular measurement, as angular variations are read
direct without the operation of a micrometer.
2mark(Fig.)+ 4 mark (explanation)
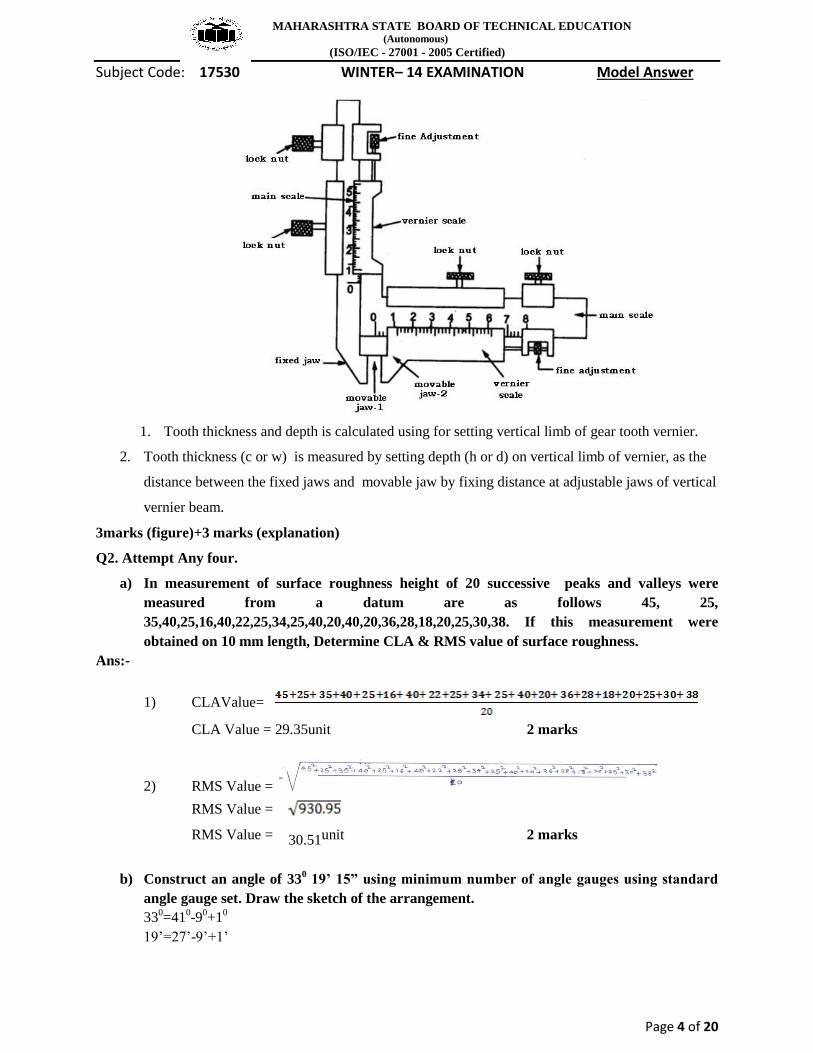
B) Draw the neat sketch of gear tooth vernier caliper and write the procedure for
measuring chordal tooth thickness.
MAHARASHTRA STATE BOARD OF TECHNICAL EDUCATION (Autonomous)
(ISO/IEC - 27001 - 2005 Certified)
Subject Code: 17530 WINTER– 14 EXAMINATION Model Answer
Page 4 of 20
1. Tooth thickness and depth is calculated using for setting vertical limb of gear tooth vernier.
2. Tooth thickness (c or w) is measured by setting depth (h or d) on vertical limb of vernier, as the
distance between the fixed jaws and movable jaw by fixing distance at adjustable jaws of vertical
vernier beam.
3marks (figure)+3 marks (explanation)
Q2. Attempt Any four.
a) In measurement of surface roughness height of 20 successive peaks and valleys were
measured from a datum are as follows 45, 25,
35,40,25,16,40,22,25,34,25,40,20,40,20,36,28,18,20,25,30,38. If this measurement were
obtained on 10 mm length, Determine CLA & RMS value of surface roughness.
Ans:-
1) CLAValue=
CLA Value = 29.35unit 2 marks
2) RMS Value =
RMS Value =
RMS Value = 30.51unit 2 marks
b) Construct an angle of 330 19’ 15” using minimum number of angle gauges using standard
angle gauge set. Draw the sketch of the arrangement.
330=41
0-9
0+1
0
19’=27’-9’+1’
MAHARASHTRA STATE BOARD OF TECHNICAL EDUCATION (Autonomous)
(ISO/IEC - 27001 - 2005 Certified)
Subject Code: 17530 WINTER– 14 EXAMINATION Model Answer
Page 5 of 20
15”=18”-3”
c) What is ‘best size of wire’? State the expression for the same, indicating meaning of each
term.
This wire is of such diameter that it makes contact with the flanks of the thread on the
effective diameter or pitch line. Actually effective diameter can be measured with any diameter wire
which makes contact on the true flank of the thread, but the values so obtained will differ from those
obtained with ‘best size’ wires if there is any error in angle or form of thread.
It is recommended that for measuring the effective diameter, always the best size wire should
be used and for this condition the wire touches the flank at mean diameter line within 1/5 of flank
length. With best size wire, any error on the measured value of simple effective diameter due to error
in thread form or angle is minimized. 2 MARK
1 MARK
Where,
d= best wire diameter
P= pitch of thread 1 MARK MEANING.
d) Draw labeled sketch of sigma comparator
MAHARASHTRA STATE BOARD OF TECHNICAL EDUCATION (Autonomous)
(ISO/IEC - 27001 - 2005 Certified)
Subject Code: 17530 WINTER– 14 EXAMINATION Model Answer
Page 6 of 20
figure3marks+Labelling 1 mark
e) Explain ‘cost of quality’ and ‘value of quality’ with the help of graph.
1. The balance between the cost of quality and value of quality gives optimum quality of design.
2. It is not necessary that the company should manufacture 100% quality products.
3. The study of optimum quality of design involves “Market Survey”.
4. While carrying out market survey expected sale for particular quality, profit and competition in the
market is to be considered.
MAHARASHTRA STATE BOARD OF TECHNICAL EDUCATION (Autonomous)
(ISO/IEC - 27001 - 2005 Certified)
Subject Code: 17530 WINTER– 14 EXAMINATION Model Answer
Page 7 of 20
5. The quality of design should meet the needs of the customers and at the same time its
manufacturing cost should be such which will yield maximum profit.
6. The aim should be to improve quality at lower cost.
7. The curves representing the cost and value of quality of design are shown in fig.
8. if we want to improve the quality of design from point 1 to point 2 the cost of quality will increase
by amount A whereas the value of quality will increase by amount B.
9. Now B >A and therefore, improvement in quality at this level will yield more income.
10. However, if the quality is to be improved from point 2 to point 3, then from the fig.
11. D < C i.e. the increase in value of quality is less than the increase in the cost of quality.
So, the quality level at point 2 is optimum quality of design. Below this optimum the profit that
can be earned is not maximized and above this optimum it is uneconomical to improve the quality
of design.
Graph 1 mark+ 3 mark explanation.
Q.3. Attempt any four:
a) Differentiate between comparator and a measuring instrument (at least 4 points).
Sr. No. Instrument Comparator
01 It is not give any magnification. It gives magnification.
02 Skilled operators are required. Semi-skilled operators are required.
03 Observational error is occur. Parallax error is occur.
04 Maintenance is less. Maintenance is more.
05 Remote controlling is not possible. It may be operate by remote.
06 Uniform response is not obtained. Uniform response is obtained.
07 Used for checking and measurement. Used for comparison.
08 Less sensitive. More sensitive.
09 Ex. Vernier calliper Sigma comparator is ex.
1 mark each for any 4 points
b) Compare inspection and quality control.
Sr. No. Inspection Quality Control
01
It is act of checking the parts at
various stages and sorting out
defective items.
It is an effective system for integrating quality,
development, maintenance and improvement
of various groups in the organisation to
achieve production at most economical cost.
02 It is part of quality control. It is the broad terms which include inspection.
03 It is uses précised measuring It uses quality tool i.e. control charts.
MAHARASHTRA STATE BOARD OF TECHNICAL EDUCATION (Autonomous)
(ISO/IEC - 27001 - 2005 Certified)
Subject Code: 17530 WINTER– 14 EXAMINATION Model Answer
Page 8 of 20
instruments, such as vernier,
micrometre etc.
04 It is concern with quality of past
production. It is concern with future production.
05 It is responsibility of inspector. It is responsibility of everyone working in
organisation.
1 mark each for any 4 points
c) Interpret the meaning of 27H5f6 with respect to fit and basis system.
27 H5 means an H-hole of basic size 27mm having tolerance grade IT5. 1 mark
27 F6 means an F-shaft of basic size 27mm having tolerance grade IT6.1 mark
27 H5 F6 is fit indicated by its basic size 27mm followed by symbols representing the limits of hole
and shaft, the hole being stated first.
The type of fit is clearance fit.2 mark
d) Differentiate between Line and End Standard. (at least 4 points)
Sr.
No. Line Standard End Standard
01 When length is express as distance between
two parallel line is called line standard.
When length is expressed as distance
between two parallel faces is called as
end standard.
02 Measurement is quick and easy. Measurement is time consuming.
03 It is not used for précised measurement. It is used for précised measurement.
04 It is subjected to parallax error. It is not subjected to parallax error.
05 It is cheaper. It is costlier.
06 It is simple in construction. It is complicated in construction.
07 Ex. Steel Rule, meter tape, Micro meter, slip gauges
1 mark each for any 4 points
e) Explain in brief two wire method for thread measurement.
1 mark
Effective diameter can be measured by using floating carriage instrument which is more accurate. In
two wire method which consists of two identical wedges size wires.
MAHARASHTRA STATE BOARD OF TECHNICAL EDUCATION (Autonomous)
(ISO/IEC - 27001 - 2005 Certified)
Subject Code: 17530 WINTER– 14 EXAMINATION Model Answer
Page 9 of 20
Fig. shows measurement of thread and wire dimensions. The wire are to be inserted in such way
that,
1) Inserted in such thread.
2) The flank surfaces are tangents to the wire.
The dimensions are parameters which are measured as per shown in figure and pitch value of
thread is difference between effective diameter and diameter under wire. (2 mark explanation)
The effective diameter € is addition of diameter under wire and pitch value E = T + P
But,
T = R – 2d 1 mark
Where,
E = effective diameter
R = Diameter over wire
P = Pitch value
d= wire diameter
T = diameter under wire
To reducing various type of error, master piece can be used at the time of measurement.
4 A) Attempt any Three:
a) State different SQC tools and explain any one.
1. Frequency Histogram
2. Frequency Polygon
3. Bar chart
4. Control Charts
5. Process capability Study 2 mark
Frequency Histogram
1) In the graph, the sides of column represent the upper and lower cell boundaries and their highest
are proportional to the frequencies of occurrences within the cells.
2) In drawing a histogram, it is assumed that, the frequency is centered at the mid-value of cell or
class.
3) Simple construction and inspection of histogram make it an effective tool.
4) A random sample is taken from the lot and measurements are performed for the selected quality
characteristic.
MAHARASHTRA STATE BOARD OF TECHNICAL EDUCATION (Autonomous)
(ISO/IEC - 27001 - 2005 Certified)
Subject Code: 17530 WINTER– 14 EXAMINATION Model Answer
Page 10 of 20
5) When there is a large variation in the obtained data, then it may be grouped into cell.
Frequency Polygon
1) It consists of series of straight lines joining points, which are plotted at cell mid-points with a
height proportional to cell frequency.
2) Frequency polygon has the advantage of plotting several distributions on the same axis, thereby
making certain comparisons possible, which is not possible in case of histogram.
Bar chart
1) Bar chart is graphical representation of the frequency distribution, in which, the bars are centered at the
mid-point of the cells and the heights of bars are proportional to the frequencies in the respective cells.
Control Charts
1) It is a graphical representation of the collected information.
2) The information may pertain to measure quality characteristics like length, diameter, thickness etc.
3) In general, control chart is a
1) Device to specify the state of statistical control.
2) Procedure to attain statistical control.
3) Tool to judge whether a state of statistical control is attained.
2 mark any one of above.
b) Why it is necessary to calibrate measuring instruments and unit gauges?
1) The calibration of any measuring system is very important to get meaningful results.
2) In case where the sensing system and measuring system are different, then it is
imperative to calibrate the system as an integrated whole in order to take into account the
error producing properties of each component.
3) Calibration is usually carried out by making adjustments such that readout device
produces zero output for zero-measured input, and similarly it should display an output
equivalent to the known measured input near the full-scale input value.
MAHARASHTRA STATE BOARD OF TECHNICAL EDUCATION (Autonomous)
(ISO/IEC - 27001 - 2005 Certified)
Subject Code: 17530 WINTER– 14 EXAMINATION Model Answer
Page 11 of 20
4) It is important that any measuring system calibration should be performed under
environmental conditions that are as close as possible to those conditions under which
actual measurements are to be made.
5) It is also important that the reference measured input should be known to as much greater
degree of accuracy – usually the calibration standard for the system should be at least one
order of magnitude more accurate than the desired measurement system accuracy.
4 marks proper explanation.
c) Define reliability. State the factors to be considered for achieving a reliable design.
Definition:- “The reliability of a system or device is the probability that it will give satisfactory
performance for a specified period of time under specified conditions”
OR
Definition:- “A measure of the ability of the product to function successfully, when required
period in the specific manner”.
OR
Definition:- “Reliability is the capacity of an equipment not to breakdown in operation”.
OR
Definition:- “Reliability is the probability of a device performing its purpose adequately for the
period of time intended under the operating conditions encountered”. Any 1 of above 2 marks
factors to be considered for achieving a reliable design:
1) Simplicity of product
2) De-rating
3) Redundancy Safe operation
4) Protection from extreme environmental conditions
5) “Maintainability” and “Serviceability” 2 marks for any 4 factors
`
d) Explain with neat sketch how angle is measured using clinometer.
MAHARASHTRA STATE BOARD OF TECHNICAL EDUCATION (Autonomous)
(ISO/IEC - 27001 - 2005 Certified)
Subject Code: 17530 WINTER– 14 EXAMINATION Model Answer
Page 12 of 20
Clinometer is one type of application of spirit level. It consists of one spirit level mounted
on rotary member carried in housing. The bottom face of housing forms base of the instrument, for the
measurement purpose clinometers is first kept on one side of the inclined surface and reading is taken
when vapour bubble is at centre position ,similarly it is kept on another side and reading in terms of angle
is taken which is shown in fig.
B) Attempt any One:
A) Explain the principle and working of Taylor Hobson Talysurf with block diagram.
The Talysurf is an electronic instrument working on carrier modulating principle. This instrument
gives the information much more rapidly and accurately.
The measuring head of this instrument consists of a diamond stylus of about 0.002mm tip radius and
skid or shoe which is drawn across the surface by means of a motorized driving unit (gearbox), which
provides three motorized speeds giving respectively X 20 and X 100 horizontal magnification and a speed
suitable for average reading.
A neutral position in which the pick-up can be traversed manually is also provided. the arm carrying
the stylus forms an armature which pivots about the center piece of E-shaped stamping as shown in fig.
on two legs of (outer pole pieces) the E – shaped stamping there are coils carrying an a. c. current. These
two coils with other two resistances form an oscillator. As the armature is pivoted about the central leg,
any movement of the stylus causes the air gap to very and thus the amplitude of the original a. c. current
flowing in the coils is modulated.
The out-put of the bridge thus consists of modulation only as shown in fig. This is further
demodulated so that the current now is directly proportional to the vertical displacement of the stylus
only.
The demodulated output is caused to operate a pen recorder to produce a permanent record and a meter to
give a numerical assessment directly. In recorder of this statement the marking medium is an electric
discharge through a specially treated paper which blackens at the point of the stylus, so this has no
distortion due to drag and the record strictly rectilinear one.
2 mark fig.+4 mark explanation.
B) What is LVDT? Explain its principle of working with neat sketch.
MAHARASHTRA STATE BOARD OF TECHNICAL EDUCATION (Autonomous)
(ISO/IEC - 27001 - 2005 Certified)
Subject Code: 17530 WINTER– 14 EXAMINATION Model Answer
Page 13 of 20
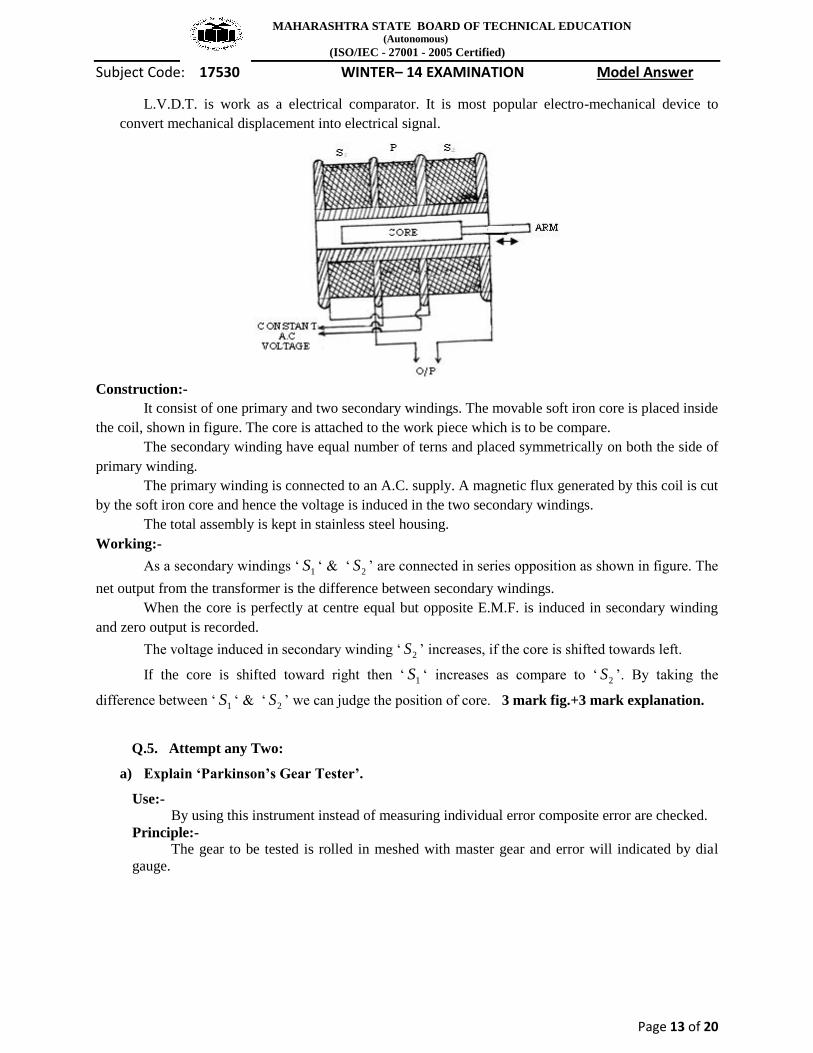
L.V.D.T. is work as a electrical comparator. It is most popular electro-mechanical device to
convert mechanical displacement into electrical signal.
Construction:-
It consist of one primary and two secondary windings. The movable soft iron core is placed inside
the coil, shown in figure. The core is attached to the work piece which is to be compare.
The secondary winding have equal number of terns and placed symmetrically on both the side of
primary winding.
The primary winding is connected to an A.C. supply. A magnetic flux generated by this coil is cut
by the soft iron core and hence the voltage is induced in the two secondary windings.
The total assembly is kept in stainless steel housing.
Working:-
As a secondary windings ‘ 1S ‘ & ‘ 2S ’ are connected in series opposition as shown in figure. The
net output from the transformer is the difference between secondary windings.
When the core is perfectly at centre equal but opposite E.M.F. is induced in secondary winding
and zero output is recorded.
The voltage induced in secondary winding ‘ 2S ’ increases, if the core is shifted towards left.
If the core is shifted toward right then ‘ 1S ‘ increases as compare to ‘ 2S ’. By taking the
difference between ‘ 1S ‘ & ‘ 2S ’ we can judge the position of core. 3 mark fig.+3 mark explanation.
Q.5. Attempt any Two:
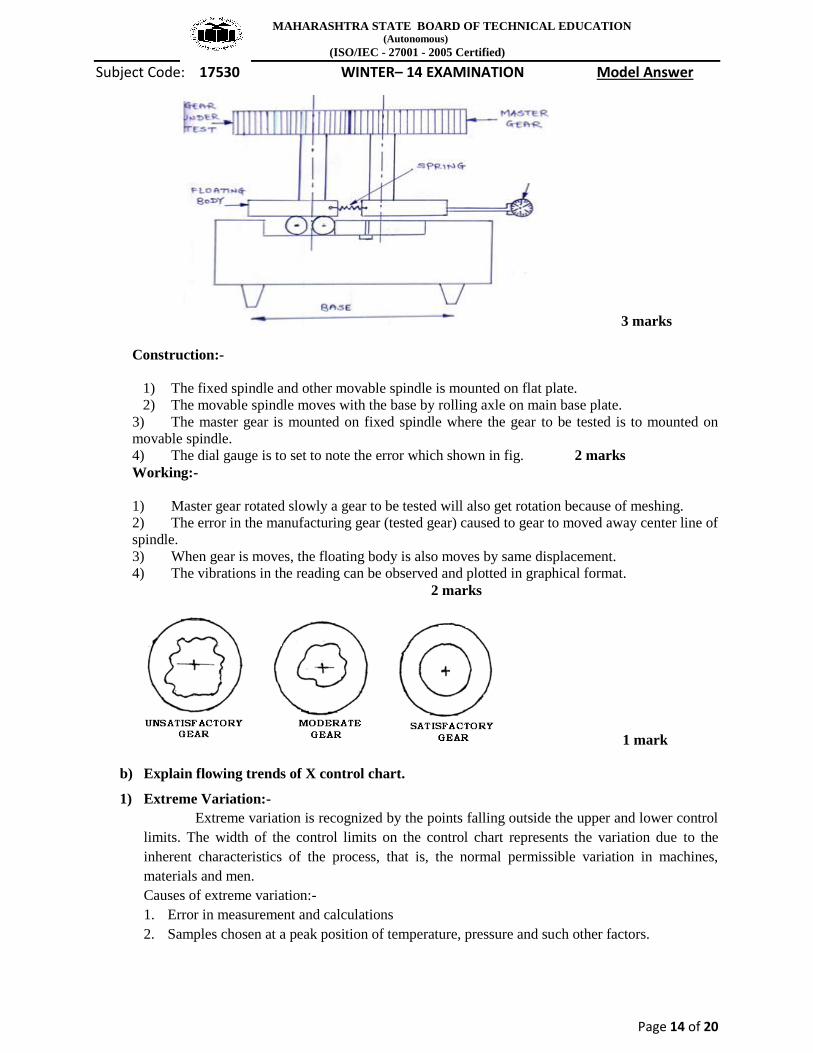
a) Explain ‘Parkinson’s Gear Tester’.
Use:-
By using this instrument instead of measuring individual error composite error are checked.
Principle:-
The gear to be tested is rolled in meshed with master gear and error will indicated by dial
gauge.
MAHARASHTRA STATE BOARD OF TECHNICAL EDUCATION (Autonomous)
(ISO/IEC - 27001 - 2005 Certified)
Subject Code: 17530 WINTER– 14 EXAMINATION Model Answer
Page 14 of 20
3 marks
Construction:-
1) The fixed spindle and other movable spindle is mounted on flat plate.
2) The movable spindle moves with the base by rolling axle on main base plate.
3) The master gear is mounted on fixed spindle where the gear to be tested is to mounted on
movable spindle.
4) The dial gauge is to set to note the error which shown in fig. 2 marks
Working:-
1) Master gear rotated slowly a gear to be tested will also get rotation because of meshing.
2) The error in the manufacturing gear (tested gear) caused to gear to moved away center line of
spindle.
3) When gear is moves, the floating body is also moves by same displacement.
4) The vibrations in the reading can be observed and plotted in graphical format.
2 marks
1 mark
b) Explain flowing trends of X control chart.
1) Extreme Variation:-
Extreme variation is recognized by the points falling outside the upper and lower control
limits. The width of the control limits on the control chart represents the variation due to the
inherent characteristics of the process, that is, the normal permissible variation in machines,
materials and men.
Causes of extreme variation:-
1. Error in measurement and calculations
2. Samples chosen at a peak position of temperature, pressure and such other factors.
MAHARASHTRA STATE BOARD OF TECHNICAL EDUCATION (Autonomous)
(ISO/IEC - 27001 - 2005 Certified)
Subject Code: 17530 WINTER– 14 EXAMINATION Model Answer
Page 15 of 20
3. Wrong setting of machine, tools etc.
4. Samples chosen at the commencement or end of an operation.
2) Shift:-
When a series of consecutive points fall above or below the center line on either X or R
chart it can be assumed that shift in the process has takes place indicating presence of some
assignable cause. It is generally assumed that when 7 consecutive points lie above or below the
center line, the shift has occurred.
Causes of shift:-
1. Change in material
2. Change in operator, inspector, inspection equipment.
3. Change in machine setting
4. New operator, carelessness of the operator
5. Loose fixture etc.
3) Erratic Fluctuations:-
This may be due to single causes or a group of causes affecting the process level and
spread. The cause of erratic fluctuations is rather difficult to identify. It may be due to different
causes acting at different times on the process.
Causes of Erratic Fluctuations:-
1. Frequent adjustment of machine
2. Different types of material being processed
3. Change in operator, machine, test equipment etc.
4) Indication of Trend:-
If the consecutive points on X or R chart tent to move steadily either towards LCL or
UCL, it can be assumed that process is indicating a “Trend” i.e. change is taking place
slowly and though all the points are lying within control limits, after some time it is likely
that the process may go out of control If proper care or corrective action is not taken.
Causes of Trend:-
1. Tool wear
2. Wear of threads on clamping device.
3. Effects of temperature and humidity
4. Accumulation of dirt and clogging of fixtures and holes. 2 mark each
c) Describe with neat sketch:
i. Straightness checking using spirit level.
1) Draw a line on the surface as a reference line. Define the line into the sections such that each
section equal to length of base of spirit level. [01 mark]
2) Move the block along with the lines with the steps equal to pitch distance between the center
lines of feet. [01 mark]
3) Generally a spirit level is to be fitted in a cover with two feet so that only feet have line contact
with the surface, also check the bed for traverse direction by taking readings of spirit levels.
[01 mark]
MAHARASHTRA STATE BOARD OF TECHNICAL EDUCATION (Autonomous)
(ISO/IEC - 27001 - 2005 Certified)
Subject Code: 17530 WINTER– 14 EXAMINATION Model Answer
Page 16 of 20
ii. Alignment testing of lathe centers in vertical plane.
2marks
It is necessary to check the relative position of the axes also. Both the axes may be parallel to
carriage movement but they may not be coinciding. So when a job is fitted between the centers, the
axis of the job will not be parallel to the carriage movement. This test is to be carried out in vertical
plane only. A mandrel is fitted between the two centers and dial gauge on the carriage. The feeler of
the dial gauge is pressed against the mandrel in vertical plane the carriage is moved and the error
noted down. 2marks
MAHARASHTRA STATE BOARD OF TECHNICAL EDUCATION (Autonomous)
(ISO/IEC - 27001 - 2005 Certified)
Subject Code: 17530 WINTER– 14 EXAMINATION Model Answer
Page 17 of 20
Q.6.Attempt any Two:
a) Determine the control limits for X and R charts if ∑X = 357.50 and ∑R = 9.90. Number of
subgroups = 20. It is given that A2=0.18, D3=0.41, D4=1.59 and d2=3.735. Draw control charts and
write your conclusions. Also find the process capability.
2 MARK
2 MARK
1 MARK
MAHARASHTRA STATE BOARD OF TECHNICAL EDUCATION (Autonomous)
(ISO/IEC - 27001 - 2005 Certified)
Subject Code: 17530 WINTER– 14 EXAMINATION Model Answer
Page 18 of 20
1 MARK
1 MARK
1 MARK
b) In a manufacturing process, the number of defectives found in the inspection of 10 lots if 400
items each are given below:
Lot no. 1 2 3 4 5 6 7 8 9 10
No. of Defectives 2 0 14 3 1 18 6 0 3 6
Determine the trial control limits for np chart and state whether the process is in control.
∑np= Total number of defective=107 1 mark
∑n=total number inspected= 10 X 400=4000 1 mark
p = = =0.0267
n p = 400 X 0.0267 =10.7 1 mark
2 MARK
MAHARASHTRA STATE BOARD OF TECHNICAL EDUCATION (Autonomous)
(ISO/IEC - 27001 - 2005 Certified)
Subject Code: 17530 WINTER– 14 EXAMINATION Model Answer
Page 19 of 20
2 MARK
Conclusion:- It is observed that the all lot are in control. Therefore, the process is in control. 1 MARK
C) Define TQM. Describe any 3 principal elements of TQM.
Definition :-
It is the control of transformation process of an organisation to best satisfaction to the
customer needs in most economical manner.
OR
It is the control of rating an organising culture committed to the continuous improvement
through skill, team work, processes, and product quality and customer satisfaction. 2 MARK
(2 MARK EACH FOR ANY 3 ELEMENTS)
Customer-focused- The customer ultimately determines the level of quality. No matter what an
organization does to foster quality improvement—training employees, integrating quality into the
design process, upgrading computers or software, or buying new measuring tools—the customer
determines whether the efforts were worthwhile.
Total employee involvement. All employees participate in working toward common goals. Total
employee commitment can only be obtained after fear has been driven from the workplace, when
empowerment has occurred, and management has provided the proper environment. High-
performance work systems integrate continuous improvement efforts with normal business
operations. Self-managed work teams are one form of empowerment.
Process-centered. A fundamental part of TQM is a focus on process thinking. A process is a
series of steps that take inputs from suppliers (internal or external) and transforms them into
outputs that are delivered to customers (again, either internal or external). The steps required to
carry out the process are defined, and performance measures are continuously monitored in order
to detect unexpected variation.
Integrated system. Although an organization may consist of many different functional
specialties often organized into vertically structured departments, it is the horizontal processes
interconnecting these functions that are the focus of TQM.
Micro-processes add up to larger processes, and all processes aggregate into the business
processes required for defining and implementing strategy. Everyone must understand the vision,
MAHARASHTRA STATE BOARD OF TECHNICAL EDUCATION (Autonomous)
(ISO/IEC - 27001 - 2005 Certified)
Subject Code: 17530 WINTER– 14 EXAMINATION Model Answer
Page 20 of 20
mission, and guiding principles as well as the quality policies, objectives, and critical processes of
the organization. Business performance must be monitored and communicated continuously.
Every organization has a unique work culture, and it is virtually impossible to achieve excellence
in its products and services unless a good quality culture has been fostered. Thus, an integrated
system connects business improvement elements in an attempt to continually improve and exceed
the expectations of customers, employees, and other stakeholders.
Strategic and systematic approach. A critical part of the management of quality is the strategic
and systematic approach to achieving an organization’s vision, mission, and goals. This process,
called strategic planning or strategic management, includes the formulation of a strategic plan that
integrates quality as a core component.
Continual improvement. A major thrust of TQM is continual process improvement. Continual
improvement drives an organization to be both analytical and creative in finding ways to become
more competitive and more effective at meeting stakeholder expectations.
Fact-based decision making. In order to know how well an organization is performing, data on
performance measures are necessary. TQM requires that an organization continually collect and
analyze data in order to improve decision making accuracy, achieve consensus, and allow
prediction based on past history.
Communications. During times of organizational change, as well as part of day-to-day
operation, effective communications plays a large part in maintaining morale and in motivating
employees at all levels. Communications involve strategies, method, and timeliness.