July 24, 2017 ICICI Securities Ltd | Retail Equity Research Result Update Operating performance continues to improve! Mahindra CIE’s Q2CY17 consolidated net sales were at | 1449 crore (up 13.3% YoY) vs. our estimate of | 1,532 crore. The revenue is not comparable YoY as it includes integration of Bill Forge (BFL). Revenue from Indian operation (standalone + BFL + gears business) grew 50.6% YoY to | 636 crore supported by production growth in UVs, tractors and 2-W. Revenue from European operation declined 2.1% YoY to | 894 crore mainly due to currency translation Consolidated EBITDA margins came in at 14.2% (up 248 bps YoY & 81 bps QoQ) vs. our estimate of 13.4% attributable to 1) integration of high margin BFL business (recovered post demonetisation) & 2) yielded benefit of the clean up made in European operations in CY16. Consolidated PBT was at | 123 crore (vs. PAT estimate of | 101.6 crore) On a standalone basis, revenues increased 11.1% YoY to | 449.5 crore, (vs. estimate of | 425 crore). At 9.5%, EBITDA margins declined 33 bps YoY, (up 21 bps QoQ), vs. estimate of 10.4%. Higher other income & exceptional expense (VRS worth | 9 crore last year) boosted PAT that was up 56.1% YoY to | 17.7 crore BFL’s business has recovered from demonetisation and is likely to support growth. The clean-up in Europe will continue to expand its margins. MCI is also likely to de-bottleneck its capacity thereby resulting in higher vacuum to execute new orders from its customers, going forward Phase 2 growth strategy focuses on profitability Mahindra CIE (MCI) embarked on its Phase 2 (2017-20) strategy that focuses on growth & profitability. The strategy can be broadly divided into two with a) focus on business development & growth (including organic growth, new acquisitions (like Bill Forge – BFL), entry into new products & customer development in India & optimising its utilisation & b) focus on profitability (through transfer of technology, better efficiency & increase exports). The first step of the second phase has already been taken with acquisition of BFL & appointment of CEO. The clean-up done in the past (2014-16) includes turnaround of Mahindra Forging Europe (MFE) where margins improved from single low digit to double digit and Metalcastello business that is helping MCI in terms of margin expansion, going forward. BFL business on its way for recovery; post impact by demonetisation! With the acquisition of BFL, MCI started to diversify its client risk with revenue contribution from top two clients reduced to ~45% in CY16 vs. 55% in CY15. The acquisition not only helps MCI explore the 4W & 2W space but also diversify its customer concentration mix coupled with rising exports share. BFL operations, however, were impacted by demonetisation in Q1CY17, which now recovered thereby supporting overall growth. The integration of higher margin BFL business further lifts MCI’s overall margins. MCI may also think of using its Chakan plant (that currently is under utilised), for manufacturing BFL’s products thereby addressing its capacity need and avoiding any major capacity addition. Turnaround story intact; reiterate BUY! MCI has a global footprint with global promoters and is a unique case of valuation considering its massive turnaround possibilities. It has a presence across CV & PV with complementary strengths of dual parents. It is also planning an inorganic expansion via partners/acquisitions and wishes to cater to Japanese OEMs. Its consistent focus on cost rationalisation would improve EBIT margins ~10% & RoCE to ~13% in CY18E. Thus, we continue to value MCI at 12x CY18E EV/EBITDA multiple & maintain our target price of | 280 with BUY recommendation. Rating matrix Rating : Buy Target : | 279 Target Period : 12 months Potential Upside : 14% What’s Changed? Target Unchanged EPS CY17E Changed from | 10.3 to | 9.7 EPS CY18E Changed from | 13.5 to | 12.9 Rating Unchanged Standalone Quarterly Performance (| Crore) Q2CY17 Q2CY16 YoY Q1CY17 QoQ Revenues 449.5 404.5 11.1 464.1 -3.1 EBITDA 42.7 39.8 7.4 43.1 -1.0 EBITDA (%) 9.5 9.8 -33 bps 9.3 21 bps Reported PAT 17.7 11.3 56.1 16.7 5.9 Key Financials | Crore CY15 CY16 CY17E CY18E Net Sales 3,677 5,287 5,841 6,313 EBITDA 378.0 531.1 789.1 934.3 Net Profit 87.2 169.0 368.2 486.5 EPS (|) 2.3 4.5 9.7 12.9 All financial numbers incorporate merger assumption completed & company has changed its accounting year from FY to CY; hence CY15 is a nine months period Valuation summary CY15 CY16 CY17E CY18E P/E (x) 107.5 55.5 25.5 19.3 EV/EBITDA (x) 27.3 20.0 13.3 11.0 P/BV (x) 4.7 2.9 2.6 2.3 RoNW (%) 7.5 5.4 10.3 12.1 RoCE (%) 7.4 6.9 10.7 12.9 All financial numbers incorporate merger assumption completed & company has changed its accounting year from FY to CY; hence CY15 is a nine months period Stock data Particular Amount Market Capitalization (| Crore) | 9224.7 Total Debt (CY16) | 1362.06 Crore Cash & Investments (CY16) | 137 Crore EV | 10449.7 Crore 52 week H/L (|) 260/170 Equity capital (| crore) | 378.1 Crore Face value (|) | 5 All financial numbers incorporate merger assumption completed Price performance (%) 1M 3M 6M 12M Mahindra CIE Automotive Ltd 22.4 26.2 23.2 22.3 Motherson Sumi Systems Ltd 7.9 16.5 21.2 55.3 Bharat Forge Ltd 9.4 21.0 29.4 44.4 Mahindra CIE Automotive (MAHAUT) | 248 Research Analyst Nishit Zota [email protected]Vidrum Mehta [email protected]
Transcript
July 24, 2017
ICICI Securities Ltd | Retail Equity Research
Result Update
Operating performance continues to improve!
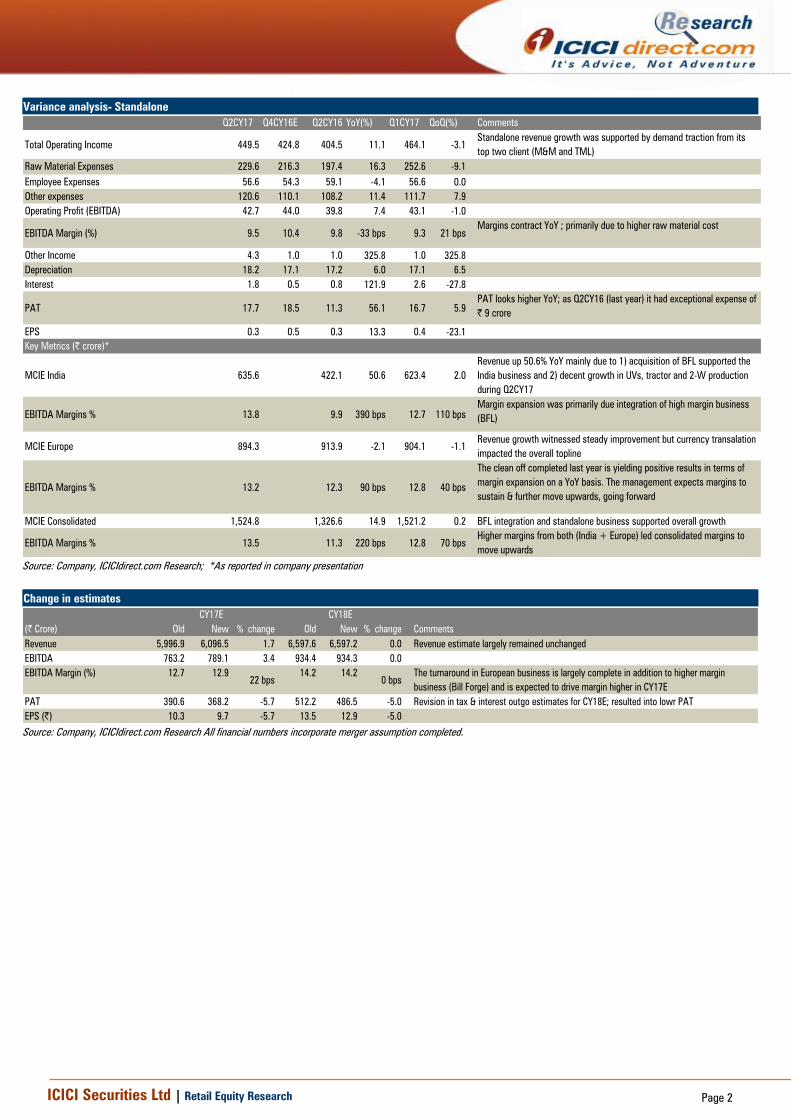
Mahindra CIE’s Q2CY17 consolidated net sales were at | 1449 crore
(up 13.3% YoY) vs. our estimate of | 1,532 crore. The revenue is not
comparable YoY as it includes integration of Bill Forge (BFL). Revenue
from Indian operation (standalone + BFL + gears business) grew
50.6% YoY to | 636 crore supported by production growth in UVs,
tractors and 2-W. Revenue from European operation declined 2.1%
YoY to | 894 crore mainly due to currency translation
Consolidated EBITDA margins came in at 14.2% (up 248 bps YoY & 81
bps QoQ) vs. our estimate of 13.4% attributable to 1) integration of
high margin BFL business (recovered post demonetisation) & 2) yielded
benefit of the clean up made in European operations in CY16.
Consolidated PBT was at | 123 crore (vs. PAT estimate of | 101.6 crore)
On a standalone basis, revenues increased 11.1% YoY to | 449.5 crore,
(vs. estimate of | 425 crore). At 9.5%, EBITDA margins declined 33 bps
YoY, (up 21 bps QoQ), vs. estimate of 10.4%. Higher other income &
exceptional expense (VRS worth | 9 crore last year) boosted PAT that
was up 56.1% YoY to | 17.7 crore
BFL’s business has recovered from demonetisation and is likely to
support growth. The clean-up in Europe will continue to expand its
margins. MCI is also likely to de-bottleneck its capacity thereby
resulting in higher vacuum to execute new orders from its customers,
going forward
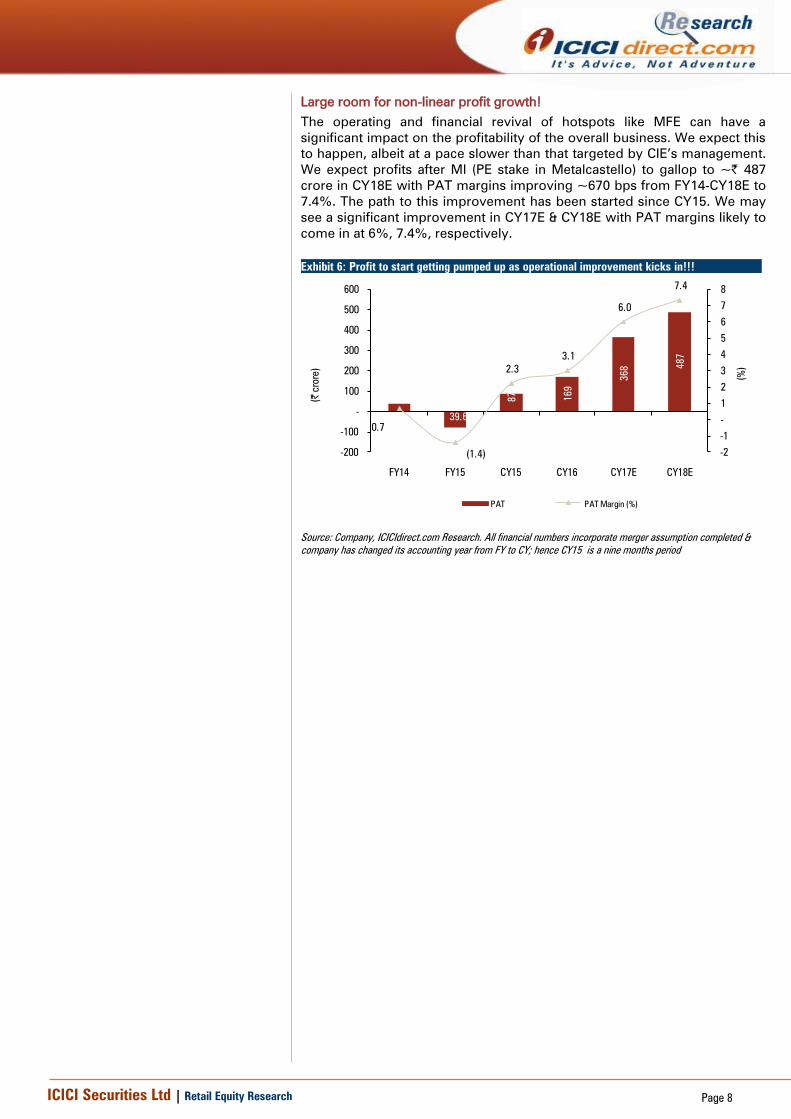
Phase 2 growth strategy focuses on profitability
Mahindra CIE (MCI) embarked on its Phase 2 (2017-20) strategy that focuses
on growth & profitability. The strategy can be broadly divided into two with
a) focus on business development & growth (including organic growth, new
acquisitions (like Bill Forge – BFL), entry into new products & customer
development in India & optimising its utilisation & b) focus on profitability
(through transfer of technology, better efficiency & increase exports). The
first step of the second phase has already been taken with acquisition of
BFL & appointment of CEO. The clean-up done in the past (2014-16)
includes turnaround of Mahindra Forging Europe (MFE) where margins
improved from single low digit to double digit and Metalcastello business
that is helping MCI in terms of margin expansion, going forward.
BFL business on its way for recovery; post impact by demonetisation!
With the acquisition of BFL, MCI started to diversify its client risk with
revenue contribution from top two clients reduced to ~45% in CY16 vs.
55% in CY15. The acquisition not only helps MCI explore the 4W & 2W
space but also diversify its customer concentration mix coupled with rising
exports share. BFL operations, however, were impacted by demonetisation
in Q1CY17, which now recovered thereby supporting overall growth. The
integration of higher margin BFL business further lifts MCI’s overall
margins. MCI may also think of using its Chakan plant (that currently is
under utilised), for manufacturing BFL’s products thereby addressing its
capacity need and avoiding any major capacity addition.
Turnaround story intact; reiterate BUY!
MCI has a global footprint with global promoters and is a unique case of
valuation considering its massive turnaround possibilities. It has a presence
across CV & PV with complementary strengths of dual parents. It is also
planning an inorganic expansion via partners/acquisitions and wishes to
cater to Japanese OEMs. Its consistent focus on cost rationalisation would
improve EBIT margins ~10% & RoCE to ~13% in CY18E. Thus, we continue
to value MCI at 12x CY18E EV/EBITDA multiple & maintain our target price
of | 280 with BUY recommendation.
Rating matrix
Rating : Buy
Target : | 279
Target Period : 12 months
Potential Upside : 14%
What’s Changed?
Target Unchanged
EPS CY17E Changed from | 10.3 to | 9.7
EPS CY18E Changed from | 13.5 to | 12.9
Rating Unchanged
Standalone Quarterly Performance
(| Crore) Q2CY17 Q2CY16 YoY Q1CY17 QoQ
Revenues 449.5 404.5 11.1 464.1 -3.1
EBITDA 42.7 39.8 7.4 43.1 -1.0
EBITDA (%) 9.5 9.8 -33 bps 9.3 21 bps
Reported PAT 17.7 11.3 56.1 16.7 5.9
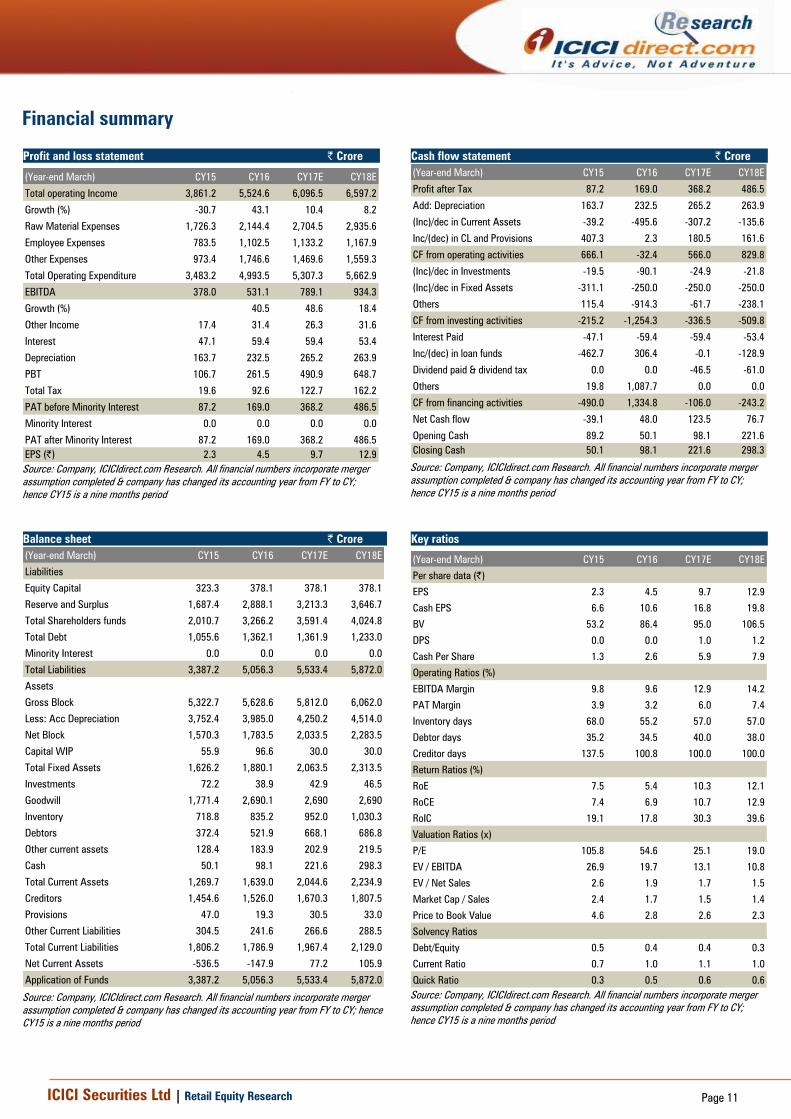
Key Financials
| Crore CY15 CY16 CY17E CY18E
Net Sales 3,677 5,287 5,841 6,313
EBITDA 378.0 531.1 789.1 934.3
Net Profit 87.2 169.0 368.2 486.5
EPS (|) 2.3 4.5 9.7 12.9
All financial numbers incorporate merger assumption completed &
company has changed its accounting year from FY to CY; hence
CY15 is a nine months period
Valuation summary
CY15 CY16 CY17E CY18E
P/E (x) 107.5 55.5 25.5 19.3
EV/EBITDA (x) 27.3 20.0 13.3 11.0
P/BV (x) 4.7 2.9 2.6 2.3
RoNW (%) 7.5 5.4 10.3 12.1
RoCE (%) 7.4 6.9 10.7 12.9
All financial numbers incorporate merger assumption completed &
company has changed its accounting year from FY to CY; hence
CY15 is a nine months period
Stock data
Particular Amount
Market Capitalization (| Crore) | 9224.7
Total Debt (CY16) | 1362.06 Crore
Cash & Investments (CY16) | 137 Crore
EV | 10449.7 Crore
52 week H/L (|) 260/170
Equity capital (| crore) | 378.1 Crore
Face value (|) | 5
All financial numbers incorporate merger assumption completed
Price Idirect target Consensus Target Mean % Consensus with BUY
Source: Bloomberg, Company, ICICIdirect.com Research
Key events
Date Event
Jun-08 Mahindra Forging's acquisitions in Europe, including Schöneweiss, start to integrate into the business
Apr-09 The company reports annual losses on the back of sudden downturn in the European business
Oct-09 Domestic business also suffers on the back of Lehmann crisis
Nov-09 Mahindra Forgings invests in doubling installed capacity in the forgings entity in India to 80,000 MT
Mar-10 Receives best supplier awards from Volvo Eicher, Kirloskar Oil Engines
Jul-10 Company starts to report better financials compared to previous years
Sep-11 Third crankshaft machining line installed, new makino installed for tool room in die production
Sep-13 CIE Automotive Spain and M&M agree to a merger between Mahindra Systech and CIE Forgings Europe. M&M acquires 13.5% stake in CIE SPA for €6 while
retaining 20% direct ownership in new company Mahindra CIE automotive. CIE post merger will have ~51% stake in the company
Jan-14 CIE's efforts in turning around Mahindra Forgings Europe start to reflect fruitfully as MFE starts to clock ~6-8% EBITDA
Jun-14 All parties ranging from shareholders to creditors give approval to the merger. Final court approval pending
Oct-14 Management indicates completion of the merger process likely by early December
Dec-14 Merger of Mahindra CIE companies formally completed on December 10, 2014
Jul-16 To optimise the synergy within companies, the board of directors have appointed Ander Arenara Alvarez as Chief Executive Officer of MCI
Sep-16 MCI acquires Bill Forge (which is into forging capabilities) which is into 4-W, 2-W and exports markets thereby diversifying its segment, customer & geography
mix going forward. It will acquire 100% stake for | 1331 crore, through a mix of equity (value | 1,090 crore) & cash (| 241 crore).
Oct-16 The Board of Directors appoints K Jayaprakash as Chief Financial Officer of the company
Source: Company, ICICIdirect.com Research
Top 10 Shareholders Shareholding Pattern
Rank Name Latest Filing Date % O/S Position (m) Change (m)
1 Participaciones Internacionales Autometal DOS, S. L. 31-Mar-17 0.51 194.3 0.00
2 Mahindra Group 31-Mar-17 0.17 65.3 0.00
3 Ainos Holdings Ltd. 31-Mar-17 0.04 13.8 0.00
4 GIC Private Limited 31-Mar-17 0.02 6.6 -0.01
5 Sundaram Asset Management Company Limited 31-Mar-17 0.02 5.8 0.00
ICICI Securities Ltd | Retail Equity Research Page 14
ANALYST CERTIFICATION
We /I, Nishit Zota, MBA & Vidrum Mehta, MBA Research Analyst, authors and the names subscribed to this report, hereby certify that all of the views expressed in this research report accurately
reflect our views about the subject issuer(s) or securities. We also certify that no part of our compensation was, is, or will be directly or indirectly related to the specific recommendation(s) or view(s) in this
report.
Terms & conditions and other disclosures:
ICICI Securities Limited (ICICI Securities) is a full-service, integrated investment banking and is, inter alia, engaged in the business of stock brokering and distribution of financial products. ICICI Securities
Limited is a Sebi registered Research Analyst with Sebi Registration Number – INH000000990. ICICI Securities is a wholly-owned subsidiary of ICICI Bank which is India’s largest private sector bank and has
its various subsidiaries engaged in businesses of housing finance, asset management, life insurance, general insurance, venture capital fund management, etc. (“associates”), the details in respect of which
are available on www.icicibank.com.
ICICI Securities is one of the leading merchant bankers/ underwriters of securities and participate in virtually all securities trading markets in India. We and our associates might have investment banking
and other business relationship with a significant percentage of companies covered by our Investment Research Department. ICICI Securities generally prohibits its analysts, persons reporting to analysts
and their relatives from maintaining a financial interest in the securities or derivatives of any companies that the analysts cover.
The information and opinions in this report have been prepared by ICICI Securities and are subject to change without any notice. The report and information contained herein is strictly confidential and
meant solely for the selected recipient and may not be altered in any way, transmitted to, copied or distributed, in part or in whole, to any other person or to the media or reproduced in any form, without
prior written consent of ICICI Securities. While we would endeavour to update the information herein on a reasonable basis, ICICI Securities is under no obligation to update or keep the information current.
Also, there may be regulatory, compliance or other reasons that may prevent ICICI Securities from doing so. Non-rated securities indicate that rating on a particular security has been suspended
temporarily and such suspension is in compliance with applicable regulations and/or ICICI Securities policies, in circumstances where ICICI Securities might be acting in an advisory capacity to this
company, or in certain other circumstances.
This report is based on information obtained from public sources and sources believed to be reliable, but no independent verification has been made nor is its accuracy or completeness guaranteed. This
report and information herein is solely for informational purpose and shall not be used or considered as an offer document or solicitation of offer to buy or sell or subscribe for securities or other financial
instruments. Though disseminated to all the customers simultaneously, not all customers may receive this report at the same time. ICICI Securities will not treat recipients as customers by virtue of their
receiving this report. Nothing in this report constitutes investment, legal, accounting and tax advice or a representation that any investment or strategy is suitable or appropriate to your specific
circumstances. The securities discussed and opinions expressed in this report may not be suitable for all investors, who must make their own investment decisions, based on their own investment
objectives, financial positions and needs of specific recipient. This may not be taken in substitution for the exercise of independent judgment by any recipient. The recipient should independently evaluate
the investment risks. The value and return on investment may vary because of changes in interest rates, foreign exchange rates or any other reason. ICICI Securities accepts no liabilities whatsoever for any
loss or damage of any kind arising out of the use of this report. Past performance is not necessarily a guide to future performance. Investors are advised to see Risk Disclosure Document to understand the
risks associated before investing in the securities markets. Actual results may differ materially from those set forth in projections. Forward-looking statements are not predictions and may be subject to
change without notice.
ICICI Securities or its associates might have managed or co-managed public offering of securities for the subject company or might have been mandated by the subject company for any other assignment
in the past twelve months.
ICICI Securities or its associates might have received any compensation from the companies mentioned in the report during the period preceding twelve months from the date of this report for services in
respect of managing or co-managing public offerings, corporate finance, investment banking or merchant banking, brokerage services or other advisory service in a merger or specific transaction.
ICICI Securities or its associates might have received any compensation for products or services other than investment banking or merchant banking or brokerage services from the companies mentioned
in the report in the past twelve months.
ICICI Securities encourages independence in research report preparation and strives to minimize conflict in preparation of research report. ICICI Securities or its associates or its analysts did not receive any
compensation or other benefits from the companies mentioned in the report or third party in connection with preparation of the research report. Accordingly, neither ICICI Securities nor Research Analysts
and their relatives have any material conflict of interest at the time of publication of this report.
It is confirmed that Nishit Zota, MBA & Vidrum Mehta, MBA Research Analyst, of this report have not received any compensation from the companies mentioned in the report in the preceding twelve
months.
Compensation of our Research Analysts is not based on any specific merchant banking, investment banking or brokerage service transactions.
ICICI Securities or its subsidiaries collectively or Research Analysts or their relatives do not own 1% or more of the equity securities of the Company mentioned in the report as of the last day of the month
preceding the publication of the research report.
Since associates of ICICI Securities are engaged in various financial service businesses, they might have financial interests or beneficial ownership in various companies including the subject
company/companies mentioned in this report.
It is confirmed that Nishit Zota, MBA & Vidrum Mehta, MBA Research Analyst, do not serve as an officer, director or employee of the companies mentioned in the report.
ICICI Securities may have issued other reports that are inconsistent with and reach different conclusion from the information presented in this report.
Neither the Research Analysts nor ICICI Securities have been engaged in market making activity for the companies mentioned in the report.
We submit that no material disciplinary action has been taken on ICICI Securities by any Regulatory Authority impacting Equity Research Analysis activities.
This report is not directed or intended for distribution to, or use by, any person or entity who is a citizen or resident of or located in any locality, state, country or other jurisdiction, where such distribution,
publication, availability or use would be contrary to law, regulation or which would subject ICICI Securities and affiliates to any registration or licensing requirement within such jurisdiction. The securities
described herein may or may not be eligible for sale in all jurisdictions or to certain category of investors. Persons in whose possession this document may come are required to inform themselves of and