Page 1
CMP 1230.50
Target Price 1354.00
ISIN: INE101A01026
MAY 31st
2014
MAHINDRA & MAHINDRA LIMITED Result Update (PARENT BASIS): Q4 FY14
BUYBUYBUYBUY
Index Details
Stock Data
Sector Automobile
BSE Code 500520
Face Value 5.00
52wk. High / Low (Rs.) 1264.65/741.50
Volume (2wk. Avg.) 91000
Market Cap (Rs. in mn.) 726388.76
Annual Estimated Results (A*: Actual / E*: Estimated)
YEARS FY14A FY15E FY16E
Net Sales 405085.00 453695.20 499064.72
EBITDA 54392.00 61910.52 67728.22
Net Profit 37583.50 39914.75 42544.38
EPS 63.67 67.62 72.07
P/E 19.33 18.20 17.07
Shareholding Pattern (%)
1 Year Comparative Graph
MAHINDRA & MAHINDRA LTD S&P BSE SENSEX
SYNOPSIS
During the quarter, Mahindra & Mahindra Ltd Net Profit after exceptional items and tax stood at Rs. 8968.8 mn as against Rs. 8891.9 mn in Q4 FY14.
During Q4 FY14, the Gross Revenues and Other Income of M&M was Rs. Rs.117647 mn as against Rs. 113658 mn during Q4 FY13.
During Q4 FY14, the Gross Revenues and Other Income of M&M and MVML (Entity) is Rs. Rs. 112972 mn as against Rs. 113423 mn in Q4 FY13.
Net Profit after exceptional items and tax for the quarter of Entity is Rs. 9677 mn against Rs. 9629 mn in Q4 last year.
Excluding Truck business of MTBL, net profit after tax for the quarter is Rs 9756 mn and the Operating Margin is 14.0%.
In the Passenger Utility Vehicle segment, the Entity sold 60900 vehicles in the current quarter with a market share of 43.3%. The Entity also exported 8335 Vehicles in the current quarter.
In Q4 FY14, the Company’s domestic sales at 52732 tractors grew by 14.4% over the 46107 tractors sold in Q4 last year.
Company’s market share was 37.9% as against 37.1% in Q4 last year. Mahindra Powerol posted net revenue of Rs. 2175 mn in Q4 FY14.
During the quarter, the Scheme of Arrangement for the merger Mahindra Trucks and Buses Ltd. (MTBL) with M&M was approved by the Honourable High Court of Bombay.
M&M has recommended a dividend of Rs.13.50 per share and a special dividend of Rs. 0.50 per share of face value Rs. 5.00 aggregating Rs. 14.00 for the year ended March 31, 2014.
Net Sales and PAT of the company are expected to grow at a CAGR of 7% and 8% over 2013 to 2016E respectively.
PEER GROUPS CMP MARKET CAP EPS P/E (X) P/BV(X) DIVIDEND
Company Name (Rs.) Rs. in mn. (Rs.) Ratio Ratio (%)
Mahindra & Mahindra Ltd 1230.50 726388.76 63.67 19.33 4.33 280.00
Maruti Suzuki India Ltd 2269.50 685570.70 92.13 24.63 3.21 240.00
Tata Motors Ltd 415.45 1337194.50 1.04 399.47 6.99 100.00
SML Isuzu Ltd 424.50 6143.20 12.02 35.32 2.18 30.00
Page 2
Analysis & Recommendation - ‘BUY’
The Gross Revenues and other income of Mahindra & Mahindra Ltd. and MVML (Entity) during the quarter ended
31st March 2014 is Rs. 112972 mn as against Rs. 113423 mn in the previous year. Net Profit after exceptional
items and tax for the current quarter is Rs. 9677 mn against Rs. 9629 mn in Q4 last year. Excluding the Trucks
business of MTBL, net profit after tax for the quarter is Rs 9756 mn and the Operating Margin is 14.0%. The
deceleration in the Gross Revenues in the quarter is due to the challenging times the Indian auto industry is
currently passing through with volumes shrinking by 11.6% in Q4 FY14. Despite this, the entity could deliver a
healthy Operating Margin and a growth in its profits in the quarter due to a strong sales performance by its Farm
Equipment Sector and a tight control on material costs and all expenses.
The Gross Revenues and Other Income of Mahindra & Mahindra Ltd for the quarter ended 31st March 2014 is
Rs.117647 mn as against Rs. 113658 mn during the corresponding period last year. The Net Profit after
exceptional items and tax for the current Q4 is Rs. 8968.8 mn as against Rs. 8891.90 mn in the same period.
In the Passenger Utility Vehicle segment, the Entity sold 60900 vehicles in the current quarter with a market
share of 43.3%. In the Cars segment, the Entity sold 1633 Veritos. The Entity also exported 8335 Vehicles in the
current quarter. In the wake of a good monsoon, the domestic tractor industry continued to show robust growth
with sales of 138567 tractors in Q4 FY14 against 123767 tractors sold in Q4 last year - a growth of 12.0%. In this
period, the Company’s domestic sales at 52732 tractors grew by 14.4% over the 46107 tractors sold in Q4 last
year. Company’s market share was 37.9% as against 37.1% in Q4 last year. Mahindra Powerol posted net
revenue of Rs. 2175 mn in Q4 FY14. Over FY2013-16E, we expect the company to post a CAGR of 7% and 8% in
its top-line and bottom-line respectively. Hence, we recommend ‘BUY’ for ‘Mahindra & Mahindra Ltd’ with a
target price of Rs. 1354.00 for medium to long term investment.
Page 3
QUARTERLY HIGHLIGHTS (PARENT BASIS)
Results updates- Q4 FY14,
Mahindra & Mahindra Ltd India’s leading SUV
manufacturer has a presence in the automotive
industry, agribusiness, aerospace, components,
consulting services, defence, energy, financial
services, industrial equipment, logistics, real estate,
retail, steel and two wheelers, reported its financial
results for the quarter ended 31st March, 2014.
Months Mar-14 Mar-13 % Change
Net Sales 110007.30 104865.30 4.90
Net Profit 8968.80 8891.90 0.86
EPS 15.19 15.06 0.86
EBITDA 10050.60 14524.90 (30.80)
The company’s net profit stood at Rs. 8968.80 million against Rs. 8891.90 million in the corresponding quarter
ending of previous year, an increase of 0.86%. Revenue for the quarter rose by 4.90% to Rs. 110007.30 million
from Rs. 104865.30 million, when compared with the prior year period. Reported earnings per share of the
company stood at Rs. 15.19 a share during the quarter, registering 0.86% increase over previous year period.
Profit before interest, depreciation and tax is Rs. 10050.60 million as against Rs. 14524.90 million in the
corresponding period of the previous year.
Break up of Expenditure
Break up of
Expenditure
Rs. in million
Q4 FY14 Q4 FY13 %
Change
Cost of Material
Consumed 57205.50 53653.30 7%
Employee Benefit
Expenses 6146.70 4424.00 39%
Depreciation &
Amortization Expense 2908.90 1986.00 46%
Other Expenses 13480.30 9403.80 43%
Purchase of Stock in
Trade 25919.40 24868.20 4%
Page 4
Segment Revenue
Latets Updates
• During the current quarter, the Scheme of Arrangement for the merger of the Trucks business of the M&M’s
subsidiary, Mahindra Trucks and Buses Ltd. (MTBL) with M&M, was approved by the Honourable High Court
of Bombay.
• In the Passenger Utility Vehicle segment, the Entity sold 60900 vehicles in the current quarter with a market
share of 43.3%. In the Cars segment, the Entity sold 1633 Veritos. The Entity also exported 8335 Vehicles in
the current quarter.
• The domestic tractor industry continued to show robust growth with sales of 138567 tractors in Q4 FY2014
against 123767 tractors sold in Q4 last year - a growth of 12.0%. In this period, the Company’s domestic sales
at 52732 tractors grew by 14.4% over the 46107 tractors sold in Q4 last year.
• Company’s market share was 37.9% as against 37.1% in Q4 last year. Mahindra Powerol posted net revenue
of Rs.2175 mn in Q4 FY2014.
• Exceptional items of Rs. 527.9 mn for the quarter are on sale of certain long term investments.
• Mahindra & Mahindra Ltd has recommended a dividend of Rs.13.50 (270%) per share and a special dividend
of Rs. 0.50 (10%) per share of face value Rs. 5.00 aggregating Rs. 14.00 (280%) for the year ended March 31,
2014.
• India Ratings & Research (lnd-Ra, a Fitch Group Company) has assigned a Long-Term Issuer Rating of 'IND
AAA' to Mahindra & Mahindra Limited, with a ‘Stable’ outlook.
Page 5
• The Agri division of Mahindra & Mahindra Ltd has signed a joint venture agreement with HZPC, Holland, one
of the leading innovative companies in the world in potato breeding, seed potato growing and seed potato
trading to offer the best quality seed potatoes to farmers within and outside India. The joint venture will have
Mahindra and HZPC holding 60 and 40 percent equity respectively in the company.
COMPANY PROFILE
A USD 16.7 billion multinational group based in Mumbai, India, Mahindra employs more than 180,000 people in
over 100 countries. M&M was set up in 1945 to make general purpose utility vehicles for the Indian market and
soon it started manufacturing agricultural tractors and light commercial vehicles (LCVs). Later the company
expanded its operations to secure a significant presence in many more significant sectors. M&M also has
controlling stake in REVA Electric Car Company and acquired South Korea's SsangYong Motor Company in 2011.
The company has separate sector as Mahindra Systems and Automotive Technologies (MSAT) to focus on
developing components and offering engineering services.
The Mahindra Group is well diversified in auto sector, auto component, farm equipment, infrastructure
development, telecom and software, trade and financial services. It is a leading name in the general purpose
utility vehicles market in India. The company has recently entered in the two-wheeler segment by taking over
Kinetic Motors in India.
Mahindra’s Farm Equipment Sector is also the proud recipient of the Japan Quality Medal, the only tractor
company worldwide to be bestowed this honor. It also holds the distinction of being the only tractor company
worldwide to win the Deming Prize.
Global presence
Today, M&M is the leader in the utility vehicle segment in India with its flagship UV Scorpio and enjoys a growing
global market presence in both the automotive and tractor businesses.
In addition to making groundbreaking UVs like the Scorpio and Bolero, Mahindra offers cars, pickups &
commercial vehicles that are rugged, reliable, environmentally friendly and fuel-efficient. Its global presence
means Mahindra vehicles on the roads of both paved and unpaved of Australia, Europe, Latin America, and
Malaysia & South Africa.
Products
The Mahindra & Mahindra Limited product portfolio are as follows:
� Commercial Vehicles
� Personal Vehicles
Page 6
Commercial Vehicles
• Alfa
• Gio
• Genio
• Bolero Maxi Truck
• Loadking
• Maxximo
• Mahindra Navistar Trucks
• Tourister Buses
Personal Vehicles
• Bolero
• Scorpio
• Thar
• Verito
• Xylo
• Actyon Sports
• Chairman W
• Korando
• Kyron
• Rexton II
• Rodius
• REVA Electric Cars
• XUV 500
Stakes & Acquisitions
• SsangYong Motor Company
SsangYong was acquired by India's Mahindra & Mahindra Limited in February 2011 after being named the
preferred bidder in 2010 to acquire the bankruptcy protected company. It is the fourth largest South Korean
automobile manufacturer.
• Reva Electric Car
Mahindra Reva Electric Vehicles Private Limited is an Indian company based in Bangalore, involved in
designing and manufacturing of compact electric vehicles. The company has been acquired by Indian
conglomerate Mahindra & Mahindra in May 2010, and now operates as one of its parent's marquees.
Page 7
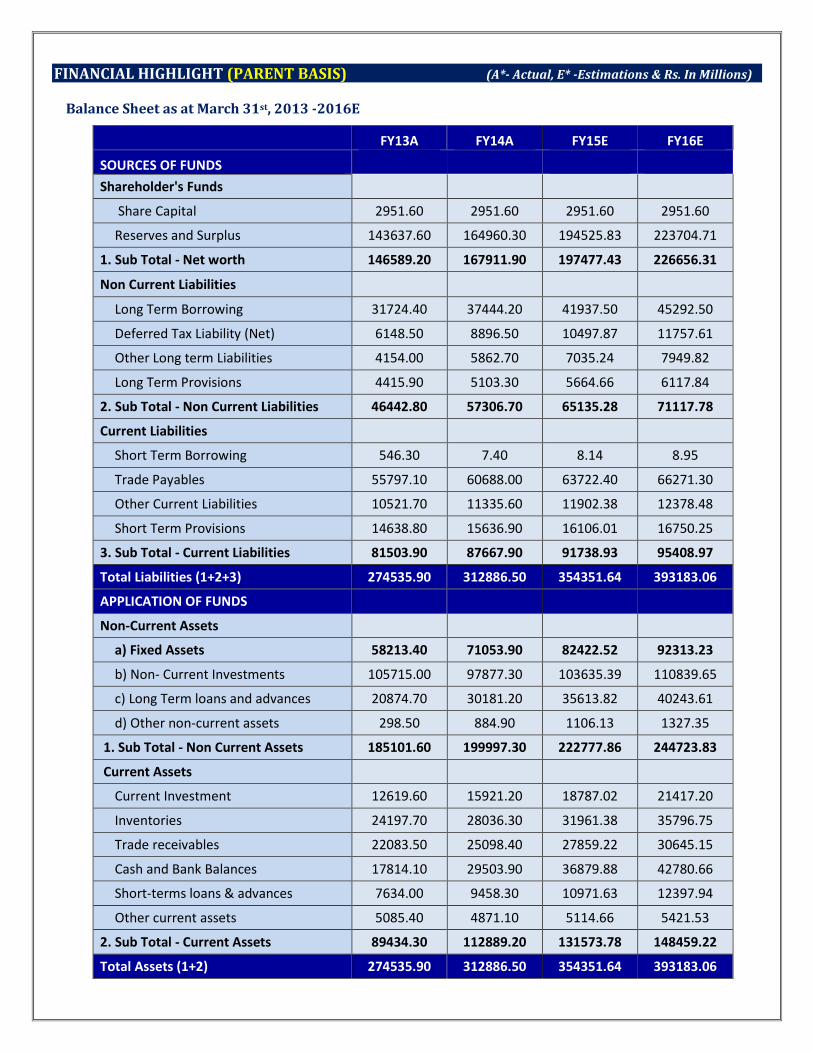
FINANCIAL HIGHLIGHT (PARENT BASIS) (A*- Actual, E* -Estimations & Rs. In Millions)
Balance Sheet as at March 31st, 2013 -2016E
FY13A FY14A FY15E FY16E
SOURCES OF FUNDS
Shareholder's Funds
Share Capital 2951.60 2951.60 2951.60 2951.60
Reserves and Surplus 143637.60 164960.30 194525.83 223704.71
1. Sub Total - Net worth 146589.20 167911.90 197477.43 226656.31
Non Current Liabilities
Long Term Borrowing 31724.40 37444.20 41937.50 45292.50
Deferred Tax Liability (Net) 6148.50 8896.50 10497.87 11757.61
Other Long term Liabilities 4154.00 5862.70 7035.24 7949.82
Long Term Provisions 4415.90 5103.30 5664.66 6117.84
2. Sub Total - Non Current Liabilities 46442.80 57306.70 65135.28 71117.78
Current Liabilities
Short Term Borrowing 546.30 7.40 8.14 8.95
Trade Payables 55797.10 60688.00 63722.40 66271.30
Other Current Liabilities 10521.70 11335.60 11902.38 12378.48
Short Term Provisions 14638.80 15636.90 16106.01 16750.25
3. Sub Total - Current Liabilities 81503.90 87667.90 91738.93 95408.97
Total Liabilities (1+2+3) 274535.90 312886.50 354351.64 393183.06
APPLICATION OF FUNDS
Non-Current Assets
a) Fixed Assets 58213.40 71053.90 82422.52 92313.23
b) Non- Current Investments 105715.00 97877.30 103635.39 110839.65
c) Long Term loans and advances 20874.70 30181.20 35613.82 40243.61
d) Other non-current assets 298.50 884.90 1106.13 1327.35
1. Sub Total - Non Current Assets 185101.60 199997.30 222777.86 244723.83
Current Assets
Current Investment 12619.60 15921.20 18787.02 21417.20
Inventories 24197.70 28036.30 31961.38 35796.75
Trade receivables 22083.50 25098.40 27859.22 30645.15
Cash and Bank Balances 17814.10 29503.90 36879.88 42780.66
Short-terms loans & advances 7634.00 9458.30 10971.63 12397.94
Other current assets 5085.40 4871.10 5114.66 5421.53
2. Sub Total - Current Assets 89434.30 112889.20 131573.78 148459.22
Total Assets (1+2) 274535.90 312886.50 354351.64 393183.06
Page 8
Annual Profit & Loss Statement for the period of 2013 to 2016E
Value(Rs.in.mn) FY13A FY14A FY15E FY16E
Description 12m 12m 12m 12m
Net Sales 404411.60 405085.00 453695.20 499064.72
Other Income 5491.70 7179.90 7467.10 7840.45
Total Income 409903.30 412264.90 461162.30 506905.17
Expenditure -356412.40 -357872.90 -399251.78 -439176.95
Operating Profit 53490.90 54392.00 61910.52 67728.22
Interest -1911.90 -2592.20 -3006.95 -3427.93
Gross profit 51579.00 51799.80 58903.57 64300.29
Depreciation -7108.10 -8633.40 -9928.41 -11119.82
Exceptional Items 0.00 527.90 0.00 0.00
Profit Before Tax 44470.90 43694.30 48975.16 53180.47
Tax -10942.70 -6110.80 -9060.40 -10636.09
Net Profit 33528.20 37583.50 39914.75 42544.38
Equity capital 2951.60 2951.60 2951.60 2951.60
Reserves 143529.20 164852.40 194525.83 223704.71
Face value 5.00 5.00 5.00 5.00
EPS 56.80 63.67 67.62 72.07
Quarterly Profit & Loss Statement for the period of 30th Sep, 2013 to 30th June, 2014E
Value(Rs.in.mn) 30-Sep-13 31-Dec-13 31-Mar-14 30-Jun-14E
Description 3m 3m 3m 3m
Net sales 89295.70 105556.80 110007.30 114407.59
Other income 3606.30 946.40 984.90 1103.09
Total Income 92902.00 106503.20 110992.20 115510.68
Expenditure -77846.30 -91734.20 -100941.60 -100678.68
Operating profit 15055.70 14769.00 10050.60 14832.00
Interest -622.60 -633.30 -843.00 -775.56
Gross profit 14433.10 14135.70 9207.60 14056.44
Depreciation -1970.10 -1948.10 -2908.90 -2559.83
Exceptional Items 0.00 0.00 527.90 0.00
Profit Before Tax 12463.00 12187.60 6826.60 11496.61
Tax -2568.00 -2847.00 2142.20 -2333.81
Net Profit 9895.00 9340.60 8968.80 9162.80
Equity capital 2951.60 2951.60 2951.60 2951.60
Face value 5.00 5.00 5.00 5.00
EPS 16.76 15.82 15.19 15.52
Page 9
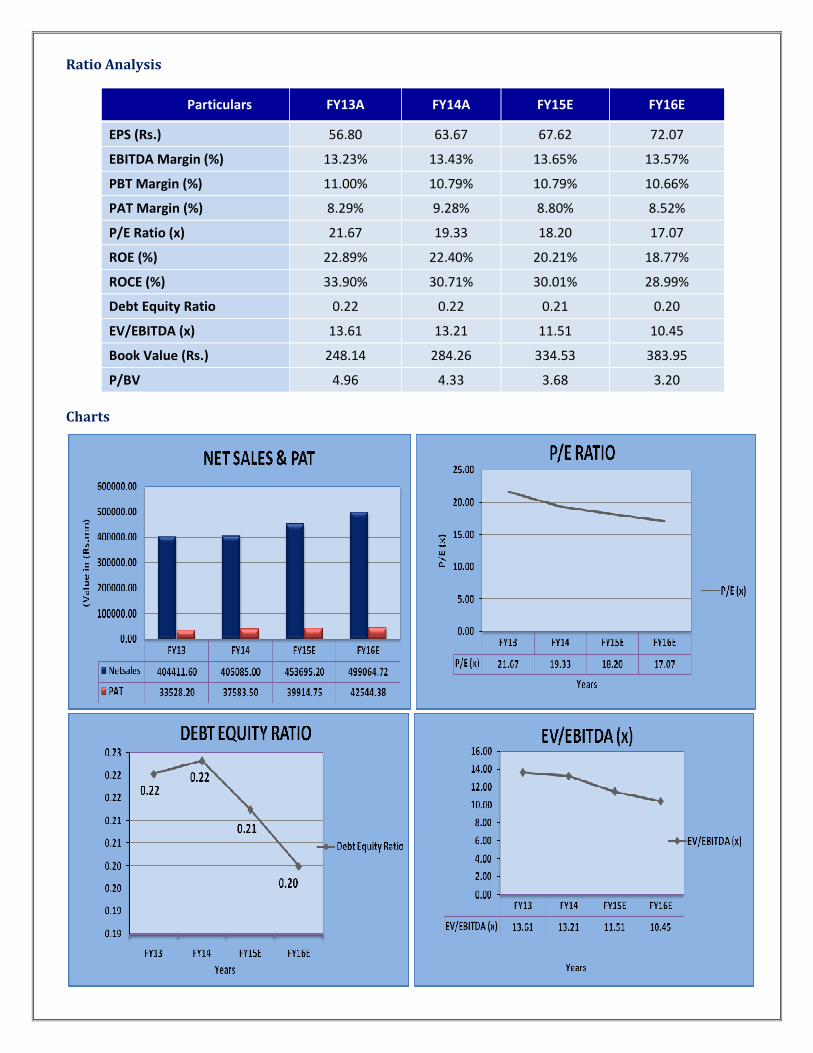
Ratio Analysis
Particulars FY13A FY14A FY15E FY16E
EPS (Rs.) 56.80 63.67 67.62 72.07
EBITDA Margin (%) 13.23% 13.43% 13.65% 13.57%
PBT Margin (%) 11.00% 10.79% 10.79% 10.66%
PAT Margin (%) 8.29% 9.28% 8.80% 8.52%
P/E Ratio (x) 21.67 19.33 18.20 17.07
ROE (%) 22.89% 22.40% 20.21% 18.77%
ROCE (%) 33.90% 30.71% 30.01% 28.99%
Debt Equity Ratio 0.22 0.22 0.21 0.20
EV/EBITDA (x) 13.61 13.21 11.51 10.45
Book Value (Rs.) 248.14 284.26 334.53 383.95
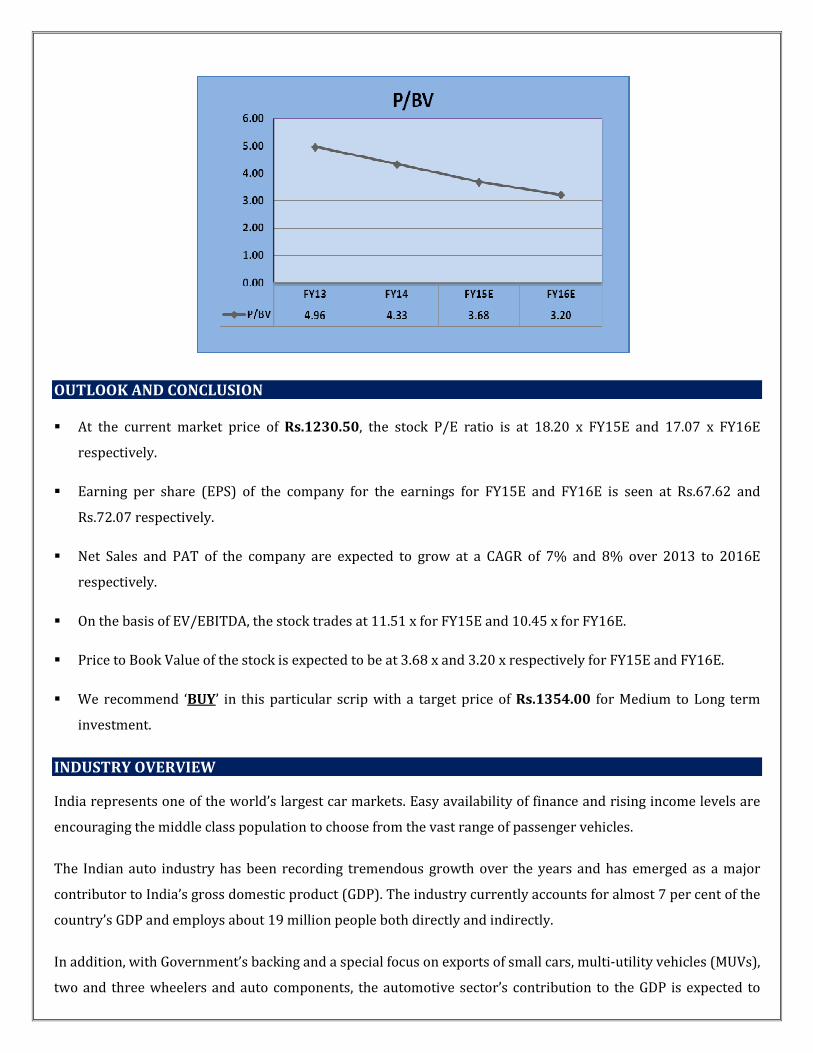
P/BV 4.96 4.33 3.68 3.20
Charts
Page 10
OUTLOOK AND CONCLUSION
� At the current market price of Rs.1230.50, the stock P/E ratio is at 18.20 x FY15E and 17.07 x FY16E
respectively.
� Earning per share (EPS) of the company for the earnings for FY15E and FY16E is seen at Rs.67.62 and
Rs.72.07 respectively.
� Net Sales and PAT of the company are expected to grow at a CAGR of 7% and 8% over 2013 to 2016E
respectively.
� On the basis of EV/EBITDA, the stock trades at 11.51 x for FY15E and 10.45 x for FY16E.
� Price to Book Value of the stock is expected to be at 3.68 x and 3.20 x respectively for FY15E and FY16E.
� We recommend ‘BUY’ in this particular scrip with a target price of Rs.1354.00 for Medium to Long term
investment.
INDUSTRY OVERVIEW
India represents one of the world’s largest car markets. Easy availability of finance and rising income levels are
encouraging the middle class population to choose from the vast range of passenger vehicles.
The Indian auto industry has been recording tremendous growth over the years and has emerged as a major
contributor to India’s gross domestic product (GDP). The industry currently accounts for almost 7 per cent of the
country’s GDP and employs about 19 million people both directly and indirectly.
In addition, with Government’s backing and a special focus on exports of small cars, multi-utility vehicles (MUVs),
two and three wheelers and auto components, the automotive sector’s contribution to the GDP is expected to
Page 11
double reaching a turnover worth US$ 145 billion in 2016, according to the Automotive Mission Plan (AMP)
2006–2016.
Key Statistics
The auto industry produced a total 1.81 million vehicles, including passenger vehicles, commercial vehicles,
three wheelers and two wheelers in February 2014 as against 1.73 million in February 2013, registering a
growth of 4.41 per cent over the same month last year. The increase continues to be on account of growth in two
wheelers production. Moreover, the overall domestic sales during April–February 2014 grew marginally by 2.68
per cent over the same period last year.
The passenger vehicles production in India is expected to reach 10 million units by 2020–21. The industry is
estimated to grow at a compound annual growth rate (CAGR) of 13 per cent during 2012–2021. In addition, the
industry is projected to touch US$ 30 billion by 2020–21, according to data from Automotive Component
Manufacturers’ Association (ACMA).
The cumulative foreign direct investment (FDI) inflows into the Indian automobile industry during the period
April 2000 to January 2014 was recorded at US$ 9,344 million, an increase of 4 per cent to the total FDI inflows
in terms of US$, according to data published by Department of Industrial Policy and Promotion (DIPP),
Government of India.
The overall automobile exports grew by 6.39 per cent during April–February 2014. Passenger vehicles, three
wheelers and two wheelers registered growth at 6.44 per cent, 16.40 per cent and 5.41 per cent respectively,
compared to the same period last year.
Major Developments & Investments
• German auto maker Volkswagen is planning to expand production capacity and introduce a slew of new
models. The group is looking at investing Rs 1,500 crore (US$ 248.55 million) over the next five years to
set up a diesel engine manufacturing facility.
• Amtek Auto signed an agreement to buy Germany's Kuepper Group of companies for about Rs 16.78
billion (US$ 277.97 million) in December 2013, which was its second big European acquisition in 2013.
• Jaguar Land Rover (JLR) will scale up its production capacity to hit 700,000 units by FY 2017 riding on its
joint ventures (JV) in China and Brazil, as per analysts. JLR's capacity for 2014 is pegged at 450,000 units.
• Infosys has signed a multi-year contract with Volvo Cars to provide application development services to
the latter's global operations.
• JCB announced plans to relocate production of compaction equipment to factories in the UK and to Pune,
India, and close the Gatersleben site in Germany.
Page 12
• Piaggio Vehicles Pvt Ltd, scooter and light commercial vehicle manufacturer, is planning to assemble its
super bikes locally, which it sells under the brand Aprilia.
Furthermore, India is expected to emerge as a centre for producing compact superbikes. Several global and
Indian bike makers plan to utilise India's mass production base of 16 million two wheelers to roll out sports
bikes in the 250cc capacity.
Government Initiatives
The Interim Budget 2014-15 added some incentives to the auto industry. To give relief to the automobile
industry, the excise duty has been reduced till June 30, 2014 as follows:
• For small cars, motorcycle, scooters – the duty has been reduced from 12 per cent to 8 per cent.
• For commercial vehicles and SUVs – the duty has been reduced from 30 per cent to 24 per cent.
• For large and mid-segment cars – the duty has been reduced from 27/24 per cent to 24/20 per cent.
The other incentives from Union Budget 2013–14 are as follows:
• The period of concession available for specified part of electric and hybrid vehicles till April 2013 has
been extended up to March 31, 2015.
• An exemption from BCD will be provided to lithium ion automotive battery for manufacture of lithium
ion battery packs for supply to manufacturers of hybrid and electric vehicles.
The Government of India allows 100 per cent FDI in the automotive industry through automatic route.
Road Ahead
The vision of AMP 2006–2016 expects India, “to emerge as the destination of choice in the world for design and
manufacture of automobiles and auto components with output reaching a level of US$ 145 billion; accounting for
more than 10 per cent of the GDP and providing additional employment to 25 million people by 2016.”
Page 13
Disclaimer:
This document prepared by our research analysts does not constitute an offer or solicitation for the purchase or sale
of any financial instrument or as an official confirmation of any transaction. The information contained herein is
from publicly available data or other sources believed to be reliable but do not represent that it is accurate or
complete and it should not be relied on as such. Firstcall India Equity Advisors Pvt. Ltd. or any of it’s affiliates shall
not be in any way responsible for any loss or damage that may arise to any person from any inadvertent error in the
information contained in this report. This document is provide for assistance only and is not intended to be and must
not alone be taken as the basis for an investment decision.
Page 14
Firstcall India Equity Research: Email – [email protected]
C.V.S.L.Kameswari Pharma
U. Janaki Rao Capital Goods
B. Anil Kumar Auto, IT & FMCG
Suhani Adilabadkar Pharma & Banking
M. Vinayak Rao Diversified
C. Bhagya Lakshmi Diversified
Firstcall India also provides
Firstcall India Equity Advisors Pvt.Ltd focuses on, IPO’s, QIP’s, F.P.O’s,Takeover
Offers, Offer for Sale and Buy Back Offerings.
Corporate Finance Offerings include Foreign Currency Loan Syndications,
Placement of Equity / Debt with multilateral organizations, Short Term Funds
Management Debt & Equity, Working Capital Limits, Equity & Debt
Syndications and Structured Deals.
Corporate Advisory Offerings include Mergers & Acquisitions(domestic and
cross-border), divestitures, spin-offs, valuation of business, corporate
restructuring-Capital and Debt, Turnkey Corporate Revival – Planning &
Execution, Project Financing, Venture capital, Private Equity and Financial
Joint Ventures
Firstcall India also provides Financial Advisory services with respect to raising
of capital through FCCBs, GDRs, ADRs and listing of the same on International
Stock Exchanges namely AIMs, Luxembourg, Singapore Stock Exchanges and
other international stock exchanges.
For Further Details Contact:
3rd Floor,Sankalp,The Bureau,Dr.R.C.Marg,Chembur,Mumbai 400 071
Tel. : 022-2527 2510/2527 6077/25276089 Telefax : 022-25276089
E-mail: [email protected]
www.firstcallindiaequity.com