45
MAIN INDICATORS OF THE VISEGRÁD GROUP COUNTRIES

CHA
PTER
TIT
LE
MAIN INDICATORS OF THE VISEGRÁD
GROUP COUNTRIES
MAIN INDICATORS OF THE VISEGRÁD
GROUP COUNTRIES
© Hungarian Central Statistical O� ce, 2018
© Czech Statistical O� ce, 2018
© Statistics Poland, 2018
© Statistical O� ce of the Slovak Republic, 2018
Prepared by the Hungarian Central Statistical O� ce
in cooperation with statistical o� ces of
Czech Republic, Poland and Slovakia
Primary source of data in the publication is the database of Eurostat.
All other sources are indicated in footnotes at the place of occurrence.
Information on methodology:
methodological notes linked to datasets under
http://ec.europa.eu/eurostat/data/database
as well as on the sites of data sources indicated
CONTENTS
Hungarian Central Statistical O� ce, 2018 3

Main indicators of the Visegrád Group countries4
CON
TEN
TS
CHAPTER 1 COMPREHENSIVE INFORMATION
Figure 1: Capitals and largest cities ............................................................ 12Table 1: Geographical information ............................................................. 13Table 2: Weight of Visegrád Group
countries in the European Union ........................................................... 14
CHAPTER 2 POPULATION AND LIVING CONDITIONS
Table 3: Population on 1 January ................................................................ 16Figure 2: Distribution of population by
main age groups, 1 January 2017 .......................................................... 16Table 4: Average life expectancy at birth, 2015 ..................................... 16Figure 3: Items of population change
per 1000 inhabitants ................................................................................... 16Table 5: Number of employed persons
aged 15–64 ..................................................................................................... 17Figure 4: Employment rate of population
aged 15–64 ..................................................................................................... 17Figure 5: Distribution of employed persons by size
of enterprises, 2015 ..................................................................................... 17Figure 6: Distribution of employees
aged 15–64 by sections, 2016 ................................................................. 18Table 6: Number of unemployed persons
aged 15–74 ..................................................................................................... 18Figure 7: Unemployment rate of the population
aged 15–74 ..................................................................................................... 19Figure 8: Price level index of actual individual
consumption ............................................................................................... 19Figure 9: Change of harmonised index of consumer prices ............. 19Figure 10: Volume of household � nal consumption
expenditure .................................................................................................. 20Table 7: Level of actual individual consumption
per capita in purchasing power parity ................................................. 20
CHAPTER 3 EDUCATION AND RESEARCH
Figure 11: Population by educational attainment level, 2016 ................................................................................ 22
Table 8: Number of students in tertiary education ........................................................................................................ 22
Figure 12: Proportion of students in tertiary education as % of the population aged 20–24 ................................. 22
Figure 13: Number of students per lecturer in tertiary education ................................................................................... 22
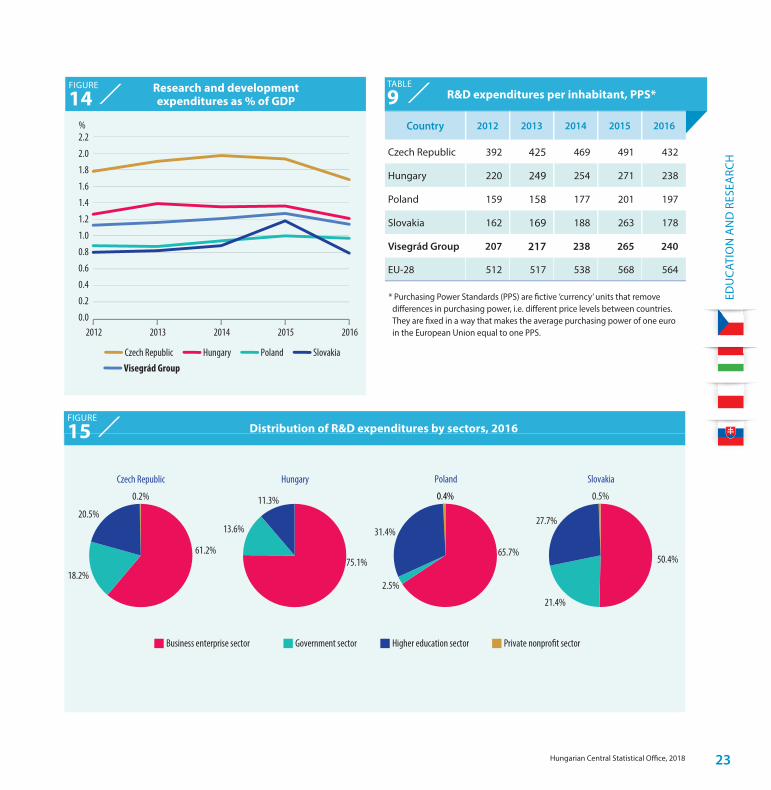
Figure 14: Research and development expenditures as % of GDP .................................................................................................... 23
Table 9: R&D expenditures per inhabitant, PPS ..................................... 23Figure 15: Distribution of R&D expenditures
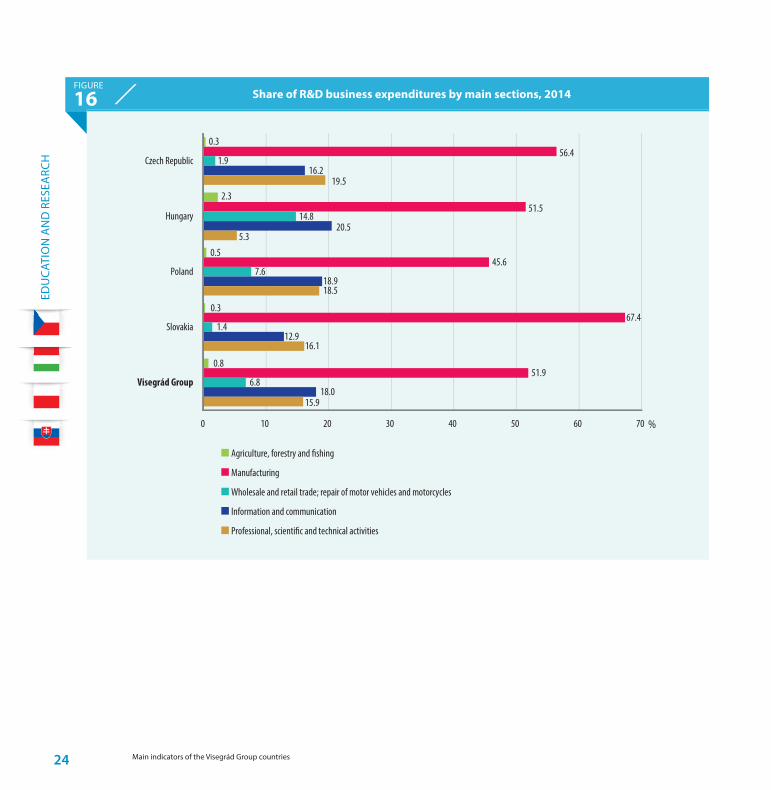
by sectors, 2016 ............................................................................................ 23Figure 16: Share of R&D business expenditures
by main sections, 2014 ............................................................................... 24
CHAPTER 4ECONOMIC ENVIRONMENT
Figure 17: Share of foreign a� liates in value added at factor cost of enterprises, 2015 .......................................................... 26
Figure 18: Distribution of value added at factor cost of foreign a� liates by section, 2015 ........................................................... 26
Table 10: Distribution of number of enterprises by number of employed persons, 2015 ............................................... 27
Figure 19: Gross domestic product (GDP) per capita in purchasing power parity, as % of EU-28 average ....................... 27
Figure 20: Volume of gross domestic product (GDP) ............................................................................ 27
Figure 21: Regional (NUTS2) GDP per capita in purchasing power parity, as % of EU-28 average, 2016 ................. 28
Figure 22: Distribution of gross value added by section, 2017 ............................................................................................ 29

Hungarian Central Statistical O� ce, 2018 5
CON
TEN
TS
Figure 23: Volume of gross � xed capital formation.............................. 29Figure 24: Gross � xed capital formation
as a percentage of GDP .............................................................................. 29Table 11: Production of main crops, 2016 ............................................... 30Table 12: Production of main fruits, 2016 ................................................ 30Table 13: Livestock, 1 December 2016 ...................................................... 30Figure 25: Volume of industrial production,
calendar adjusted......................................................................................... 31Figure 26: Share of manufacture of transport
equipment in gross value added of manufacturing........................ 31Figure 27: Volume of production in construction,
calendar adjusted......................................................................................... 31Figure 28: Volume of retail trade turnover,
calendar adjusted......................................................................................... 31
CHAPTER 5EXTERNAL RELATIONS
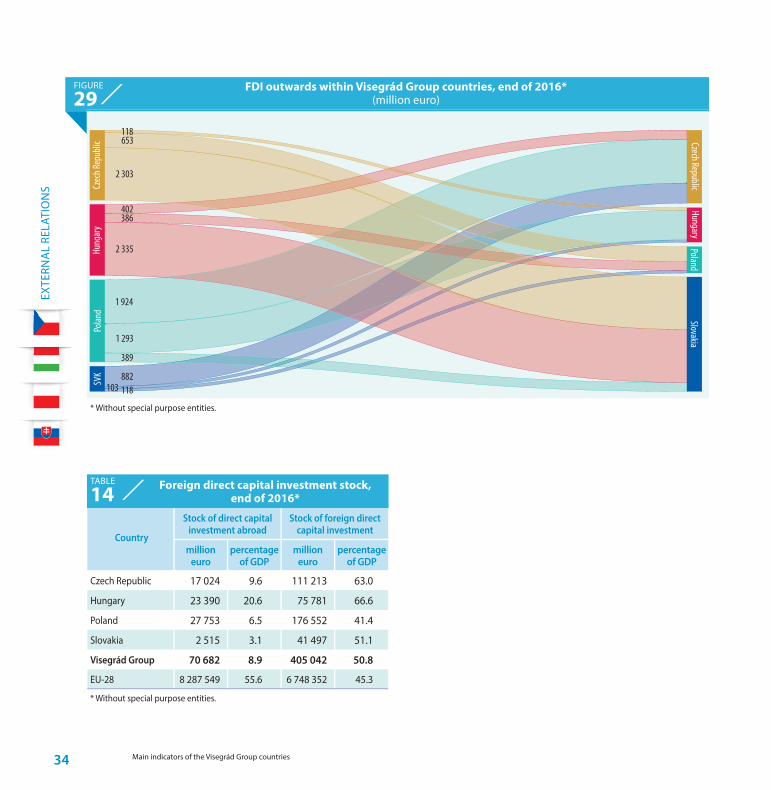
Figure 29: FDI outwards within Visegrád Group countries, end of 2016 ................................................................................ 34
Table 14: Foreign direct capital investment stock, end of 2016 ..................................................................................................... 34
Table 15: Major partner countries based on FDI stock data, end of 2016 ...................................................................... 35
Figure 30: FDI outwards within Visegrád Group countries in manufacturing, end of 2015 ............................................ 36
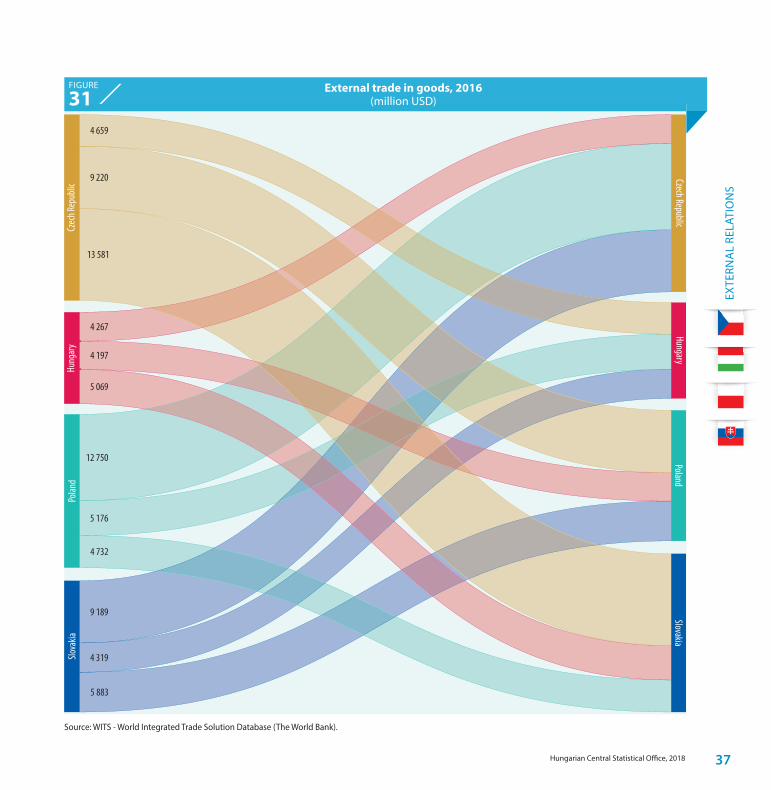
Figure 31: External trade in goods, 2016.................................................. 37Table 16: Major partner countries in merchandise
imports and exports, by country, 2016 ................................................ 38Figure 32: Volume of external trade in goods, 2016 ............................ 39Figure 33: High-tech exports as a share of
total exports ................................................................................................... 39Table 17: Number domestic and international
quest-nights, 2016 ....................................................................................... 39
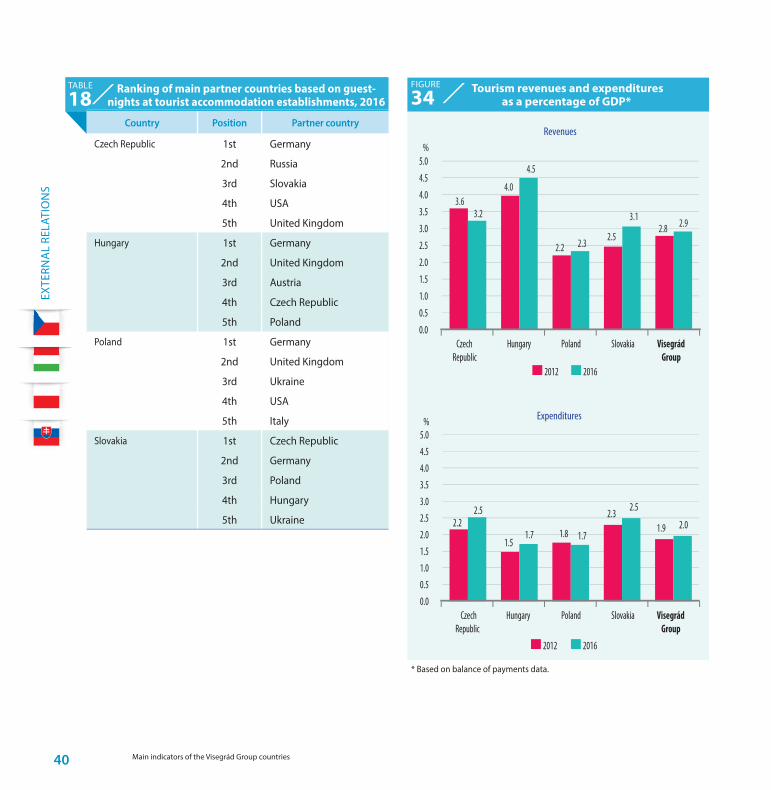
Table 18: Ranking of main partner countries based on guest-nights at tourist accommodation establishments, 2016 .................................................................................. 40
Figure 34: Tourism revenues and expenditures as a percentage of GDP ................................................................................... 40
CHAPTER 6INFRASTRUCTURE
Figure 35: Length of motorways ................................................................. 42Figure 36: Length of railway lines ............................................................... 42Table 19: Length of motorways and railway lines
per 100 km2, 2016 ........................................................................................ 42Figure 37: Passenger cars per 1000 inhabitants .................................... 42Figure 38: Share of renewable energy
in gross � nal energy consumption ........................................................ 43Figure 39: Proportion of households
with internet connection .......................................................................... 43Figure 40: Internet purchases by individuals
in the last 3 months ..................................................................................... 43Figure 41: Interaction with public authorities
in the last 12 months .................................................................................. 43


1PREFACE
Hungarian Central Statistical O� ce, 2018 7
Main indicators of the Visegrád Group countries8
PREF
ACE
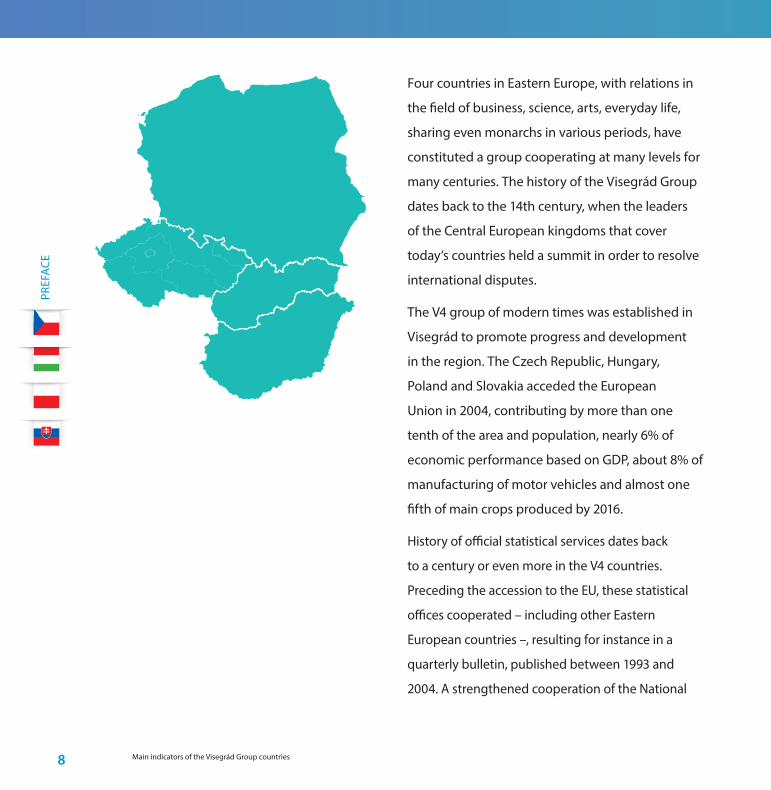
Four countries in Eastern Europe, with relations in
the � eld of business, science, arts, everyday life,
sharing even monarchs in various periods, have
constituted a group cooperating at many levels for
many centuries. The history of the Visegrád Group
dates back to the 14th century, when the leaders
of the Central European kingdoms that cover
today’s countries held a summit in order to resolve
international disputes.
The V4 group of modern times was established in
Visegrád to promote progress and development
in the region. The Czech Republic, Hungary,
Poland and Slovakia acceded the European
Union in 2004, contributing by more than one
tenth of the area and population, nearly 6% of
economic performance based on GDP, about 8% of
manufacturing of motor vehicles and almost one
� fth of main crops produced by 2016.
History of o� cial statistical services dates back
to a century or even more in the V4 countries.
Preceding the accession to the EU, these statistical
o� ces cooperated – including other Eastern
European countries –, resulting for instance in a
quarterly bulletin, published between 1993 and
2004. A strengthened cooperation of the National
Hungarian Central Statistical O� ce, 2018 9
Dr. Vukovich Gabriella President of Hungarian Central Statistical O� ce
Marek RojíčekPresident of Czech Statistical O� ce
Dominik RozkrutPresident of StatisticsPoland
Alexander BallekPresident of Statistical O� ce of the Slovak Republic
PREF
ACE
Statistical Institutes of the four countries started in
2018, with the aim of creating a platform to discuss
speci� c statistical topics of mutual interest, and
to exchange views and best practices of statistical
production and the development of methodologies.
As the � rst tangible outcome of our strengthened
cooperation the four NSIs publish this booklet on
the main indicators of the Visegrád Group countries,
covering population and living conditions, education
and research, the economic environment, external
relations and infrastructure. In this joint publication,
put together for the � rst time to provide an insight
into the most important social and economic
characteristics of the V4 countries, the similarities
and diversities within this block of countries can be
observed as well as the weight of the group within
the EU. The booklet includes comprehensive, visual
information presented in tables and charts. The
concept and development of the content are the
result of the statistical cooperation between the four
countries.
We hope that this information will be
useful to our readers.


Hungarian Central Statistical O� ce, 2018 11
COMPREHENSIVE INFORMATION
1
COM
PREH
ENSI
VE IN
FORM
ATIO
N
Main indicators of the Visegrád Group countries12
Praha
Budapest
Bratislava
Warszawa
Łódź
Kraków
Prešov
Košice
Ostrava
Brno
Debrecen
Szeged
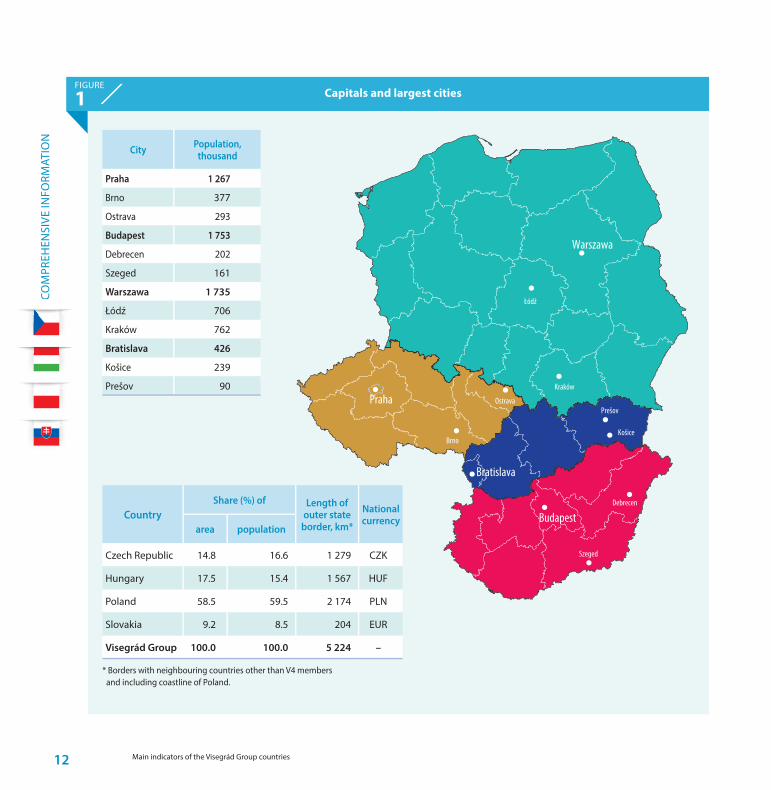
Capitals and largest citiesFIGURE
1
* Borders with neighbouring countries other than V4 members and including coastline of Poland.
City Population, thousand
Praha 1 267
Brno 377
Ostrava 293
Budapest 1 753
Debrecen 202
Szeged 161
Warszawa 1 735
Łódź 706
Kraków 762
Bratislava 426
Košice 239
Prešov 90
CountryShare (%) of Length of
outer state border, km*
National currency
area population
Czech Republic 14.8 16.6 1 279 CZK
Hungary 17.5 15.4 1 567 HUF
Poland 58.5 59.5 2 174 PLN
Slovakia 9.2 8.5 204 EUR
Visegrád Group 100.0 100.0 5 224 –
COM
PREH
ENSI
VE IN
FORM
ATIO
N
Hungarian Central Statistical O� ce, 2018 13
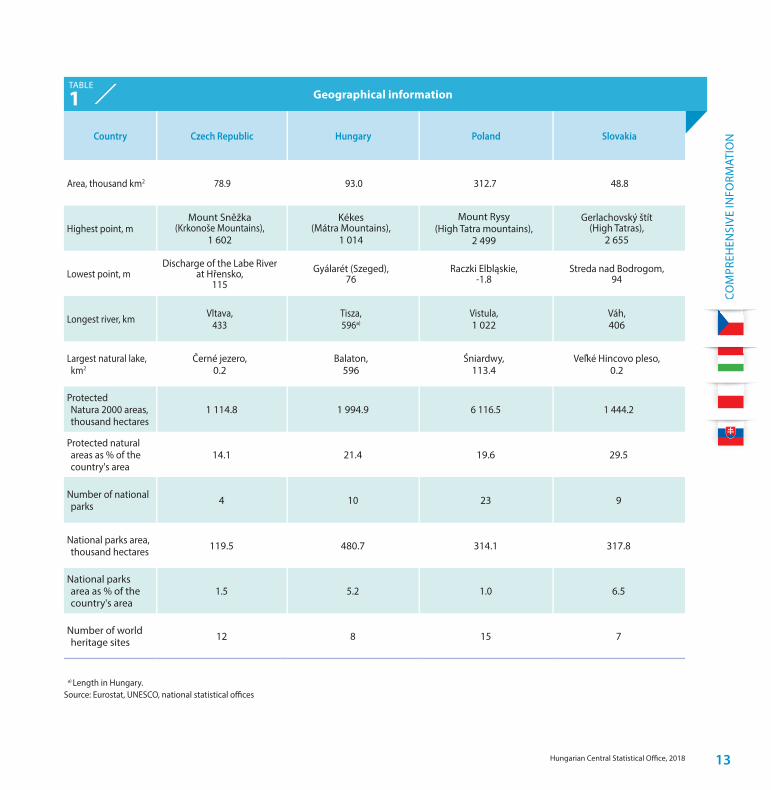
Geographical informationTABLE
1
Country Czech Republic Hungary Poland Slovakia
Area, thousand km2 78.9 93.0 312.7 48.8
Highest point, mMount Sněžka
(Krkonoše Mountains), 1 602
Kékes (Mátra Mountains),
1 014
Mount Rysy (High Tatra mountains),
2 499
Gerlachovský štít (High Tatras),
2 655
Lowest point, mDischarge of the Labe River
at Hřensko, 115
Gyálarét (Szeged), 76
Raczki Elbląskie, -1.8
Streda nad Bodrogom, 94
Longest river, km Vltava, 433
Tisza,596a)
Vistula, 1 022
Váh, 406
Largest natural lake, km2
Černé jezero, 0.2
Balaton, 596
Śniardwy, 113.4
Veľké Hincovo pleso, 0.2
Protected Natura 2000 areas, thousand hectares
1 114.8 1 994.9 6 116.5 1 444.2
Protected natural areas as % of the country's area
14.1 21.4 19.6 29.5
Number of national parks 4 10 23 9
National parks area, thousand hectares 119.5 480.7 314.1 317.8
National parks area as % of the country's area
1.5 5.2 1.0 6.5
Number of world heritage sites 12 8 15 7
a) Length in Hungary. Source: Eurostat, UNESCO, national statistical o� ces
COM
PREH
ENSI
VE IN
FORM
ATIO
N
Main indicators of the Visegrád Group countries14
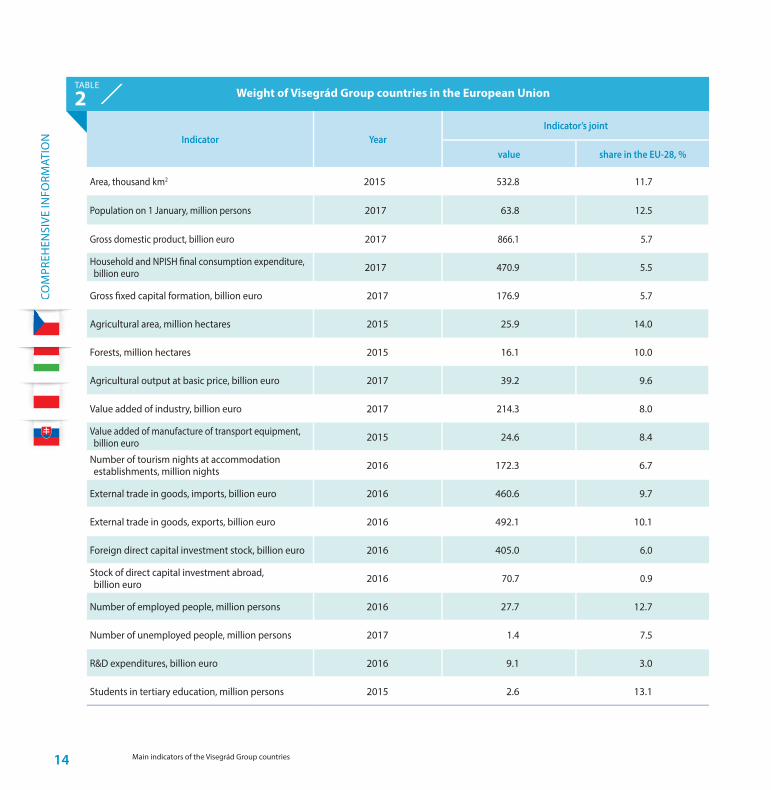
Weight of Visegrád Group countries in the European UnionTABLE
2
Indicator YearIndicator’s joint
value share in the EU-28, %
Area, thousand km2 2015 532.8 11.7
Population on 1 January, million persons 2017 63.8 12.5
Gross domestic product, billion euro 2017 866.1 5.7
Household and NPISH � nal consumption expenditure, billion euro 2017 470.9 5.5
Gross � xed capital formation, billion euro 2017 176.9 5.7
Agricultural area, million hectares 2015 25.9 14.0
Forests, million hectares 2015 16.1 10.0
Agricultural output at basic price, billion euro 2017 39.2 9.6
Value added of industry, billion euro 2017 214.3 8.0
Value added of manufacture of transport equipment, billion euro 2015 24.6 8.4
Number of tourism nights at accommodation establishments, million nights 2016 172.3 6.7
External trade in goods, imports, billion euro 2016 460.6 9.7
External trade in goods, exports, billion euro 2016 492.1 10.1
Foreign direct capital investment stock, billion euro 2016 405.0 6.0
Stock of direct capital investment abroad, billion euro 2016 70.7 0.9
Number of employed people, million persons 2016 27.7 12.7
Number of unemployed people, million persons 2017 1.4 7.5
R&D expenditures, billion euro 2016 9.1 3.0
Students in tertiary education, million persons 2015 2.6 13.1

Hungarian Central Statistical O� ce, 2018 15
POPULATION AND LIVING CONDITIONS
2
POPU
LATI
ON
AN
D L
IVIN
G C
ON
DIT
ION
S
Main indicators of the Visegrád Group countries16
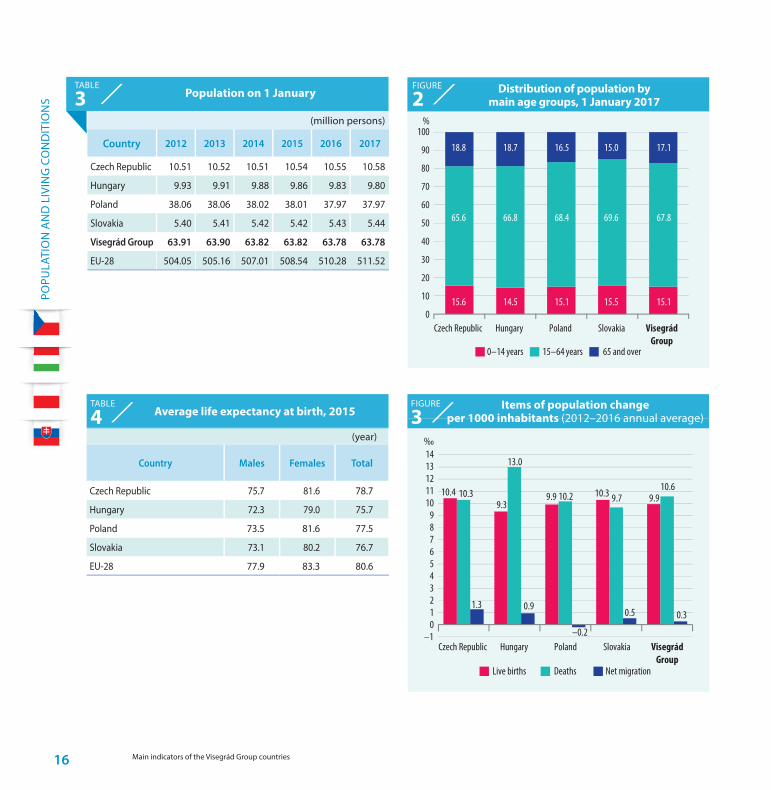
(year)
Country Males Females Total
Czech Republic 75.7 81.6 78.7
Hungary 72.3 79.0 75.7
Poland 73.5 81.6 77.5
Slovakia 73.1 80.2 76.7
EU-28 77.9 83.3 80.6
Czech Republic Hungary Poland Slovakia0
10
20
30
40
50
60
70
80
90
100%
15.6 14.5 15.1 15.5 15.1
65.6 66.8 68.4 69.6 67.8
18.8 18.7 16.5 15.0 17.1
VisegrádGroup
0–14 years 15–64 years 65 and over
Czech Republic Hungary Poland Slovakia VisegrádGroup
Live births Deaths Net migration
–10123456789
1011121314
‰
10.49.3
9.9 10.3 9.910.3
13.0
10.2 9.710.6
1.3 0.9
–0.2
0.5 0.3
Population on 1 JanuaryTABLE
3 Distribution of population by
main age groups, 1 January 2017
Items of population change per 1000 inhabitants (2012–2016 annual average)
FIGURE
2
Average life expectancy at birth, 2015TABLE
4 FIGURE
3
(million persons)
Country 2012 2013 2014 2015 2016 2017
Czech Republic 10.51 10.52 10.51 10.54 10.55 10.58
Hungary 9.93 9.91 9.88 9.86 9.83 9.80
Poland 38.06 38.06 38.02 38.01 37.97 37.97
Slovakia 5.40 5.41 5.42 5.42 5.43 5.44
Visegrád Group 63.91 63.90 63.82 63.82 63.78 63.78
EU-28 504.05 505.16 507.01 508.54 510.28 511.52
POPU
LATI
ON
AN
D L
IVIN
G C
ON
DIT
ION
S
Hungarian Central Statistical O� ce, 2018 17
Czech Republic Hungary Poland Slovakia VisegrádGroup
20162012
0
10
20
30
40
50
60
70
80%
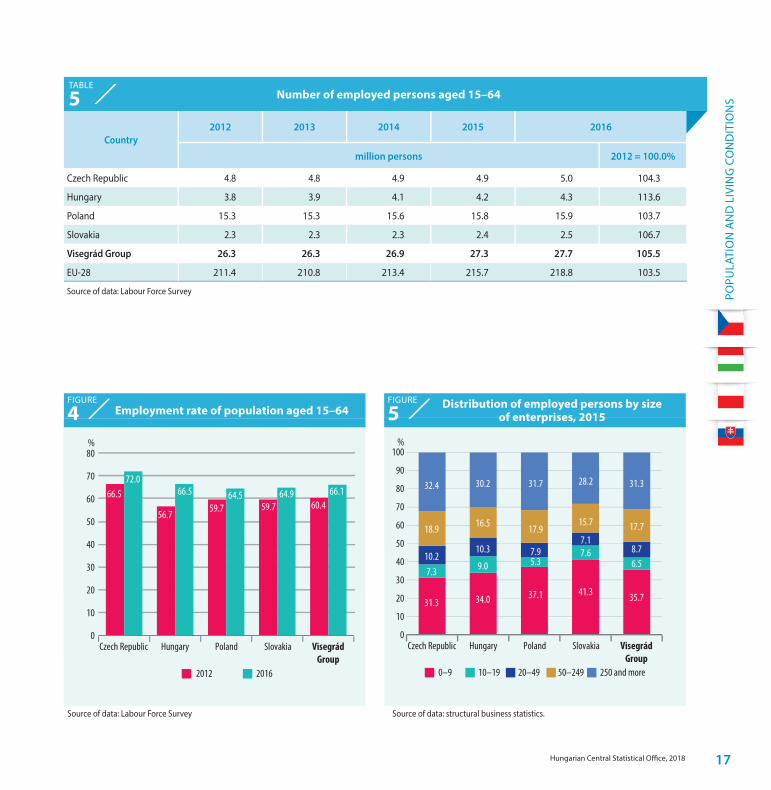
66.5
56.759.7 59.7 60.4
72.066.5 64.5 64.9 66.1
Czech Republic Hungary Poland Slovakia VisegrádGroup
10–19 20–49 50–249 250 and more0–9
0
10
20
30
40
50
60
70
80
90
100%
31.3 34.0 37.1 41.3 35.7
7.3 9.0 5.37.6
6.510.2
10.3 7.97.1
8.7
18.9 16.5 17.915.7 17.7
32.4 30.2 31.7 28.2 31.3
Number of employed persons aged 15–64 TABLE
5
Employment rate of population aged 15–64 Distribution of employed persons by size of enterprises, 2015
FIGURE
4 FIGURE
5
Country 2012 2013 2014 2015 2016
million persons 2012 = 100.0%
Czech Republic 4.8 4.8 4.9 4.9 5.0 104.3
Hungary 3.8 3.9 4.1 4.2 4.3 113.6
Poland 15.3 15.3 15.6 15.8 15.9 103.7
Slovakia 2.3 2.3 2.3 2.4 2.5 106.7
Visegrád Group 26.3 26.3 26.9 27.3 27.7 105.5
EU-28 211.4 210.8 213.4 215.7 218.8 103.5
Source of data: Labour Force Survey
Source of data: Labour Force Survey Source of data: structural business statistics.
POPU
LATI
ON
AN
D L
IVIN
G C
ON
DIT
ION
S
Main indicators of the Visegrád Group countries18
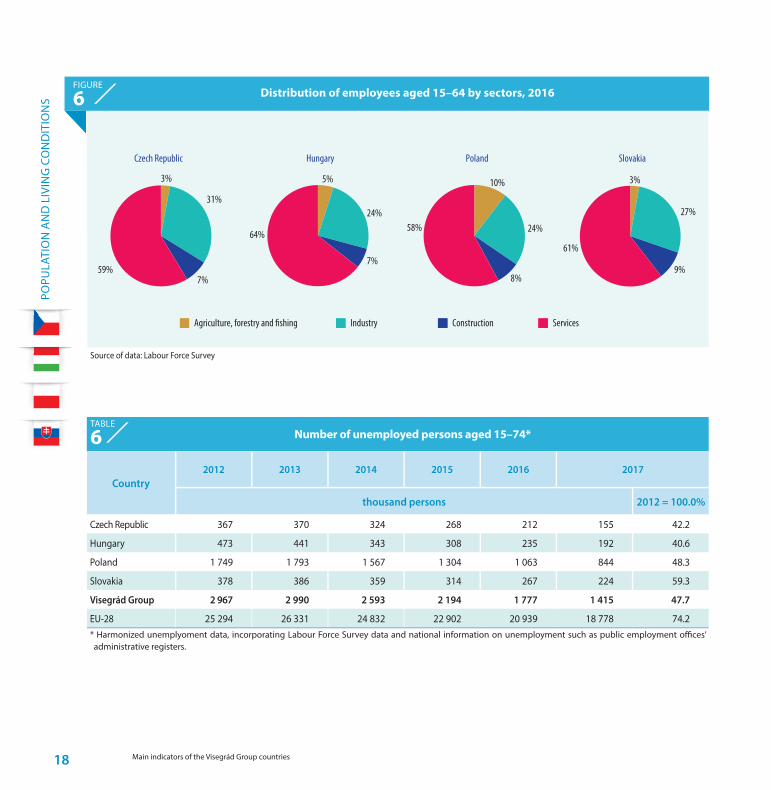
Czech Republic
Agriculture, forestry and �shing Industry Construction Services
Hungary Poland Slovakia
3%
59%
31%
7%
5%
24%
7%
64%
10%
24%
8%
58%
3%
27%
9%
61%
Distribution of employees aged 15–64 by sectors, 2016FIGURE
6
Number of unemployed persons aged 15–74*TABLE
6
Country2012 2013 2014 2015 2016 2017
thousand persons 2012 = 100.0%
Czech Republic 367 370 324 268 212 155 42.2
Hungary 473 441 343 308 235 192 40.6
Poland 1 749 1 793 1 567 1 304 1 063 844 48.3
Slovakia 378 386 359 314 267 224 59.3
Visegrád Group 2 967 2 990 2 593 2 194 1 777 1 415 47.7
EU-28 25 294 26 331 24 832 22 902 20 939 18 778 74.2* Harmonized unemplyoment data, incorporating Labour Force Survey data and national information on unemployment such as public employment o� ces’ administrative registers.
Source of data: Labour Force Survey
POPU
LATI
ON
AN
D L
IVIN
G C
ON
DIT
ION
S
Hungarian Central Statistical O� ce, 2018 19
02012 2013 2014 2015 2016
%
Czech Republic Hungary Poland Slovakia
40
50
60
70
80
Czech Republic Hungary Poland Slovakia
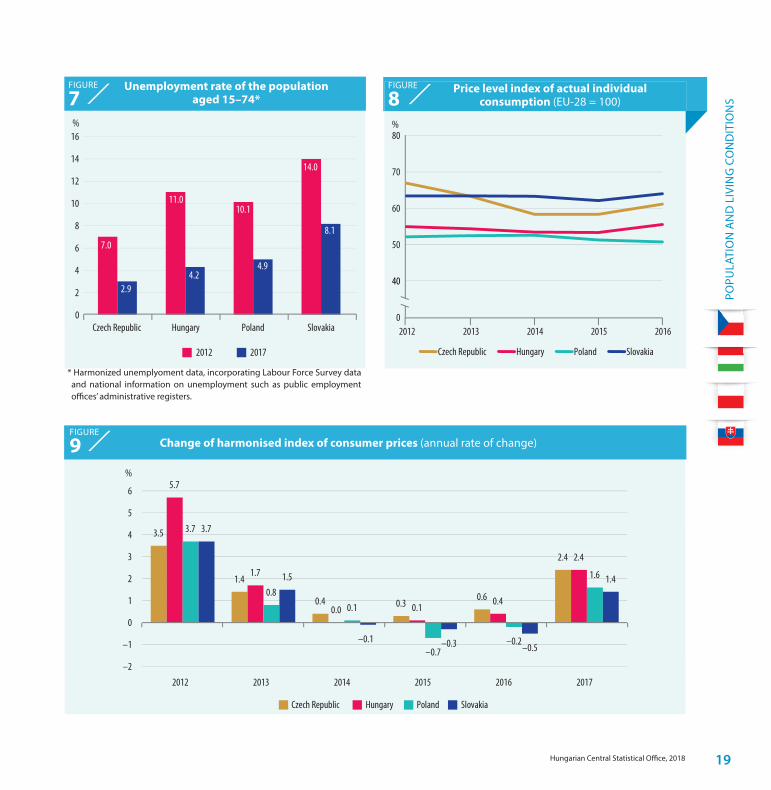
3.5
1.4
0.4 0.30.6
2.4
5.7
1.7
0.0 0.10.4
2.4
3.7
0.80.1
–0.7–0.2
1.6
3.7
1.5
–0.1 –0.3 –0.5
1.4
–2
–1
0
1
2
3
4
5
6
2012 2013 2014 2015 2016 2017
%
Unemployment rate of the population aged 15–74*
FIGURE
7 Price level index of actual individual
consumption (EU-28 = 100)FIGURE
8
2012 2017
Czech Republic Hungary Poland Slovakia0
2
4
6
8
10
12
14
16%
7.0
2.9
11.0
4.2
10.1
4.9
14.0
8.1
Change of harmonised index of consumer prices (annual rate of change)FIGURE
9
* Harmonized unemplyoment data, incorporating Labour Force Survey data and national information on unemployment such as public employment o� ces’ administrative registers.

POPU
LATI
ON
AN
D L
IVIN
G C
ON
DIT
ION
S
Main indicators of the Visegrád Group countries20
Country 2012 2013 2014 2015 2016
Czech Republic 73 76 78 78 78
Hungary 62 63 62 63 63
Poland 74 74 74 74 74
Slovakia 74 75 76 76 76
EU-28 100 100 100 100 100* Purchasing power parities (PPPs) are indicators of price level di� erences across
countries. PPPs tell us how many currency units a given quantity of goods and services costs in di� erent countries. PPPs can thus be used as currency conversion rates to convert expenditures expressed in national currencies into an arti� cial common currency, e.g. the Purchasing Power Standard, PPS), eliminating the e� ect of price level di� erences across countries.
Czech Republic Hungary Poland Slovakia Visegrád Group
–1.2
0.5
1.8
3.7 3.64.0
–2.3
0.2
2.8
3.6
4.34.7
0.70.3
2.43.0
3.9
4.7
–0.4–0.8
1.4
2.22.7
3.6
–0.1
0.2
2,2
3.13.8
4.5
–3
–2
–1
0
1
2
3
4
5
2012 2013 2014 2015 2016 2017
%
Volume of household � nal consumption expenditure (annual rate of change)FIGURE
10
Level of actual individual consumption per capita in purchasing power parity* (EU-28 = 100)
TABLE
7
Hungarian Central Statistical O� ce, 2018 21
EDUCATION AND RESEARCH
3

EDU
CAT
ION
AN
D R
ESEA
RCH
Main indicators of the Visegrád Group countries22
(thousand persons)
Country 2012 2013 2014 2015 2016
Czech Republic 440 427 419 396 ..
Hungary 381 359 330 308 295
Poland 2 007 1 903 1 763 1 665 1 600
Slovakia 221 210 198 184 ..
Visegrád Group 3 049 2 899 2 709 2 553 ..
EU-28 .. .. .. 19 531 ..
2012 2015
Czech Republic Hungary Poland Slovakia
%
VisegrádGroup
0
10
20
30
40
50
60
70
80
65.360.0
72.4
55.3
68.062.3
49.1
65.3
49.4
61.0
Czech Republic Hungary Poland Slovakia
Students
VisegrádGroup
2012 2015
0
5
10
15
20
25
30
25.2
15.7
19.8
17.219.5
23.9
14.617.1
14.4
17.3
Number of students in tertiary education
Proportion of students in tertiary education as % of the population aged 20–24
Number of students per lecturer in tertiary education
TABLE
8
FIGURE
12 FIGURE
13
12.6
23.2
16.1
15.0
16.5
68.0
56.9
60.0
66.1
61.4
19.4
20.0
23.9
19.0
22.1
0 20 40 60 80 100
CzechRepublic
Hungary
Poland
Slovakia
VisegrádGroup
%
Less than primary, primary and lower secondary education (ISCED level 0 –2)
Upper secondary and post-secondary non-tertiary education (ISCED level 3–4)
Tertiary education (ISCED level 5–8)
Population by educational attainment level, 2016 (15–74 year-olds)
FIGURE
11
Source: UNESCO.. = Data are not available.
EDU
CAT
ION
AN
D R
ESEA
RCH
Hungarian Central Statistical O� ce, 2018 23
61.2%
18.2%
20.5%
0.2%
Czech Republic
75.1%
13.6%
11.3%
Hungary
65.7%
2.5%
31.4%
0.4%
Poland
50.4%
21.4%
27.7%
0.5%
Slovakia
Business enterprise sector Government sector Higher education sector Private nonpro�t sector
Research and development expenditures as % of GDP
2012 2013 2014 2015 2016
%
Czech Republic Hungary Poland SlovakiaVisegrád Group
0.0
0.2
0.4
0.6
0.8
1.0
1.2
1.4
1.6
1.8
2.0
2.2Country 2012 2013 2014 2015 2016
Czech Republic 392 425 469 491 432
Hungary 220 249 254 271 238
Poland 159 158 177 201 197
Slovakia 162 169 188 263 178
Visegrád Group 207 217 238 265 240
EU-28 512 517 538 568 564
FIGURE
14 R&D expenditures per inhabitant, PPS*
Distribution of R&D expenditures by sectors, 2016
TABLE
9
FIGURE
15
* Purchasing Power Standards (PPS) are � ctive ’currency’ units that remove di� erences in purchasing power, i.e. di� erent price levels between countries. They are � xed in a way that makes the average purchasing power of one euro in the European Union equal to one PPS.
EDU
CAT
ION
AN
D R
ESEA
RCH
Main indicators of the Visegrád Group countries24
0 10 20 30 40 50 60 70
Czech Republic
Hungary
Poland
Slovakia
Visegrád Group
%
Agriculture, forestry and �shing
Manufacturing
Wholesale and retail trade; repair of motor vehicles and motorcycles
Information and communication
Professional, scienti�c and technical activities
0.3
2.3
56.4
51.514.8
16.2
20.5
19.5
5.3
1.9
0.5
0.3
0.8
45.6
67.4
51.9
7.6
1.4
6.8
18.9
12.9
18.0
18.5
16.1
15.9
Share of R&D business expenditures by main sections, 2014FIGURE
16
Hungarian Central Statistical O� ce, 2018 25
ECONOMIC ENVIRONMENT
4
ECO
NO
MIC
EN
VIRO
NM
ENT
Main indicators of the Visegrád Group countries26
Total business economy Manufacturing
Czech Republic Hungary Poland Slovakia0
10
20
30
40
50
60
70
80%
Visegrád Group
41.8
52.5
35.5
45.841.0
59.1
70.1
46.6
71.9
56.6
0 20 40 60 80 100
Czech Republic
Hungary
Poland
Slovakia
Visegrád Group
%
55.9
52.6
48.0
59.0
52.4
15.0
14.8
20.6
13.0
17.0
6.8
9.2
11.0
10.0
9.4
4.0
4.3
4.6
4.1
4.3
3.6
6.1
4.0
2.4
4.2
14.7
12.9
11.7
11.5
12.7
Manufacturing Wholesale and retail trade
Information and communication Professional, scienti�c and technical activities
Transportation and storage Other activities
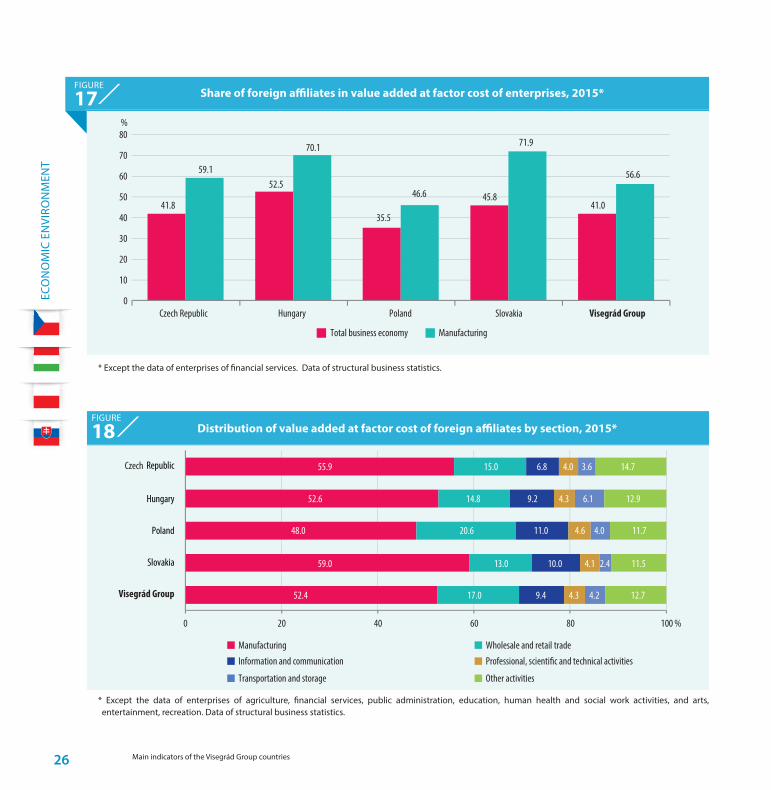
Share of foreign a� liates in value added at factor cost of enterprises, 2015*FIGURE
17
Distribution of value added at factor cost of foreign a� liates by section, 2015*FIGURE
18
* Except the data of enterprises of � nancial services. Data of structural business statistics.
* Except the data of enterprises of agriculture, � nancial services, public administration, education, human health and social work activities, and arts, entertainment, recreation. Data of structural business statistics.

ECO
NO
MIC
EN
VIRO
NM
ENT
Hungarian Central Statistical O� ce, 2018 27
2012 2013 2014 2015 2017
Czech Republic Hungary Poland Slovakia Visegrád Group
2016
–0.8 –0.5
2.7
5.3
2.6
4.4
–1.6
2.1
4.2
3.4
2.2
4.0
1.6 1.4
3.33.8
2.9
4.6
1.7 1.5
2.8
3.93.3 3.4
0.61.1
3.2
4.1
2.8
4.3
–2
–1
0
1
2
3
4
5
6%
Distribution of number of enterprises by number of employed persons, 2015*
Gross domestic product (GDP) per capita in purchasing power parity, as % of EU-28 average
2012 2016
Czech Republic Hungary Poland Slovakia0
10
20
30
40
50
60
70
80
90
100%
777668676766
8882
TABLE
10 FIGURE
19
Volume of gross domestic product (GDP) (annual rate of change)FIGURE
20
(%)
Country 0–9 10–19 20–49 50–249 250 and
more
employed persons
Czech Republic 96.0 1.9 1.2 0.7 0.2
Hungary 94.1 3.3 1.7 0.8 0.2
Poland 95.5 1.9 1.4 0.9 0.2
Slovakia 96.5 2.0 0.8 0.5 0.1
Visegrád Group 95.6 2.1 1.3 0.8 0.2
EU-28 92.8 3.8 2.1 1.0 0.2
* Data of structural business statistics.
ECO
NO
MIC
EN
VIRO
NM
ENT
Main indicators of the Visegrád Group countries28
%
43– 49
50– 59
60– 69
70– 79
80–184
Praha
Budapest
Bratislava
Warszawa
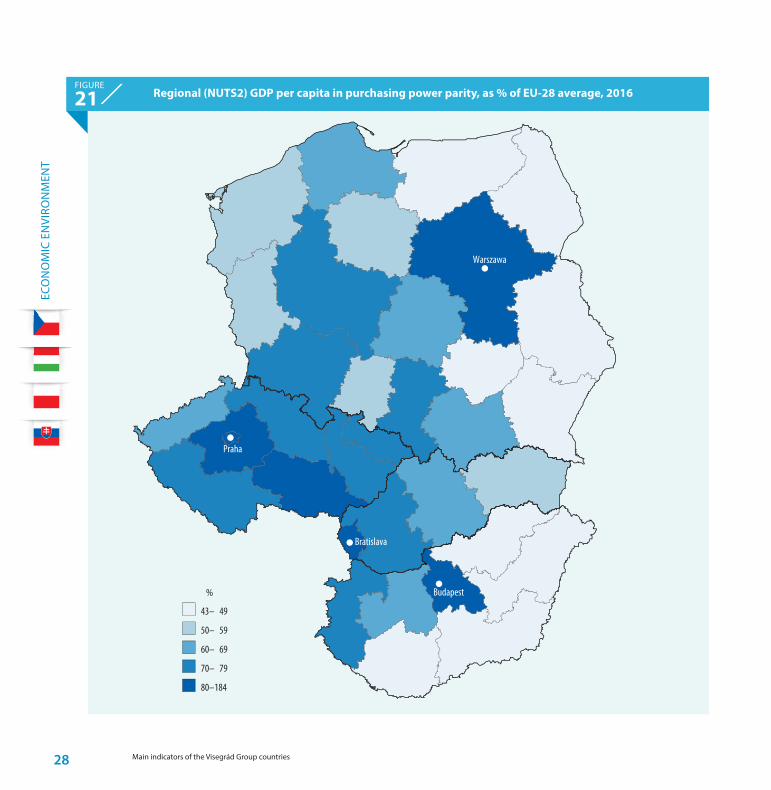
Regional (NUTS2) GDP per capita in purchasing power parity, as % of EU-28 average, 2016FIGURE
21
ECO
NO
MIC
EN
VIRO
NM
ENT
Hungarian Central Statistical O� ce, 2018 29
–15
–10
–5
0
5
10
15
20
25
2012 2013 2014 2015 2017
%
Czech Republic Hungary Poland Slovakia Visegrád Group2016
0
18
20
22
24
26
28
2012 2013 2014 2015 2016 2017
%
Czech Republic Hungary Poland
Slovakia Visegrád Group
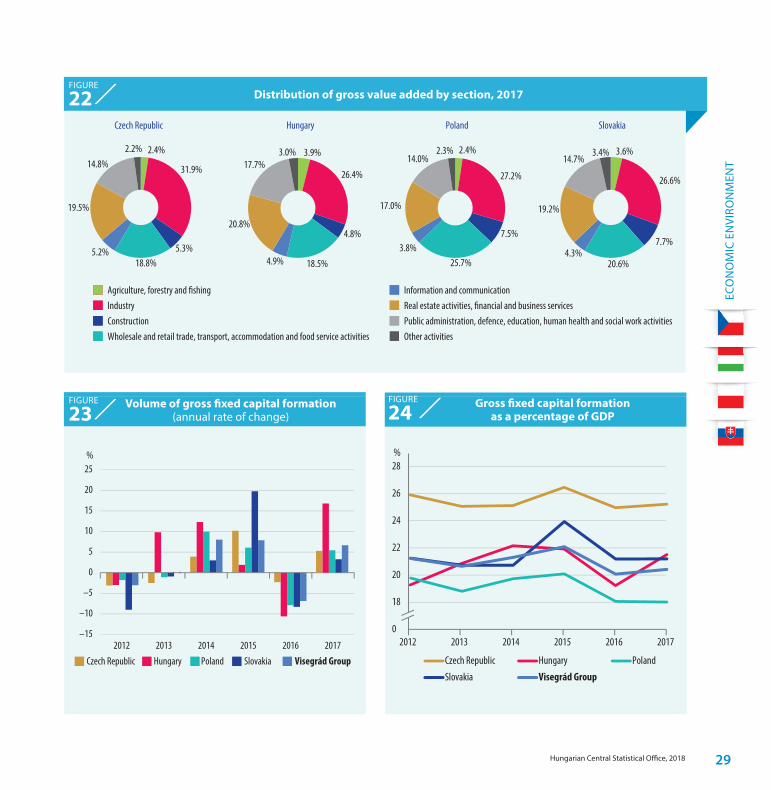
Distribution of gross value added by section, 2017
2.4%
31.9%
5.3%18.8%
5.2%
19.5%
14.8%2.2%
Czech Republic
Agriculture, forestry and �shingIndustryConstructionWholesale and retail trade, transport, accommodation and food service activities
Information and communicationReal estate activities, �nancial and business servicesPublic administration, defence, education, human health and social work activitiesOther activities
3.9%
26.4%
4.8%
18.5%4.9%
20.8%
17.7%3.0%
Hungary
2.4%
27.2%
7.5%
25.7%3.8%
17.0%
14.0%2.3%
Poland
3.6%
26.6%
7.7%
20.6%4.3%
19.2%
14.7%3.4%
Slovakia
FIGURE
22
Volume of gross � xed capital formation(annual rate of change)
Gross � xed capital formation as a percentage of GDP
FIGURE
23 FIGURE
24
ECO
NO
MIC
EN
VIRO
NM
ENT
Main indicators of the Visegrád Group countries30
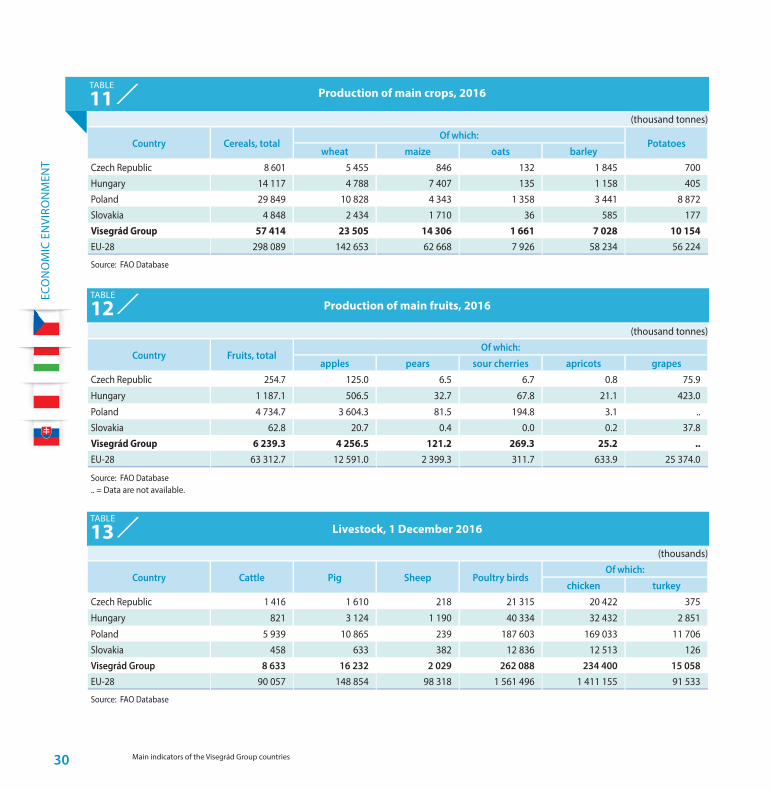
Production of main crops, 2016TABLE
11
Production of main fruits, 2016
Livestock, 1 December 2016
TABLE
12
TABLE
13
(thousand tonnes)
Country Cereals, totalOf which:
Potatoeswheat maize oats barley
Czech Republic 8 601 5 455 846 132 1 845 700Hungary 14 117 4 788 7 407 135 1 158 405Poland 29 849 10 828 4 343 1 358 3 441 8 872Slovakia 4 848 2 434 1 710 36 585 177Visegrád Group 57 414 23 505 14 306 1 661 7 028 10 154EU-28 298 089 142 653 62 668 7 926 58 234 56 224
Source: FAO Database
(thousand tonnes)
Country Fruits, totalOf which:
apples pears sour cherries apricots grapesCzech Republic 254.7 125.0 6.5 6.7 0.8 75.9
Hungary 1 187.1 506.5 32.7 67.8 21.1 423.0
Poland 4 734.7 3 604.3 81.5 194.8 3.1 ..Slovakia 62.8 20.7 0.4 0.0 0.2 37.8Visegrád Group 6 239.3 4 256.5 121.2 269.3 25.2 ..EU-28 63 312.7 12 591.0 2 399.3 311.7 633.9 25 374.0
Source: FAO Database.. = Data are not available.
(thousands)
Country Cattle Pig Sheep Poultry birdsOf which:
chicken turkeyCzech Republic 1 416 1 610 218 21 315 20 422 375
Hungary 821 3 124 1 190 40 334 32 432 2 851
Poland 5 939 10 865 239 187 603 169 033 11 706Slovakia 458 633 382 12 836 12 513 126Visegrád Group 8 633 16 232 2 029 262 088 234 400 15 058EU-28 90 057 148 854 98 318 1 561 496 1 411 155 91 533
Source: FAO Database

ECO
NO
MIC
EN
VIRO
NM
ENT
Hungarian Central Statistical O� ce, 2018 31
Volume of industrial production, calendar adjusted (annual rate of change)
Volume of retail trade turnover, calendar adjusted (annual rate of change)
Czech Republic Hungary Poland Slovakia
–2,0
0,0
2,0
4,0
6,0
8,0
2012 2013 2014 2015 2016 2017
–3
–2
–1
0
1
2
3
4
5
6
7
2012 2013 2014 2015 2016 2017
%
Czech Republic Hungary Poland Slovakia
FIGURE
25
FIGURE
28 Volume of production in construction,
calendar adjusted (annual rate of change)
–20
–15
–10
–5
0
5
10
15
20
25
30
35
2012 2013 2014 2015 2016 2017
%
Czech Republic Hungary Poland Slovakia
FIGURE
27
Czech Republic
Hungary
Poland
Slovakia
Visegrád Group
%20152012
0 5 10 15 20 25
19.6
14.8
10.3
17.7
14.3
21.5
21.0
10.6
19.6
15.9
Share of manufacture of transport equipment in gross value added of manufacturing*
FIGURE
26
* Data calculated from current prices.

Hungarian Central Statistical O� ce, 2018 33
EXTERNAL RELATIONS
5
EXTE
RNA
L RE
LATI
ON
S
Main indicators of the Visegrád Group countries34
Foreign direct capital investment stock, end of 2016*
TABLE
14
SlovakiaPoland
HungaryCzech Republic
118653
2 303
402386
2 335
1 924
1 293
389
882103 118
Czec
h Rep
ublic
Hung
ary
Polan
dSV
KFDI outwards within Visegrád Group countries, end of 2016*
(million euro)FIGURE
29
Country
Stock of direct capital investment abroad
Stock of foreign direct capital investment
million euro
percentage of GDP
million euro
percentage of GDP
Czech Republic 17 024 9.6 111 213 63.0
Hungary 23 390 20.6 75 781 66.6
Poland 27 753 6.5 176 552 41.4
Slovakia 2 515 3.1 41 497 51.1
Visegrád Group 70 682 8.9 405 042 50.8
EU-28 8 287 549 55.6 6 748 352 45.3
* Without special purpose entities.
* Without special purpose entities.

EXTE
RNA
L RE
LATI
ON
S
Hungarian Central Statistical O� ce, 2018 35
TABLE
15 Major partner countries based on FDI stock data, end of 2016*
Country Stock of direct capital investment abroad Stock of foreign direct capital investment
position partner country position partner country
Czech Republic 1st Netherlands 1st Netherlands
2nd Slovakia 2nd Germany
3rd Cyprus 3rd Luxembourg
4th Germany 4th Austria
5th Romania 5th France
Hungary 1st Belgium 1st Germany
2nd Israel 2nd Netherlands
3rd Cyprus 3rd Austria
4th Croatia 4th Switzerland
5th Slovakia 5th Luxemburg
Poland 1st Luxembourg 1st Netherlands
2nd Cyprus 2nd Germany
3rd Switzerland 3rd Luxembourg
4th Czech Republic 4th France
5th Netherlands 5th Spain
Slovakia 1st Czech Republic 1st Netherlands
2nd Netherlands 2nd Austria
3rd Austria 3rd Czech Republic
4th Luxembourg 4th Luxembourg
5th Cyprus 5th South Korea
* Without special purpose entities.In the database of Eurostat data of a relevant number of countries are con� dential. These were not taken into account in our calculations. In case of Hungary and Slovakia inclusion of con� dential data might cause signi� cant changes in the ranking of partners.

EXTE
RNA
L RE
LATI
ON
S
Main indicators of the Visegrád Group countries36
Czech Republic
Hung
ary
Polan
d
SlovakiaHUN
4666
531
172
209
1 778
1264
31 30
2319 27Slo
vakia
Poland
Czec
h Rep
ublic
FDI outwards within Visegrád Group countries in manufacturing, end of 2015*(million euro)
FIGURE
30
* Without special purpose entities.
EXTE
RNA
L RE
LATI
ON
S
Hungarian Central Statistical O� ce, 2018 37
Slovakia
Slova
kia
Poland
Polan
d
Hungary
Hung
ary
Czech Republic
Czec
h Rep
ublic
5 883
4 319
9 189
4 732
5 176
12 750
5 069
4 197
4 267
13 581
9 220
4 659
FIGURE
31 External trade in goods, 2016
(million USD)
Source: WITS - World Integrated Trade Solution Database (The World Bank).

EXTE
RNA
L RE
LATI
ON
S
Main indicators of the Visegrád Group countries38
Major partner countries in merchandise imports and exports, by country, 2016TABLE
16 Country Position Import partner Position Export partner
Czech Republic 1st Germany 1st Germany
2nd China 2nd Slovakia
3rd Poland 3rd Poland
4th Slovakia 4th United Kingdom
5th Italy 5th France
Hungary 1st Germany 1st Germany
2nd Austria 2nd Romania
3rd Poland 3rd Slovakia
4th Slovakia 4th France
5th China 5th Italy
Poland 1st Germany 1st Germany
2nd China 2nd United Kingdom
3rd Russia 3rd Czech Republic
4th Italy 4th France
5th France 5th Italy
Slovakia 1st Germany 1st Germany
2nd Czech Republic 2nd Czech Republic
3rd China 3rd Poland
4th Republic of Korea 4th France
5th Poland 5th United Kingdom
Source: WITS – World Integrated Trade Solution Database (The World Bank).

EXTE
RNA
L RE
LATI
ON
S
Hungarian Central Statistical Office, 2018 39
100
105
110
115
120
125
130
CzechRepublic
Hungary Poland Slovakia VisegrádGroup
%
Import Export
118.6 119.2118.4 118.4 118.6
117.4
113.5
126.3
113.5
119.2
Volume of external tradein goods, 2016 (2012=100.0)
Number of domestic and international guest-nights, 2016
FIGURE
32
TABLE
17
0
2
4
6
8
10
12
14
16
18
2012 2013 2014 2015
%
Czech Republic Hungary Poland Slovakia Visegrád Group
High-tech exports as a share of total exports
FIGURE
33
Country Domestic tourism nights, million
International guest-nights,
million
Of which nights spent by tourists from:
Czech Republic Hungary Poland Slovakia
as a percentage of international nights
Czech Republic 25.4 24.3 – 1.4 4.7 5.4
Hungary 15.5 13.8 5.9 – 5.0 3.2
Poland 63.8 15.6 1.4 1.0 – 1.0
Slovakia 8.9 5.0 33.2 3.8 8.9 –
EXTE
RNA
L RE
LATI
ON
S
Main indicators of the Visegrád Group countries40
0.0
0.5
1.0
1.5
2.0
2.5
3.0
3.5
4.0
4.5
5.0
CzechRepublic
Hungary Poland Slovakia VisegrádGroup
%
2012 2016
0.0
0.5
1.0
1.5
2.0
2.5
3.0
3.5
4.0
4.5
5.0
CzechRepublic
Hungary Poland Slovakia VisegrádGroup
%
2012 2016
3.64.0
2.22.5
2.83.2
4.5
2.3
3.1 2.9
2.2
1.51.8
2.31.9
2.5
1.7 1.7
2.5
2.0
Revenues
Expenditures
Tourism revenues and expenditures as a percentage of GDP*
FIGURE
34 Ranking of main partner countries based on guest-nights at tourist accommodation establishments, 2016
TABLE
18 Country Position Partner country
Czech Republic 1st Germany
2nd Russia
3rd Slovakia
4th USA
5th United Kingdom
Hungary 1st Germany
2nd United Kingdom
3rd Austria
4th Czech Republic
5th Poland
Poland 1st Germany
2nd United Kingdom
3rd Ukraine
4th USA
5th Italy
Slovakia 1st Czech Republic
2nd Germany
3rd Poland
4th Hungary
5th Ukraine
* Based on balance of payments data.
Hungarian Central Statistical O� ce, 2018 41
INFRASTRUCTURE
6
INFR
AST
RUC
TURE
Main indicators of the Visegrád Group countries42
Kilometre
02012 2013 2014 2015 2016
Czech Republic Hungary Poland Slovakia
200
400
600
800
1 000
1 200
1 400
1 600
1 800
0
5 000
10 000
15 000
20 000
25 000
Czech Republic Hungary Poland Slovakia
Kilometre
2012 2016
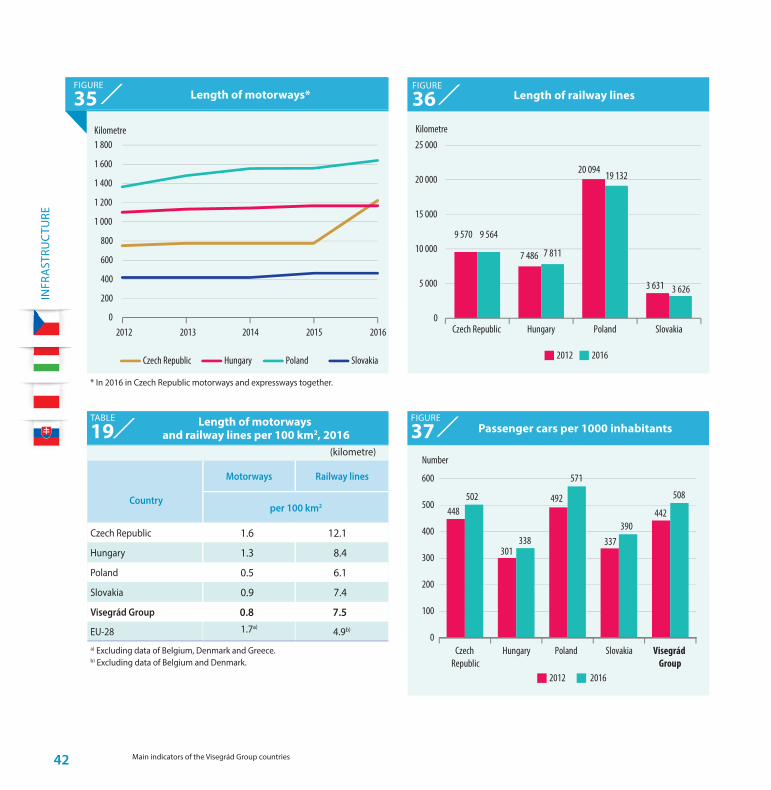
9 570
7 486
20 094
3 631
9 564
7 811
19 132
3 626
0
100
200
300
400
500
600
Czech Republic
Hungary Poland Slovakia Visegrád Group
Number
2012 2016
448
301
492
337
442
502
338
571
390
508
(kilometre)
Country
Motorways Railway lines
per 100 km2
Czech Republic 1.6 12.1
Hungary 1.3 8.4
Poland 0.5 6.1
Slovakia 0.9 7.4
Visegrád Group 0.8 7.5
EU-28 1.7a) 4.9b)
a) Excluding data of Belgium, Denmark and Greece.b) Excluding data of Belgium and Denmark.
Length of motorways*FIGURE
35 Length of railway lines
Length of motorways and railway lines per 100 km2, 2016 Passenger cars per 1000 inhabitants
FIGURE
36
TABLE
19 FIGURE
37
* In 2016 in Czech Republic motorways and expressways together.

INFR
AST
RUC
TURE
Hungarian Central Statistical O� ce, 2018 43
2012 2017
1815
21
30
20
34
26
33
46
33
0
5
10
15
20
25
30
35
40
45
50
Czech Republic
Hungary Poland Slovakia Visegrád Group
%
2012 2017
0
5
10
15
20
25
30
35
40
45
50
Czech Republic
Hungary Poland Slovakia Visegrád Group
%
30
42
32
42
34
46 47
31
47
37
Share of renewable energy in gross � nal energy consumption
Proportion of households with internet connection
0
8
10
12
14
16
18
2012 2013 2014 2015 2016
%
Czech Republic Hungary Poland Slovakia
7367
7075
71
83 82 82 81 82
0
10
20
30
40
50
60
70
80
90
CzechRepublic
Hungary
2012 2017
Poland Slovakia VisegrádGroup
%
FIGURE
38 FIGURE
39
Internet purchases by individuals in the last 3 months (percentage of individuals)
Interaction with public authorities in the last 12 months (percentage of individuals)
FIGURE
40 FIGURE
41
Hungarian Central
Statistical O� ce
www.ksh.hu
Czech Statistical O� ce
www.czso.cz
Statistics Poland
stat.gov.pl
Statistical O� ce
of the Slovak Republic
slovak.statistics.sk


