ARTICLE
Major groove width variations in RNA structures determinedby NMR and impact of 13C residual chemical shift anisotropyand 1H–13C residual dipolar coupling on refinement
Blanton S. Tolbert • Yasuyuki Miyazaki • Shawn Barton •
Benyam Kinde • Patrice Starck • Rashmi Singh •
Ad Bax • David A. Case • Michael F. Summers
Received: 6 April 2010 / Accepted: 20 April 2010 / Published online: 15 June 2010
� Springer Science+Business Media B.V. 2010
Abstract Ribonucleic acid structure determination by
NMR spectroscopy relies primarily on local structural
restraints provided by 1H–1H NOEs and J-couplings. When
employed loosely, these restraints are broadly compatible
with A- and B-like helical geometries and give rise to
calculated structures that are highly sensitive to the force
fields employed during refinement. A survey of recently
reported NMR structures reveals significant variations in
helical parameters, particularly the major groove width.
Although helical parameters observed in high-resolution
X-ray crystal structures of isolated A-form RNA helices are
sensitive to crystal packing effects, variations among the
published X-ray structures are significantly smaller than
those observed in NMR structures. Here we show that
restraints derived from aromatic 1H–13C residual dipolar
couplings (RDCs) and residual chemical shift anisotropies
(RCSAs) can overcome NMR restraint and force field
deficiencies and afford structures with helical properties
similar to those observed in high-resolution X-ray
structures.
Keywords NMR � RNA structure determination �Isotope labeling � Residual dipolar coupling �Residual chemical shift anisotropy
Introduction
Determination of ribonucleic acid structure by NMR
spectroscopy can be challenging for a number of reasons.
Limited 1H and 13C NMR chemical shift dispersion,
resulting from the presence of only four primary nucleo-
tides, can hinder signal assignments for RNAs of even
modest sizes. Although spectral resolution can be improved
through the use of multi-dimensional 13C editing, the aro-
matic 1H and 13C atoms critical for residue assignment and
structure analysis exhibit strong 1H–13C dipolar coupling in
larger RNAs, which can result in severely broadened
NMR signals. As such, the average size of the 298 RNA
NMR structures that have been deposited in the Nucleic
Acid Database (http://ndbserver.rutgers.edu/) to date is
only 25 nucleotides, and only 13 comprise more than 50
nucleotides.
An additional problem is that RNA structures solved by
NMR are often experimentally underdetermined. Limited
chemical shift dispersion of the 31P NMR signals generally
precludes quantitative determination of phosphodiester
torsion angles (although 31P chemical shifts are sometimes
Electronic supplementary material The online version of thisarticle (doi:10.1007/s10858-010-9424-x) contains supplementarymaterial, which is available to authorized users.
B. S. Tolbert � Y. Miyazaki � S. Barton � B. Kinde � P. Starck �R. Singh � M. F. Summers (&)
Howard Hughes Medical Institute and Department of Chemistry
and Biochemistry, University of Maryland Baltimore County,
1000 Hilltop Circle, Baltimore, MD 21250, USA
e-mail: [email protected]
Present Address:B. S. Tolbert
Department of Chemistry and Biochemistry, Miami University
of Ohio, Oxford, OH 45056, USA
A. Bax
Laboratory of Chemical Physics, NIDDK, National Institutes
of Health, Bethesda, MD 208992, USA
D. A. Case (&)
Department of Chemistry & Chemical Biology and BioMaPS
Institute, Rutgers University, 610 Taylor Road, Piscataway,
NJ 08854-8087, USA
e-mail: [email protected]
123
J Biomol NMR (2010) 47:205–219
DOI 10.1007/s10858-010-9424-x
used as a guide for applying model torsion angle restraints;
Allain and Varani 1997; Zhou et al. 2001; Lukavsky and
Puglisi 2005). Low overall proton density and few or no
NOEs between elements of secondary structure are also
problematic (Allain and Varani 1997; Lukavsky and
Puglisi 2005), and since the majority of NOE-derived
distance restraints typically involve protons in the major
groove, RNA structures generated with simple force fields
that lack electrostatic repulsion terms can exhibit unreal-
istically narrow major grooves (Rife et al. 1999; D’Souza
et al. 2004). In addition, because the intra- and inter-resi-
due NOE and torsion angle restraints are generally
employed loosely (i.e., with flat distance limit potentials),
they are usually broadly compatible with a wide range of
A- and B-like helical geometries. Although the use of loose
distance restraints works well for proteins, which have
packing interactions that give rise to extensive long-range1H–1H interaction networks, the distance uncertainties can
lead to propagation errors for helical segments with only
intra- and sequential-residue NOE restraints, and result in
structures that are highly sensitive to the empirical force
fields used during refinement (Rife et al. 1999; Zhou et al.
2001; D’Souza et al. 2004).
Orientation restraints derived from residual dipolar
couplings (RDCs) can lead to improvement in the local and
global precision of nucleic acid structures determined by
NMR (Bayer et al. 1999; Mollova et al. 2000; Tjandra et al.
2000; Trantirek et al. 2000; Al-Hashimi et al. 2001a;
Al-Hashimi et al. 2001b; Al-Hashimi et al. 2001c; Warren
and Moore 2001; Al-Hashimi et al. 2002; Al-Hashimi and
Patel 2002; Al-Hashimi et al. 2003; Lawrence et al. 2003;
Lukavsky et al. 2003; D’Souza et al. 2004; Stefl et al. 2004;
Walsh et al. 2004; Bax and Grishaev 2005; Lukavsky and
Puglisi 2005; Walsh and Wang 2005; Al-Hashimi 2007;
Wang et al. 2007; Ying et al. 2007; Al-Hashimi and Walter
2008; Latham et al. 2008; Zhang and Al-Hashimi 2008;
Zuo et al. 2008; Fisher and Al-Hashimi 2009; Frank et al.
2009), and have been used to establish static and dynamic
inter-helical orientations, as well as local structure
(Mollova et al. 2000; Lukavsky et al. 2003; D’Souza et al.
2004; Davis et al. 2005; Staple and Butcher 2005; Zhang
et al. 2006; Skrisovska et al. 2007; Ying et al. 2007; Zhang
et al. 2007; Kim et al. 2008). Although structures generated
with RDC restraints typically exhibit improved conver-
gence, it has been difficult to quantitatively assess struc-
tural accuracy because X-ray crystal structures of isolated
RNA helices are sensitive to crystal packing effects. For
example, a 17-base RNA was shown to adopt four distinct
sequence-independent but lattice-dependent conformations
in a single crystal (Shah and Brunger 1999), in which the
major goove widths (reported here as the mean distance
between the phosphate P atoms of the (i) and (i?6) base
pairs; dP-P) ranged from 9.4 to 13.8 A.
Although quantitative comparison of individual RNA
NMR and X-ray structures is problematic (Zhou et al.
2001), trends in published X-ray structures exist that have
allowed us to qualitatively assess structures calculated
using NMR-derived restraints. One notable observation is
that the major groove widths of NMR structures reported
for A-form helical RNAs are often well outside the ranges
expected on the basis of high-resolution X-ray crystal
structures. Here we show that aromatic 1H–13C RDC and13C residual chemical shift anisotropy (RCSA) restraints,
measured using high sensitivity 1H–13C ‘‘individual mul-
tiplet component’’ (IMC) experiments, can overcome
restraint deficiencies associated with traditional NMR
methods, as well as force field deficiencies, and afford
structures with helical properties consistent with those
observed in the surveyed X-ray crystal structures.
Results and discussion
Major groove width variations in NMR and X-ray
structures
Helical properties (measured with the program 3DNA
(Lu and Olson 2008)) and mean dP-P distances (the
average dP-P distance measured for a given helical seg-
ment using pymol (DeLano 2002)) of six high resolution
X-ray crystal structures that contain only standard
Watson–Crick (WC) base pairs (resolution \2.5 A), and
of helical segments from the 2.4 A structure of the 50S
ribosomal subunit that only contain WC base pairs and
no long-range base interactions, are summarized in
Table 1 (see also Fig. 1). The X-ray structures exhibit
mean dP-P distances in the range of 8.8 A (NDB ID
157D) to 12.6 A (NDB 433D), with an average mean
dP-P of 11.1 ± 2.2 A. Major groove widths of 25 addi-
tional isolated helices that contain non-canonical base
pairs and bulges, refined to high resolution by X-ray
crystallography, have similar major groove widths (Fig. 1
and Supplementary Table S1). Cross-helix dP-P distances
were also measured for 72 A-form helical segments in
NMR-derived RNA structures deposited in the RSCB
Structure Databank from 2005 through 2009 (Supple-
mentary Table S2). The NMR structures exhibit mean
dP-P distances in the range of 7.4 A (NDB 2K66) to 28.6
A (NDB 2H2X), with the average mean dP-P distance
being 15.7 ± 4.7 A (Fig. 1 and Table 1). The average,
range, and maximum mean dP-P values are significantly
greater than those observed in the X-ray structures
examined. We were unable to identify correlations
between dP-P values and the software package or type of
experimental restraints employed that would explain the
large variations among the NMR structures.
206 J Biomol NMR (2010) 47:205–219
123
Table 1 Helical parameters for representative high-resolution X-ray structures and ensembles of calculated [DIS]2 NMR structures
dP-P Shift Slide Rise Tilt Roll Twist Propeller
X-ray structures (resolution)
157Da (1.8) 8.8 ± 0.6 0.00 ± 0.6 -1.4 ± 0.3 3.3 ± 0.2 0.0 ± 4.2 10.1 ± 2.4 31.7 ± 5.7 -15.5 ± 6.7
1RNAb (2.25) 9.5 ± 1.6 0.0 ± 0.4 -1.3 ± 0.2 3.2 ± 0.3 -1.1 ± 3.6 9.7 ± 5.0 31.7 ± 4.6 -19.3 ± 3.7
1QC0c (1.55) 10.6 ± 1.6 0.0 ± 0.4 -1.7 ± 0.5 3.2 ± 0.2 0.1 ± 1.9 8.0 ± 3.8 29.0 ± 10.8 -12.2 ± 3.4
1QCUc (1.2) 10.4 ± 1.1 0.0 ± 0.2 -0.7 ± 0.8 1.5 ± 1.6 8.5 ± 3.9 4.8 ± 4.4 21.1 ± 29.9 -14.3 ± 2.3
405Dd (2.5) 10.7 ± 1.6 0.0 ± 0.3 -1.5 ± 0.2 3.3 ± 0.2 0.2 ± 2.1 9.5 ± 4.7 31.6 ± 5.8 -10.4 ± 4.4
433De (2.1) 12.6 ± 0.9 0.1 ± 0.9 -1.7 ± 0.4 3.2 ± 0.2 0.2 ± 4.0 7.0 ± 4.0 31.1 ± 6.9 -9.6 ± 5.3
Ribosomef (2.4) 11.1 ± 2.4 0.0 ± 0.5 -1.6 ± 0.5 3.2 ± 0.2 0.4 ± 2.8 8.4 ± 4.7 31.5 ± 8.9 -8.0 ± 9.2
Mean ± SDg 11.1 ± 2.2 0.0 ± 0.6 -1.6 ± 0.5 3.2 ± 0.2 0.1 ± 2.8 8.2 ± 4.4 30.9 ± 9.0 -12.7 ± 3.9
[DIS]2
Nucgen (Bansal et al. 1995) 10.0 ± 0.0 0.0 ± 0.0 -1.8 ± 0.0 3.4 ± 0.0 0.0 ± 0.1 8.9 ± 0.2 31.4 ± 0.9 13.7 ± 0.0
Nucgen?Amber 14.7± 0.2 0.0 ± 0.1 -1.7 ± 0.1 3.3 ± 0.1 0.0 ± 1.1 6.2 ± 4.0 30.3 ± 2.1 -13.7 ± 1.2
Cyana
NOE 6.6 ± 1.2 0.0 ± 0.2 -1.2 ± 0.2 3.5 ± 0.1 0.0 ± 0.9 16.1 ± 4.3 30.3 ± 1.3 -9.9 ± 3.2
NOE?RDC 12.5 ± 0.5 0.0 ± 0.2 -1.3 ± 0.2 3.3 ± 0.4 0.1 ± 2.4 10.0 ± 7.6 31.6 ± 1.6 -12.1 ± 5.6
Amber
No exper restrh 13.9 ± 0.3 0.0 ± 0.1 -1.9 ± 0.2 3.3 ± 0.1 0.0 ± 1.6 7.0 ± 3.2 29.7 ± 1.9 -10.6 ± 1.6
NOE 13.6 ± 0.3 0.0 ± 0.1 -1.9 ± 0.1 3.3 ± 0.1 0.0 ± 1.2 7.6 ± 3.6 30.7 ± 1.8 -11.8 ± 2.0
NOE?RDCi 12.1 ± 0.3 0.0 ± 0.2 -1.8 ± 0.1 3.2 ± 0.2 0.0 ± 2.4 8.7 ± 5.7 31.1 ± 2.0 -15.0 ± 5.4
NOE?RCSAj 11.6 ± 0.1 0.0 ± 0.1 -1.9 ± 0.1 3.3 ± 0.1 0.0 ± 0.6 6.7 ± 4.3 30.8 ± 1.7 -11.6 ± 2.6
NOE?RDC?RCSAk 11.2 ± 0.2 0.0 ± 0.2 -1.7 ± 0.2 3.3 ± 0.2 0.0 ± 1.7 10.2 ± 4.9 30.9 ± 2.7 -18.1 ± 5.2
10% Eelecl
No exper restrh 4.6 ± 0.3 0.0 ± 0.1 -1.6 ± 0.2 3.2 ± 0.1 0.0 ± 1.3 15.2 ± 4.0 30.9 ± 3.4 -16.4 ± 2.8
NOE 4.5 ± 0.2 0.0 ± 0.1 -1.6 ± 0.1 3.2 ± 0.1 0.0 ± 1.1 14.7 ± 3.7 31.2 ± 2.9 -15.8 ± 2.8
NOE?RDCi 10.8 ± 0.2 0.0 ± 0.2 -1.6 ± 0.1 3.2 ± 0.2 0.0 ± 2.5 8.9 ± 4.4 31.6 ± 2.5 -18.5 ± 5.5
NOE?RCSAj 10.7 ± 0.2 0.0 ± 0.1 -1.7 ± 0.1 3.2 ± 0.1 0.0 ± 1.0 8.1 ± 2.7 31.9 ± 1.8 -17.6 ± 4.0
NOE?RDC?RCSAk 9.7 ± 0.3 0.0 ± 0.2 -1.5 ± 0.2 3.2 ± 0.2 0.0 ± 2.3 10.4 ± 3.7 31.8 ± 3.2 -21.5 ± 5.7
200% Eelecm
No exper restrh 16.3 ± 0.9 0.0 ± 0.3 -2.0 ± 0.3 3.5 ± 0.1 0.0 ± 2.5 7.4 ± 4.9 28.8 ± 2.3 -9.0 ± 4.2
NOE 14.4 ± 1.1 0.0 ± 0.2 -1.9 ± 0.2 3.4 ± 0.1 0.0 ± 1.4 8.7 ± 4.5 30.4 ± 2.3 -9.2 ± 2.8
NOE?RDC?RCSAk 12.4 ± 1.0 0.0 ± 0.2 -1.5 ± 0.2 3.2 ± 0.2 0.0 ± 2.3 10.3 ± 3.7 31.8 ± 2.9 -21.6 ± 5.4
dP-P (distance between the P atom of residue (i) and the cross-strand P atom of base pair (i?6)) and all other helical parameters measured with
pymol (DeLano 2002) and 3DNA (Lu and Olson 2008), respectively; reported as mean ± std. deva Leonard et al. (1994)b Dock-Bregeon et al. (1989)c Klosterman et al. (1999)d Pan et al. (1998)e Trikha et al. (1999)f Calculated for seven A-form helical segments extracted from the 50S ribosome structure that exclusively contain Watson-Crick base pairs: (H1r12–21:r522–531, H2 r539–548:r608–617, H3 r646–658:r747–759, H4 r780–788:r858–866, H5 r1045–1054:r1060–1069, H6 r1138–
1147:r1216–1225, H7 r2381–2389:r2399–2407; Klein et al. (2004)g Statistics generated using all individual dP-P and base step measurementsh Cyana structures minimized using the GB force field with only chirality and H-bond restraintsi RDCs used as restraints for simultaneous calculation of structure and alignment tensorj Structures calculated using a fixed alignment tensor derived from the NOE?RDC?RCSA calculationsk RDCs and RCSAs used as restraints for simultaneous calculation of structure and alignment tensorl Electrostatic term (Eelec) in the Amber force field reduced to 10% of the standard valuem Eelec increased to 200% of the standard value
J Biomol NMR (2010) 47:205–219 207
123
Measurement of 1H–13C RDCs and 13C RCSAs
Orientation information derived from RDCs and RCSAs
offer a potential means for assessing and refining RNA
structures, but the measurement of these values for larger
RNAs can be problematic. The downfield components of
the 13C-{1H} multiplet have relatively long relaxation
times due to interference between the 13C chemical shift
anisotropy (CSA) and heteronuclear dipolar relaxation
mechanisms (Werbelow and Grant 1977; Gueron et al.
1983; the TROSY (Tr) effect (Pervushin et al. 1997)), and
can be readily detected even for larger RNAs. However,
the upfield anti-TROSY (anti-Tr) components exhibit more
rapid T2 relaxation, a problem that is exacerbated for
aromatic groups due to the strong 1H–13C dipolar interac-
tion (Brutscher et al. 1998) to the extent of precluding RDC
measurement (D’Souza et al. 2004). We implemented an
approach that involves measurement of only the Tr-(13C)
component (Grishaev et al. 2006). The 13C frequency shift
of this component that occurs upon partial molecular
alignment (induced by the presence of alignment media
such as Pf1 phage (Hansen et al. 1998)) results from a
combination of RDC and residual chemical shift anisotropy
(RCSA) and is referred to as the residual pseudo-chemical
shift anisotropy, or RPCSA. RPCSAs can be used directly
as refinement restraints (Grishaev et al. 2006), but their
values can result from significantly different combinations
Fig. 2 a 1H–13C IMC pulse sequence used for selective observation
of the Tr(1H)–Tr(13C) component of purine and pyrimidine aromatic1H–13C multiplets. Decoupling during the evolution period (incre-
mented at Dt) is achieved using broad band hyperbolic secant (a1.33 ms; 13.5 kHz bandwidth) and selective IBURP (Green and
Freeman 1991; b 2.67 ms, 1.69 kHz bandwidth; c 1.33 m, 3.37 kHz
bandwidth) inversion pulses; s = 1/4 J = 1.2 ms. Phases for collec-
tion of the Tr(1H)–Tr(13C) component are: /0,7 = x, /1,5 = y,
/2 = x,x,-x,-x; /3 = x,y; /4 = y; /6 = -x; /8 = x,-x,-x,x.
/7 was empirically adjusted (-38� in all experiments) to balance
the effect of differential relaxation rates of single and multiple
quantum coherence. Other components are collected using the
following phases: anti-Tr(1H-)–Tr(13C): /7 = -x; Tr(1H)-anti-
Tr(13C): /1,4 = -y; anti-Tr(1H)-anti-Tr(13C): /7 = -x; /1,4 = -y.
Echo-Antiecho quadrature detection is achieved by incrementing the
phase /7 and /8 by 180 degrees and reversing the signs of gradients 2
and 3. The selective 1H IBURP pulse was only used for detection of
pyrimidine C5–H5 and C6–H6 signals, and was centered at the non-
observed aromatic proton frequency. Relative pulsed field gradient
(PFG) strengths (sine shapes): G0, 500 ls, 31%; G1, 400 ls, 41%; G2
200 ls, 50%; G3, 200 ls, -50%; G4, 100 ls, 50%. b Nucleotide
sequence and secondary structure of [DIS]2. c Portions of the RPCSA
(blue, black) and Tr(13C)–Tr(1H) IMC (red, green) spectra obtained
for [A,G(13C)-DIS]2 in the absence (blue, green) and presence (black,red) of Pf1 phage. Inset Relationship between RDC and RPCSA
Fig. 1 Plots showing mean dP-P distances (average of the cross-major
groove distances between the P atoms of base pairs (i) and (i?6)) of
X-ray and NMR structures deposited in the RNA structure database.
a X-ray structures (\2.5 A resolution) of unmodified, A-form helical
RNAs, including those with non-canonical base pairs (Table 1 and
Suppl. Table S1), b NMR structures of A-form helical RNAs
deposited from 2005 through 2009 (Suppl. Table S2)
208 J Biomol NMR (2010) 47:205–219
123
of RDCs and RCSAs (Bryce et al. 2005; Grishaev et al.
2006), and it is therefore advantageous to employ the
actual RCSA and RDC values as restraints for structure
refinement.
RDCs were determined by measuring the frequency
differences observed in spectra obtained using 13C-decou-
pled RPCSA (Grishaev et al. 2006; Ying et al. 2006) and
Individual Multiplet Component (IMC) experiments. IMC
spectra were obtained using the protocol of Andersson
et al. (Andersson et al. 1998), optimized for detection of1H–13C correlations in the nucleobases of uniformly 13C
enriched nucleic acids (Grishaev et al. 2006; Ying et al.
2006), and including the use of field gradients for coher-
ence selection (Fig. 2a). As discussed by Andersson et al.
for backbone amide signals in proteins, recording sepa-
rately the signals for the four combinations of /4 = ±y
and /7 = ±x, these signals can be combined post acqui-
sition to yield spectra displaying any one of the four1H–15N two-dimensional doublet components (Andersson
et al. 1998). For the application to 13C, where the Boltz-
mann component of 13C magnetization and the component
transferred from the base 1H are comparable in magnitude,
we find it beneficial to record the TROSY and anti-TROSY13C-{1H} doublet components separately, with the /1
phase adjusted such that the Boltzmann 13C magnetization
adds to the selected 13C-{1H} doublet component. Indi-
vidual multiplet components are selected using appropriate
phase cycling combinations given in the Fig. 2 caption.1H–13C RDCs and 13C RPCSAs were measured for a
13C-isotopically labeled 60 nt RNA duplex corresponding
to the dimer initiation site of the Moloney Murine Leuke-
mia Virus (MLV; [DIS]2; Fig. 2b). Representative Tr(1H)-
Tr(13C)-IMC and RPCSA spectra obtained for samples
prepared in the presence and absence of Pf1 phage are
shown in Fig. 2c. RCSA values were calculated using the
relationship: RCSA = RPCSA - � RDC. Although the
RDC value could be measured from the shift in the 1H
dimension of the TROSY component alone (as a function
of added phage), in practice it is better to use the 13C-
decoupled RPCSA spectra as a reference since the 1H
NMR chemical shifts are sometimes slightly affected by
the presence of alignment media. Under the experimental
conditions employed (16 mg/ml Pf1 phage), RDC and
RCSA values clustered in the range of 28.4 to 49.4 Hz and
-136.6 to -262.6 ppb, respectively (Supplementary Table
S3).
Influence of the force field and NOE restraints on RNA
structure refinement
2D NOESY and TOCSY cross peak patterns and intensities
observed for self-complementary residues C283–G298
of [DIS]2 were consistent with an A-form helical
conformation (Wuthrich 1986; D’Souza et al. 2001).
Moderate-to-strong intensity H10-to-H20 TOCSY cross
peaks observed for residues G276–A282 and C299–A305
indicate that these residues partially populate a C2’-endo
conformation. Since all but two of these residues partici-
pate in non-canonical base pairing, and because 13C CSA
tensors have only been determined for nucleotides in
standard Watson-Crick base pairs (Hansen and Al-Hashimi
2006; Ying et al. 2006), G276–A282 and C299–A305 were
not included in the following structural analysis.
[DIS]2 structures were generated initially with Cyana
(Guntert et al. 1997) using conservative NOE-derived
distance restraints (see ‘‘Experimental’’ section). H-bond
restraints based on NOE cross peak patterns observed for
samples in D2O and 90% H2O/10% D2O solutions, and
loose torsion angle restraints (flat potential bounds of
±50�) centered around A-form values (but wide enough to
allow B-like geometries; a = -62�, b = 180�, c = 48�,
d = 83�, e = -152�, f = -73�; Saenger 1984) were
employed during the Cyana calculations (but not the sub-
sequent Amber (Case et al. 2005) calculations; see below).
A total of 20 [DIS]2 structures with lowest target func-
tions was selected from an ensemble of 200 initial struc-
tures for analysis and refinement (Fig. 3a and Table 2).
The helical properties of the Cyana structures were gen-
erally consistent with those expected for A-form helices,
except that the cross-helix dP-P distances were smaller than
expected (mean dP-P = 6.6 ± 1.2 A) and the Roll values
were relatively large (16.1 ± 4.3�; Table 1). This is due to
the fact that all but a few of the NOE-derived distance
restraints involve protons in the major groove of the RNA,
which in the absence of inter-phosphate repulsion terms
Fig. 3 a Superposition of 20 [DIS]2 Cyana structures, from 200 total,
generated using loose NOE, hydrogen bond, and backbone torsion
angle restraints. b–d MD simulations with Amber using NOE-derived
distance, hydrogen bond, and planarity/chirality restraints (trajectory
snapshots for MD simulations conducted at 0 and 300 K are shown in
b and c, respectively) result in an expansion of the major groove, with
dP-P distances (dashed arrows) increasing from 6.6 ± 1.2 A to
13.6 ± 0.3 A. d Superposition of Cyana structures after refinement
with Amber using only chirality and H-bond restraints (by minimi-
zation (blue) or annealing followed by minimization (green)) and
upon inclusion of NOE-derived distance restraints (red)
J Biomol NMR (2010) 47:205–219 209
123
statistically biases the major groove protons toward a more
collapsed structure (Rife et al. 1999; D’Souza et al. 2004).
The Cyana structures were then subjected to minimiza-
tion with Amber (Case et al. 2005). In one calculation, the
Amber force field (ff99 with Generalized Born (GB) solvent
continuum parameters) was employed, along with loose
hydrogen bond restraints to prevent fraying in subsequent
high-temperature MD simulations and tight covalent
geometry (chirality) restraints to prevent distortion of
covalent bond geometries that can occur during restrained
MD simulations. In a second calculation, the NOE-derived1H–1H distance restraints were included. Minimization by
MD simulation at 0 K using only the Amber force field
resulted in a significant expansion of the major groove, with
dP-P values increasing from 6.6 ± 1.2 A to 13.9 ± 0.3 A
and the Roll between base pairs decreased from 16.1 ± 4.3�to 7.0 ± 4.2� (Table 1 and Fig. 3b, d). Essentially identical
results were obtained when minimizations were performed
Table 2 NMR Restraints and Structure Statistics
Cyanaa
NOE-derived restraints
Intraresidue 160
Sequential 122
Long range (|i - j| [ 1) 21
H-bond restraintsb 152
NOE restraints/residue 14.0
Total restraints/residue 23.4
Target funct. (A2)c 0.025 ± 0.000
Upper dist. viol. (A)c 0.005 ± 0.000
Lower dist. viol. (A)c 0.001 ± 0.000
Sum VDW viol. (A)c 0.05 ± 0.00
RMSD (A)d 2.72 ± 0.32
Ambere No exper restraints NOE NOE?RDCf NOE?RCSAg NOE?RDCf ?RCSAg
AMB energy -6,826.7 (1.1) -6,827.7 (1.5) -6,810.8 (2.2) -6,825.7 (1.5) -6,796.7 (1.1)
Distance NA 1.59 (0.56) 2.58 (1.21) 1.96 (1.19) 3.68 (1.19)
Torsion NA 0.22 (0.01) 1.19 (0.02) 1.31 (0.03) 6.67 (0.03)
RDC NA NA 2.62 (0.06) NA 5.61 (0.11)
RCSA NA NA NA 15.30 (0.58) 19.00 (0.27)
RMSD (A)h 0.15 0.15 0.12 0.12 0.11
10% Eeleci
AMB energy -342.0 (4.8) -341.6 (0.2) -323.4 (0.2) -326.6 (0.3) -324.1 (0.2)
Distance 8.07 (0.30) 8.80 (0.03) 10.12 (0.08) 8.53 (0.08) 12.78 (0.08)
Torsion 0.15 (0.01) 0.17 (0.01) 0.84 (0.02) 2.11 (0.05) 6.45 (0.04)
RDC NA NA 1.49 (0.04) NA 3.08 (0.05)
RCSA NA NA NA 13.03 (0.13) 14.47 (0.13)
RMSD (A)h 0.04 0.05 0.06 0.12 0.05
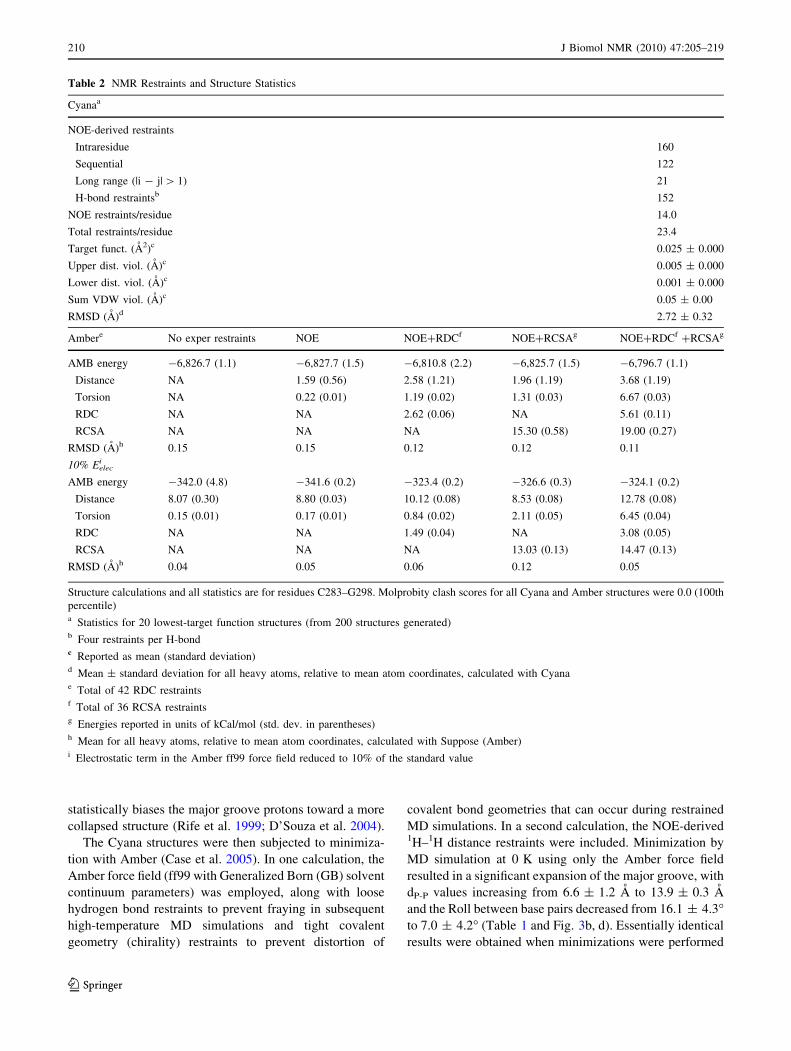
Structure calculations and all statistics are for residues C283–G298. Molprobity clash scores for all Cyana and Amber structures were 0.0 (100th
percentile)a Statistics for 20 lowest-target function structures (from 200 structures generated)b Four restraints per H-bondc Reported as mean (standard deviation)d Mean ± standard deviation for all heavy atoms, relative to mean atom coordinates, calculated with Cyanae Total of 42 RDC restraintsf Total of 36 RCSA restraintsg Energies reported in units of kCal/mol (std. dev. in parentheses)h Mean for all heavy atoms, relative to mean atom coordinates, calculated with Suppose (Amber)i Electrostatic term in the Amber ff99 force field reduced to 10% of the standard value
210 J Biomol NMR (2010) 47:205–219
123
using the NOE-derived distance restraints, and also when
minimization was preceded by MD simulations at 300 K
(Fig. 3c, d).
Similar results were also obtained when an idealized
[DIS]2 model, generated with Nucgen (Bansal et al. 1995),
was subjected to low-temperature MD annealing. Although
the dP-P distances in the initial Nucgen models (10.0 A)
were typical of those observed in X-ray structures, the
propeller twists were opposite to experimentally observed
values (Table 1). Minimization of the Nucgen models
with Amber using only chirality and H-bond restraints
resulted in structures indistinguishable from those obtained
upon restrained MD refinement of the Cyana structures
(Table 1). These findings indicate that (a) structures gen-
erated with Cyana using loose NOE-derived distance, tor-
sion angle, and hydrogen bond restraints have relatively
narrow major grooves and large Roll angles, (b) refinement
of the Cyana structures using the standard Amber force
field affords structures that are more consistent with the
high-resolution X-ray structures, except that the major
grooves are *2 A wider than expected, (c) the NOE
restraints, as applied loosely, are compatible with a broad
range of Roll and dP-P values, and (d) the Amber force
field, and not the refinement strategy or restraints, is
responsible for the structural changes that occur upon
refinement.
Influence of RDC and RCSA restraints on structure
refinement
The RDCs and RCSAs measured for [DIS]2 were then
fitted to the Cyana, Amber-only, and Amber-NOE refined
structures by least squares minimization of the alignment
tensor using Amber (Fig. 4). Nearly identical fits were
obtained with RAMAH (Hansen and Al-Hashimi 2006; see
‘‘Methods’’ section for details). Significantly better fits
were obtained for the Amber-refined structures compared
to the Cyana structures (Fig. 4), indicating that refinement
with Amber (with or without the NOE restraints) leads to
conformers that more accurately reflect the solution-state
structure.
MD refinement of the Amber-NOE structures using the
RDC restraints (conducted in a manner in which both the
atomic coordinates and alignment tensor were simulta-
neously optimized) led to a significant narrowing of the
major groove, with dP-P values decreasing from 13.6 ± 0.3
to 12.1 ± 0.3 A (Fig. 5a and Table 1). Refinement of the
Amber-NOE structures using the RCSA restraints (but not
RDCs) also resulted in a narrowing of the major groove
(dP-P = 11.6 ± 0.1 A; Fig. 5b and Table 1). These calcu-
lations were conducted using a fixed alignment tensor
obtained from calculations that fitted both the RDC and
RCSA data (see below), and although good agreement was
Fig. 4 Plots of molecular
superpositions (top) and
experimental (vertical) versus
back-calculated (horizontal)RDC (black) and RCSA (red)
data in Hz (bottom) for
representative [DIS]2 structures
calculated with Cyana and
refined with Amber. To
facilitate comparisons, the
horizontal line has a slope of
1.0. Pearson (P) and correlation
coefficient (R2) statistics for the
experimental vs. calculated data
are also shown. a Cyana
structures generated using
NOE-derived distance and
H-bond restraints. b, c Amber
structures generated by MD
refinement of the Cyana
structures b using only the ff99
force field with GB solvent
simulation and no additional
restraints, and c using NOE-
derived distance, H-bond and
chirality restraints
J Biomol NMR (2010) 47:205–219 211
123
observed between the experimental and back-calculated
RCSAs, the RDCs agreed less favorably with the back-
calculated values (Fig. 5b). MD simulations performed
using both RDC and RCSA restraints afforded structures
with major groove widths (dP-P = 11.2 ± 0.2 A) similar to
those obtained using only RDC or RCSA restraints (Fig. 5c
Fig. 5 Plots of molecular
superpositions (top) and
representative experimental
(vertical) versus back-
calculated (horizontal) RDC
(black) and RCSA (red) data
(bottom) for 20 Amber
structures after minimization
using a NOE?RDC restraints,
b NOE?RCSA restraints (with
a fixed alignment tensor—see
text), and c NOE?RDC?RCSA
restraints. The starting
structures for all three sets of
calculations are shown in
Fig. 3c, and all calculations led
to reductions in major groove
widths to values consistent with
high-resolution RNA X-ray
structures. The horizontal line is
plotted with a slope of 1.0, and
Pearson (P) and R2 values are
shown
Fig. 6 a–d Plots of molecular superpositions (top) and representative
experimental (vertical) versus back-calculated (horizontal) RDC
(black) and RCSA (red) data (bottom) for [DIS]2 RNA structures
refined with Amber using a modified GB force field in which the
electrostatic term was reduced to 10% of the normal value. The 20
initial Cyana structures (Fig. 4a) were refined using the following
restraint combinations: a NOE-only; b NOE?RDC?RCSA;
c NOE?RDC; d NOE?RCSA (with fixed alignment tensor).
e, f Representative structures obtained upon simultaneous refinement
of the atomic coordinates and orientation tensor using only the NOEs
and RCSAs as restraints. Although both structures and their
corresponding alignment tensors are compatible with the RCSA data,
the predicted alignment tensor for f is highly asymmetric and
incompatible with both the calculated rotational diffusion tensor and
the experimental RDCs (see Table 3). These findings illustrate the
potential limitations of using RCSAs alone for simultaneous structure/
tensor calculations (see text for details)
212 J Biomol NMR (2010) 47:205–219
123
and Table 1), and as expected, these structures exhibited
the best agreement between the experimental and back-
calculated RDCs and RCSAs (Fig. 5c). The average of the
Roll values increased upon inclusion of the RDC and
RCSA restraints, but the individual Roll values were well
within the limits of the wide range of values observed in
the X-ray structures (as evidence by the large standard
deviation values shown in Table 1). Although the Cyana
software package does not allow for inclusion of RCSA
restraints, refinement with Cyana using only the RDC
restraints using a gridsearch approach also afforded struc-
tures with a wider major groove (dP-P = 12.5 ± 0.5 A;
Table 1).
RDC and RCSA restraints can overcome more severe
force field deficiencies
The above results indicate that the standard Amber force
field favors RNA helices with major groove widths that are
ca. 2 A larger than those observed in high resolution X-ray
crystal structures; that loosely applied NOE restraints do
not correct for the wider major groove of the Amber
structures or the narrower groove of the Cyana structures;
and that orientation restraints derived from limited 1H–13C
RDC and 13C RCSA measurements induce the formation of
structures with major groove widths that are more consis-
tent with those observed in the surveyed X-ray crystal
structures. As a test for the ability of orientation restraints
to overcome more severe force field deficiencies, structure
refinements were conducted as described above, except that
the electrostatic term in the Amber force field (Eelec) was
reduced to 10% of the normal value. Minimization of the
20 Cyana starting structures with this modified force field,
with inclusion of the NOE, H-bond and chirality restraints,
led to a nearly complete collapse of the major groove
(dP-P = 4.5 ± 0.2 A), and back-calculated RDC and
RCSA values were in poor agreement with experimental
values (Fig. 6a).
The above structures were then subjected to low-tem-
perature annealing (T = 50 K) and minimization using the
RDCs and RCSAs as restraints. All other force field
parameters were the same as those applied above, including
the 90% reduction in the Eelec term. As shown in Fig. 6b,
implementation of these restraints led to an expansion
of the major groove, with dP-P values (9.7 ± 0.3 A)
approaching those obtained when the standard Amber force
field was employed and within the range of values
observed in high-resolution X-ray crystal structures
(Table 1). Refinement using only the RDC restraints,
conducted in a manner in which the alignment tensor and
structure were simultaneously optimized, led to structures
with slightly larger major grooves (dP-P = 10.8 ± 0.3 A;
Fig. 6c and Table 1). Similar results were obtained using
only the RCSA restraints, although these calculations were
conducted using a fixed alignment tensor generated previ-
ously from the RDC?RCSA calculations (dP-P = 10.7 ±
0.2 A; Fig. 6d and Table 1).
As a final test, the Cyana structures were minimized as
described above using an Amber force field in which the
Eelec term was doubled relative to the standard value.
Structures refined without NOE or orientation restraints
(but including chirality and H-bond restraints) exhibited
very wide major grooves (dP-P = 16.3 ± 0.9 A; Table 1).
Refinement with the NOE restraints resulted in a significant
reduction in the major groove width (dP-P = 14.4 ± 1.1
A), and inclusion of RDC and RCSA restraints led to
further reduction, with dP-P values (12.4 ± 1.0) in the
Table 3 Alignment tensors for representative [DIS]2 structures
Structure Aa Ar ERDC ERCSA
Cyana
NOEa 124.3 1.3 658.5 175.8
NOE?RDCb 112.5 0.1 5.1 NA
Amber
No Exper. Restra 104.4 1.05 78.7 53.0
NOEa 104.2 0.46 115.1 46.1
NOE?RDCc 109.2 1.9 2.7 NA
NOE?RDC?RCSAd 125.3 0.6 5.5 18.7
NOE?RCSAe 114.6 7.5 NA 15.3
GB (10% Eelec)
No Exp. Restra
NOEa 127.6 0.8 706.5 214.9
NOE?RDCc 116.7 1.4 1.5 NA
NOE?RDC?RCSAd 133.4 0.9 3.0 14.3
NOE?RCSAe,f 119.8 1.1 NA 13.1
NOE?RCSAe,f 149.8 30.2 NA 13.7
Axial (Aa) and rhombic (Ar) components of the Saupe alignment
tensor (x105) and pentalty functions for the RDC and RCSA terms
(ERDC and ERCSA, respectively; kcal/mol) after minimization with
Ambera Back-calculated values for structures generated without use of
orientation restraintsb Structure/tensor calculations performed with Cyana by gridsearch;
values reported in the table calculated with Amber. cValues obtained
for calculations in which the structure and orientation tensor were
simultaneously optimized using RDCs as restraintsd Values obtained for calculations in which the structure and orien-
tation tensor were simultaneously optimized using RDCs and RCSAs
as restraintse Values obtained for calculations in which the structure and orien-
tation tensor were simultaneously optimized using RCSAsf as
restraintsf Values correspond to structure shown in Fig. 6eg Values correspond to structure shown in Fig. 6f. The high rhomb-
icity appears inconsistent with the calculated, axially symmetric dif-
fusion tensor (principal components (amu-A2): Dzz = 0.59 9 106;
Dxx = 1.52 9 106; Dyy = 1.54 9 106)
J Biomol NMR (2010) 47:205–219 213
123
range expected on the basis of the X-ray structures. Thus,
regardless of whether the force field was modified to favor
collapsed or expanded major grooves, inclusion of the
RDC and RCSA restraints led to structures with major
groove widths compatible with those of the high-resolution
X-ray structures (Table 1).
Limitation of RCSAs for alignment tensor
determination
As indicated above, Amber refinements using RDCs or
RDCs and RCSAs as restraints were performed in a manner
in which the atomic coordinates and alignment tensors
were simultaneously optimized, and in all cases the cal-
culations converged to single solutions with 3D structures
and alignment tensors that were generally very similar
(Tables 1 and 3, respectively). In contrast, calculations
using only the RCSA restraints for simultaneous optimi-
zation of the structure and alignment tensor did not afford
single structure/tensor solutions. Two representative
structures generated by this approach are shown in Fig. 6e
and f. Although these structures (and other structures not
shown) exhibited similar, low energies upon refinement,
the alignment tensors were often significantly different. For
example, the wider major groove of the structure shown in
Fig. 6e (dP-P = 9.7 ± 0.3 A) is associated with an align-
ment tensor that is essentially axially symmetric and sim-
ilar to those obtained upon refinement using only RDCs
(Aa (axial component of the Saupe alignment tensor) and
Ar (rhombic component) of the alignment tensor =
119.8 9 10-5 and 1.1 9 10-5, respectively; Table 3),
whereas the minimized structure with the collapsed major
groove (dP-P = 4.5 ± 0.2 A, Fig. 6f) and high Roll (*15�,
Table 1) is associated with a significantly rhombic tensor
(Aa = 149.8 9 10-5, Ar = 30.2 9 10-5; Table 3).
The rhombicity of the alignment tensor associated with
the collapsed major groove (Fig. 6f; top) is incompatible
with both the experimental RDC data (Fig. 6f; bottom) and
the calculated diffusion tensor, which is axially symmetric
(Table 3 caption). The problem appears to be that, although
the number of RCSA restraints employed (36) was similar
to the number of restraints used in the RDC-only calcula-
tions (42), the information content provided by the RCSAs
was lower. This is because the RCSAs associated with a
particular nucleotide (i.e., the pyrimidine C5 and C6
RCSAs, and the adenosine C2 and C8 RCSAs) provide
nearly redundant alignment information, due to the fact
that the most shielded components of their alignment ten-
sors are almost perpendicular to the plane of the base and
nearly parallel to each other (differing by less than *30�;
Hansen and Al-Hashimi 2006; Ying et al. 2006). Although
the redundancy can help reduce biases associated with
measurement errors, the angular information content of the
RCSA data is essentially half that of the RDC data for A, C
and U bases (assuming all aromatic 13C–1H dipolar cou-
plings and the associated 13C CSAs are available). In
addition, the RCSA restraints that were measureable for
[DIS]2 were asymmetrically distributed about the helix
axis, and this asymmetry correlated with the rhombicity in
the alignment tensors calculated for the highly compressed
structures (Figs. 6f, 7). Thus, the inability of RCSAs alone
to afford unique structure/alignment tensor solutions, and
the calculation of compressed structures with highly
rhombic alignment tensors, appears to be due to (a) the
reduced amount of unique angular information in the
RCSAs (due to nearly redundant CSA orientations) and (b)
Fig. 7 Distribution of a RDC and b RCSA restraints used for
structure calculations; RNA in gray, 13C–1H vectors shown as blue
sticks, 13C RCSAs for purines and pyrimidines shown as spheres
(blue and red, respectively). The structure corresponds to that shown
in Fig. 5f, which was calculated using only RCSA restrains and has a
collapsed major groove. The eigenvectors of the Saupe alignment
tensor are also shown (zz = cyan, xx = red, yy = blue; eigenvalues
|zz|:|xx|:|yy| &3:2:1). The rhombicity of the tensor relative to the
helix axis in this structure correlates with the asymmetric restraint
distribution (see text)
214 J Biomol NMR (2010) 47:205–219
123
asymmetric distribution of the restraints employed. It is
important to note, however, that once the alignment tensor
of [DIS]2 had been established from the RDC or
RDCs?RCSA data, the RCSA restraints alone afforded
structures that were very similar to those calculated with
the RDC or RDC?RCSA restraints, even when a highly
deficient force field was employed (Table 1).
Conclusions
An assessment of A-form helical RNA structures deter-
mined by high resolution X-ray crystallography and NMR
revealed systematic differences, the most notable being the
significantly larger major groove widths of a majority of
the NMR structures. As commonly employed, NOE-
derived distance, dihedral angle, and hydrogen bonding
restraints are compatible with a wide range of A-like
conformations, and as such, structures generated using only
these restraints are sensitive to the force fields employed
during refinement. [DIS]2 structures calculated with Cyana
using loose distance restraints afforded structures with
collapsed major grooves, due to the fact that the restraints
correspond predominantly to distances within the major
groove. Refinement with the Amber ff99 force field with
GB solvent continuum parameters afforded [DIS]2 struc-
tures with features that more closely resembled those
observed in high-resolution X-ray structures (compared
with those calculated with Cyana), except that the major
groove widths were *2 A wider than expected. The
application of orientation restraints derived from either
aromatic 1H–13C RDCs or 13C RCSAs resulted in struc-
tures with helical properties consistent with those observed
in the surveyed X-ray crystal structures, not only when
conducted with the standard Amber force field, but also
when performed with altered force fields that favor both
wider and narrower major groove widths. In particular, the
major groove dP-P distances calculated with RDC and
RCSA restraints (11 ± 1 A) are fully consistent with those
observed in the surveyed X-ray structures.
Empirical methods have been employed in the past to
overcome experimental restraint limitations, including the
use of database potentials based on statistical analyses of
torsion angles and base-to-base positions in RNA X-ray
crystal structures (Clore and Kuszewski 2003), the use of
loose inter-phosphate distance restraints using X-ray
structures as a guide (D’Souza et al. 2004), and the
empirical tuning of force field terms (Rife et al. 1999).
Such empirical adjustments and/or restraints were not
required to obtain X-ray compatible structures of [DIS]2.
Although it is currently not possible to know the ‘‘true’’
solution structure, the fact that the refined structures pro-
vide better fits to two classes of experimental data (RDCs
and RCSAs) provides good evidence that they more
accurately represent the actual solution state conformation.
The simultaneous fitting of the atomic coordinates and
alignment tensor to the RCSA data afforded multiple
solutions, many of which were incompatible with the RDC
data and the calculated diffusion tensor. Because the 13C
CSA tensors of a given nucleotide sample similar angular
space relative to the alignment tensor, the information
content available from the RCSA data is comparatively
lower than that of the RDC data. Thus, the use of RCSAs
alone for simultaneous structure/tensor determination
should probably be avoided for systems similar to [DIS]2.
However, the redundancies can be useful for overcoming
errors associated with uncertainties in signal frequency
measurement, and when employed with RDCs or inde-
pendently using a pre-determined alignment tensor, RCSAs
provide additional restraint information consistent with that
provided by the RDCs.
The IMC pulse sequence presented here provides a
sensitive approach for measuring individual 1H–13C mul-
tiplet component frequencies for aromatic C-H groups in13C-labeled RNA. When combined with RPCSA data,1H–13C RDCs can be measured directly, providing a con-
venient means for calculating aromatic 13C RCSAs. The
approach is readily applicable to RNAs as large as 50 nt,
and should be applicable to RNAs with correlation times as
long as *10 ns (Grishaev et al. 2006).
Methods
Sample preparation
RNA samples were prepared by in vitro transcription using
T7 RNA polymerase and synthetic DNA templates that
were 20-O-methylated at the first and second base positions
to prevent N?1 addition (Kao et al. 1999). To increase
RNA yield by preventing the accumulation of insoluble
Mg-PPi complexes, reactions were supplemented with
Yeast Inorganic Pyrophosphatase (New England Biolabs) at
a final concentration of *1 unit/mL. Transcriptions were
carried out in 20 ml reaction volumes using fully protonated
ribonucleotide triphosphates (rNTPs; Sigma) or 13C spe-
cifically labeled rNTPs (Spectra Stable Isotopes, Columbia
MD). Following synthesis, the RNAs were chloroform-
phenol extracted, ethanol precipitated, and purified to
homogeneity on 20% preparative denaturing PAGE gels.
RNA fragments were electroeluted and desalted using
Amersham NAP-25 columns, washed three times with NaCl
(2 M, 5x(v/v), then washed eight times with purified water
(Millipore, 5x(v/v)). Samples were dialyzed against 10 mM
Tris pH 7.5, 150 mM NaCl, lyophilized and re-suspended in
either 100% D2O or 90% H2O/10% D2O. Some chemical
J Biomol NMR (2010) 47:205–219 215
123
shifts were sensitive to small variations in sample pH and
ionic strength, and samples for RDC/RCSA measurements
were prepared by simultaneous dialysis against a common
buffer reservoir using microscale dialysis buttons (Hampton
Research, Aliso Veijo, CA). Final RNA concentrations
ranged from 0.5 to 1.5 mM (120 lL in 3 mm NMR sample
tubes (Shigemi Inc., Japan)). Filamentous Pf1 phage (Asla
Bioctech Ltd. Riga, Latvia) concentrations were determined
from the 2H quadrupolar splittings of the D2O signal
(Hansen et al. 1998).
NMR spectroscopy
NMR spectra were recorded on Bruker Avance (800 MHz)
or DMX (600 MHz) instruments both equipped with triple-
resonance 5 mm cryogenic probes and containing a z-axis
pulsed field gradient accessory. NMR data were processed
with NMRPipe/NMRDraw (Delaglio et al. 1995) and
analyzed using NMRView (Johnson and Blevins 1994).
Non-exchangeable 1H assignments were made from 2D
NOESY (200 ms mixing time; Jeener et al. 1979; Macura
and Ernst 1980) and 2D TOCSY (75 ms mixing time;
Griesinger et al. 1988) spectra recorded at 303 K. 13C
chemical shift assignments were made by comparing1H–13C HMQC (Bax and Subramanian 1986) and TROSY-
HSQC (Pervushin et al. 1997) spectra, obtained for samples
with nucleotide-specific 13C-labeling, with the assigned 2D
NOESY spectrum. Exchangeable 1H assignments were
made at 298 K using the Watergate-NOESY (200 ms
mixing time) pulse sequence (Piotto et al. 1992). Proton
resonance assignments were made by standard sequential
assignment methods (Wuthrich 1986).
One bond 1JCH (and 1DCH) and 13C chemical shifts were
measured from NMR spectra obtained using a modified
form of the13C-decoupled RPCSA pulse sequence
(Grishaev et al. 2006; called the IMC pulse sequence,
Fig. 2a). The phases of the final 13C rf pulse (/7) and
TROSY back-transfer 1H rf pulse (/8) were adjusted to
specifically detect the desired component of the 13C-{1H}
doublet. The phase of the final 13C pulse (/7) was
empirically adjusted (-38�) to eliminate the spurious sig-
nals from the unwanted coherence pathways, which arise
due to differential relaxation rates of single and multiple
quantum coherence. RPCSA spectra were obtained as a
reference to account for potential (minor) 1H NMR
chemical shift changes that can occur as a function of
added alignment media (the pulse sequence and parameters
are available from the original authors upon request
(Grishaev et al. 2006)). Three separate sets of spectra
(obtained using optimized 1H and 13C decoupling pulses)
were generated for measurement of C2–H2, C6/8–H6/8, and
C5–H5 correlations. RPCSA (Dd0) values were determined
by taking the difference in the 13C chemical shift under
aligned (d0aniso) and isotropic (d0iso) conditions. Prior to
calculation of Dd0, the d0aniso shifts were corrected to
account for the change in lock frequency resulting from the2H quadrupolar splitting (Hansen and Al-Hashimi 2006;
Ying et al. 2006). RCSAs (Dd were subsequently calcu-
lated based on the relationship: DdHz = Dd0Hz - RDC/2.
IMC data for purines were collected in two sets of
experiments, with the 1H and 13C rf frequencies centered in
the H8/C8 and H2/C2 regions of the spectra. IMC spectra for
the H5/C5 and H6/C6 correlations of pyrimidines were
collected similarly, except that for C6/H6 data collection,
the 13C broad band hyperbolic secant and selective IBURP
inversion pulses, and selective 1H IBURP inversion pulse,
were centered on the 13C5 and 1H5 frequencies, respec-
tively (and vice versa).
Implementation of RCSA restraints in Amber
The Amber restrained dynamics calculations include a
penalty function (ECSA = kCSA(Ddcalc - Ddobs)2), which
compares calculated and observed residual CSA values.
Implementation involves transforming previously deter-
mined 13C CSA tensors (Ying et al. 2006) from a local
coordinate system defined by base pair atoms into the same
molecular coordinate frame used for the alignment tensor
(see supplementary materials for implementation details).
These penalty terms are added to those arising from RDCs,
and used for simultaneous refinement of the structure and
the alignment tensor elements, as described (Tsui et al.
2000).
Structure calculations
Structure calculations were performed with a 160 processor
Apple Xserve cluster equipped with a low-latency Mira-
com switch (Apple, Inc., Cupertino CA). Initial structures
were generated with Cyana (Guntert et al. 1997; version
2.1) using 1H–1H distance restraints of 2.7, 3.3 and 5.0 A
corresponding to experimentally observed NOEs of strong,
medium, and weak intensity, respectively. Upper distance
restraints of 4.2 A and 3.2 A were employed for intrares-
idue H8/6 to H30 (strong intensity) and H2
0 (medium
intensity) NOEs, respectively, to avoid over-restraining
these interactions (D’Souza et al. 2004).
All Amber (version 10; Case et al. 2005) calculations
were conducted with the ff99 force field using a general-
ized Born solvent continuum model (Hawkins et al. 1995;
Hawkins et al. 1996; Tsui and Case 2001; Amber igb
parameter = 1). Parabolic torsion angle restraints (single-
value minimum, 10.0 Mcal/mol-rad2) were employed to
enforce planarity of the aromatic rings and ideality of
covalent angles associated with the glycosydic bonds,
which otherwise could exhibit unrealistic deviations during
216 J Biomol NMR (2010) 47:205–219
123
refinement with RDC and RCSA restraints. Application of
RDC/RCSA restraint ranges, estimated from uncertainties
in signal frequency measurements, almost always resulted
in structures with back-calculated RDC and RCSA values
at their prescribed boundary limits. This was due to the fact
that the restraints opposed terms in the Amber force field
that promoted wide (normal or twofold enhanced electro-
static term) or narrow (90% reduced electrostatic term)
major grooves, and as such, similar degrees of convergence
were obtained using loose (non-single value) orientation
restraints. For this reason, the RDCs and RCSAs were
implemented as single-value minima restraints, which were
allowed to deviate during the calculations by applying
relatively soft RDC and RCSA weighting coefficients (0.1).
Cyana structures with lowest target functions were sub-
jected to 1,000 steps of unrestrained conjugate gradient
minimization (CGM; 12 A non-bonded force cut off) to
remove possible bad contacts, prior to restrained MD
simulations.
The CGM minimized Cyana structures were subjected
to MD simulations under two different sets of conditons:
one using the standard Amber force field, and the other
using a force field with the weighting coefficient for elec-
trostatic interactions (Eelec) reduced to 10% of the standard
value. Structures were initially refined without the use of
the NOE-derived distance restraints, but for comparison
with subsequent calculations, chirality and H-bond
restraints were also employed. Structures with added NOE-
derived distance restraints were heated to either 50 K or
350 K prior to equilibration at 0 K (400,000 steps per MD
simulation, 0.2 fs/step; salt concentration = 150 mM).
Since essentially identical results were obtained for the
50 K and 350 K calculations, all subsequent calculations
were performed at 50 K.
MD simulations were then performed using the fol-
lowing combinations of experimental restraints: distance ?
RDC restraints, distance ? RDC ? RCSA restraints,
distance ? RCSA restraints. Calculations were initially
conducted with fixed atomic coordinates to generate an
initial alignment tensor (100,000 steps minimization).
Structures were then heated from 0 to 50 K (40,000 steps,
0.2 fs/step), maintained at 50 K (60,000 steps), slowly
cooled to 0 K (200,000 steps), then maintained at 0 K
(200,000 steps) using the different combinations of NOE-
derived distance and orientation restraints described above.
Penalty energies were most evenly distributed among the
experimental restraints using RDC and RCSA penalty
weight coefficients of 0.1.
Idealized coordinates for [DIS]2 were generated with
Nucgen (Bansal et al. 1995) and equilibrated at 0 K using
the protocol employed for the Cyana structures. Calcula-
tions were performed using the standard Amber force field
with only chirality and H-bond restraints.
For comparison purposes, alignment tensors for the
Cyana and Nucgen structures, and the Amber structures
generated without orientation restraints, were calculated by
Amber minimization (100,000 steps) using fixed atom
positions. Back-calculated RDC and RCSA values
obtained by this approach were similar to those obtained
using RAMAH (Hansen and Al-Hashimi 2006). The axial
and rhombic components of the alignment tensors are
reported as Aa = (|zz|)/2 and Ar = (|xx|–|yy|)/3, respec-
tively, where the eigenvalues of the alignment matrix are
ordered as |zz| [ |yy| [ |xx|.
Structural parameters were assessed using X3DNA (Lu
and Olson 2003; Lu and Olson 2008), interphosphate dis-
tance measurements and figures of structures were made
with PyMOL (DeLano 2002), and quality assessments were
made with Molprobity (Davis et al. 2007).
Acknowledgments Support from the NIH (GM42561 to M.F.S.,
GM45811 to D.A.C.) and the Intramural Research Program of the
NIDDK, NIH (DK029051-03 to A.B.) is gratefully acknowledged.
B.K., P.S., S.B. and R.S. are UMBC Meyerhoff Scholars and were
supported by an HHMI undergraduate education grant.
References
Al-Hashimi HM (2007) Beyond static structures of RNA by NMR:
folding, refolding, and dynamics at atomic resolution. Biopoly-
mers 86:345–347
Al-Hashimi HM, Patel DJ (2002) Residual dipolar couplings: synergy
between NMR and structural genomics. J Biomol NMR 22:1–8
Al-Hashimi HM, Walter NG (2008) RNA dynamics: it is about time.
Curr Opin Struct Biol 18:321–329
Al-Hashimi HM, Gorin A, Majumdar A, Patel DJ (2001a) Alignment
of the HTLV-I Rex peptide bound to its target RNA aptamer
from magnetic field-induced residual dipolar couplings and
intermolecular hydrogen bonds. J Am Chem Soc 123:3179–3180
Al-Hashimi HM, Majumdar A, Gorin A, Kettani A, Skripkin E, Patel
DJ (2001b) Field- and phage-induced dipolar couplings in a
homodimeric DNA quadruplex: relative orientation of G. (C-A)
triad and G-tetrad motifs and direct determination of C2
symmetry axis orientation. J Am Chem Soc 123:633–640
Al-Hashimi HM, Tolman JR, Majumdar A, Gorin A, Patel DJ (2001c)
Determining stoichiometry in homomultimeric nucleic acid
complexes using magnetic field induced residual dipolar cou-
plings. J Am Chem Soc 123:5806–5807
Al-Hashimi HM, Gosser Y, Gorin A, Hu W, Majumdar A, Patel DJ
(2002) Concerted motions in HIV-1 TAR RNA may allow
access to bound state conformations: RNA dynamics from NMR
residual dipolar couplings. J Mol Biol 315:95–102
Al-Hashimi HM, Pitt SW, Majumdar A, Xu W, Patel DJ (2003)
Mg2?-induced variations in the conformation and dynamics of
HIV-1 TAR RNA probed using NMR residual dipolar couplings.
J Mol Biol 329:867–873
Allain FH-T, Varani G (1997) How accurately and precisely can RNA
structure be determined by NMR? J Mol Biol 267:338–351
Andersson P, Annila A, Otting G (1998) An alpha/beta-HSQC-alpha/
beta experiment for spin-state selective editing of IS cross peaks.
J Magn Reson 133:364–367
J Biomol NMR (2010) 47:205–219 217
123
Bansal M, Bhattacharyya D, Ravi B (1995) NUPARM and NUCGEN:
software for analysis and generation of sequence dependent
nucleic acid structures. Comput Appl Biosci 11:281–287
Bax A, Grishaev A (2005) Weak alignment NMR: a hawk-eyed
view of biomolecular structure. Curr Opin Struct Biol 15:563–
570
Bax A, Subramanian S (1986) Sensitivity-enhanced two-dimensional
heteronuclear shift correlation NMR spectroscopy. J Mag Reson
67:565–569
Bayer P, Varani L, Varani G (1999) Refinement of the structure of
protein-RNA complexes by residual dipolar coupling analysis. J
Biomol NMR 14:149–155
Brutscher B, Boisbouvier J, Pardi A, Marion D, Simorre JP (1998)
Improved sensitivity and resolution in 1H–13C NMR experi-
ments of RNA. J Am Chem Soc 120:11845–11851
Bryce DL, Grishaev A, Bax A (2005) Measurement of ribose carbon
chemical shift tensors for A-form RNA by liquid crystal NMR
spectroscopy. J Am Chem Soc 127:7387–7396
Case DA et al (2005) The Amber biomolecular simulation programs.
J Computat Chem 26:1668–1688
Clore GM, Kuszewski J (2003) Improving the accuracy of NMR
structures of RNA by means of conformational database
potentials of mean force as assessed by complete dipplar
coupling cross-validation. J Am Chem Soc 125:1518–1525
D’Souza V, Melamed J, Habib D, Pullen K, Wallace K, Summers MF
(2001) Identification of a high-affinity nucleocapsid protein
binding site within the Moloney Murine Leukemia Virus W-
RNA packaging signal. Implications for genome recognition. J
Mol Biol 314:217–232
D’Souza V, Dey A, Habib D, Summers MF (2004) NMR structure of
the 101 nucleotide core encapsidation signal of the Moloney
Murine Leukemia Virus. J Mol Biol 337:427–442
Davis JH, Tonelli M, Scott LG, Jaeger L, Williamson JR, Butcher SE
(2005) RNA helical packing in solution: NMR structure of a
30 kDa GAAA tetraloop-receptor complex. J Mol Biol 351:371–
382
Davis IW et al (2007) MolProbity: all-atom contacts and structure
validation for proteins and nucleic acids. Nucleic Acids Res
35:W375–W383
Delaglio F, Grzesiek S, Vuister GW, Zhu G, Pfeifer J, Bax A (1995)
NMRPipe: a multidimensional spectral processing system based
on UNIX pipes. J Biomol NMR 6:277–293
DeLano WL (2002) The PyMOL molecular graphics system. DeLano
Scientific, San Carlos
Dock-Bregeon AC, Chevrier B, Podjarny A, Johnson J, De Bear JS,
Gough GR, Gilham PT, Moras D (1989) Crystallographic
structure of an RNA helix: [U(UA)6A]2. J Mol Biol 209:459–474
Fisher CK, Al-Hashimi HM (2009) Approximate reconstruction of
continuous spatially complex domain motions by multialign-
ment NMR residual dipolar couplings. J Phys Chem B
113:6173–6176
Frank AT, Stelzer AC, Al-Hashimi HM, Andricioaei I (2009)
Constructing RNA dynamical ensembles by combining MD
and motionally decoupled NMR RDCs: new insights into RNA
dynamics and adaptive ligand recognition. Nucleic Acids Res
37:3670–3679
Green H, Freeman R (1991) Band-selective radiofrequency pulses. J
Magn Reson 93:93–141
Griesinger C, Otting G, Wuthrich K, Ernst RR (1988) Clean TOCSY
for 1H spin system identification in macromolecules. J Am Chem
Soc 110:7870–7872
Grishaev A, Ying J, Bax A (2006) Pseudo-CSA restraints for NMR
refinement of nucleic acid structures. J Am Chem Soc
128:10010–10011
Gueron M, Leroy LJ, Griffey RH (1983) J. Am Chem Soc 105:7262–
7266
Guntert P, Mumenthaler C, Wuthrich K (1997) Torsion angle
dynamics for protein structure calculations with a new program.
DYANA J Mol Biol 273:283–298
Hansen AL, Al-Hashimi HM (2006) Insight into the CSA tensors of
nucleobase carbons in RNA polynucleotides from solution
measurements of residual CSA: towards new long-range orien-
tational constraints. J Magn Reson 179:299–307
Hansen MR, Mueller L, Pardi A (1998) Tunable alignment of
macromolecules by filamentous phage yields dipolar coupling
interactions. Nat Struct Biol 5:1065–1074
Hawkins GD, Cramer CJ, Truhlar DG (1995) Pairwise solute
descreening of solute chargers from a dielectric medium. Chem
Phys Lett 246:122–129
Hawkins GD, Cramer CJ, Truhlar DG (1996) Parameterized models
of aqueous free energies of solvation based pairwise descreening
of solute atomic chargers from a dielectric medium. J Phys Chem
100:19824–19839
Jeener J, Meier BH, Bachmann P, Ernst RR (1979) Investigation of
exchange processes by two-dimensional NMR spectroscopy. J
Chem Phys 71:4546–4553
Johnson BA, Blevins RA (1994) NMRview: a computer program for
the visualization and analysis of NMR data. J Biomol NMR
4:603–614
Kao C, Zheng M, Rudisser S (1999) A simple and efficient method to
reduce nontemplated nucleotide addition at the 3 terminus of
RNAs transcribed by T7 RNA polymerase. RNA 5:1268–1272
Kim NK, Zhang Q, Zhou J, Theimer CA, Peterson RD, Feigon J
(2008) Solution structure and dynamics of the wild-type
pseudoknot of human telomerase RNA. J Mol Biol 384:1249–
1261
Klein DJ, Moore PB, Steitz TA (2004) The roles of ribosomal
proteins in the structure assembly, and evolution of the large
ribosomal subunit. J Mol Biol 340:141–177
Klosterman E, Shah SA, Steitz S (1999) Crystal structures of two
plasmid copy control related RNA duplexes: an 18 base pair
duplex at 1.20 A resolution and a 19 base pair duplex at 1.55 A
resolution. Biochemistry 38:14784–14792
Latham MP, Hanson P, Brown DJ, Pardi A (2008) Comparison of
alignment tensors generated for native tRNAVal using magnetic
fields and liquid crystalline media. J Biomol NMR 40:83–94
Lawrence DC, Stover CC, Noznitsky J, Wu Z-R, Summers MF (2003)
Structure of the intact stem and bulge of HIV-1 w-RNA stem
loop SL1. J Mol Biol 326:529–542
Leonard GA, McAuley-Hecht KE, Ebel S, Lough DM, Brown T,
Hunter WN (1994) Crystal and molecular structure of
r(CGCGAAUUAGCG): an RNA duplex containing two
G(anti).A(anti) base pairs. Structure 2:483–494
Lu X-J, Olson WK (2003) 3DNA: a software package for the analysis,
building and visualization of three-dimensional nucleic acid
structures. Nucl Acids Res 31:5108–5121
Lu X-J, Olson WK (2008) 3DNA: a versatile, integrated software
system for the analysis, rebuilding and visualization of three-
dimensional nucleic-aci structures. Nature Prot 3:1213–1227
Lukavsky PJ, Puglisi JD (2005) Structure determination of large
biological RNAs. Methods Enzymol 394:399–415
Lukavsky PJ, Kim I, Otto GA, Puglisi JD (2003) Structure of HCV
IRES domain II determined by NMR. Nature Struct Biol
10:1033–1038
Macura S, Ernst RR (1980) Elucidation of cross relaxation in liquids
by two-dimensional NMR spectroscopy. Mol Phys 41:95–117
Mollova ET, Hansen MR, Pardi A (2000) Global structure of RNA
determined with residual dipolar couplings. J Am Chem Soc
122:11561–11562
Pan ZW, Mitra SN, Sundaralingam M (1998) Structure of a 16-mer
RNA duplex r(GCAGACUUAAAUCUGC)2 with wobble C.A?
mismatches. J Mol Biol 283:977–984
218 J Biomol NMR (2010) 47:205–219
123
Pervushin K, Riek R, Wider G, Wuthrich K (1997) Attenuated T2
relaxation by mutual cancellation of dipole-dipole coupling and
chemical shift anisotropy indicates an avenue to NMR structures
of very large biological macromolecules in solution. Proc Natl
Acad Sci USA 94:12366–12371
Piotto M, Saudek V, Sklenar V (1992) Gradient-tailored excitation for
single-quantum NMR spectroscopy of aqueous solutions.
J Biomol NMR 2:661–665
Rife JP, Stallings SC, Correll CC, Dallas A, Steitz TA, Moore PB
(1999) Comparison of the crystal and solution structures of two
RNA oligonucleotides. Biophys J 76:66–75
Saenger W (1984) Principles of nucleic acid structure. Springer,
New York
Shah SA, Brunger AT (1999) The 1.8 A crystal structure of a
statically disordered 17 base pair RNA duplex: principles of
RNA crystal packing and its effect on nucleic acid structure.
J Mol Biol 285:1577–1588
Skrisovska L et al (2007) The testis-specific human protein RBMY
recognizes RNA through a novel mode of interaction. EMBO
Rep 8:372–379
Staple DW, Butcher SE (2005) Solution structure and thermodynamic
investigation of the HIV-1 frameshift inducing element. J Mol
Biol 349:1011–1023
Stefl R, Wu H, Ravindranathan S, Sklenar V, Feigon J (2004) DNA
A-tract bending in three dimensions: solving the dA4T4 vs.
dT4A4 conundrum. Proc Natl Acad Sci USA 101:1177–1182
Tjandra N, Tate S, Ono A, Kainosho M, Bax A (2000) The NMR
structure of a DNA dodecamer in an aqueous dilute liquid
crystalline phase. J Am Chem Soc 122:6190–6200
Trantirek L, Urbasek M, Stefl R, Feigon J, Sklenar V (2000) A
method for direct determination of helical parameters in nucleic
acids using residual dipolar couplings. J Am Chem Soc 122:
10454–10455
Trikha J, Filman DJ, Hogle JM (1999) Crystal structure of a 14 bp
RNA duplex with non-symmetrical tandem GxU wobble base
pairs. Nucleic Acids Res 27:1728–1739
Tsui V, Case DA (2001) Theory and applications of the generalized
Born solvation model in macromolecular simulations. Biopoly-
mers 2001:275–291
Tsui V, Zhu L, Huang TH, Wright PE, Case DA (2000) Assessment
of zinc finger orientations by residual dipolar coupling constants.
J Biomol NMR 16:9–21
Walsh JD, Wang YX (2005) Periodicity, planarity, residual dipolar
coupling, and structures. J Magn Reson 174:152–162
Walsh JD, Cabello-Villegas J, Wang YX (2004) Periodicity in
residual dipolar couplings and nucleic acid structures. J Am
Chem Soc 126:1938–1939
Wang J, Walsh JD, Kuszewski J, Wang YX (2007) Periodicity,
planarity, and pixel (3P): a program using the intrinsic residual
dipolar coupling periodicity-to-peptide plane correlation and phi/
psi angles to derive protein backbone structures. J Magn Reson
189:90–103
Warren JJ, Moore PB (2001) Application of dipolar coupling data to
the refinement of the solution structure of the sarcin-ricin loop
RNA. J Biomol NMR 20:311–323
Werbelow LG, Grant DM (1977) Carbon-13 NMR relaxation and
molecular dynamics: overall movement and internal rotation of
methyl groups in N,N-dimethylformamide. Adv Magn Reson
9:189–299
Wuthrich K (1986) NMR of proteins and nucleic acids. Wiley, New
York
Ying J, Grishaev A, Bryce DL, Bax A (2006) Chemical shift tensors
of protonated base carbons in helical RNA and DNA from NMR
relaxation and liquid crystal measurements. J Am Chem Soc
128:11443–11454
Ying J, Grishaev A, Latham MP, Pardi A, Bax A (2007) Magnetic
field induced residual dipolar couplings of imino groups in
nucleic acids from measurements at a single magnetic field. J
Biomol NMR 39:91–96
Zhang Q, Al-Hashimi HM (2008) Extending the NMR spatial
resolution limit for RNA by motional couplings. Nat Methods
5:243–245
Zhang Q, Sun X, Watt ED, Al-Hashimi HM (2006) Resolving the
motional modes that code for RNA adaptation. Science 311:653–
656
Zhang Q, Stelzer AC, Fisher CK, Al-Hashimi HM (2007) Visualizing
spatially correlated dynamics that directs RNA conformational
transitions. Nature 450:1263–1267
Zhou H, Vermeulen A, Jucker FM, Pardi A (2001) Incorporating
residual dipolar couplings into the NMR structure determination
of nucleic acids. Biopolymers 52:168–180
Zuo X et al (2008) Global molecular structure and interfaces:
Refining an RNA:RNA complex structure using solution X-ray
scattering data. J Am Chem Soc 130:3292–3293
J Biomol NMR (2010) 47:205–219 219
123