42
July 2000 Making a Difference How Women in Politics Affect Health and Education Outcomes. Stephen Knack World Bank Paroma Sanyal University of California, Irvine
July 2000
Making a Difference
How Women in Politics Affect Health and Education Outcomes.
Stephen Knack World Bank
Paroma Sanyal
University of California, Irvine

“As women become more politically active, they will exert greater influence over development
decisions. One assumption underlying USAID’s commitment to expanding women’s political
participation is that, over the long term, this will produce better development decisions”1
Office of Women in Development
U.S. agency for International Development
Introduction
Over the past decade, the ranks of women in politics have swelled. More and more
women are breaking through the invisible “glass ceiling” to stake their claim to some of the
highest political posts. Israel, India, Pakistan, Sri Lanka, Bangladesh, Philippines and Britain
have all had women presidents or prime-ministers in the past twenty years. As more women
enter the political arena, researchers have been interested in the mechanics of voting women to
office and the differential impacts it may have on policy formulations and implementation. The
main question here is – are women significantly different from men when it comes to political
decision making and agenda setting?
Considerable work has been done on gender gaps among legislators and gender
differences in policy priorities. Women are perceived to be more concerned about family, health
and children’s issues and other “compassion issues”, rather than military or economic agendas.
(Huddy & Terkildsen, 1993). Based on Canadian evidence Erickson (1997) finds that gender
differences play an important role specially in women’s issues. As evidenced from the above
quote, it is assumed that increased women’s political participation will produce better
1 “Women’s Political participation: the Missing Half of Democracy” – Information Bulletin No. 3, July 1999, USAID Office of Women in Development.
1

development decisions. But very few of these studies have analyzed the actual effect that women
in politics may have on various socio-economic outcomes like health and education, the essential
correlates of development. Our study seeks to fill this important gap.
There is some literature on the impact of women’s political representation on health and
education. Most of these studies have been conducted on the voting behavior of men and women
and not on actual outcomes. Whatever research exists on actual outcomes is concentrated on
individual countries, mainly concerning health (Atkinson et al., 2000, Gleason, 1985,2000; Kar
et al., 1999; Kawachi et al., 1999). But these studies are mostly limited to either a particular
developing country or a cross-section of developed ones, and study only a narrow set of
outcomes. This makes it difficult to generalize the results.
In this paper we investigate the following questions. How does electing more women to the
parliament or having more women in ministerial positions in government affect various health
and education outcomes? Do women’s and girls’ health and education improve relative to men’s
and boys’? Does having women in ministerial positions matter more than having women in
parliament? Does grassroots participation matter? Can increased women’s labor force
participation have any effect on female and child well-being? Does electing more women to
parliament improve government quality? Using cross-country data, we plan to investigate the
impact of women’s political empowerment on various socio-cultural outcomes (infant mortality,
female primary enrolment to name a few) and attitudinal differences. This paper provides a
better insight into the influence of women’s political participation on society and allows us to
generalize the country-specific results of previous research.
2

Section 1: Literature Review
Even though more than a century has passed since New Zealand, in 1893, became the
first nation to offer franchise to women, there is still on average less than 12 percent women
parliamentarians and less than 8 percent women ministers across the globe. But there is a wide
degree of variance among countries. In the Scandinavian countries women’s political
representation ranges from 37 (Denmark)to 43 (Sweden) percent, while in Japan it is only 5
percent. Even in the U.S. women are outnumbered nine to one in the congress and four-to-one in
local and state legislatures (Rule, 1995). There is only a handful of countries where women
constitute 30 percent or more of the legislature. This threshold is important because it is
considered to be the critical mass that is necessary for women in government to make a
difference (UNDP 1995:41). Our study asks the question in spite of it. Does women’s political
representation make a difference, given the fact that this critical mass has not been reached?
Although the focus of our study is not to analyze the underlying determinants of this
“representation gap”, nevertheless, it is important to briefly mention some factors that influence
it. Various authors have studied the causes of women’s under-representation in politics and the
factors that determine the number of female office holders. Social as well as political factors are
important in determining female political representation. Social cultures of patriarchy, or a
“dominant religion is hostile to the advancement of women in the public sphere”(Reynolds,
1990, pp.552) severely hampers the election of women to political office. Women’s educational
attainment and participation in the labor force have also been cited as important determinants.
The political culture of a country such as the ideological position of the government, the number
of coalition partners, party fragmentation, existence of quotas for women and the date of
3

women’s suffrage significantly influence women’s representation (Reynolds, 1999; Kenworthy
& Malami, 1999; Matland, 1998; Rule,1987, Moore & Shackman, 1996, Htun & Jones). Also,
the fact that there are widespread gender difference in attitudes towards and participation in
politics due to social factors (Tedin et. al, 1977) may adversely affect female representation.
However the evidence on the relative importance of these factors in determining the proportion
of women in government is mixed.
Researchers have also focussed attention on the gender based differences in policy
priorities (agenda setting) and policy preferences (legislative voting behavior). But the evidence
found so far is mixed. Women in government have different priorities from their male counter-
parts and engender a co-operative atmosphere rather than a competitive one (Thomas,1994;
Kathleen, 1994; Flammang, 1985). But there is counter evidence that such sex differences in
political procedure and leadership styles may not exists at any significant level (Reingold, 1996).
But such conflicting evidence in leadership styles does not imply that the influence of
women on policy making is the same as their male counterparts. Even though women may be
disadvantaged by their minority status in legislative bodies (Kathlene, 1994), their presence
shapes political agenda differently. Empirical evidence suggests that women’s policy priorities
lie more in areas of social upliftment, women’s rights and family issues (Reingold, 1992;
Thomas & Welch, 1991; Saint-Germain, 1989; Thomas, 1989). As their ranks in legislatures
increase, they are more likely to successfully pass bills relating to women children and family
(Thomas, 1991). Preliminary evidence also suggests that , at least in the short or medium term,
increased presence of women in public life will reduce the levels of corruption (Swamy at al,
2000). As women get rid of their minority status in politics, they are able to successfully push
4
agendas according to their own priorities. Thus increased political representation by women
enhances their influence and their impact on policies (Thomas, 1991)
Our focus of interest, however, is not on the differential voting behavior of women
politicians. Differences in voting may or may not lead to differences in real outcomes. An easy
example is a bill advocating compulsory primary education. Just passing the bill will not achieve
the goal. Concurrent policies that provide more schools and teachers, increase expenditure on
education and the like, are needed to make that bill a reality. Thus in this paper we go beyond
gender differences in voting. Rather we focus on the effect of women’s political representation
on actual heath, education and governance outcomes – an issue that has received limited
attention in the literature, particularly not on a cross-country level. This we believe answers the
long standing claim of women in politics making a difference more directly.
In a study of health care in districts of northeast Brazil, Atkinson et al. (2000) examine
various political and institutional factors that affect the quality of health care. While examining
the various pro and cons of decentralization at the district level they , however, do not consider
the effect of women’s representation on health care quality. Kar et al. (1999) examine the
effectiveness of women and mothers in providing primary healthcare. It is an important issue
because women “tend to place on the well-being of their children and family”. They find that
empowerment of women is an extremely important factor in improving health outcomes.
However, they do not explicitly consider women’s political representation on a macro level. In a
study of Morocco and Tunisia, Obermeyer(1993) finds that a complex interaction of women’s
status in society, education and availability of health facilities determines maternal health. This
raises an interesting issue for our research because increased women’s representation in the
government is both a result and a determinant of these factors.
5

Studies that directly address the question of women’s political participation and health
outcomes are limited. Here we shall briefly summarize the main findings. In a study of the fifty
US states Dixon-Mueller and Germain (1994) find that women’s political participation and
feminist pressure groups can be successful in shaping population policies, although their efficacy
varies between states. However, they do not examine the direct effect of women’s representation
in government on such policies and outcomes.
A paper that directly examines the issue of women’ representation and health outcomes is
Gleason’s (2000) study of India. Disappointingly, she finds that the effect of women’s political
participation on health outcomes is positive but insignificant. However, according to her, this
may be a product of using aggregated districts as an unit of measurement, instead of community
level micro data. Williamson and Boehmer (1997) find supporting evidence that for a cross-
section of less developed countries, when women’s education and the overall development of the
country is controlled for, “of the several dimensions of women’s status, .... the political domain
is the least relevant for predicting cross-national differences in female life expectancy” (pp. 314),
women’s economic status being much more important. A reason may be that women’s economic
status may be the channel through which women in politics affect female life expectancy. It can
be argued that the decisions of women representatives about policies regarding women and child
welfare, serves to uplift women’s economic status, leading to an increase in life expectancy.
But the evidence is not monolithic. Kawachi et al. (1999) find a significant relationship
between women’s participation and female and male health outcomes. Particularly, the paper
finds that the number of women elected to office is significant and negative vis-à-vis male and
female mortality rates. LaVeist (1992) examines the direct effect of greater African American
participation on black child mortality at the community level in the US and finds a significant
6

negative relationship, a greater political participation was associated with lower child mortality.
Like African Americans in the US, women are minorities in government in most countries
around the world. Thus this could have an interesting parallel for our study if we find a similar
effect for women’s representation. Conclusions could be drawn that even without achieving a
critical mass minorities in government can make a difference.
In the literature the effects of women’s political participation and various indicators of
education, like primary and secondary enrolment and attainment, illiteracy to name a few, have
been largely ignored. Of course one can argue that increased female representation is an outcome
and not an explanation for higher levels of women’s education. Later in the paper, we take this
simultaneity into account and show that even accounting for that, women’s representation is an
important determinant of female education, leading us to confirm the hypothesis that female
political representatives are more interested in women’s issues. Previous research on women’s
education suggests additional factors that affect female education. In their cross-country analysis,
Dollar and Gatti (1999) show that gender differences in secondary education attainment can be
explained to a large degree by religious preferences, civil freedom and other region specific
factors. They also find that a convex relationship between income and female secondary
attainment. Filmer (1999) , on the other hand, finds that the existence of a disparity in education
is only weakly related to a country’s income level, economic growth and expenditure of primary
education. Rather regional factors, income inequality and wealth are better predictors of the
gender gap in education.
We believe that our paper bridges a crucial gap – that between conjecture and evidence.
Our analysis provides conclusive evidence about the effect of women’s political representation
on education and health outcomes and governance and women’s status. We also identify the
7

channels through which women parliamentarians influence these outcomes. This gives a
complete picture of how much and in what way increased women’s political representation is
likely to affect social and economic outcomes.
Section 2: Data Issues
The data for the study comes from five main sources : WISTAT - Women’s Indicator
and Statistics Database, 3 and 4 (United Nations), 1975-1999, GDF & WDI - The World Bank,
ICRG – International Country Risk Guide , 1984-1995, and the World Values Survey, 1980,
1991-93, 1995-96, and the Barro-Lee Data Set, 1985. The total data set consists of 180 countries,
although data for many variables are not available for all of the countries. For detailed
information on the variables please refer to the summary statistics table in the appendix (Table
1).
Section 2:1: Key Independent Variable of Interest
The key independent variables of interest are the women’s political participation
measures from WISTAT. Political participation is measured by the percentage of women in
parliament (1975, 1985, 1987, 1990, 1994, 1998), the percentage of women ministers (1994,
1998) and sub-ministers(1994,1998). Figure 1(a) below shows the percentage of women in
parliament from 1975-1999. Women seem to have made significant progress over the last twenty
five years and the average number of women parliamentarians has increased from about 6.5% in
1975 to about 11.5 % in 1999.
Figure 1(b) shows the mean percentage of women ministers and sub-ministers for 1994
and 1998. We find that between these two years, percentage of women in sub-ministerial
positions have increased considerably more than ministerial positions. These political
8

representation numbers imply that on average, women have not reached the critical mass (30 %)
in the government.
Table 1: Determinants of Women’s Political Representation
Dependent Variable Percentage of Women in Parliament, 1994
Constant 5.606 (10.87) 4.919 (11.01)
Number if Years Women Have Been Granted
Suffrage from 1998
0.160 (0.065) 0.164 (0.066)
Proportional Representation Dummy 2.652 (1.545) 2.591 (1.549)
Existence of Quota -1.794 (2.176)
Log GDP, 1985 -0.318 (0.382) -0.275 (0.391)
Income Inequality -0.164 (0.099) -0.156 (0.099)
Percentage Moslem 0.026 (0.022) 0.020 (0.024)
Percentage Women Household Heads 0.374 (0.125) 0.349 (0.131)
Root MSE 5.89 5.92
R-Square 0.506 0.509
Figure 1(b) Percentage of Women in
Ministerial & Sub-Ministerial Positions
02
4
6
8
1 0
1 2 S u b – M i n i s t e r s M i n i s t e r s
1 9 9 4
1 9 9 8
1 9 9 4
1 9 9 8
0
2
4
6
8
10
12
1975
1985 1987
1990 1994
1999
Figure 1(a) Average Percentage of Women in Parliament
9

No. of Observations 65 65
The above table gives an approximate idea about the determinants of women’s political
representation. We find that women’s political representation increases the earlier women were
given suffrage, if the country has proportional representation and as the percentage of women
household heads increase. The last is a particularly interesting result. It implies that as women
gain more economic independence, and are placed in decision making positions in the
household, they tend to elect more women to parliament. This again would be based on the
assumption that women legislators will be more sympathetic towards women’s and family issues
than their male counterparts. Also, as income inequality increases, it has a negative effect on
women’s political representation. Quotas do not have any significant effect on the number of
women in parliament. This is not surprising in light of Htun & Jones’s finding in Latin America
that quotas are more of a “lip service to women’s rights” and are mostly ineffective due to their .
We also do not find any evidence of percentage Moslem or GDP affecting the dependent
variable. This model has been outlined here as a motivation for choosing the right instruments
for women’s political representation in instances where we have to use two stage least square
techniques.
Section 2.2: Dependent Variables of Interest
There are two main groups of outcomes that we study in this paper: health outcomes, and
educational outcomes Based on data availability, the analysis is done at the aggregate level and
broken down by gender.
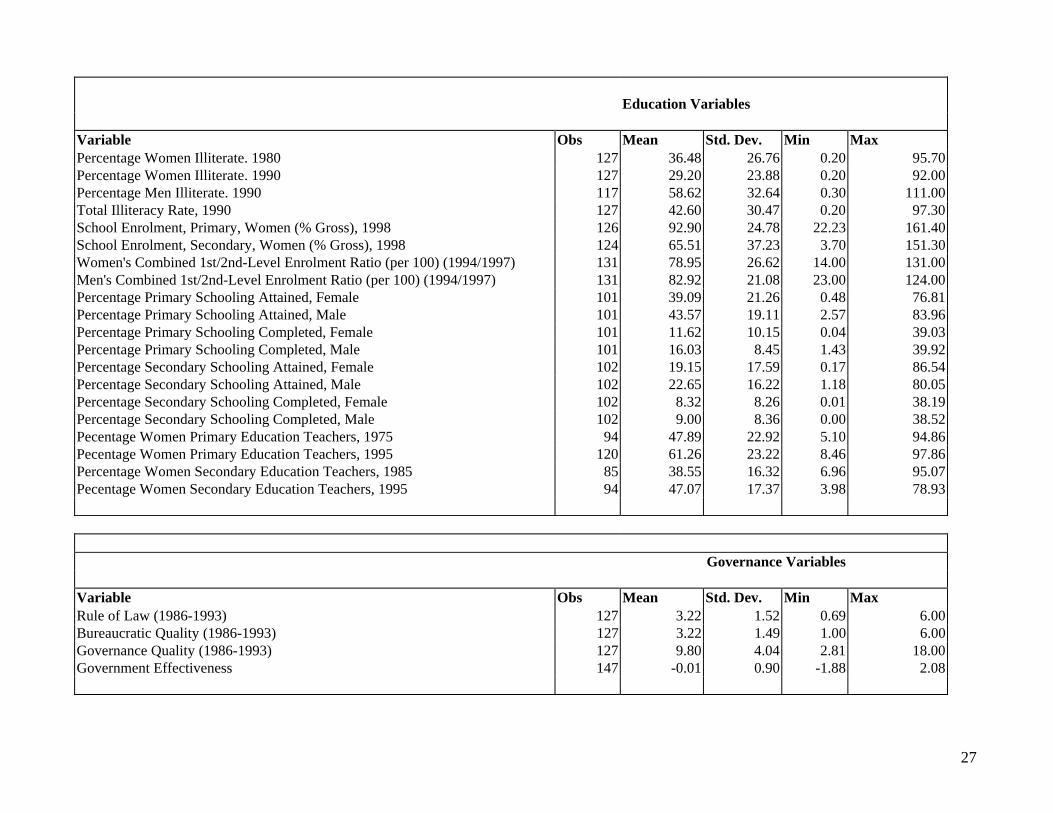
Primary and Secondary enrollment ratios and illiteracy levels are the main educational
indicators studied. We look at attainment figures only vis-a-vis women parliamentarians because
10

the earliest data for ministers is available for 1994. Thus policies passed in 1994 may not have
much effect on school attainment in 1996. Most regions of the world, other than Latin America,
Europe and the OECD countries men have an edge over women. In South Asia the gap is
specially large. As expected, the Sub-Saharan countries fare poorly, but the surprising fact is
that women in these countries fare better than in the South Asian countries. The same pattern is
observed in terms of illiteracy rates in the various regions.
Health outcomes examined here are life expectancy, infant and child mortality and
maternal mortality. We also investigate the channels through which women in parliament affect
these outcomes – for e.g. do their policies increase government or private spending on health or
does it work through more particular channels like increasing the number of hospital beds and
hiring more doctors? The interesting fact that emerges for the heath indicator data is that in all
the regions child mortality is generally higher than infant mortality. Also, the Sub-Saharan and
South Asian countries have significantly higher infant and child mortality rates than other
regions. As expected low income countries (with per annual capita income less that 2000 dollars)
have the highest maternal mortality rates. There is a very slight difference in maternal mortality
rates signifying that once a country reaches a certain stage of development, further increases in
income may not affect this health outcome. Also, life expectancy is considerably less in the poor
countries and almost the same in middle and high income countries. On average, life expectancy
for women is higher than men.
Section 2.3: Control Variables
We use two sets of control variables in our analysis depending on what we are trying to
examine. The first set of controls is common throughout the analysis, no matter what the
dependent variable is. These are the per capita income level of the country, and Gini coefficient
11
measuring the income inequality. The per capita income data is from SIMA. In our estimation
we use log of per capita income (averaged over 1995-1998). The Gini Coefficient if from the
Deninger-Squire dataset. In our analysis we use the average Gini coefficient from 1970-1990.
The authors have two types of data – one they call high quality (where the source is verifiable
and the authors have confidence in the accuracy of the data) and the other is from sources that
cannot be verified. To expand sample coverage, there are seven countries in our sample that are
not from the high-quality data set (Austria, Switzerland, Cuba, Israel, Paraguay, Swaziland,
Uruguay). We checked this subset of data against those published by the UN and found a strong
correlation between the two sets. Also as an additional check in our analysis, where income
inequality id used as a control variable, we estimate the models with and without these countries
and this does not change our results. So in the interest of sample size we include these in our
estimation.
The second control variable set differs according to our dependent variable. For example
when studying infant mortality, we include various types of health spending, like per capita
spending on health, public and private expenditure of health as a percentage of GDP, the
percentage of births attended by trained personnel, the illiteracy rate (total and by gender) and
the like. When estimating the effect of women’s political empowerment on education, we control
for education spending, the percentage of women primary and secondary teachers and the
expenditure per student at the secondary and primary level. Our primary aim is thus to see how
women legislators and ministers affect various education, health and governance outcomes,
controlling for other factors. The next section presents the estimation results of our model.
Section 3
Empirical Analysis
12

This section provides the results of our analysis for the four main outcomes that we are
looking at. The first sub-section outlines the education results, the second deals with the health
outcomes and the third and the fourth are concerned with governance measures and women’s
status respectively. For most cases we use OLS to estimate the equation and report the White
corrected standard error. In cases where there may be a possible endogeneity problem (for
example in some education measures), we use 2SLS to estimate the models. For each model we
estimate several alternative specifications to test the robustness of our results. We use two
measures of women’s political empowerment – the percent of women parliamentarians in 1994
and the percent of women ministers in 1994. In most cases the results are identical so we report
the numbers for the women parliamentarians. Where the coefficients are significantly different,
we report both. Wherever data is available we estimate the models broken down by gender to
examine whether women in power have differential effects on men’s and women’s health and
educational outcomes. If the gender differences are not significant then we report the estimation
results for women only.
Section 3.1: Education Outcomes
(Appendix Table 2(a)-(e))
To examine the effect of women’s political representation on education, we analyze
several different dependent variables like enrolment, attainment and completion. Within
enrolment, we study the gross enrolment ratio for levels 1 and 2 combined and also enrolment in
these levels separately. In the completion and attainment cases we study both primary and
secondary levels. Where ever possible data is broken down by gender. The results are mixed. In
most cases, women in parliament positively and strongly affect enrolment, but mostly do not
have any effect on attainment or completion.
13

Table 2(a) shows that for all alternative specifications, women in parliament have a
significant and positive effect on the combined first and second level enrolment ratio. Comparing
equations 1 and 2 we see that when the percentage of women in parliament increases by 1
percentage point, women combined enrolment ratio increases by 0.44 percent whereas that of
men increases by 0.31. This can be interpreted as evidence that women in parliament pursue
policies that affect women more than men. For all the other specifications, the coefficient of
women in parliament was consistently lower for the men’s enrolment model than the women’s
enrolment one. Another difference is that the percentage of women teachers at the primary level
do not affect men’s enrolment. For the other specifications we do not show the models for men
as the main explanatory variables are not significantly different from equation 2.
In all specifications, per capita income and the percentage of primary level women
teachers has a strong positive effect on combined gross enrolment. A one percent increase in log
per capita income increases women’s combined gross enrolment between 3.5 to 8.3 percent. A
one percent increase in the number of women teachers at the primary level, increases women’s
enrolment between 0.33 to 0.44 percent. This is understandable as parents may be more
comfortable sending their daughters to school if there are more women teachers. Therefore as
expected, the effect of this variable on men’s enrolment is much less, although significant. The
percentage of Moslem population in the country has a significant negative effect on girl’s school
enrolment. For boys, the coefficient is significant at 10 percent. Public education expenditure has
a significant and positive effect on enrolment.
Increasing public education expenditure by 1 percent of GDP, increases women
enrolment by 1.7 to 3.3 percent. Another interesting result for this table is the effect of political
freedom on enrolment. In all specifications, the coefficient is negative and significant. Thus we
14

could argue that as political freedom increases, the government loses its coercive power to
mandate compulsory enrolment. Thus enrolments decrease. From equation 6 we see that not only
does the level of per capita income matter, but also the overall GDP of the country is an
important determinant of women’s school enrolment. Equation 7 shows the model for women
ministers and we see that they affect enrolment in much the same way as women legislators.
Income inequality, colonial history and government quality are not important determinants of
enrolment. Appendix Figure 1 shows the strong positive effect that women in parliament have on
women’s combined gross enrolment ratio.
In table 2(b) we segregate the combined enrolment into its two components – primary
school enrolment and secondary school enrolment. Here we notice the surprising results that
legislators do not have any effect on primary enrolment. Rather the other factors explained above
are more important. But women legislators have a positive and significant effect on girl’s
secondary school enrolment. A one percentage rise in women legislators increases girl’s
secondary school enrolment by 0.58 to 0.93 percent. Another important difference that emerges
is the effect of inequality on enrolment. Income inequality has no effect on primary enrolment
(eqn. 2) but negatively affects secondary enrolment for both boys and girls. An explanation for
this is that for poor families, children’s labor is an important source of income. When children
are young – enrolling them in primary school does not lead to a loss of their labor. work. But as
they grow older, working for money (for boys) or helping their mothers in household chores (for
girls) take precedence over schooling. Thus secondary enrolment is negatively affected.
The political representation of women does not seem to have any effect on women’s
educational attainment or completion, at either the primary or secondary levels (except in one
case, eqn. 4), as seen from Table 2(c). The attainment and completion data is from the Barro-Lee
15
education data set and the latest year available is 1985. Thus for this model we use only women
parliamentarians as data is available as far back as 1975. We report the OLS results for as the
two stage least square results are not significantly different. In only one case the coefficient for
women in parliament is significant at the 10 percent level (equation 4). This implies that a one
percent increase in women in parliament would increase men’s secondary attainment by 0.92
percent while having no effect on women’s attainment, Both primary and secondary educational
attainment and completion is strongly and negatively influenced by the percentage of Moslem
population in the country. Also primary attainment and completion increases as the percentage f
women teachers increase – thee is no such evidence for the secondary level. Income inequality,
where significant, has a negative effect on secondary completion and attainment and primary
completion for both genders This would tie in Filmer & Pritchett’s (1998) findings based on
household survey data, where they find enormous differences in attainment and enrolment
between the rich and the poor, sometimes as much as nine or ten years. Other than primary
attainment, the income level of the country a positive and significant determinant of the other
dependent variables.
Next we wanted to explore the channels through which women legislators affect
educational outcomes. From Table 2(d) we find that women legislators have a positive and
significant effect on both the amount of budget and the ways it is spent. As the percentage of
women in parliament increases, the percentage of public education expenditure, per student
expenditure on both the primary and secondary levels, and percent of women teachers also
increase. A one percent increase in the number of women parliamentarians increases public
education expenditure, and expenditure per student (primary and secondary) by 0.04, 0.21, and
0.24 percent of GNP per capita respectively. The percentage of women teachers increase by 0.44
16
percent. The two-stage least square estimation (eqn. 2) preserves this significance. Women
ministers also have a similar effect.
For all the spending variables, bureaucratic quality and corruption are also important
determinants. Less corruption and better bureaucratic quality leads to a higher educational
expenditure. Both log per capita income and income squared are significant for the level of
public education expenditure. As the per capita income of a country increases, public education
spending increases at first and then falls – this implies that at early stages of development, the
government spends a great deal on education. But as a country develops – the need for such
expenditure diminishes as private pending takes its place. Income is not a significant determinant
of primary education spending per student but is negative and significant for the secondary one.
Again, this can the explained by private education financing obviating the need for public funds.
Also, on average ex-UK colonies spend more public funds on education overall, but colonial
history does not affect the per student expenditure. For the percentage of women primary level
teachers, per capita income has a strong positive effect and illiteracy a negative effect.
To test the robustness of the education outcome models, we estimate the regressions by
alternative techniques and drop certain category of countries. The results ate presented in Table
2(e). For most dependent variables, the results remain unchanged. But primary enrolment and
attainment show interesting results. When the OECD or the Nordic countries are dropped, the
coefficient for women in parliament changes from not significant to significant at 5 and 10
percent respectively. His would argue for the fact that in developing countries women in
parliament have a positive role to play in improving these education outcomes. Universal
primary enrolment may have already been reached for the OECD countries – thus women in
parliament cannot have any effect. But for the developing nations where this upper bound has not
17

been met, more women legislators signify increased primary enrolment. To test the hypothesis
that women parliamentarians can affect primary enrolment in poorer countries, we divided our
sample into developed (greater that $10,000 per capita income) and developing countries (less
than $10,000 per capita income). The coefficient for women legislators and ministers were
positive and significant for the developing nations but not for the developed ones, for both
primary attainment and enrolment.
The overall conclusion that we arrive at from our analysis of educational outcomes is
that, controlling for other factors, women’s political representation affects enrolment more than
attainment or completion. Particularly, they affect secondary enrolment more than the primary
one. This is important as increasing secondary enrolment of girls is a difficult task in most
countries as women are marginalized and their education not considered important. Also, women
in parliament affect the per student expenditure at both the primary and the secondary level and
the percentage of women teachers at the primary level. This last variable as we may remember,
had a strong effect on enrolment and attainment. Thus the coefficient of women in parliament not
being significant in the attainment and completion models does not mean that women politicians
do not affect these outcomes. Rather it means that they affect it through other channels like
increase in the per student expenditure and increasing the number of female teachers. Our
analysis has identified both the direct and indirect influence that women legislators and ministers
have on educational outcomes. We believe there is scope for further research, in identifying the
numerous channels through which women in parliament can affect educational outcomes.
Section 3.2: Health Outcomes
(Appendix Table 3(a)-(d))
18

We study six main health outcomes – life expectancy, infant mortality, child mortality
(children under 5), prevalence of malnutrition among children under five, maternal mortality and
adolescent fertility. Our main finding vis-à-vis these heath indicators is that women’s political
representation does not directly affect them (except for malnutrition). In the tables we present the
figures for women parliamentarians, but the results are not significantly different for ministers.
The chief factors affecting women’s life expectancy (Table 3(a)) are per capita income, literacy,
adolescent fertility and health expenditures and infrastructure. For men, income inequality
affects life expectancy negatively and is significant. In all the alternative specifications, the log
of per capita income is a strong determinant of life expectancy. A one percentage point increase
in log per capita income would imply an increase in life expectancy by 2 to3 years for women
and about 4 years for men. Increase in the illiteracy rate among women decreases their life
expectancy by 0.14 years on average. A one percent increase in adolescent fertility rate decreases
women’s life expectancy by 0.08 years on average and the coefficient is strongly significant.
The coefficient of public expenditure on health is not significant. The private expenditure
on health (as a percentage of GDP) is interesting because it has a gender difference. For
women’s life expectancy, private expenditure is positive and significant at 5 percent, whereas for
men, it is significant at 10 percent. Also a one percent increase in private expenditure increases
men’s life expectancy less (0.93 years) than women’s (1.34 years) (equations 2 & 3). We also
estimated the model by two stage least squares because there may be endogeneity issues. The
results were not significantly different and have been omitted from the table.
Equations 4, 5 and 6 in Table 3(a) studies the main determinants of infant mortality. In
this case too, women’s political representation does not affect infant mortality (Appendix Figure
2 shows the weak relationship between the number of women legislators and infant mortality).
19
Log per capita income is strongly positive with a one percent increase leading to a decrease in
infant mortality by about 8 to 9 per 1000. Income inequality is not important determinants of
infant mortality. As adolescent fertility increases, IMR also increases and the effect is very
significant. This agrees with the generally held view that children born to very young mothers
have a lower survival chance.
The effect of illiteracy is differentiated by gender. Comparing equations 4 nd 5 we find
that men’s illiteracy has no effect on IMR, whereas the coefficient on women’s illiteracy is
positive and significant. This implies that The mothers illiteracy affects the survival of the child
more than the father’s illiteracy. Thus any measure taken to increase women’s education will
decrease infant mortality. Here the role of women parliamentarians is important. Our earlier
analysis has shown the direct and indirect positive effect that women have on women’s
education. Thus women legislators indirectly help in decreasing IMR through increasing
women’s education.
Increase in private expenditure decreases infant mortality, although public health
expenditure has no such effect. Other factors that decrease IMR are the percentage of births
attended by trained personnel and the percentage of population covered by safe water. The above
estimation was done on overall IMR, undifferentiated by gender. We also estimated the model
using IMR by gender and all coefficients remain unchanged in sign and magnitude.
Table 3(b) presents the results for four other health outcomes – child mortality,
malnutrition prevalence among children, maternal mortality and adolescent fertility. Again,
women’s political representation does not seem to be a significant determinant of any of these
outcomes except malnutrition in children. Child mortality (equation 1 & 2) is affected by much
the same factors as infant mortality. A 1 percent increase in log per capita income decreases
20

child mortality by 1.2 to 1.5 percent. Women’s illiteracy affects child mortality more adversely
than total illiteracy rate and adolescent fertility also adversely affects child mortality. The
presence of trained medical personnel at the time of birth decreases child mortality. There was no
significant difference in the coefficients when we estimated the models by gender. As before,
public health expenditure has no effect on child mortality whereas private health expenditure
decreases it.
Controlling for other factors, women parliamentarians have a significant effect on the
malnutrition prevalence among children. A 1 percent increase in women legislators, decreases
malnutrition in children under five by 0.43 percent. Maternal mortality (equation 4), is
unaffected by women legislators or per capita income. Rather income inequality and women’s
illiteracy are stronger determinants. A one point increase in the Gini coefficient and women’s
illiteracy rate increases maternal mortality by 6.5 per 1000 and 7 per 1000 respectively.
Adolescent fertility is unaffected by the percentage of women in parliament and the income level
of the country. Income inequality increases adolescent fertility. Fertility rate among teenagers
decrease with increasing women’s literacy and increased public education spending. Adolescent
fertility has a strong adverse effect on women’s life expectancy, IMR, child and maternal
mortality. The positive and significant coefficient of public education sending suggests that any
policy which increases public spending on education and hence decreases adolescent fertility will
have a positive effect on health outcomes. From table 2(d), we saw that as the percentage if
women in parliament increases, so does public spending on education. Thus women legislators,
indirectly have a positive effect on health outcomes through such channels as education spending
and increasing women’s education.
21
Thus after analyzing the models, we are left with the conclusion that controlling for all
possible factors that may affect health outcomes, women’s political representation does not
significantly affect a majority them directly but act through other channels like increased
education spending. Next we try ti identify these various channels. Some of the control variables
like public expenditure on health, percentage of births attended by trained personnel etc. may be
the ways through which women in parliament and women ministers affect the heath outcomes.
First we estimate the effect of women’s political representation on health spending. If it is true
that women parliamentarians have different priorities than their male counterparts then health
spending should increase. They affect the ways in which the money is spent, as evidenced from
table 3(c).
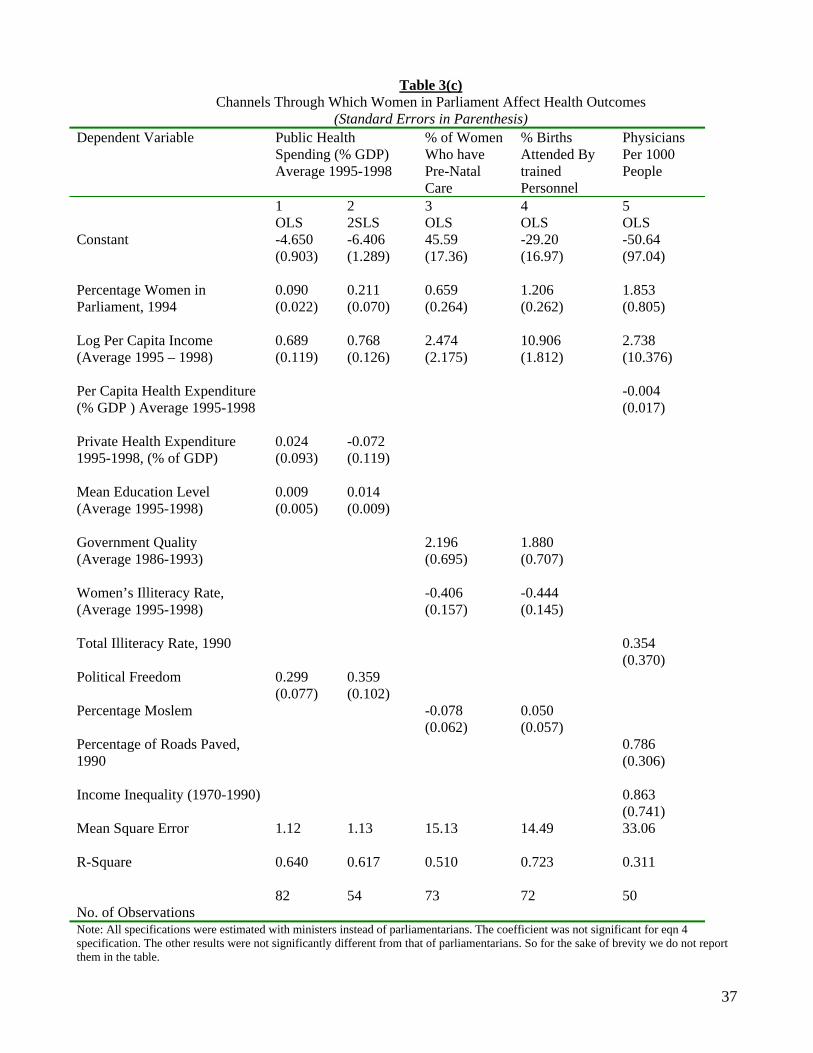
Table 3(c) shows that not only do women parliamentarians affect the amount of public
health expenditure, they also affect the ways in which it is spent. From this table we see that
women legislators have a positive and significant (at 5 percent) effect on the percentage of public
health expenditure, percentage of women who have pre-natal care, percentage of births attended
by trained personnel and the number of physicians. A one percentage point increase in the
number of women in parliament, increases each of the above three outcomes by 0.09, 0.66, 1.21
and 1.85 percent respectively. Ministers have a similar effect on these outcomes (except for
percentage of births attended by trained personnel, where the coefficient was not significant) and
their results are not presented for the sake of brevity. Political freedom and the mean education
level of the country are extremely important factors that affect the percentage of public health
expenditure. As a country’s education level increases, public health spending increases – may be
due to the fact that as the masses become more educated they have more of a voice. Greater
political freedom increases pubic heath spending. There is no evidence of private health spending
22
crowding out public health spending. The two-stage least squares results are similar to those of
OLS(equation 2).
Women’s illiteracy rate and the percentage of Moslem population in the country
adversely affects the percentage of women who receive pre-natal care. Government quality has a
significant positive influence on both the percentage of women who receive pre-natal acre and
the percentage of births attended by trained personnel. For the number of physicians per 1000
people per capita income and the amount of infrastructure (as proxied by the percentage of paved
roads have a positive effect. There is no evidence of per capita health expenditure, total illiteracy
rate or income inequality affecting this variable. We estimated several alternative specifications
for the models above but these results were not significantly different.
Table 3(d) shows what happens to our main variable of interest when we alter estimation
techniques or drop a particular category of countries. Mostly we find that the results remain
unchanged from the benchmark OLS regression and increases our confidence in the results. A
point that should be noted here is that for equations 3 and 4, data is unavailable for the OECD
countries, because pre-natal are and trained personnel attended birth is universal – theefore the
numbers are not reported. When we substitute 100 percent in place of the missing data for the
OEDC countries – the results are unchanged. From the above analysis we can conclude that
although women parliamentarians and ministers do not affect the health outcomes directly, they
do so by means of increased public health spending, their influence on spending allocation
(increasing the number of doctors, pre-natal care and percentage of births attended by trained
personnel) and through increased women’s education..
Conclusion
23
Gender difference in policy preferences have been the subject of much debate in the
literature of women and politics. It has been a long held belief that the priority women legislators
is towards women’s, family and children’s issues. Women parliamentarians and ministers are
seen as more concerned about social issues than their male colleagues. To substantiate the above
claims, studies have analyzed voting patterns of male and female legislators to see if their policy
orientation differs. Results from several studies show that this is indeed the case. But there is
‘many a slip between the cup and the lip’ and different voting patterns do not necessarily imply a
greater impact of women politicians on family and women’s issues. None of these previous
studies make an attempt to go beyond the act of voting and actually study the consequences of
such gender differences in policy orientation. Also most studies are done on single countries or a
small sub-set of them. We believe, our paper makes an important contribution in this respect.
Using cross-country data for a broad sample of developing and developed countries, we show
how women’s political representation affects education and health outcomes, governance and
women’s status.
We find evidence that women legislators positively affect women’s enrolment but not
attainment or completion. Within enrolment most of the effect is concentrated on second level
enrolment. This is important as increasing women’s secondary enrolment is tougher than
increasing their primary one. At the time of primary enrolment, girls may be too young to be
useful around the house and thus parents do not have to sacrifice their labor to send them to
school. But secondary enrolment is a different issue. Enrolling a girl in secondary school implies
a forfeiture of her labor in household duties . Thus increasing women’s secondary enrolment is a
much more difficult prospect. Therefore it is interesting to observe that women in parliament
significantly and positively affect this part. The completion and attainment outcomes are
24

25
determined more by income and cultural factors. Policies can make enrolment mandatory, but
attainment and completion cannot be mandated in such a manner. Thus it is not surprising the
women legislators have no effect on these outcomes. Another result that comes out of our
analysis is that women legislators directly affect the per student expenditure at the primary and
secondary level.
“Gender inequality and discrimination harm girls' and women's health directly and
indirectly, throughout the life cycle; and neglect of their health needs prevents many women
from taking a full part in society.” (UN Report 2000). In this light our findings hold even more
importance. For the health outcomes, although we do not find any direct evidence of women
parliamentarians or ministers affecting the various health outcomes like life expectancy and
infant, child mortality and maternal mortality, we do find strong evidence of women legislators
affecting the other channels through which these indicators are influenced. The most important
finding in this area is that increased women’s representation in parliament increases public health
spending, a direct evidence of women’s concern over family issues. Female legislators also
influence the way in which the health budget is spent – they positively influence the number of
doctors and the percentage of women who receive pre-natal care. Thus better quality and more
effective governance, coupled with women’s concern over social issues, makes women
legislators more effective in ushering in changes where women and children are concerned and
engendering development with a ‘human face’

APPENDIX TABLES
Table 1Summary Statistics
Women's Political Variables
Variable Obs Mean Std. Dev. Min Max
Percentage Women in Parliament, 1975 127 6.45 7.69 0.00 33.20Percentage Women in Parliament, 1985 135 9.10 9.06 0.00 36.92Percentage Women in Parliament, 1994 151 8.58 8.30 0.00 45.83Percentge Women Ministers, 1994 171 6.31 7.42 0.00 43.70No. of Years of Women's Suffrage From 1998 140 49.49 17.81 9.00 105.00
Health Variables
Variable Obs Mean Std. Dev. Min Max
Women's Life Expectancy At Birth (1995-2000) 176 67.81 11.74 38.75 83.55Men's Life Expectancy At Birth (1995-2000) 176 63.10 10.39 35.85 76.97Infant Mortality Rate (per 1000 live births), Female (1998-2000) 167 43.81 37.04 4.00 160.00Infant Mortality Rate (per 1000 live births), Male (1998-2000) 167 50.38 40.53 5.00 179.00Infant Mortality Rate (per 1000 live births), 1998 176 43.95 38.98 3.70 169.50Child (under 5 yrs) Mortality Rate per 1000, 1998 169 66.29 67.81 5.00 284.50Maternal Mortality per 1000, 1994 66 155.15 261.61 3.40 1310.00Percentage of Women (15-49 yr) with Anemia 50 24.32 13.74 3.30 61.90Malnutrition Prevalance (% of Children Under 5 yrs.) 62 25.80 15.90 0.00 62.70Adolescent Fertility (Births Per 1000 Women aged 15-19 yrs) 176 69.74 53.86 2.00 217.00Physcicians Per 1000 People, (Average 1995-1998) 140 61.50 38.32 0.04 100.00Percentage of Births attended By Trained Personnel 124 63.20 30.11 2.00 100.00
Education Variables
Variable Obs Mean Std. Dev. Min Max Percentage Women Illiterate. 1980 127 36.48 26.76 0.20 95.70Percentage Women Illiterate. 1990 127 29.20 23.88 0.20 92.00Percentage Men Illiterate. 1990 117 58.62 32.64 0.30 111.00Total Illiteracy Rate, 1990 127 42.60 30.47 0.20 97.30School Enrolment, Primary, Women (% Gross), 1998 126 92.90 24.78 22.23 161.40School Enrolment, Secondary, Women (% Gross), 1998 124 65.51 37.23 3.70 151.30Women's Combined 1st/2nd-Level Enrolment Ratio (per 100) (1994/1997) 131 78.95 26.62 14.00 131.00Men's Combined 1st/2nd-Level Enrolment Ratio (per 100) (1994/1997) 131 82.92 21.08 23.00 124.00Percentage Primary Schooling Attained, Female 101 39.09 21.26 0.48 76.81Percentage Primary Schooling Attained, Male 101 43.57 19.11 2.57 83.96Percentage Primary Schooling Completed, Female 101 11.62 10.15 0.04 39.03Percentage Primary Schooling Completed, Male 101 16.03 8.45 1.43 39.92Percentage Secondary Schooling Attained, Female 102 19.15 17.59 0.17 86.54Percentage Secondary Schooling Attained, Male 102 22.65 16.22 1.18 80.05Percentage Secondary Schooling Completed, Female 102 8.32 8.26 0.01 38.19Percentage Secondary Schooling Completed, Male 102 9.00 8.36 0.00 38.52Pecentage Women Primary Education Teachers, 1975 94 47.89 22.92 5.10 94.86Pecentage Women Primary Education Teachers, 1995 120 61.26 23.22 8.46 97.86Percentage Women Secondary Education Teachers, 1985 85 38.55 16.32 6.96 95.07Pecentage Women Secondary Education Teachers, 1995 94 47.07 17.37 3.98 78.93
Governance Variables
Variable Obs Mean Std. Dev. Min Max Rule of Law (1986-1993) 127 3.22 1.52 0.69 6.00Bureaucratic Quality (1986-1993) 127 3.22 1.49 1.00 6.00Governance Quality (1986-1993) 127 9.80 4.04 2.81 18.00Government Effectiveness 147 -0.01 0.90 -1.88 2.08
27

Expenditure Variables
Variable Obs Mean Std. Dev. Min Max GDP at Market Prices, 1975 (Constant 1995 US $) 118 23.01 2.29 18.19 29.06GDP at Market Prices, Average (1995-1998) (Constant 1995 US $) 166 23.13 2.38 17.70 29.65GNP Per Capita, 1975 (Constant 1995 US $) 117 7.54 1.55 4.87 10.60GNP Per Capita, (Average 1995-1998)(Constant 1995 US $) 165 7.54 1.59 4.68 10.81Gini Coefficient (1970-1990) 110 40.82 9.40 22.57 63.70Gini Coefficient (1980-1990) 104 39.93 9.46 24.63 60.01Public Spending on Education, Total (% of GNP), 1990 143 10.52 10.49 0.00 79.75Public Spending on Education, Total (% of GNP),Average(1995-1998) 129 4.58 1.87 0.70 9.90Expenditure Per Student, Primary, (% of GNP Per Capita) (Latest Year Avaiable B/N 1980-1985)
106 13.97 7.94 2.82 43.04
Expenditure Per Student, Secondary, (% of GNP Per Capita) (Latest Year Avaiable B/N 1980-1985)
87 27.06 22.41 4.39 112.36
Health Expenditure Per Capita, PPP (Current International $), 1998 124 568.17 710.54 6.00 4010.33Health Expenditure, Private (% of GDP), (Average 1995-1998) 136 2.35 1.55 0.39 7.80Health Expenditure, Public (% of GDP), (Average 1995-1998) 152 3.33 2.03 0.18 10.02Health Expenditure, Total (% of GDP), (Average 1995-1998) 134 5.78 2.45 0.72 13.93Military Spending, (% of Central Government Expenditure)(Average 1995-1998)
167 2.77 6.00 0.40 47.87
Other Variables
Variable Obs Mean Std. Dev. Min Max Percentage of Total Population Covered With Safe Water 146 60.05 34.98 1.00 100.00Percentage of Total Population With Adequate Sanitation 108 44.87 28.58 6.58 100.00Percentage of Paved Rodas (1990) 152 45.64 32.16 0.80 100.00Percentage Moslem in a Country 128 26.14 37.14 0.00 100.00Percentage of Women Household Heads 104 22.44 9.62 4.80 47.10
28
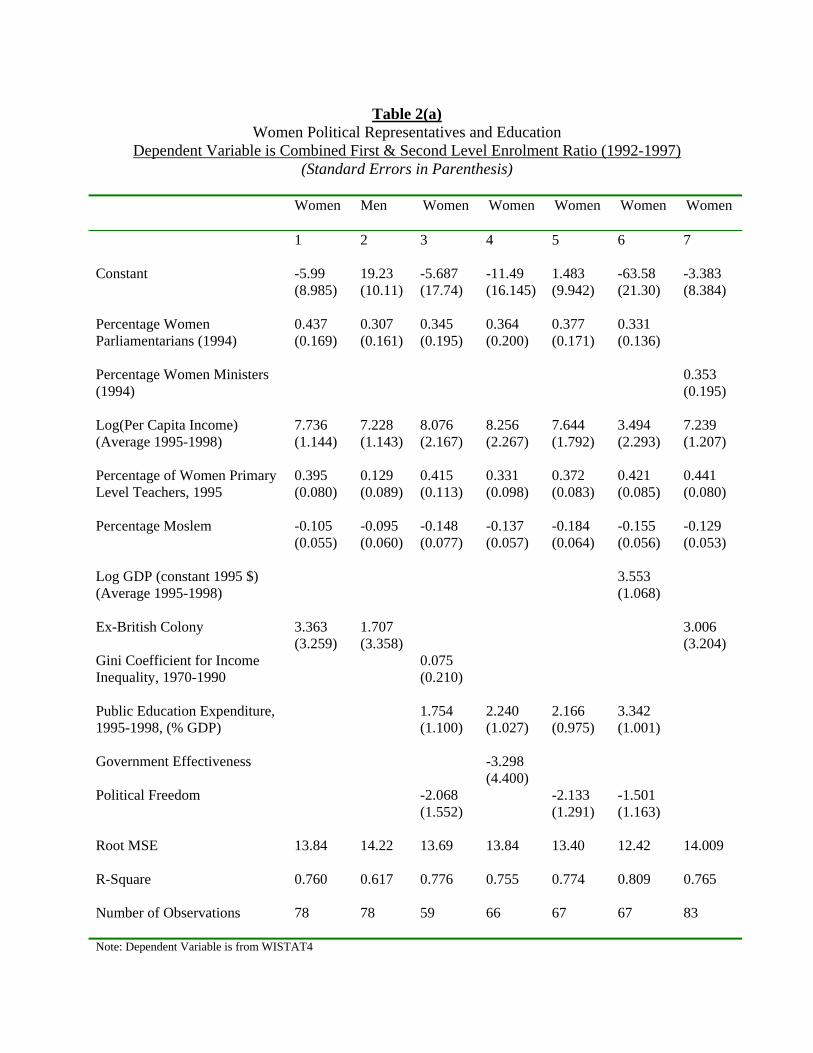
Table 2(a)
Women Political Representatives and Education Dependent Variable is Combined First & Second Level Enrolment Ratio (1992-1997)
(Standard Errors in Parenthesis) Women
Men Women Women Women Women Women
1
2 3 4 5 6 7
Constant
-5.99 (8.985)
19.23 (10.11)
-5.687 (17.74)
-11.49 (16.145)
1.483 (9.942)
-63.58 (21.30)
-3.383 (8.384)
Percentage Women Parliamentarians (1994)
0.437 (0.169)
0.307 (0.161)
0.345 (0.195)
0.364 (0.200)
0.377 (0.171)
0.331 (0.136)
Percentage Women Ministers (1994)
0.353 (0.195)
Log(Per Capita Income) (Average 1995-1998)
7.736 (1.144)
7.228 (1.143)
8.076 (2.167)
8.256 (2.267)
7.644 (1.792)
3.494 (2.293)
7.239 (1.207)
Percentage of Women Primary Level Teachers, 1995
0.395 (0.080)
0.129 (0.089)
0.415 (0.113)
0.331 (0.098)
0.372 (0.083)
0.421 (0.085)
0.441 (0.080)
Percentage Moslem
-0.105 (0.055)
-0.095 (0.060)
-0.148 (0.077)
-0.137 (0.057)
-0.184 (0.064)
-0.155 (0.056)
-0.129 (0.053)
Log GDP (constant 1995 $) (Average 1995-1998)
3.553 (1.068)
Ex-British Colony
3.363 (3.259)
1.707 (3.358)
3.006 (3.204)
Gini Coefficient for Income Inequality, 1970-1990
0.075 (0.210)
Public Education Expenditure, 1995-1998, (% GDP)
1.754 (1.100)
2.240 (1.027)
2.166 (0.975)
3.342 (1.001)
Government Effectiveness
-3.298 (4.400)
Political Freedom
-2.068 (1.552)
-2.133 (1.291)
-1.501 (1.163)
Root MSE
13.84 14.22 13.69 13.84 13.40 12.42 14.009
R-Square
0.760 0.617 0.776 0.755 0.774 0.809 0.765
Number of Observations
78 78 59 66 67 67 83
Note: Dependent Variable is from WISTAT4

30
Table 2(b) Women’s Political Representation and Education
(Standard Errors in Parenthesis)
Dependent Variable
Primary School Enrolment (Gross %)
Secondary School Enrolment (Gross %)
1 2 3 4 Constant
45.64 (17.26)
29.87 (29.58)
-70.82 (12.92)
-38.91 (14.14)
Percentage Women Parliamentarians (1994)
0.033 (0.242)
0.170 (0.255)
0.934 (0.216)
0.576 (0.297)
Log(Per Capita Income), 1995-1998
4.807 (2.296)
5.445 (2.821)
13.910 (2.268)
15.00 (2.458)
Percentage Moslem
-0.190 (0.094)
-0.172 (0.110)
-0.060 (0.060)
-0.099 (0.060)
Public Education Expenditure, 1995-1998, (% GDP)
2.682 (1.424)
1.281 (1.608)
0.402 (1.069)
1.323 (0.962)
Percentage of Women Primary Level Teachers, 1990
0.230 (0.122)
0.292 (0.155)
Percentage of Women Secondary Level Teachers, 1995
0.419 (0.170)
0.456 (0.202)
Political Freedom
-2.503 (2.030)
-2.984 (2.389)
0.830 (1.506)
-1.634 (1.345)
Gini Coefficient for Income Inequality (Average 1970-1990)
0.388 (0.320)
-0.772 (0.229)
Root MSE
18.60 18.40 16.26 15.81
R-Square
0.441 0.471 0.817 0.836
No. Of Observations
64 55 53 46
Note: Dependent variables are from the WDI database. When percentage of women ministers are used instead of parliamentarians, the results are not significantly different. We use 1995 figures for women secondary teachers as data for 1990 is scant. We also tried other specifications that were used in Table 2(a). None of the alternative specifications made any difference to our results. We also estimated a 2SLS model and again, the results were not significantly different. We did not report the 2SLS results as we do not believe that there are endogeneity issues as far as enrolment from 1995-1998 and percentage of women in parliament in 1994 are concerned.

31
Table 2(c) Women’s Political Representation and Education
Dependent Variable is Educational Attainment & Completion (Standard Errors in Parenthesis)
Dependent Variable Percentage of "primary schooling attained"
Percentage of "secondary schooling attained"
Percentage of "primary schooling completed"
Percentage of "secondary schooling completed"
Women Men Women Men Women Men Women Men 1 2 3 4 5 6 7 8 Constant
-0.977 (36.46)
87.88 (30.51)
-39.95 (24.81)
-48.75 (20.60)
-42.81 (11.13)
-10.02 (13.14)
-15.38 (10.45)
-27.20 (7.715)
Percentage Women in Parliament (1975)
0.669 (0.623)
0.048 (0.475)
0.519 (0.695)
0.919 (0.573)
-0.268 (0.229)
-0.330 (0.189)
0.139 (0.290)
-0.052 (0.217)
Log GDP 1975
0.745 (1.286)
-2.284 (1.109)
2.837 (0.922)
3.153 (0.745)
2.188 (0.464)
0.913 (0.476)
1.130 (0.388)
1.579 (0.357)
Gini Coefficient for Income Inequality
0.140 (0.152)
0.053 (0.177)
-0.228 (0.173)
-0.225 (0.156)
-0.064 (0.044)
0.087 (0.069)
-0.110 (0.069)
-0.094 (0.043)
Percentage Moslem
-0.232 (0.065)
-0.280 (0.070)
-0.111 (0.041)
0.010 (0.039)
-0.040 (0.027)
-0.083 (0.032)
-0.046 (0.018)
0.030 (0.019)
Percentage of Women Primary Level Teachers, 1985
0.377 (0.104)
0.282 (0.140)
0.150 (0.048)
0.084 (0.056)
Percentage of Women Secondary Level Teachers, 1985
0.058 (0.974)
0.073 (0.087)
0.052 (0.048)
0.048 (0.048)
Root MSE
13.72 14.22 10.97 9.81 6.98 7.50 4.77 5.01
R Square
0.589 0.474 0.569 0.592 0.588 0.332 0 569 0.516
No. of Observations 43 43 38 38 54 54 38 38 Note: We performed 2SLS regressions as there may be endogeneity problems regarding attainment and completion and the number of women in parliament. Except for two equation, the Results remained unchanged. Performing 2SLS leads to a drop in the sample by almost one-third. Thus we report the OLS results here. The models that gave different results under the two Estimation procedure was equation 6 & 8. For equation 5, the OLS reports a negative and significant coefficient for percentage of women in parliament, but is insignificant for the 2SLS model. For equation. 8 the coefficient of percentage f women in parliament was negative and significant for the 2SLS model.

32
Table 2(d)
Women’s Political Representation and Channels of Influence (Standard Errors in Parenthesis)
Public Education Expenditure,
(Average 1995-1998), (% GDP)
Expenditure Per Student (% GNP per capita), Primary
Expenditure Per Student (% GNP per capita), Secondary
% Women Primary Teachers 1995
1 2 3 4 5 6 OLS 2SLS
OLS OLS OLS OLS
Constant
-13.291 (5.508)
-20.84 (6.53)
-14.20 (5.182)
4.020 (4.943)
56.27 (21.93)
42.04 (14.51)
Percentage Women Parliamentarians
0.043 (0.021)
0.100 (0.053)
0.209 (0.075)
0.237 (0.180)
0.437 (0.156)
Percentage Women Ministers (1994)
0.051 (0.021)
Log(Per Capita Income)
3.812 (1.373
5.675 (1.667)
4.079 (1.297)
0.138 (0.836)
-7.962 (3.470)
4.120 (1.663)
Log(Per Capita Income) Squared
-0.248 (0.088)
-0.366 (0.110)
-0.264 (0.083)
Ex-UK Colony
0.815 (0.376)
1.067 (0.487)
0.785 (0.367)
-1.746 (1.552)
-0.022 (4.225)
Bureaucratic Quality (Average 1986-1993)
0.253 (0.184)
0.612 (0.251)
0.289 (0.187)
1.301 (0.676)
6.426 (2.594)
Corruption (Average 1986-1993)
0.635 (0.189)
0.290 (0.252)
0.561 (0.192)
1.043 (0.964)
0.856 (2.460)
Percentage Moslem
-0.034 (0.048)
Female Illiteracy Rate, 1975
-0.482 (0.089)
Root MSE
1.47 1.42 1.48 6.38 11.34 13.11
R-Square
0.403 0.514 0.398
0.355 0.263 0.685
No. Of Observations
91 59 93 78 58 60
Note: When the dependent variable is average public education expenditure 91995-1998), the women in parliament and ministers data is from 1994. The expenditure per student data if from the latest year available between 1980-1995, for better coverage. For this, the parliamentary figures are from 1985. Data for women ministers is only available for 1994. In that case the expenditure per student variable was from the latest year between 1993 and 1995. The results were not significantly different from the above, and so have been excluded for the sake of brevity. As alternative specifications we included as controls, the level of political freedom, country GDP, ethnic composition and the colonial history of the country. None of these were significant

33
Table 2(e) Summary Table Showing the Coefficient for Percentage Women in Parliament for Alternative
Specifications (Standard Errors are in Parenthesis)
Dependent Variable (For Women)
Combined 1st & 2nd Level Gross Enrolment Ratio
Primary School Enrolment (% Gross)
Secondary School Enrolment (% Gross)
Table 2(a) Eqn. 5 Table 2(b) Eqn. 1 Table 2(b) Eqn. 3 “**” denotes significance at 10 percent, and “*” denotes significance at 5 percent, Coefficient Obs Coefficient Obs Coefficient Obs
OLS Benchmark
0.377 ** (0.171)
67 0.033 (0.242)
64 0.934 ** (0.216)
53
Robust Regression
0.311 * (0.202)
67 -0.014 (0.300)
64 1.002 ** (0.298)
53
Median Regression
0.314 * (0.190)
67 0.005 (0.170)
64 1.025 ** (0.362)
53
OECD Countries Dropped
0.584 * (0.321)
52 1.072 * (0.549)
49 0.827 ** (0.250)
39
Nordic Countries Dropped
0.388 * (0.251)
63 0.561 * (0.381)
60 0.792 ** (0.251)
50
Endogenous Variables Dropped
0.501 ** (0.230)
97 0.105 (0.248)
64 1.173 ** (0.424)
53
Dependent Variable (For Women)
Percentage “Primary Schooling Attained”
Percentage “Secondary Schooling Attained”
Percentage “Primary Schooling Completed”
Table 2(c) Eqn. 1 Table 2(c) Eqn. 3 Table 2(c) Eqn. 5 Coefficient Obs Coefficient Obs Coefficient Obs
OLS Benchmark
0.669 (0.623)
43 0.519 (0.695)
38 -0.268 (0.229)
54
Robust Regression
0.917 (0.471)
43 0.686 (0.603)
38 -0.242 (0.198)
54
Median Regression
0.760 (0.648)
43 1.121 (0.767)
38 -0.084 (0.306)
54
OECD Countries Dropped
2.805 ** (0.628)
29 0.653 (0.626)
28 -0.284 (0.196)
38
Nordic Countries Dropped
2.284 ** (0.654)
40 0.286 (0.707)
37 -3.11 (0.242)
50
Endogenous Variables Dropped
0.440 (0.442)
43 -0.053 (0.632)
48 -0.092 (0.247)
65

34
Table 2(e) (continued) Summary Table Showing the Coefficient for Percentage Women in Parliament for Alternative
Specifications (Standard Errors are in Parenthesis)
Dependent Variable (For Women)
Percentage “Primary Schooling Completed
Public Education Expenditure,
Expenditure Per Student (% GNP per capita), Primary
Table 2(c) Eqn. 7 Table 2(d) Eqn. 1 Table 2(d) “**” denotes significance at 10 percent, and “*” denotes significance at 5 percent, Coefficient Obs Coefficient Obs Coefficient Obs
OLS Benchmark
0.139 (0.290)
38 0.043 ** (0.021)
91 0.209 ** (0.075)
78
Robust Regression
0.198 (0.268)
38 0.050 ** (0.024)
91 0.285 ** (0.073)
78
Median Regression
0.247 (0.413)
38 0.066 ** (0.033)
91 0.288 ** (0.113)
78
OECD Countries Dropped
0.221 (0.309)
28 -0.024 (0.044)
71 0.156 (0.119)
58
Nordic Countries Dropped
0.106 (0.310)
37 0.005 (0.028)
86 0.217 ** (0.104)
73
Endogenous Variables Dropped
-0.096 (0.257)
48 0.028 * (0.019)
91 0.220 ** (0.088)
87
Dependent Variable (For Women)
Expenditure Per Student (% GNP per capita), Secondary
% Women Primary Teachers 1995
Table 2(d) Table 2(d) Coefficient Obs
Coefficient Obs
OLS Benchmark
0.237 (0.180)
58 0.437 ** (0.156)
60
Robust Regression
0.209 * (0.123)
58 0.425 * (0.255)
60
Median Regression
0.198 (0.165)
58 0.299 (0.210)
60
OECD Countries Dropped
0.214 (0.279)
38 0.416 ** (0.152)
57
Nordic Countries Dropped
0.189 (0.266)
53 - -
Endogenous Variables Dropped
-0.002 (0.248)
64 0.363 ** (0.171)
63

35
Table 3(a)
Women Legislators and Life Expectancy (Standard Errors in Parenthesis)
Life Expectancy (Average 1995-1998)
Infant Mortality (Average 1995 – 1998)
Women Men 1 2 3 4 5 6 Constant
45.09 (10.03)
55.99 (7.67)
42.85 (8.37)
94.01 (20.61)
107.98 (24.88)
124.40 (22.49)
Percentage Women Parliamentarians (1994)
0.061 (0.125)
0.066 (0.092)
0.065 (0.116)
-0.170 (0.407)
0.040 (0.190)
-0.024 (0.427)
Log (Per Capita Income) (Average 1995-1998)
3.874 (1.233)
2.700 (1.022)
4.117 (0.800)
-8.562 (2.952)
-9.207 (2.700)
-9.272 (2.809)
Gini Coefficient for Income Inequality (Average 1970-90)
-0.102 (0.113)
-0.098 (0.102)
-0.210 (0.079)
0.159 (0.264)
0.071 (0.278)
Total Illiteracy, 1990
-0.130 (0.041)
-0.081 (0.037)
Women’s Illiteracy (Average 1995-1998)
-0.136 (0.058)
0.425 (0.132)
0.321 (0.130)
Men’s Illiteracy (Average 1995-1998)
-0.013 (0.054)
Public Health Expenditure Average 1995-98 (% GDP)
-0.020 (0.631)
0.227 (0.563)
-0.245 (0.528)
0.646 (1.926)
0.553 (2.254)
Private Health Expenditure Average 1995-98 (% GDP)
1.342 (0.508)
0.932 (0.540)
-2.826 (1.468)
-3.673 (1.542)
-1.097 (1.335)
Adolescent Fertility
-0.078 (0.034)
0.184 (0.078)
0.275 (0.067)
0.125 (0.064)
Percentage of Roads Paved, 1990
0.065 (0.036)
Percentage of Population Covered By Safe Water
-0.165 (0.068)
-0.180 (0.082)
-0.048 (0.074)
Percentage of Births attended By Trained Personnel
-0.314 (0.123)
Root MSE 6.46 5.70 6.06 14.53 15.20 15.29 R-Square 0.721 0.765 0.643 0.818 0.809 0.795 Number of Observations 64 70 70 68 71 72 Note: We present only one result for male life expectancy as there is no significant difference between the effects of the explanatory variables on men’s and women’s life expectancy. We also considered the effect of government quality and democracy of life expectancy for the women’s and men’s life expectancy models, both were insignificant. The 2SLS estimation results were not significantly different.. For infant mortality, we tried other variables like percentage of paved roads, , government effectiveness, political freedom, colonial history and number of doctor and hospital beds per 1000 – none were significant.

Table 3(b)
Women Legislators & Other Indicators of Women & Children’s Health (Standard Errors in Parenthesis)
Dependent Variable Child Mortality Malnutrition
Prevalence Maternal Mortality
Adolescent Fertility
1 2 3 4 5 Constant
162.11 (38.26)
100.95 (59.51)
112.34 (17.05)
-447.92 (227.38)
180.45 (40.81)
Percentage Women Parliamentarians (1994)
0.553 (0.720)
-0.153 (0.854)
-0.425 (0.222)
6.776 (6.178)
-0.411 (0.555)
Log (Per Capita Income), (Average 1995-1998)
-15.444 (4.945)
-12.983 (7.189)
-8.890 (1.968)
26.619 (28.646)
-20.462 (3.629)
Gini Coefficient for Income Inequality (Average 1970-1990)
0.303 (0.630)
-0.279 (0.234)
6.217 (3.811)
1.035 (0.359)
Total Illiteracy Rate, 1990
0.591 (0.219)
Women’s Illiteracy Rate (Average 1995 – 1998)
0.728 (0.255)
-0.036 (0.150)
7.403 (1.589)
1.059 (0.265)
Adolescent Fertility
0.416 (0.119)
0.503 (0.165)
-1.072 (1.219)
Public Health Expenditure 1995-1998, (% GDP)
0.591 (3.271)
1.136 (4.237)
-2.498 (1.158)
-5.933 (21.897)
Private Health Expenditure 1995-1998, (% GDP)
-5.713 (3.862)
-1.169 (1.356)
Percentage of Births Attended By Trained Physicians
-0.453 (0.233)
-0.385 (0.405)
Percentage Women Who Have Pre-Natal Care
0.377 (0.388)
Percentage of Total Population Covered By safe Water
-0.081 (0.169)
Percentage Moslem
-0.263 (0.098)
Public Education Spending (% GDP) (Average 1995 – 1998)
-2.641 (1.906)
R-Square
0.762 0.769 0.555 0.489 0.733
Number of Observations
83 57 39 34 67
36
Note: Alternative specifications were tried for each dependent variable and did not significantly change any result. We also used child mortality by gender as a dependent variable and the results were identical to the overall child mortality.
37
Table 3(c) Channels Through Which Women in Parliament Affect Health Outcomes
(Standard Errors in Parenthesis) Dependent Variable
Public Health Spending (% GDP) Average 1995-1998
% of Women Who have Pre-Natal Care
% Births Attended By trained Personnel
Physicians Per 1000 People
1 2 3 4 5 OLS 2SLS OLS OLS OLS Constant
-4.650 (0.903)
-6.406 (1.289)
45.59 (17.36)
-29.20 (16.97)
-50.64 (97.04)
Percentage Women in Parliament, 1994
0.090 (0.022)
0.211 (0.070)
0.659 (0.264)
1.206 (0.262)
1.853 (0.805)
Log Per Capita Income (Average 1995 – 1998)
0.689 (0.119)
0.768 (0.126)
2.474 (2.175)
10.906 (1.812)
2.738 (10.376)
Per Capita Health Expenditure (% GDP ) Average 1995-1998
-0.004 (0.017)
Private Health Expenditure 1995-1998, (% of GDP)
0.024 (0.093)
-0.072 (0.119)
Mean Education Level (Average 1995-1998)
0.009 (0.005)
0.014 (0.009)
Government Quality (Average 1986-1993)
2.196 (0.695)
1.880 (0.707)
Women’s Illiteracy Rate, (Average 1995-1998)
-0.406 (0.157)
-0.444 (0.145)
Total Illiteracy Rate, 1990
0.354 (0.370)
Political Freedom
0.299 (0.077)
0.359 (0.102)
Percentage Moslem
-0.078 (0.062)
0.050 (0.057)
Percentage of Roads Paved, 1990
0.786 (0.306)
Income Inequality (1970-1990) 0.863 (0.741)
Mean Square Error
1.12 1.13 15.13 14.49 33.06
R-Square
0.640 0.617 0.510 0.723 0.311
No. of Observations
82 54 73 72 50
Note: All specifications were estimated with ministers instead of parliamentarians. The coefficient was not significant for eqn 4 specification. The other results were not significantly different from that of parliamentarians. So for the sake of brevity we do not report them in the table.

38
Table 3(d)
Summary Table Showing the Coefficient for Percentage Women in Parliament for Alternative Specifications (Standard Errors are in Parenthesis)
Dependent Variable
Public Health Spending (% GDP) Average 1995-1998
% of Women Who have Pre-Natal Care
% Births Attended By trained Personnel
Physicians Per 1000 People
Table 3(c), Eqn. 1 Table 3(c), Eqn. 2 Table 3(c), Eqn. 3 Table 3(c), Eqn. 4
Coefficient Obs Coefficient Obs Coefficient Obs Coefficient Obs
OLS Benchmark
0.090 ** (0.022)
82 0.659 ** (0.264)
73 1.206 ** (0.262)
72 1.853 ** (0.805)
50
Robust Regression
0.084 ** (0.024)
82 0.643 * (0.364)
73 1.412 ** (0.306)
72 1.955 ** (0.939)
50
Median Regression
0.072 ** (0.026)
82 0.493 * (0.337)
73 1.387 ** (0.482)
72 1.995 * (1.162)
50
OECD Countries Dropped
0.062 ** (0.023)
72 - - - - 1.717 ** (0.858)
47
Nordic Countries Dropped
- - - - - -
Endogenous Variables Dropped
0.061 ** (0.027)
91 0.427 * (0.265)
77 0.540 ** (0.288)
80 1.428 ** (0.677)
58
In some cases there were OECD or Nordic countries in the sample in the original regression depending on data availability. “**” denotes significance at 5 percent
and “*”denotes significance at 10 percent.
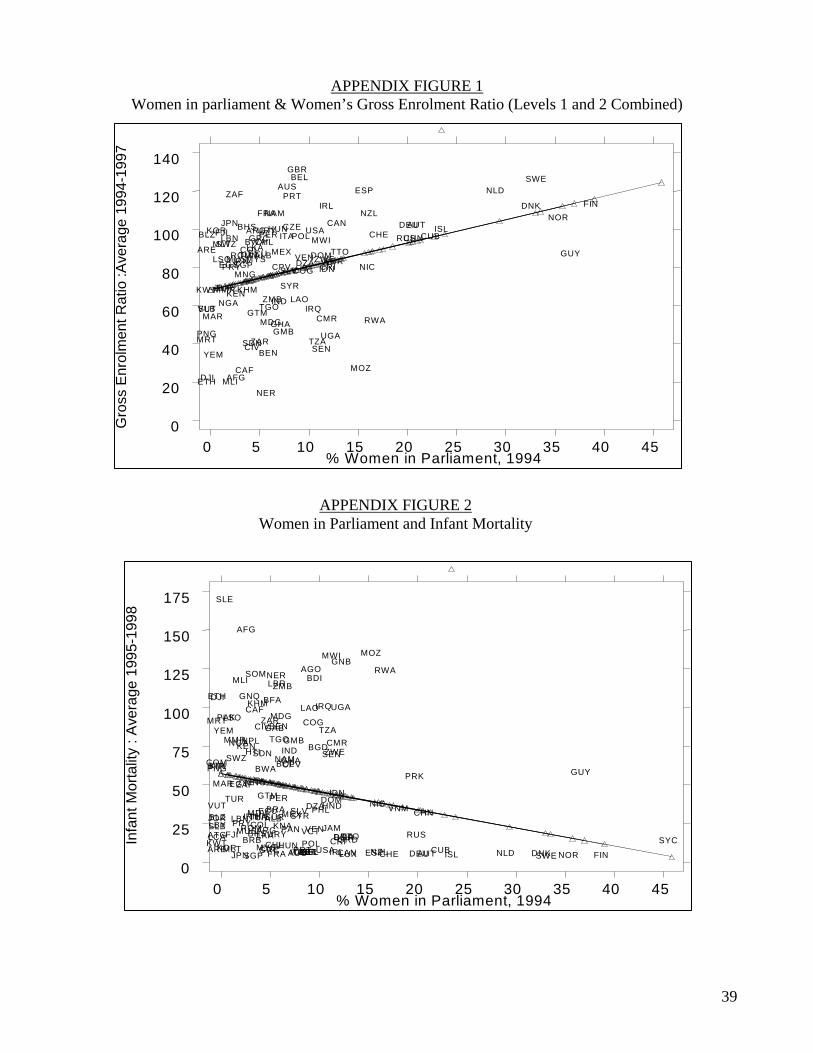
APPENDIX FIGURE 1 Women in parliament & Women’s Gross Enrolment Ratio (Levels 1 and 2 Combined)
G
ross
Enr
olm
ent R
atio
:Ave
rage
199
4-19
97
% Women in Parliament, 19940 5 10 15 20 25 30 35 40 45
0
20
40
60
80
100
120
140
AFG
ALBARE
ARG
AUS
AUT
BEL
BEN
BGR
BHSBLZ
BWA
CAF
CANCHE
CHL CHN
CIV
CMR
COG
COL
CPV CRI
CUBCZE DEU
DJI
DNK
DOMDZA
ECUEGY
ESP
ETH
FIN
FJI
FRA
GBR
GHAGMB
GRC
GTM
GUY
HUN
IDN
IND
IRL
IRN
IRQ
ISLITA
JPN
KENKHM
KOR
KWTLAO
LBNLKA
LSO
MARMDG
MEX
MLI
MLT
MMR
MNG
MOZ
MRT
MUS
MWI
MYS
NAM
NER
NGA
NIC
NLD
NORNZL
PER
PNG
POL
PRT
PRYROM
RUS
RWA
SDNSEN
SGP
SLB
SLV
SWE
SWZ
SYR
TGO
TTOTUN
TUR
TZAUGA
URY USA
VEN
VUT
YEM
ZAF
ZAR
ZMB
ZWE
APPENDIX FIGURE 2 Women in Parliament and Infant Mortality
Infa
nt M
orta
lity
: Ave
rage
199
5-19
98
% Women in Parliament, 19940 5 10 15 20 25 30 35 40 45
0
25
50
75
100
125
150
175
AFG
AGO
ALB
ARE
ARGATG
AUS AUT
BDI
BEL
BEN
BFA
BGD
BGRBHS
BLZ
BOL
BRA
BRB
BTN BWA
CAF
CAN CHECHL
CHN
CIV
CMR
COG
COL
COM CPV
CRICUBCYP CZE DEU
DJI
DMA
DNK
DOMDZAECU
EGY
ESP
ETH
FIN
FJI
FRA
GAB
GBR
GHA
GMB
GNB
GNQ
GRCGRD
GTM
GUY
HND
HTI
HUN
IDN
IND
IRL
IRN
IRQ
ISLISRITA
JAMJOR
JPN
KEN
KHM
KIR
KNA
KORKWT
LAO
LBN
LBR
LBYLCA LKA
LSO
LUX
MAR
MDG
MDV MEX
MLI
MLT
MMR
MNG
MOZ
MRT
MUS
MWI
MYS
NAM
NER
NGA
NIC
NLD NOR
NPL
NZL
PAK
PAN
PERPHL
PNG
POL
PRK
PRT
PRYROMRUS
RWA
SDN SEN
SGP
SLB
SLE
SLV
SOM
SUR
SWE
SWZ
SYC
SYR
TGO
THA
TTO
TUN
TUR
TZA
UGA
URY
USA
VCTVEN
VNMVUT
YEM
ZAF
ZAR
ZMB
ZWE
39

Bibliography Atkinson, S., Medeiros, R. L. R., Henrique, P. Oliviera, L. & Almeida, R. D. de “Going Down to the Local: incorporating Social Organization and Political Culture into Assessments of Decentralised Health Care”, Social Science and Medicine, Vol. 51, 2000, pp. 619-636. Erickson, Lynda – “Might More Women make a Difference? Gender, Party and Ideology Among Canada’s Parliamentary Candidates”, Canadian journal of Political Science, Vol. 30, no. 4, 1997, pp. 663-688. Filmer, Deon – “The Structure of Social Disparities in Education: Gender and Wealth”, Gender and Development Working paper No. 5, 1999. Filmer, Deon & Pritchett, Lant – “The Effect of Household Wealth on Educational Attainment Around the World: Demographic and Health Survey Evidence”, World Bank Policy Research Working paper No. 1980, 1998. Flammang, Janet – “Female Officials in the Feminist Capital: The Case of Santa Clara County”, Western Political Quarterly, Vol. 38, 1985, pp. 94-118. Gleason, Susan – “Female Political Participation in India: Determinants and Impact on Health outcomes”, Draft, June 2000 Gleason, Susan – “The Determinants o Male/Female Survival in India: theory and Evidence”, Draft, November, 1995. Htun, Mala N. & Jones, Mark P. – “Engendering the Right to Participate in Decision making: Electoral Quotas and Wmen’s Leadership in Latin America”, Draft Huddy, Leonie & Terkildsen, Nayda – “Gender Stereotypes and the Perceptiom of Male and Female Candidates”, American Journal of Political science, Vol. 37, no. 1, 1993, pp. 119-147. Kar, S. B., Pascual, C. A. & Chickering, K. L. – “Empowerment of Women for Health Promotion: A Meta-Analysis”, Social Science and Medicine, Vol. 49, 1999, pp. 1431-1460. Kathleen, Lyn – “Power and Influence in State Legislative Policymaking: The Interaction of Gender and Position in Committee Hearing Debates”, The American Political Science Review, Vol. 88, no. 4, 1994, pp. 56-576. Kawachi, I., Kennedy, B. P., Gupta, V. & Prothrow-Stith, D. – “Women’s Status and the Health of Women and Men: A View from the States”, Social Science and Medicine, Vol. 48, 1999, pp.21-32. Matland, Richard E. – “Women’s representation in National Legislature: Developed and Developing Countries”, Legislative Studies Quarterly, Vol. 23, 1998, pp. 109-125. Obermeyer, Carla, M. – “Culture, Maternal Health Care, and Women’s Status: A Comparison of Morocco and Tunisia”, Studies in Family Planning, Vol. 24, no. 6, 1993, pp. 354-365.
Reingold, Beth – “Concepts of Representation Among Female and Male State Legislators”, Legislative Studies Quarterly, Vol. 17, 1992, pp. 509-537. Reingold, Beth – “Conflict and Cooperation: Legislative Strategies and Concepts of Power Among Female and Male Legislators”, The Journal of Politics, Vol. 58, no. 2, 1996, pp. 464-485.
40

Reynolds, Andrew – “Women in the Legislatures and Executives of the World – Knocking at the Highest Glass Ceiling”, World Politics, Vol. 51, 1999, pp. 54-572. Rule, Wilma – “Why Women Should Be Included in the Voting Rights Act”, National Civic Review, Vol. 84, 1995, pp. 355-368. Rule, Wilma – “Electoral Systems, Contextual Factors and Women’s Opportunity for Election to Parliament in Twenty-Three Democracies”, Western Political Quarterly, Vol. 40, 1987, pp. 477-498. Saint-Germain, Michelle, A – “Does Their Difference Make a Difference? The Impact of Women on Public Policy in the Arizona State Legislature”, Social Science Quarterly, Vol. 70, 1989, pp. 956-968. Stockard, J, Van de Kragt, A. J. C & Dodge, P “Gender Roles and Behavior in Social Dilemmas: Are There Sex Differences in Cooperation and its Justification?”, Social Psychology Quarterly, Vol 51, no. 2, 1988, pp. 154-163. Swamy, A., Knack, S., Lee, Y & Azfar, O – “Gender and Corruption”, Journal of Development Economics, Forthcoming (2000). Tedin, Kent L., Brady, David W., & Vedlitz, Arnold – “Sex Differences in political Attitudes and Behavior: The Case for Situational Factors”, The Journal of Politics, Vol. 39, no. 2, 1977, pp. 448-456. Thomas, Sue – “How Women Legislate”, New York, Oxford University Press, 1994 Thomas, Sue – “The Impact of Women on State Legislative Politics”, Journal of Politics, Vol. 53, no. 4,1991, pp. 958-976. Thomas, Sue – “Voting Patterns in the California Assembly: The Role of Gender”, Women and Politics, Vol. 9, 1989, pp. 43-53. Thomas, Sue & Welch, Susan – “The Impact of Gender on Activities and Priorities of State Legislators” Western Political Quarterly, 1991. United Nations, 2000 – “The State of World Population, 2000 - Living Together, Worlds Apart” UN Population Funds Report, 2000 United Nations, 1995 – “The World’s Women”, 1995, New York, United Nations. USAID– “Women’s Political Participation: The Missing Half of Democracy”, U.S. Agency for International Development, Office of Women in Development, Information Bulletin No. 3, July 1999. World Bank Policy Research Report, 2000 – “Engendering Development”, The World Bank Policy research report on Gender and Development, May, 2000.
41


