52
Making a difference to patients with diabetes A joint working programme with Health Education West Midlands

Making a difference to patients with diabetes
A joint working programme with Health Education West Midlands

Housekeeping
• Fire exits
• Fire alarm testing
• Location of refreshments during breakouts
• Toilets

What are you going to be doing today?

Goal
To engage with 500 people to make 1,000 positive differences to
people with diabetes by December 2015

Purpose
“The application of what we know already will have a bigger impact on health and disease than any drug or technology likely to be introduced in the next decade.”
Sir Muir Gray, Director UK NHS National Knowledge Service and NHS
Chief Knowledge Officer

Offer
• To meet and be supported by like-minded, passionate people to share and spread ideas related to improving the lives of people win the West Midlands with diabetes
• Access to a virtual community of difference makers
• Online resources • Regular and local support • Resources and high quality support materials • Networking opportunities

Achievements to date

REFRESHMENT BREAK

Marketplace of differences
• Rotation around the following differences:
– Julie Taylor
– Dr Andrew Askey
– John Morrison
– Emma Innes

What difference do you want to make?
• Visit differences bank
• Facilitated table discussions

LUNCH

Programme framework

Measure for improvement
David Godfrey Healthcare Development Manager, Lilly
19 May 2015
As part of a joint working agreement

Aim of this session
• The aim of this session to understand why to measure for improvement.
• Provide considerations on what and how to measure.
• Introduce Pareto charts and SPC.
• This is not designed to teach you how to use all of the tools around measurement.
David Godfrey April 2015. As part of a joint working agreement. West Midlands AHSN, HEWM, Lilly, Novo Nordisk, Daiichi-Sankyo
‘If you cannot measure, you cannot improve!’
– Genichi Taguchi
An engineer and statistician
David Godfrey April 2015. As part of a joint working agreement. West Midlands AHSN, HEWM, Lilly, Novo Nordisk, Daiichi-Sankyo
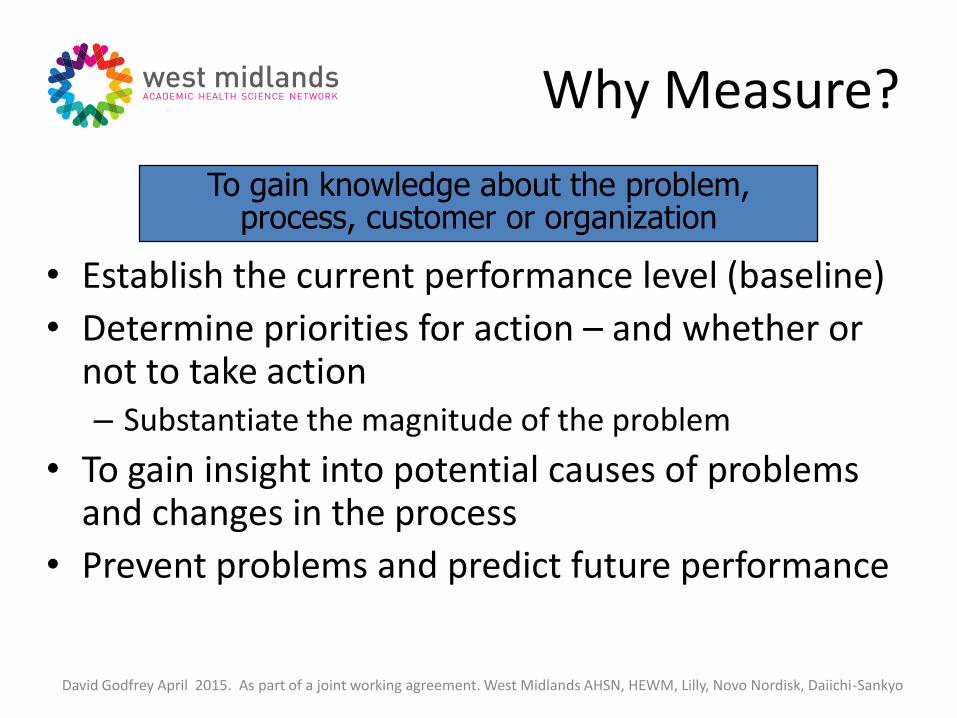
Why Measure?
• Establish the current performance level (baseline)
• Determine priorities for action – and whether or not to take action – Substantiate the magnitude of the problem
• To gain insight into potential causes of problems and changes in the process
• Prevent problems and predict future performance
To gain knowledge about the problem, process, customer or organization
David Godfrey April 2015. As part of a joint working agreement. West Midlands AHSN, HEWM, Lilly, Novo Nordisk, Daiichi-Sankyo

Why measure?
To show you have made a difference in the improvement of quality and cost;
• for people with diabetes
• to your organisation
• to yourself
David Godfrey April 2015. As part of a joint working agreement. West Midlands AHSN, HEWM, Lilly, Novo Nordisk, Daiichi-Sankyo

NHS model for improvement
David Godfrey April 2015. As part of a joint working agreement. West Midlands AHSN, HEWM, Lilly, Novo Nordisk, Daiichi-Sankyo

Driver diagrams
David Godfrey April 2015. As part of a joint working agreement. West Midlands AHSN, HEWM, Lilly, Novo Nordisk, Daiichi-Sankyo


What Do We Need to Know?
• The first step in the creation of any data collection plan is to decide what you need to know about your process and where to find measurement points. – What data is needed to “baseline” our problem?
– What “upstream” factors may affect the process/problem?
– What do we plan to do with the data after it’s gathered?
– Do we have a balance between Output and Input/Process measures?
David Godfrey April 2015. As part of a joint working agreement. West Midlands AHSN, HEWM, Lilly, Novo Nordisk, Daiichi-Sankyo

Data Collection Plan
Developing a Data Collection Plan
1. Stratification Factors - All patients or a sample?
2. Developing Operational Definitions - a clear, precise description of the factor being measured 3. Identifying Data Sources - do you already have data or do you need to collect it ? 4. How Will Data Be Collected ? - methods; easy to collect ? 5. Who Will Collect The Data ? - skills, training
David Godfrey April 2015. As part of a joint working agreement. West Midlands AHSN, HEWM, Lilly, Novo Nordisk, Daiichi-Sankyo

Histograms and Pareto Charts
When to use
• Early in the data analysis process
Histogram:
To help appreciate the data‘s average and distribution (or
spread)
Pareto:
To help prioritize and rank things (factors) using data
counts
David Godfrey April 2015. As part of a joint working agreement. West Midlands AHSN, HEWM, Lilly, Novo Nordisk, Daiichi-Sankyo

David Godfrey April 2015. As part of a joint working agreement. West Midlands AHSN, HEWM, Lilly, Novo Nordisk, Daiichi-Sankyo

Histogram LOS example data
0
10
20
30
40
50
60
1 2 3 4 5 6 7 8 9 10 10+
Histogram - LOS
Frequency
David Godfrey April 2015. As part of a joint working agreement. West Midlands AHSN, HEWM, Lilly, Novo Nordisk, Daiichi-Sankyo

Pareto LOS example data
Inte
rvention a
t A
&E
MA
U
In-p
atient
In-p
atient
In-p
atient
In-p
atient
In-p
atient
In-p
atient
In-p
atient
In-p
atient
In-p
atient
In-p
atient
In-p
atient
In-p
atient
In-p
atient
0%
20%
40%
60%
80%
100%
0
20
40
60
80
100
120
Cum
ula
tive %
Co
st
Days
Pareto example for LOS
Vital Few Useful Many Cumulative% Cut Off % [42]
David Godfrey April 2015. As part of a joint working agreement. West Midlands AHSN, HEWM, Lilly, Novo Nordisk, Daiichi-Sankyo

•“Control” = operating without undue
impact from special causes
•“Control Limits” = statistically
calculated boundaries within which a
process in control should operate
– These boundaries result
from the process itself
•“Control Chart” = a time ordered plot
showing process performance, mean
(average) and control limits
Statistical Process for Control
or Control Charts
5
10
15
20
25
Me
an o
f Avg
. Ho
ld T
ime
2 4 6 8 10 12 14 16 18 20 22 24 26 28
Sample
Avg=15.31
LCL=7.77
UCL=22.86
Note: Sigma used for limits based on range.
XBar of Av g. Hold Time
-5
0
5
10
15
20
25
30
Ra
ng
e o
f Avg. H
old
Tim
e
2 4 6 8 10 12 14 16 18 20 22 24 26 28
Sample
Avg=13.08
LCL=0.00
UCL=27.66
R of Avg. Hold Time
Variables Control Chart
David Godfrey April 2015. As part of a joint working agreement. West Midlands AHSN, HEWM, Lilly, Novo Nordisk, Daiichi-Sankyo

Control Charts
If you can investigate and determine
what caused these
‘Out of Control’ Points – and you
take permanent action on them – you
can then delete them and recalculate
your
control chart limits.
For example: if you are recording process cycle
times, points above the UCL should be
investigated and the root cause analyzed to
prevent reoccurrence. Points below the LCL
should also be investigated as a source of
potential improvements.
‘Out of control’
points
David Godfrey April 2015. As part of a joint working agreement. West Midlands AHSN, HEWM, Lilly, Novo Nordisk, Daiichi-Sankyo

Summary
• Spend time thinking and planning what, how and why you should measure as part of your project.
• The AHSN may be able to help you.
David Godfrey April 2015. As part of a joint working agreement. West Midlands AHSN, HEWM, Lilly, Novo Nordisk, Daiichi-Sankyo

Making a difference for people with diabetes.
As part of a joint working agreement

AMU Project
Emma Innes
Worcestershire Acute Hospitals NHS Trust & University of Worcester

Aims
To improve the quality and consistency of diabetes care delivered to medical in-patients in Worcestershire Royal
Hospital.

Background
• 3 Hospitals serving Worcestershire
• 550 beds in Worcestershire Royal Hospital (WRH).
• 17% in-patients have diabetes (NADIA).

Why change?
• Mary Seacole course and post grad certificate in health care leadership.
• Lean.
• Human Factors.
• Referral guidelines
• Limitations.

Drug errors and Human Factors
• Insulin remains a high risk drug.
• Locally within the top 5 drug errors.
• Analysis of Datix reports shows themes are name of drug, timing and not prescribed in time.
• The same people do not make the same mistakes, so how can you improve care and reduce error?

Objectives
• Team engagement & reality check!
• See a screened group of patients in AMU:
-Admitted with hypoglycaemia, hyperglycaemia>11mmols DKA,HHS, Insulin and newly diagnosed diabetes.
• Mon-fri visit to the unit.


Outcomes
• No recorded insulin errors affecting patients since starting the project.
• DSN team have intercepted drug charts and corrected.
• Interventions have included discharge home, reduction of doses & oral agents.
• Shared learning with AMU team.

Data analysis
• Demonstrates increasing number of patients seen.
• Initial spike in activity which begins to plateau.
• Mondays are busy days as not 7/7 service.

The future
• Analysis of LOS data.
• Secure resources in readiness for 7/7 service.
• Patient experience

Pledge update

Working up your idea
• Task
• Resources
• Reason why
• People and communicating the difference
• Buy in
• Establish a goal
• Barriers
• Risks and issues
• Overcoming the issues
• Celebrate success

REFRESHMENT BREAK

Coaching session

What difference will you make?


I pledge to use my invigorated passion, open mind and the new
ideas from today’s meeting to ‘Make a Difference’ for people
with diabetes through medicines optimisation
As a result of attending today’s meeting I am going to…

Pledge sharing

Thank you for attending and keep making a difference A joint working programme with Health Education West Midlands


