Cafer Biçer Making Cooperation Work For Building an Interdependent Islamic World COMCEC FINANCIAL OUTLOOK COMCEC STRATEGY 9 th Meeting of COMCEC Financial Cooperation Working Group October 26 th , 2017 Ankara, Turkey
Transcript
Cafer Biçer
Making Cooperation Work
For Building an Interdependent Islamic World
COMCEC
FINANCIAL OUTLOOK
COMCEC STRATEGY
9th Meeting of COMCEC Financial Cooperation Working Group
October 26th, 2017
Ankara, Turkey
2For Building an Interdependent Islamic World
COMCEC STRATEGYMaking Cooperation Work
OUTLINE
Recent Global Economic and Financial
Developments
Financial Outlook for the OIC Countries
Islamic Finance
3For Building an Interdependent Islamic World
COMCEC STRATEGYMaking Cooperation Work
Global Economic and Financial Developments
World Economic Growth:
In 2016, the world economy expanded by 2.4
percent, the slowest rate of growth since the
Great Recession of 2009. The main reasons of the
sluggish growth are:
Weak pace of global investment,
Declining world trade growth,
Lack of access to finance
Low commodity prices for commodity-exporting
countries
Conflict and geopolitical tensions
0
1
2
3
4
5
World AdvancedEconomies
Euro Area EmergingMarkets andDevelopingEconomies
OIC
2016 2017 2018 2019
Comparison of the GDP Growth Rates of Selected Country Groupings (% Growth)
Source: World Bank Global Economic Prospects, June 2017
4For Building an Interdependent Islamic World
COMCEC STRATEGYMaking Cooperation Work
Global Economic and Financial Developments
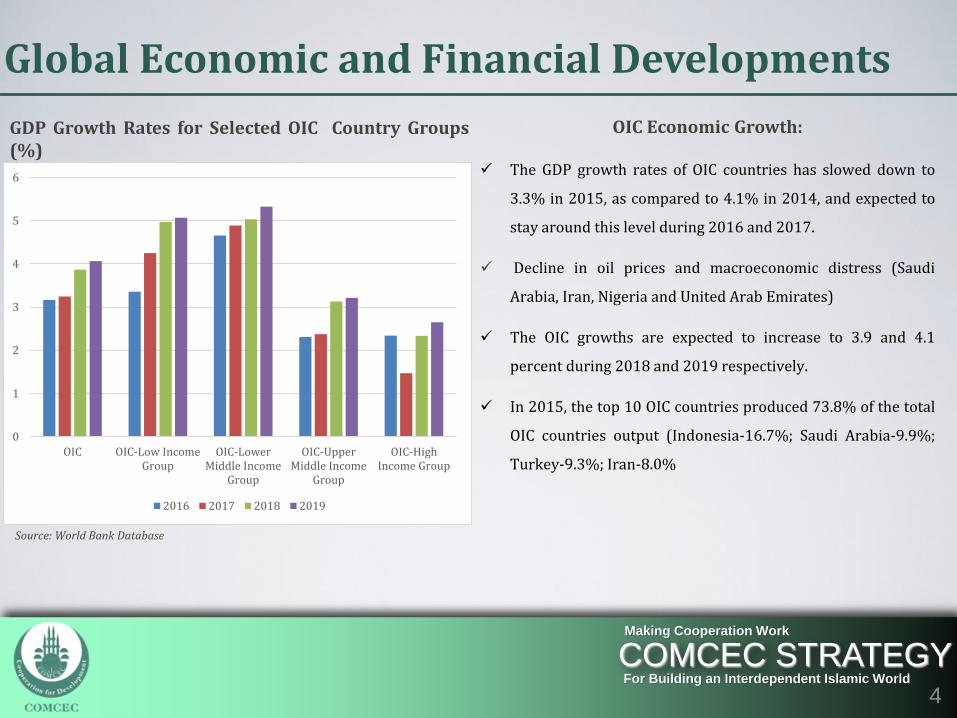
OIC Economic Growth:
The GDP growth rates of OIC countries has slowed down to
3.3% in 2015, as compared to 4.1% in 2014, and expected to
stay around this level during 2016 and 2017.
Decline in oil prices and macroeconomic distress (Saudi
Arabia, Iran, Nigeria and United Arab Emirates)
The OIC growths are expected to increase to 3.9 and 4.1
percent during 2018 and 2019 respectively.
In 2015, the top 10 OIC countries produced 73.8% of the total
OIC countries output (Indonesia-16.7%; Saudi Arabia-9.9%;
Turkey-9.3%; Iran-8.0%
0
1
2
3
4
5
6
OIC OIC-Low IncomeGroup
OIC-LowerMiddle Income
Group
OIC-UpperMiddle Income
Group
OIC-HighIncome Group
2016 2017 2018 2019
GDP Growth Rates for Selected OIC Country Groups(%)
Source: World Bank Database
5For Building an Interdependent Islamic World
COMCEC STRATEGYMaking Cooperation Work
Global Economic and Financial Developments
Inflation Rates:
In 2016, average global inflation increased
slightly to 2.4 percent from 2.1 percent in
2015
In 2017, inflation is expected to surge for all
countries
Inflation realized below 1 % in the
advanced economies and the Euro area in
2016.
After 2017, inflation is expected to lower
slightly for the following years.
Inflation, Average Consumer Prices (% Change)
0
1
2
3
4
5
World Advanced Economies Euro Area Emerging Markets andDevelopingEconomies
2016 2017 2018 2019
Source: IMF WEO April 2017
6For Building an Interdependent Islamic World
COMCEC STRATEGYMaking Cooperation Work
Global Economic and Financial Developments
World Trade Developments:
Global trade growth realized as 2.2 percent in 2016. The
growth rate is expected to be around 4 % during 2017-19.
The recovery in trade growth in 2017 is supported by
stronger import demand, increased trade flows of China.
Total merchandise exports from OIC countries fell sharply
in 2009.
It started to pick up rapidly and reached its historically
highest level of $2.4 trillion in 2012.
This trend was distorted in 2015 because of low oil prices
and fragility in the global markets, export decreased by
29 percent and dropped to $1.6 trillion.
2016 witnessed further decline for the OIC countries by
8.5 percent and realized as $1.49 trillion.
World Trade Volume of Goods and Services (% Change)
OIC Merchandise Export
-15,0
-10,0
-5,0
0,0
5,0
10,0
15,0
-40
-30
-20
-10
0
10
20
30
40
0
500
1.000
1.500
2.000
2.500
3.000
20
01
20
02
20
03
20
04
20
05
20
06
20
07
20
08
20
09
20
10
20
11
20
12
20
13
20
14
20
15
20
16
OIC Total Merchandise Exports (Billion US$) % Change
7For Building an Interdependent Islamic World
COMCEC STRATEGYMaking Cooperation Work
Global Economic and Financial Developments
Exchange Rates Developments:
The quantitative easing have had spillover effects on the
financial markets of the emerging-market economies.
Since investors were attracted to the higher rates in many
emerging economies and this has been reversed by the
surge of the interest rates in the US.
This has affected capital flows, exchange rates, interest
rates and asset prices in the emerging market economies.
As a result, the previously over valued exchange rates of
emerging economies started to depreciate against US
dollar.
Exchange Rates of the Selected Economies per US$ (2006=100)
Islamic finance is a financial system that operates according to Islamic law.
Modern financial institutions began offering sharia-compliant products in the mid-1970s, though Islamic finance is as old as the religion itself with its principles primarily derived from the Quran.
Prohibition of the payment and the receipt of riba (interest) in financial transactions
Prohibition of ‘gharar’ (uncertainty or asymmetrical information)
Prohibition of ‘maysir’ (gambling, speculation).
Islam prohibits industries that it considers harmful to society and a threat to social responsibility, such as alcohol, pornography, weapons of mass destruction, pork, and illegal drugs etc.
17For Building an Interdependent Islamic World
COMCEC STRATEGYMaking Cooperation Work
Islamic Finance
Recent Developments
The Islamic finance industry has expanded by 10-12% annually over the last decade and total assets are estimated at roughly US$2 trillion
In many majority Muslim countries, Islamic banking assets have been growing faster than conventional banking assets.
There has also been a surge of interest in Islamic finance from non-Muslim countries such as the UK, Luxembourg, South Africa, and Hong Kong
Islamic Banking
Outstanding Sukuk
Islamic Funds Assets
Takaful Contributions
Total
Asia 218.6 182.7 19.8 4.4 425.5
GCC 650.8 115.2 23.4 11.7 801.1
Mena (ex-GCC) 540.5 16.6 0.2 8.4 565.7
Africa (ex-North Africa)
26.6 1.9 1.5 0.6 30.6
Others 56.9 2.1 11.2 N/A 70.2
Total 1,493.4 318.5 56.1 25.1 1,893.1
Asia; 22,5
GCC; 42,3
Mena (ex-GCC); 29,9
Africa (ex-North
Africa); 1,6
Others; 3,7
Source: IFSB as of 1H 2016
18For Building an Interdependent Islamic World
COMCEC STRATEGYMaking Cooperation Work
Islamic Finance
Recent Developments
The Islamic Finance industry consists of three main segments as banking, capital markets and takaful. Islamic banking sector is the dominant component of the Islamic finance industry.
Islamic Banking; 79%
Sukuk; 17%
Islamic Funds; 3%
Takaful; 1%
Source: IFSB, as of 1H 2016
19For Building an Interdependent Islamic World
COMCEC STRATEGYMaking Cooperation Work
Islamic Finance
Banking
Islamic banking assets valued at USD 1.49 trillion in 2016 and it represents approximately 79% of the industry’s total assets.
While the assets increased steadily during 2012-2016, the US Dollar values of Islamic banking assets in several countries were affected negatively by exchange rate fluctuations in 2016 and 2015 .
Source: IFSB, as of 1H 2016
0
5
10
15
20
25
30
35
Shares of Global Islamic Banking Assets (1H2016) (%)
20For Building an Interdependent Islamic World
COMCEC STRATEGYMaking Cooperation Work
Islamic Finance
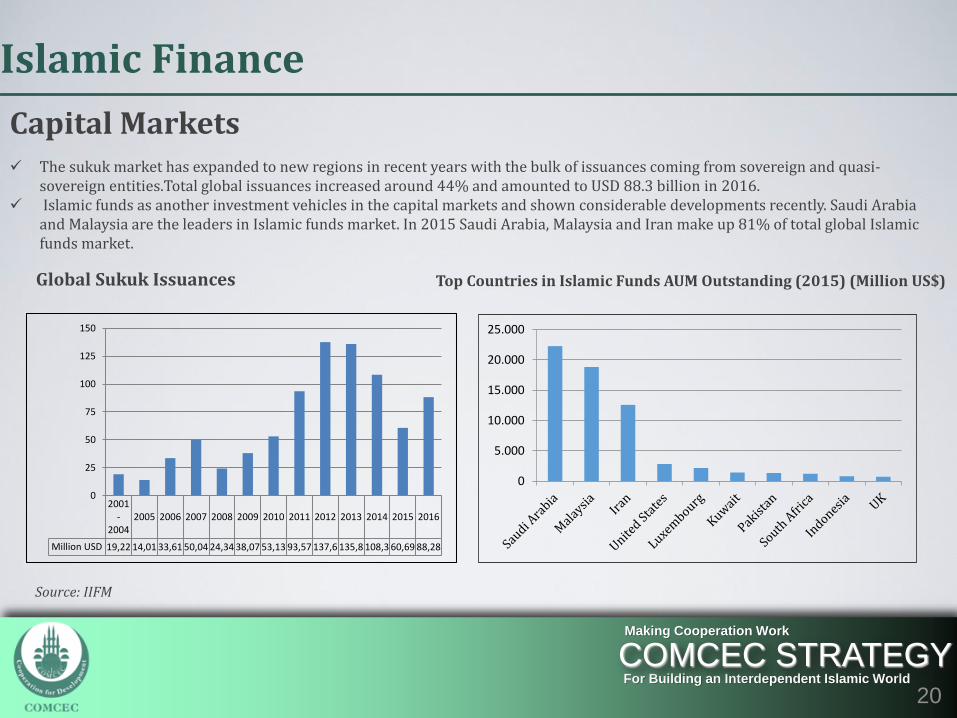
Capital Markets The sukuk market has expanded to new regions in recent years with the bulk of issuances coming from sovereign and quasi-
sovereign entities.Total global issuances increased around 44% and amounted to USD 88.3 billion in 2016. Islamic funds as another investment vehicles in the capital markets and shown considerable developments recently. Saudi Arabia
and Malaysia are the leaders in Islamic funds market. In 2015 Saudi Arabia, Malaysia and Iran make up 81% of total global Islamic funds market.
Top Countries in Islamic Funds AUM Outstanding (2015) (Million US$)
21For Building an Interdependent Islamic World
COMCEC STRATEGYMaking Cooperation Work
Islamic Finance
Takaful
Although takaful has a small volume and it is rather an underdeveloped segment of Islamic finance, its popularity has increased recent years and becoming an important component of Islamic financial industry
Saudi Arabia is the biggest takaful market as its insurance market is based fully on a cooperative insurance model. Besides Saudi Arabia, Iran and Malaysia are the prominent players in takaful industry
Top Countries In Takaful Assets (2015) (USD MN)
Source: IIFM
0
2.000
4.000
6.000
8.000
10.000
12.000
14.000
16.000
Thank You
Making Cooperation Work
For Building an Interdependent Islamic WorldCOMCEC STRATEGY
9th Meeting of COMCEC Financial Cooperation Working Group