150
Making Development Work in the CDM Phase II of the Development Dividend Project PRE-PUBLICATION VERSION Aaron Cosbey, Deborah Murphy, John Drexhage, John Balint October 2006

Making Development Work in the CDM
Phase II of the Development Dividend Project
PRE-PUBLICATION VERSION
Aaron Cosbey, Deborah Murphy, John Drexhage, John Balint
October 2006

© 2006, International Institute for Sustainable Development The International Institute for Sustainable Development contributes to sustainable development by advancing policy recommendations on international trade and investment, economic policy, climate change and energy, measurement and assessment, and sustainable natural resources management. Through the Internet, we report on international negotiations and share knowledge gained through collaborative projects with global partners, resulting in more rigorous research, capacity building in developing countries and better dialogue between North and South. IISD’s vision is better living for all—sustainably; its mission is to champion innovation, enabling societies to live sustainably. IISD is registered as a charitable organization in Canada and has 501(c)(3) status in the United States. IISD receives core operating support from the Government of Canada, provided through the Canadian International Development Agency (CIDA), the International Development Research Centre (IDRC) and Environment Canada; and from the Province of Manitoba. The Institute receives project funding from numerous governments inside and outside Canada, United Nations agencies, foundations and the private sector. International Institute for Sustainable Development 161 Portage Avenue East, 6th Floor Winnipeg, Manitoba Canada R3B 0Y4 Tel.: +1 (204) 958-7700 Fax: +1 (204) 958-7710 Web site: http://www.iisd.org Making Development Work in the CDM: Phase II of the Development Dividend ProjectBy Aaron Cosbey, Deborah Murphy, John Drexhage, John Balint

Development Dividend Phase II i
Acknowledgements Chapter 1: Defining and Measuring the Development Dividend The author would like to thank Xianli Zhu, Jagjeet S. Sareen and Preety M. Bhandari, for their substantial contributions to this chapter. In addition, invaluable comments were provided by Karen M. Olsen and Jørgen Fenhann. Any inadequacies, of course, remain the sole responsibility of the author. Chapter 2: Options for Fostering the Development Dividend The author would like to thank Christiana Figueres, Erik Haites, Suzana Kahn Ribeiro, Luciano Mattos, André Cau, and Paulo Moutinho for their extensive contributions to Chapter 2. The author would also like to thank members of the Development Dividend Task Force who provided comments on and input to drafts of Chapter 2: Jodi Browne, Neil Bird, Frode Neergarde, Sami Kamel and Brian Dawson. Chapter 3: Financing the Development Dividend The author would like to thank Emily Tyler of SouthSouthNorth and Tom Owino of ECM, for their extensive contributions to the paper, including information on the case studies and review of countless drafts of the chapter, and to IISD for the opportunity to participate on the Development Dividend Task Force. The author would also like to thank Mahua Acharya who provided comments and input to the drafts of Chapter 3.

Development Dividend Phase II ii
Abbreviations and Acronyms A/R Afforestation/Reforestation
AAU Assigned Amount Unit
AIJ Activities Implemented Jointly
BAU Business as Usual
CBD Convention on Biological Diversity
CDCF Community Development Carbon Fund
CDM Clean Development Mechanism
CER Certified Emissions Reduction
CO2 Carbon Dioxide
CO2e Carbon Dioxide Equivalent
COP Conference of the Parties
CP Crediting Period
CSE Centre for Science and Environment
CSR Corporate Social Responsibility
DAC Development Assistance Committee
DEFRA Department of Environment Food and Rural Affairs and Agriculture
DFI Direct Foreign Investment
DNA Designated National Authority
DOE Designated Operational Entity
DSM Demand Side Management
EB Executive Board
ECA Export Credit Agency
EE Energy Efficiency
ERPA Emission Reduction Purchasing Agreement
ERU Emission Reduction Unit
EU-ETS European Union Emissions Trading Scheme
ESP Energy for Schools Project
FDI Foreign Direct Investment
GEF Global Environment Facility
GHG Greenhouse Gas
GWP Global Warming Potential
HFC Hydrofluorocarbons
IEA International Energy Agency
IETA International Emissions Trading Association
IGO Intergovernmental Organization

Development Dividend Phase II iii
IPAM Instituto de Pesquisa Ambiental da Amazônia
IRR Internal Rate of Return
JI Joint Implementation
lCER Long term Certified Emissions Reduction
LDC Least Developed Country
LFG Land-fill Gas
LULUCF Land Use, Land Use Change and Forestry
MCA Multi-criteria Analysis
MIGA Multilateral Investment Guarantee Agency
MOP Meeting of the Parties
N2O Nitrous Oxide
NGO Non-Governmental Organization
NPV Net Present Value
ODA Official Development Assistance
OECD Organization for Economic Co-operation and Development
O&M Operation and Maintenance
PDD ` Project Design Document
PEC Poverty Eradication Commission
PFC Perfluorocarbon
PRSP Poverty Reduction Strategy Paper
PV Photovoltaic
REC Renewable Energy Certificate
RCSHSFP Rural Community Solar Home Systems Finance Project
RINGO Research Institute Non-Governmental Organization
ROI Return on Investment
SD-PAM Sustainable Development Policies and Measures
SMEs Small to Medium Size Enterprises
SSN SouthSouthNorth
SSWG Small Scale Working Group
STEP Solar Technology for Electricity Provision
SWH Solar Water Heaters
tCER Temporary Certified Emissions Reduction
UNDP United Nations Development Programme
UNDP United Nations Environment Programme
UNFCCC United Nations Framework Convention on Climate Change
VER Voluntary Emission Reduction

Development Dividend Phase II iv

Development Dividend Phase II v
Table of Contents Introduction by John Drexhage.....................................................................................................................................viii
Chapter 1: Defining and Measuring the Development Dividend
1. Introduction .....................................................................................................1 1.1. Defining the development dividend ..............................................................................................................1 1.2. CDM today: Updating the analysis ................................................................................................................1
2. Stakeholder Interest in the Development Dividend ....................................... 5 2.1. Buyers’ perspectives..........................................................................................................................................5 2.2. Host country perspectives ...............................................................................................................................6 2.3. International policy community’s perspectives ............................................................................................7
3. Assessing the Development Dividend in the CDM: The Options ................. 7 3.1. Qualitative threshold tests ...............................................................................................................................7 3.2. Discrimination by project type .......................................................................................................................8 3.3. Multi-criteria analysis ........................................................................................................................................9
4. A Framework for Assessing the Development Dividend in CDM Projects ..12 4.1. Defining the user.............................................................................................................................................12 4.2. The development dividend framework .......................................................................................................13 4.3. Limitations of the development dividend framework ..............................................................................15
5. Analysis: Applying the Development Dividend Framework .........................17 5.1. Scores by project category .............................................................................................................................17 5.2. Is small beautiful?............................................................................................................................................18 5.4. Is big bad? ........................................................................................................................................................21 5.3. Programmatic and unilateral CDM..............................................................................................................22 5.4. Regional distribution of projects ..................................................................................................................26
6. Conclusions and Recommendations .............................................................29
Annex I: Indicators and Scoring for Various Project Types: .....................................35
Annex II: The Development Dividend Task Force ...................................................40
Annex III: Results of the Framework Analysis ..........................................................41
Annex IV: Add-On Commitments in CDM Projects .................................................59
Chapter 2: Fostering the Development Dividend
1.0 Introduction ...................................................................................................61
2.0 Additionality...................................................................................................61

Development Dividend Phase II vi
2.1 Challenges with the Current Methods for Assessing Additionality ........................................................62 2.2 Additionality and the Development Dividend...........................................................................................63
3.0 Programmatic CDM ......................................................................................65 3.1 Barriers and Challenges to Effective Implementation of Programmatic CDM ...................................67 3.2 Development Dividend Benefits of Programmatic CDM .......................................................................71 3.3 Options for Promoting the Development Dividend under Programmatic CDM ...............................71
4.0 Small Scale CDM Projects .............................................................................72 4.1 Barriers and Challenges to Small Scale Projects.........................................................................................75 4.2 Development Dividend Benefits of Small Scale Projects ........................................................................77 4.3 Options for Promoting the Development Dividend for Small Scale Projects .....................................77
5.0 CDM LULUCF Projects ................................................................................78 5.1 Barriers and Challenges to LULUCF Projects ...........................................................................................79 5.2 Development Dividend Benefits of LULUCF Projects ...........................................................................80 5.3 Options for Promoting the Development Dividend for LULUCF Projects........................................81
6.0 Fostering CDM Investment in LDCs ............................................................84 6.1 Barriers and Challenges to Fostering CDM Investment in LDCs..........................................................84 6.2 Development Dividend Benefits of Fostering CDM Projects in LDCs................................................86 6.3 Options for Promoting the Development Dividend in LDCs................................................................86
7.0 Options for Fostering the Development Dividend ........................................88
7.1 Options over the Short-term ........................................................................................................................89 7.2 Options over the Medium to Long Term...................................................................................................90
Bibliography...............................................................................................................92
List of Background Papers.........................................................................................97
Annex A: Micro projects in the CDM pipeline..........................................................98
Chapter 3: Financing the Development Dividend
1.0 Introduction ................................................................................................. 101
2.0 The Market for Carbon Credits.................................................................... 101
3.0 Financial Support Mechanisms ................................................................... 102
4.0 Understanding the Finance Challenge ........................................................ 105
4.1 Risk factors in CDM Projects .................................................................................................................... 106 4.2 Risk Factors in the Case Studies................................................................................................................ 107
5.0 Understanding the Financing Gaps............................................................. 109

Development Dividend Phase II vii
5.1 Overcoming the Supply Gap ..................................................................................................................... 109 5.2 Overcoming the Demand Gap.................................................................................................................. 113
6.0 Possible Actions to Increase Financing for CDM Projects with High Development Dividends........... 115
7.0 Conclusion ................................................................................................... 117
Bibliography............................................................................................................. 118
Annex A: Kuyasa Energy Upgrade Project in South Africa............................... 119
Annex B: Bellville Landfill Gas Recovery Project in South Africa..................... 123
Annex C: Vanilla Jatropha Project in Kenya ...................................................... 126
Annex D: Solar Technology for Electricity Provision in Kenya ......................... 130
Annex E: Summary of Case Study Financing Risks .......................................... 133

Introduction

Development Dividend Phase II viii
The Development Dividend is about trying to find a meaningful place in the international carbon market for Clean Development Mechanism projects that provide significant benefits beyond greenhouse gas reductions. These include environmental/human health benefits such as improved air quality, social benefits such as improved quality of life through provision of electricity, and the economic benefits that can accompany increased foreign direct investment, such as increased incomes and employment. The CDM looks very different today than three years ago - when we started the Development Dividend Project. There has been a large increase in the number of projects, and there is a greater variety of project types, with substantial growth in energy efficiency projects, wind energy projects and agriculture projects. The growing number of approved methodologies and consolidated methodologies makes the CDM approval journey much easier for those project proponents that follow the original pioneers. This growth and broadening of sectors is positive, yet, our research and broader discussion and debate indicate that there remains some cause for concern with respect to the development dividend – the quality and quantity of CDM projects. To address these concerns, the International Institute for Sustainable Development (IISD) has prepared this Development Dividend Phase II report. The purpose of this report is to broaden and deepen the analysis on the development dividend – is the CDM delivering on its twin objectives of low-cost mitigation and sustainable development in host countries? The first Chapter, Defining and Measuring the Development Dividend, defines what is meant by the development dividend, and elaborates and applies a framework for measuring its strength in specific CDM projects. Only a few registered CDM projects break the pattern of a trade-off between high Development Dividend (DD) scores and high CER generation – the two characteristics (quality and quantity) that we are looking for. Programmatic CDM seems to hold some promise for encouraging high-achieving projects, and small scale projects seem to perform better overall than large projects on the DD scoring, although the number of CERs generated is small. The second Chapter: Options for Fostering the Development Dividend explores in-depth some alternatives that could encourage the development dividend in CDM projects. Short-term options for moving forward to increase the quantity, quality and equitable distribution of CDM projects focus on improvements in the approval process and ensuring programmatic CDM begins quickly. Over the medium to long term, efforts should focus on increasing the participation of Least Developed Countries, streamlining additionality assessments and ensuring that avoided deforestation offers benefit to developing countries, regardless of how it is promoted under the United Nations Framework Convention on Climate Change. Acting on these options can have positive co-benefits; i.e., helping to prepare developing countries to participate in the post-2012 climate regime, whatever shape it may take. The third Chapter: Financing the Development Dividend, explores ways to increase available financing for CDM projects that yield a development dividend; and considers how such financing for CDM projects can be used to encourage project stakeholders to include and/or enhance the development dividend. CDM projects with a high development dividend are usually more risky, due in part to the sustainable development benefits objectives within the project. Local state-owned development banks, multilateral financial institutions and public sector programs of Annex I nations are likely best positioned to take a leading role to include the development dividend in their investment decision processes. Voluntary buyers of carbon credits could also be significant purchasers of credits from CDM projects with high development dividend benefits; but a credible, internationally recognized standard for determining these benefits is needed to guide purchasing decisions. The development of this publication and the work of the Development Dividend Project has been guided by a 35-member international Task Force comprised of CDM experts representing civil society, governments, financial institutions, stock traders, research organizations and industry. The Development Dividend Task Force is a body that investigates on-going and new issues related to the CDM, and attempts to bring about change by strategically informing the CDM debate with high-quality research and analysis, as well as providing relevant perspectives to stakeholders engaged in the CDM.

Development Dividend Phase II ix
This Development Dividend Phase II Report is timely in that the international community will soon meet again at the twelfth Conference of the Parties (COP) and second Meeting of the Parties (MOP) to the UNFCCC, at Nairobi in November 2006. The decisions and deliberations of the Parties of the UNFCCC and the Kyoto Protocol have significant impact on the development dividend – continued uncertainty on the role of the CDM post-2012 will effectively dry up the supply of the CDM projects within a few years. On behalf of IISD, I would like to thank all the individuals who contributed to the development of this publication, particularly Xianli Zhu, Preety Bhandari, Christiana Figueres, Suzana Kahn Ribeiro, Luciano Mattos, Emily Tyler, Tom Owino and John Balint. I would also like to thank the members of the Development Dividend Task Force, whose critical insights guided the work of the authors. The views contained in this document, though, remain those of IISD. John Drexhage, Director, Climate Change and Energy International Institute for Sustainable Development


Chapter 1: Defining and Measuring the Development Dividend Aaron Cosbey

Chapter 1: Defining and Measuring the Development Dividend
Development Dividend Phase II 1
1. Introduction The starting point for this book is a major research effort on the subject of the development dividend,1 which in 2005 surveyed 50 key stakeholders and went through the existing literature, raising a number of concerns about the ability of the Clean Development Mechanism (CDM) to deliver on its twin objectives of low-cost mitigation and sustainable development in host countries. That effort made a number of recommendations aimed at the Conference of the Parties (as rule makers), the CDM Executive Board (EB), national governments, the private sector and other non-state actors. The present work, the second phase of the Development Dividend Project, aims to deepen and broaden that first phase analysis, and to take account of recent trends and developments in the CDM. This chapter sets the stage for the two chapters that follow. It defines what we mean by the development dividend, and elaborates and applies a framework for measuring its strength in specific CDM projects. It then draws conclusions and recommendations from the analysis of the current roster of registered CDM projects. 1.1. Defining the development dividend
The first phase report defined the development dividend as “benefits to developing countries beyond those strictly related to climate change, in the areas of economic growth through investment; technological evolution; poverty alleviation; environmental and human health improvements.” In other words, the development dividend consists of those benefits that might arise from CDM projects other than the reduction of GHG emissions. The first phase analysis raised concerns in three areas: quality, quantity and equity. The quality concerns related to whether the roster of CDM projects would be able to deliver the level of development dividend that stakeholders expected of it. A rise of very large end-of-pipe projects capturing gases with high global warming potential fostered concerns about the viability of projects with greater apparent levels of development dividend benefits, since they typically would entail higher project implementation costs. The quantity concerns assumed quality was given, and focused on the ability of the CDM to deliver quality projects at a level commensurate with market demand. An apparent mis-match between expected demand and the trickle of quality projects made this concern seem vitally important, particularly given the relative lack of development dividend benefits offered by the alternatives to CDM in the Kyoto compliance market: international trading of assigned amount units (AAU) and, to a lesser extent, Joint Implementation. The equity concerns centred on the apparent skewing of CDM investment toward a few “hot” investment destinations—primarily large developing countries—and the paucity of projects in least-developed countries. This pattern stood in contrast to the stated objectives of geographical equity for the mechanism, and seemed to deny the CDM’s sustainable development benefits to those countries that were most in need. 1.2. CDM today: Updating the analysis
The CDM pipeline looks very different today than it did during the first phase of the Development Dividend Project.2 Perhaps the most evident change is sheer growth: from 91 projects (none registered) generating 131,599
1 Cosbey et al., (2005). 2 The “pipeline” includes registered projects, projects for which registration has been requested, and projects in the process of validation.

Chapter 1: Defining and Measuring the Development Dividend
Development Dividend Phase II 2
CERs in April 2005, the pipeline expanded in just over a year to cover 860 projects (222 registered) involving over a billion CERs.3 There has also been a shift in the composition of the pipeline, which was at the outset dominated by projects for which the approval process was simple, such as hydro and landfill gas projects. There is now a much greater variety of project types, with substantial growth in energy efficiency projects, wind energy projects and agriculture projects (see Figure 1). A large number of approved methodologies and consolidated methodologies makes the journey much easier for those project proponents that follow the original pioneers.
Figure 1: CDM Projects in UNEP-Risø PipelineJune 2006
22%
16%
12%12%
11%
9%
4%
4%
3%
2%Biomass energy HydroWindEE industryAgricultureLandfill gasFossil fuel switchBiogasCementHFCsFugitive N2OSolarGeothermalEE householdsOther
3 The statistics presented here are from the UNEP-Risø CDM pipeline (www.cd4cdm.org) – a regularly updated compilation of statistics and analysis covering CDM and JI project activities. The current statistics are from the update of July 20, 2006.

Chapter 1: Defining and Measuring the Development Dividend
Development Dividend Phase II 3
Figure 2: CERs to 2012 in UNEP-Risø PipelineJune 2006
8%
6%
5%
6%
3%
12%
1%1%2%
39%
4%
11%
0%
1% Biomass energy HydroWindEE industryAgricultureLandfill gasFossil fuel switchBiogasCementHFCsFugitive N2OSolarGeothermalEE householdsOther
A large number of the total projects (almost half) is unilateral, undertaken for the most part by private investors as in-house process changes (e.g., fuel switching, energy efficiency), or start-up commercial ventures in energy production (e.g., biomass energy, wind, hydro). Many projects are facilitated by intermediaries specializing in a particular replicable technology, such as agricultural waste management. The distribution of CERs by project type is still highly uneven, with HFC and N2O projects accounting for only 2 percent of projects, but over half of the pipeline’s CERs (see Figure 2). This is because they reduce the emission of gases with very high global warming potential.4 On the other hand, biomass, hydro and wind account for over half of the projects in the pipeline, but only 18 percent of the pipeline’s CERs. On the basis of this updated sketch of the pipeline, what can we say about the concerns expressed in the first phase of the development dividend work? With respect to quality, the significant rise in energy efficiency and renewables projects seems like good news from the perspective of the development dividend, though the proportion of CERs in the pipeline from HFC and N2O projects has actually risen by around two thirds since April 2005. A thorough analysis of this question will have to wait, however, until the application of the framework for actually assessing the strength of the development dividend in specific projects later in this chapter. With respect to quantity, the rapid growth in projects is undoubtedly good news if there is a substantial proportion of quality projects as part of that growth. While the growth in “questionable” projects such as HFC and N2O reduction has been stronger, there has still been impressive absolute growth in other project types that intuitively seem richer in development dividend benefits. Again, however, it would be better to wait for an assessment of the relative strengths of the various project types than to rely on intuition.
4 HFC-23 has a GWP of 11,700, meaning one tonne of HFC-23 has a greenhouse effect equivalent to 11,700 tonnes of CO2. NO2 has a GWP of 310.

Chapter 1: Defining and Measuring the Development Dividend
Development Dividend Phase II 4
It should be noted that while initially it was feared that the growth of large HFC and N2O Projects would impair the ability of other projects to get to market, this does not seem to have been the case. Prices for CERs have increased significantly over the last year, fetching between EUR 5 – 9 in May 2005, and in 2006 anywhere between EUR 5 – 7 in contracts where the buyer accepts risk of non-delivery, up to EUR 16 for guaranteed delivery with some preconditions.5 So the fear that cheap CERs would flood the market was apparently unfounded. In fact, the volumes of CERs generated by the very large projects have given the market crucial liquidity, without which there would be no viable secondary market (the first few trades took place in 2006), and very little price transparency. But how does the current projected flow of CERs compare to market demand? Demand for CER is hard to predict, depending heavily on political will in key states, and on the behaviour of the sellers of direct competitors: ERUs and AAUs. Sellers of AAUs, in particular, have the capacity to flood the market for Kyoto compliance units, though that would probably not be in their long-term interests. UNDP (2006:105) estimates a market for Kyoto compliance units (CERs, AAUs and ERUs) of 3 – 5 billion by 2012, but this includes demand from Canada and Italy, which have given cause to heavily reduce those projections. A market of 3 – 3.5 billion units is probably realistic. Set against that level of demand, the supply of CERs looks limited. At just over 1 billion, it currently covers barely a third of the market. More projects will enter the pipeline in the future, of course, but the uncertainty of the value of GHG reductions post-2012 makes the entry of new CDM projects a highly limited possibility after the next year or so. Another important consideration is that the 1 billion CERs currently in the pipeline will not in fact materialize at those levels. Some projects (possibly many) will never receive funding, despite being registered by the EB. Others will not get registered. Others will not perform at projected levels. All in all, even assuming a high degree of quality in the current pipeline, there seems to be cause for concern about the quantity of supplied CERs. If we find that many of those projects do not in fact deliver a high development dividend, the concern is even more pressing. Finally, what can be said about regional equity in the distribution of CDM investment? In brief, the distribution is still highly unequal. Table 1 shows that Latin America & the Caribbean and Asia & Pacific together account for over 95 percent of CDM projects and just under 95 percent of CERs. Just three countries – China, Brazil and India – account for two thirds of the CERs in the pipeline, and just under two thirds of the projects. Only six least-developed countries (of the 49 defined by the UNFCCC) have projects in the pipeline accounting for just nine projects – 1 percent of the projects in the pipeline and 0.3 percent of the CERs.6 While this is an improvement on the situation in April 2005, when only two least-developed countries had CDM projects in the pipeline (one each), it hardly represents an equitable distribution. This issue is taken up in more detail in Section 5.4, where it is argued that the issue of regional equity in the distribution of CDM investment may not be as important a concern as it appears. Table 1: Regional Distribution of CDM
Total in the CDM Pipeline Number kCERs 2012 kCERs
Latin America 325 37.8 % 40,179 279,015 26.9 %
Asia & Pacific DC 497 57.8 % 102,263 694,505 67.0 %
Europe and Central Asia 10 1.2 % 472 3,000 0.3 %
5 Prices are as reported in Point Carbon’s CDM & JI Monitor, various issues. CER prices for completely secure contracts were reported as high as EUR 28 early in 2006, but this sort of price level has not been sustained. The EUR 16 quoted above is for a price category 3, which is one rank below the most risk-free category. 6 As of June 20, 2006 Bangladesh had 3 projects, Nepal had 2 projects and there was 1 project each in Bhutan, Cambodia, Lao PDR and Uganda.

Chapter 1: Defining and Measuring the Development Dividend
Development Dividend Phase II 5
Sub-Sahara Africa 15 1.7 % 6,749 40,474 3.9 %
North Africa & Middle-East 13 1.5 % 2,998 18,858 1.8 %
World 860 100 % 152,661 1,035,851 100 %
Source: UNEP-Risø CDM Pipeline Overview, June 20 2006 version.
2. Stakeholder Interest in the Development Dividend Sections 3 and 4 elaborate and apply a framework for assessing the development dividend in CDM projects. Before doing so, we need to describe who might use that framework, and how; the answer will have a major bearing on the nature of the approach selected. There are at least three categories of potential users, each with needs and capacities that might argue for a particular type of approach. This section will describe the interest in a development dividend from the buyers’ perspectives, from the perspective of the host countries and from the perspective of the international policy community. 2.1. Buyers’ perspectives
The perspective of buyers for CERs is surveyed in depth in chapter 3, but for our purposes here it is useful to very briefly describe buyers’ motivations and characteristics. There are at least four different types of buyers of CERs, all with different motivations and needs with respect to the development dividend in CDM projects:
• Private sector and others seeking voluntary retail offsets • Intergovernmental Organization (IGO) buyers acting as fund managers for public/private buyers in
regulated markets, and in voluntary markets. • Private sector buyers looking to retire domestic obligations • Government buyers looking to retire domestic obligations
To date the voluntary retail market is relatively small, with even the biggest of the US brokers chalking up annual sales comparable to a single small-scale CDM project.7 Butzengeiger (2005), though, notes that 16 retailers, representing some 60 percent of the total global market, reported offsetting 9Mt CO2e in 2004. At this level, and given year-on-year increases in sales, the retail offset market may eventually be significant. Its key problems at the moment are a damaging profusion of standards (where standards are even published), and a lack of transparency about how criteria are assessed. Additionality is a critical concern. This is a market in need of common standards of conduct, lest it undermine its own credibility and ultimately its viability.8 It is not clear, however, that a standard for assessing the development dividend would be helpful; rather, what is needed by these buyers are standards that will cover additionality, leakage, monitoring, transparency and other fundamental issues. In fact, the Climate Group and the International Emissions Trading Association (IETA) recently teamed up to produce just such a standard: the Voluntary Carbon Offset standard. As well, a Gold Standard for voluntary offsets has been propounded by the same group that developed the Gold Standard for CDM.9 Neither standard has yet had wide uptake in the market.
7 Trexler and Kosloff (2006). 8 Ibid.; Taiyab (2005). 9 The Gold Standard is discussed in detail in Section 3.3.

Chapter 1: Defining and Measuring the Development Dividend
Development Dividend Phase II 6
Buyers in the regulated market, especially governments and IGOs, are under pressure to produce “quality” credits, particularly in the face of fierce civil society criticism of the legitimacy of the entire exercise of the carbon market.10 An internationally recognized standard for excellence would be helpful, provided it met the criteria of simplicity and ease of use. These buyers are feeling the pressure of considerable demand for credits on the one hand—engendered by large compliance gaps in Annex I—and a limited politically acceptable supply on the other.11 Private sector buyers in the regulated markets vary in their sensitivity to public sentiment about their purchases. Those that retail directly to consumers are most sensitive, as are those with active “green” shareholders. The less sensitive private sector buyers (probably the majority) are loathe to pay any sort of premium for a development dividend in the CERs they purchase, the differential being potentially a hard sell to shareholders, senior management and Board members all focused on the bottom line. But even those firms most vulnerable to public opinion face little pressure to go beyond compliance in achieving their mandated targets. As such, there may be a limited market for CERs high in development dividend for such buyers. This would change completely, however, if such CERs could be purchased at competitive prices, in which case the interest might be quite strong. 2.2. Host country perspectives
Host countries are responsible under the Marrakech Accords for determining whether a given project constitutes sustainable development. If it does, they issue a letter of approval that is a prerequisite for any CDM project. The assessment function is normally carried out by the Designated National Authority (DNA) – the mandated point of contact in each host country. There is no internationally set standard for what constitutes sustainable development in a CDM project, and rightly so. Sustainable development is a concept, like justice, that can only have meaning when it is applied in a particular context. All countries have different challenges, priorities, objectives, and thus all will have different definitions of sustainable development. The lack of any definition or even guidelines at the international level, though, presents a challenge to host countries, which must then undertake an exercise of defining exactly what constitutes sustainable development in a project setting. Most, if not all, have never had to come to grips with this question, and a wide diversity of approaches has resulted. UNDP (2006) surveys a number of DNA approval systems and concludes that the prevalent approach is “on balance -- net benefit.” In other words, the project should, when the environmental, social and economic impacts are balanced against one another, have a positive impact. In some cases DNAs seem to adopt the simple approach of ensuring that projects produce no harmful impacts. UNDP (2006) found few examples of projects being rejected on sustainable development grounds. A well crafted set of criteria and indicators for assessing the development dividend in CDM projects might be of some use to this constituency. While it is unlikely that the development dividend framework would be adopted as is by any DNA, it would constitute one of several good models on which DNAs might build in elaborating their own national systems of approval. As well, it might aid in directing policy makers as they consider what sorts of differential treatment to accord to various project types.
10 See, for example, Lohmann (2005). 11 International emission trading, for example, is seen as politically unacceptable in many jurisdictions. It is not allowed as currency in the current phase of the ETS, and a number of countries have pledged to limit the percentage of these credits in their international purchases. Hence the growing interest in “green investment schemes” that attach sellers’ environmental commitments to AAU purchases.

Chapter 1: Defining and Measuring the Development Dividend
Development Dividend Phase II 7
2.3. International policy community’s perspectives
The “international policy community” is used here to denote that group of stakeholders—made up of NGO, government, academic, private sector and IGO representatives—that concerns itself with the strength of the development dividend in CDM projects. The first phase of the Development Dividend Project sought to outline those concerns and unpack them to assess their validity, and discuss ways in which they might be addressed. This group is not completely distinct from the groups defined above; many of the stakeholders involved are CDM host country and private sector representatives. But the group is separately defined because it has a particular interest in seeing the development dividend defined and measured in such a way that it might be better assessed at both the level of the roster of CDM projects, and on a project-by-project basis. The framework should, for example, be able to tell us whether it makes sense to further promote small-scale projects or programmatic CDM on the basis of their development dividend benefits. The ultimate goal, as elaborated in the first phase report, is to increase the quantity of quality CDM projects (i.e., more CERs delivering a stronger development dividend). In the end, while other stakeholders might find value in a well crafted development dividend framework for assessing CDM projects, it will be to this group that the framework will be most useful, and it is to their interests that the framework primarily caters in its elaboration. Accordingly, this framework is not being proposed for formal adoption of any sort by the Parties – it is, rather, a useful tool that can be applied by researchers and others in assessing CDM projects against their objectives.
3. Assessing the Development Dividend in the CDM: The Options There is no single right way to measure the development dividend. In large part the propriety of any given approach will depend on the user of the tool. The previous section argued that the various stakeholders have different needs and capacities, and this section shows that each audience will be served differently by the various approaches. We will come back to this basic lesson in the next section, when defining a framework for the purposes of this project. This section will explore the ways in which we might measure the development dividend in CDM projects. It focuses mostly on the literature and experience of the international community with precisely that sort of measurement, but also draws lessons from other areas of practice in assessment. It looks at three types of tests currently in use for CDM projects:
• Qualitative threshold tests • Discrimination by project type • Multi-criteria analysis
3.1. Qualitative threshold tests
Qualitative threshold tests are the most basic way of discriminating between projects that do and do not foster sustainable development. They are used by some DNAs in the process of their approval of potential CDM projects. The purpose of a threshold test is to either approve or disapprove of a particular project, without grading them relative to one another according to some scale. The criteria used by most DNAs is qualitative in that it consists of a number of questions that are not scored as such, but to which the project proponent must deliver answers that, in the judgement of the DNAs, indicate that the project will deliver sustainable development as defined in the national context. Brazil, for example, asks the proponent to describe the impacts of the proposed project on:

Chapter 1: Defining and Measuring the Development Dividend
Development Dividend Phase II 8
• Local environmental sustainability • Development of working conditions and net job creation • Income distribution • Training and technological development • Regional integration and linkages with other sectors12
The responses may be framed in quantitative terms (job creation figures are frequently framed this way), but for the most part the answers will be qualitative verbal assessments. India, similarly, asks proponents for a discussion of how the proposed projects will impact social wellbeing, environmental wellbeing, economic wellbeing and technological wellbeing.13 China has threshold requirements that CDM projects should be consistent with China’s sustainable development strategies and policies, and with the overall requirements for national economic and social development planning. There are also more specific requirements that projects should promote the transfer of environmentally sound technology.14 All these requirements are presumably the subject of qualitative assertions by the project proponents in their submissions to the Chinese DNA. Qualitative threshold tests have the advantage of simplicity, since the criteria are not overly difficult to specify, and there is no need to rank projects. Their key weakness is their subjective nature, which makes them an unpredictable test, the results of which are not easy to independently evaluate. Neither can such tests be used for cross-project comparisons. While they might work for the purposes of DNA approval, they could not be used by buyers or the international policy community to analyze the development dividend at an international level. 3.2. Discrimination by project type
Another way of assessing sustainable development in CDM projects is by project type. Many buyers of CERs and some host countries discriminate among projects using a pre-defined set of project types to which they will give preference or penalty. China, for example, has defined as priority areas for CDM projects: energy efficiency improvement, development and utilization of new and renewable energy, and methane recovery and utilization. Other projects (in general, non-CO2/non-methane projects) are not deemed priorities. A system of levies or taxes on the proceeds of CER sales follows from this designation: projects involving HFC and PFC emission reductions are taxed at 65 percent, N2O -reducing projects are taxed at 30 percent and all others are taxed at 2 percent.15 The revenues collected will be devoted to sustainable development in China, in a process that is not yet well defined. In a similar vein, the Columbian Law Decreto 2755 (Art. 1), propounded in 2003, gives conditional tax breaks and allowances to certain types of CDM projects. It offers 15 year tax exemption on income from electricity sales from CDM project wind power, biomass and agricultural residue generation. To qualify, operators must devote half of the income from CERs to projects aimed at achieving local social benefits. A number of buyers of CERs also use a project-type discrimination. The World Bank’s Community Development Carbon Fund (CDCF), for example, distinguishes between project types that have ample “intrinsic” sustainable
12 ICGCC, 1999. 13 TERI, 2005 14 Zhu, 2006. 15 Zhu (2006) points out that this means that aforestation, reforestation and small-scale projects, while not listed as priority project types, in effect receive priority treatment.

Chapter 1: Defining and Measuring the Development Dividend
Development Dividend Phase II 9
development benefits (such as biogas and cogeneration projects) and those that have few such benefits (such as landfill gas capture). The point of the distinction is that for projects with few intrinsic benefits, the Bank pays a premium to project proponents to implement another project, usually unrelated to the original project, in effect broadening the project boundary to create a bundle with sustainable development benefits.16 For example, the proponents of the Olavarria landfill gas recovery project (Argentina, project 0140, ACM 0001) have undertaken to build a water distribution network to the households and public buildings of the nearby village, and install solar heating systems at the local schools. Premiums can range from $0.25 to $1 per ton of CO2e. The Dutch program of CER purchase, CERUPT, assigns penalties to certain project types.17 The offered price in a CDM proposal will be multiplied by a project factor and a technology factor to arrive at a final offer price, in effect making the higher factor project types offer their credits at a higher price. The prices for the 2001 tender are shown in Table 2. Table 2: CERUPT CER Price Premiums
Project Types CER Price Renewable energy (excluding biomass) € 5.50 Energy production by using clean, sustainably grown biomass (excluding waste) € 4.40 Energy efficiency improvement € 4.40 Others, among which fossil fuel switch and methane recovery € 3.30
Source: CERUPT 2001 tender In a similar vein, Belgium’s second tender for CERs and ERUs will involve some sort of evaluative discrimination to ensure “a broad portfolio of project types such as energy efficiency and renewable energy projects, small scale projects, projects in Africa, in a Least Developed Country and/or in a Partner Country of the Belgian Development Cooperation.”18 The modalities for this tender have not yet been publicly released. Project-based discrimination has a number of advantages. It is simple to administer, involving no judgement, weighting or indicators. It is internationally applicable, not specific to the context of any one country. Its shortcomings mirror its strengths, however. Its simplicity means that it has less validity as a true assessor of the development dividend: it is surely not true, for example, that all renewable energy projects yield high sustainable development benefits. As well, it is not capable of ranking projects against one another within project types. Finally, not being specific to any country’s circumstances means that this sort of test fails to reflect actual sustainable development impacts as they vary from country to country. 3.3. Multi-criteria analysis
Multi-criteria analysis (MCA) is a more complex system of discrimination, used where there are a number of elements on which one wants to rank a project, policy or program. It is particularly well suited to assessing sustainable development which, it is commonly agreed, combines environmental, social and economic objectives. As
16 This is akin to the idea, first suggested by Pearce et al., (1990) of a “shadow project” to ensure the sustainability of a project with negative or negligible sustainable development benefits. It is an important methodological question how to treat this sort of bundling when assessing the development dividend in CDM projects. The practice will become more widespread in the near-term; the World Bank (with the weight of its status as large-scale purchaser through its umbrella carbon facility) is actively encouraging countries with HFC and N2O projects to mandate the implementation of shadow projects as a prerequisite to project acceptance. 17 The figures cited here are from Senter (2001). 18 Taken from the Belgian CDM web site at http://www.klimaat.be/jicdmtender/ (last accessed August 8, 2006).

Chapter 1: Defining and Measuring the Development Dividend
Development Dividend Phase II 10
such, it has been widely proposed (and sometimes used) as a mechanism for ranking CDM projects by their sustainable development characteristics.19 The steps in a MCA are as follows:
• Chose criteria that express the values to be measured. In the context of the development dividend, these might include the sort of criteria listed in Box 1.
• Chose indicators that are good proxies for the achievement of the criteria. Box 1 shows how this might work.
• Choose a system of weighting that expresses the relative value to assign to the various criteria/indicators. • Score each project on each indicator, factor in the weighting, and tally up the totals.
The end result is a score for each project that can be used to rank it against other projects. This is a result that might be useful to DNAs, who might use it in combination with a points threshold to accept or reject potential CDM projects. Indeed, much of the literature focuses on the use of MCA by DNAs, recommending how it might be put into practice. In one of the few examples of this sort of use, Egypt used a weighted system of economic, social and environmental criteria and indicators to assess its potential CDM pilot projects as part of its National Strategy Study (NSS) exercise.20 MCA is also used by buyers of CERs who want to ensure a certain level of sustainable development benefits from the projects they support. One well-known scheme of this sort is the SouthSouthNorth Matrix Tool for Appraising the Sustainable Development Contribution of Clean Development Mechanism Projects.21 This tool is specifically designed for energy projects. Box 1 shows the criteria (roughly corresponding to the standard environment, social and economic), and indicators used. Each indicator (or sub-level indicator) is scored from -2 (major negative impacts) to +2 (major positive impacts). Several threshold tests are part of the matrix: for example, no individual element may score -2, and no criterion subtotal may score less than zero. There is no weighting scheme, meaning all have equal weight.
Box 1: The SSN Matrix Criteria and Indicators
Criterion 1: Local/regional/global environment
• Water quality and quantity • Air quality (other than GHG) • Other pollutants • Soil condition • Biodiversity
Criterion 2: Social sustainability and development
• Employment quality (incl. job quality, labour standards) • Livelihood of the poor (poverty alleviation, income dist, access to services, access to energy services) • Human and institutional capacity (empowerment, education, involvement, gender)
Criterion 3: Economic and technological development
• Employment
19 See, for example, Olhoff et al., (undated); Anagnostopoulos et al., (2004); Begg et al., (2003); Brown et al., (2004); Sutter (2003); Sutter and Parreño (2005); Sutter and Parreño (2005). 20 See Kamal (2005), Chapter 6. 21 Thorne and Raubenheimer (undated); updated by SSN (undated).

Chapter 1: Defining and Measuring the Development Dividend
Development Dividend Phase II 11
• Balance of payments • Technological self-reliance (replicability, hard currency liability, skills development, institutional capacity,
technology transfer)
The SSN Matrix has been used by SSN itself, to rank projects it might want to develop. It has also been used as part of the Gold Standard scheme for CDM projects. The Gold Standard is a set of requirements—over and above those mandated by the EB and the host state—that CDM project proponents voluntarily take on in order to gain certification. The Gold Standard label strives to connote both a quality investment prospect (it involves stricter requirements for additionality, public participation and monitoring than those imposed by the EB), and strong sustainable development benefits in the host country. Only renewable energy and demand-side energy efficiency projects are eligible, and the project must pass the test of the SSN Matrix, which the Gold Standard incorporates. There are currently three Gold Standard CDM projects in the process leading up to registration, and one registered project.22
Another scheme using a partial MCA approach (in effect, more like a checklist) is the Climate, Community and Biodiversity (CCB) Project Design Standards.23 These standards, elaborated by a group of NGO, RINGO and private sector stakeholders, are designed to be used in land use and land use change and forestry (LULUCF) projects, but not necessarily in the context of CDM.24 The framework involves 23 criteria, grouped under “general” (mostly CDM-compatible eligibility criteria), “climate” (ensuring GHG reductions), “community” and “biodiversity”. Fifteen of the criteria are threshold requirements for approval, such as providing a baseline, reducing GHG emissions, having a community monitoring plan, and generating positive biodiversity impacts. The remaining eight criteria are so-called “scoring” elements (see Box 2). A project that satisfies all the requirements is approved. One that achieves a scoring point in each category merits a “Silver” rating. If, in addition, the project scores six of eight points, it rates “Gold” status. The CCB approach does not assign weighting, nor does it actually score the indicators, but rather it simply assigns them a pass/fail mark.
Box 2: The “scoring” elements of the CCB Standards
General:
• Adaptive management for sustainability • Knowledge dissemination
Climate:
• Adaptation (so project benefits are not eroded) • Carbon credits withheld from regulated markets
Community:
• Capacity building • Best practices in community involvement
Biodiversity:
• Native species use • Water and soil resource enhancement
22 Gold Standard database at http://www.cdmgoldstandard.org/projects.php. Accessed August 8, 2006. 23 CCBA (2005). 24 In fact one of the “scoring” or bonus criteria is that carbon credits are not sold into regulated (e.g., CDM, JI) markets where they would retire Annex I Kyoto obligations.

Chapter 1: Defining and Measuring the Development Dividend
Development Dividend Phase II 12
Along the same lines, South Africa’s DNA uses a system of 25 indicators for environment, economy and social criteria, but does not use a weighting or scoring system. Rather, the indicators are used as guidelines for proponents and DNA evaluators in coming to a final decision about the sustainable development impacts of a given project. In the final event, this approach is somewhere between MCA and a quantitative threshold evaluation. The beauty of the MCA approach is that it yields a ranking that can be used to compare projects to one another. Another advantage is that it can be adapted to local priorities. The choosing of the criteria and indicators, and the assignment of weights, can be done by local stakeholder groups in each jurisdiction where the approach will be used, to ensure that what is being measured is sustainable development as relevant in the local context.25 Alternatively, Olhoff et al., (undated) propose basing the criteria and indicators on previously agreed principles or obligations, such as the Millennium Development Goals, or the nationally-prepared Poverty Reduction Strategy Papers. UNDP (2006) notes that several countries have done this in elaborating their definitions of sustainable development. The limitations of the MCA approach are, first, its complexity. The choice of indicators is something of an art – Olhoff et al., (undated:37-38) argues that they need to be complete, operational, decomposable, non-redundant and minimal. Choosing the “right” group of stakeholders, or the “right” pre-agreed principles or obligations is also a challenge. The information needs are typically daunting, and almost certainly go beyond what is available in the PDD. Moreover, the price of validity for the local context (in frameworks where local stakeholders are used) is that projects cannot be compared from one jurisdiction to another. While such a system might work well for DNAs, it would not serve buyers, or the international policy community, both of which are looking for frameworks that yield cross-country comparability.
4. A Framework for Assessing the Development Dividend in CDM Projects This section presents a framework for assessing the development dividend in CDM projects, based on the experience and analysis surveyed above, and on the objectives of this project, fitting the tool to the job it is intended to do. It then proceeds to use the framework to analyze the projects registered to date (as of June 15 2006). 4.1. Defining the user
It has been repeatedly noted above that properly assessing the development dividend in CDM projects depends on defining the user of the assessment process. For the purposes of the Development Dividend Project the primary user will be the international policy community concerned about the ability of the CDM to deliver on its development promises. While there are a number of assessment approaches used by host countries and buyers (described in section 3), there are none to date that might be used by the international policy community to assess the strength of the development dividend in the CDM project roster, or on which to base recommendations for action by negotiators, host governments, home governments, buyers, IGOs, aid agencies and other influential actors. That said, there is reason to believe that a well constructed framework might also be useful to buyers and host countries. While many of the needed standards relate to process and additionality, there may also be a market for credits that can claim to deliver a strong development dividend. Government and IGO buyers might also welcome a simple but robust standard for assessing the development dividend, and adapt it for their own use.
25 Brown et al., (2004) Begg et al., (2003) and Sutter (2003) followed this approach. Olhoff et al., (undated) stress that such an approach is the only legitimate way to choose weights and criteria. Thorne and Raubenheimer (undated) report that the SSN Matrix was modified in its application by the regional SSN offices to reflect local priorities.

Chapter 1: Defining and Measuring the Development Dividend
Development Dividend Phase II 13
4.2. The development dividend framework
For the purposes of assessing the strength of the development dividend in individual projects, and in the project roster as a whole, it will be necessary to have a framework that can deliver a score for any given project. This need mandates some sort of MCA approach, using criteria and indicators. That said, the framework should avoid the classic pitfalls of the MCA approach by minimizing the information requirements, to the extent possible. The framework proposed here uses the information available in PDDs and validation reports. It uses an international approach, rather than one based on input from national-level stakeholders, to allow for comparability of projects and aggregation of results. Finally, it aims for simplified scoring; the SSN scoring approach, using a narrow scale of judgement, is a guiding model. The development dividend framework, outlined below in Box 3, follows widely accepted practice, including social, environmental and economic dimensions. The number of criteria is limited, and is covered in the information available in PDDs and validation reports, supplemented by publicly available statistical information. All criteria are scored in a range from 0 – 2, with some limited possibilities for negative scores. Criteria are both quantitative and qualitative; the latter are unavoidable, for example, in the context of most social criteria.26 But where possible objective scoring is used for the criteria. The framework is flexible enough to cover the wide range of project types occurring under the CDM, using as categories the 23 project types used in the UNEP-Risø’s CDM pipeline.27 Scoring follows clearly articulated rules for each different project type, though there is consistency across project types for similar types of considerations. For example, construction employment is scored similarly across almost all project types. The basis for scoring is outlined in Annex I, where the scoring rules for the various project types are spelled out in detail.
Box 3: Criteria for the Development Dividend Framework
1. Economic: a. Does it generate employment in significant amounts? Here the focus is not on
construction employment (though such employment is not completely discounted), but on long-term opportunities.
b. Does it have balance of payments/foreign exchange benefits? Does the project reduce the need for significant imports, for example, of fossil fuels? Does it significantly boost the prospects for exports (by creating transportation infrastructure, reliable energy supply, etc.)?
c. Does it involve technology transfer/capacity building? Does the project use local suppliers, or otherwise build up the capacity of local manufacturers, local users, to adapt and utilize new technologies?
2. Social: a. Does it benefit marginalized populations economically (e.g., employment
creation, income supplement)? Construction employment is heavily discounted here in favour of ongoing employment opportunities.
b. Does it benefit marginalized populations environmentally (e.g., reduced resource degradation, reduced health-damaging pollution)? Criteria 3(a) and
26 Olhoff et al., (undated:41). 27 UNEP-Risø (June 2006 version).

Chapter 1: Defining and Measuring the Development Dividend
Development Dividend Phase II 14
3(b) pose the question whether these sorts of environmental improvements occurred. Here the question is whether those improvements resulted in a significant portion of benefits going to marginalized populations.
c. Does it provide energy to energy-poor populations? Does any energy generated go to satisfying the needs of energy poor populations? Alternatively, do a significant number of energy-poor people benefit, even if their numbers as a percentage of total beneficiaries are low?
d. Does it increase adaptive ability, resilience of communities, regions? The project might do this by allowing the community to take ownership of the project or the technology. Or it might involve capacity building to help the community use or replicate the technology. Or the project might have inherent adaptation benefits.
3. Environmental a. Does the project reduce polluting emissions (air, water, soil)? GHG emission
reductions are not counted (unless reducing those emissions serves a non-climate change-related environmental goal, such as preventing ozone depletion). They are assumed to be reduced, and that reduction does not constitute part of the development dividend.
b. Does the project prevent and/or reduce natural resource degradation? It might do this by, for example, reducing the use of fuelwood, protecting biodiversity. Reducing the draw-down of non-living resource stocks (such as fossil fuels) does not count toward this criterion.
c. Does the project “green” the process of energy production? Does it involve deriving energy from renewable sources, or from sources that are less polluting than the baseline? Does it increase the efficiency of energy use? (Bonus: actually displaces dirty energy – no leakage or simple fulfillment of suppressed demand.)
d. Does it foster development, dissemination of new energy technologies/sources? Does the project contribute to a fundamental restructuring of energy regimes by using new “green” technologies for energy production? The key here is that the technology should be relatively new. Green and traditional is not sufficient; this is already captured in criterion 3(c).
It was noted above that in MCA analysis the various criteria must be weighted to be meaningfully aggregated (an unweighted analysis implies equal weighting for all criteria). The criteria used here were weighted by a survey of the members of the Development Dividend Task Force, an international advisory group of experts drawn from a wide range of backgrounds and affiliations (see Annex II). Box 4 below shows the weights assigned to the various criteria by the respondents in this group.
Box 4: Weighting Used in the Assessment Framework
WEIGHTS
1. Economic: 3.5
a. Does it generate employment in significant amounts? 3.4
b. Does it have balance of payments/foreign exchange benefits? 3.2
c. Does it boost the capacity of local manufacturers, local users, to adapt and utilize new technologies?
3.9

Chapter 1: Defining and Measuring the Development Dividend
Development Dividend Phase II 15
2. Social: 3.7
a. Does it benefit marginalized populations economically (e.g., employment creation, income supplement)?
3.6
b. Does it benefit marginalized populations environmentally (e.g., reduced resource degradation, reduced health-damaging pollution)?
3.9
c. Does it provide energy to energy-poor populations? 3.9
d. Does it increase adaptive ability, resilience of communities, regions? 3.4
3. Environmental 4.1
a. Does the project reduce polluting emissions (air, water, soil)? 4.4
b. Does the project prevent and/or reduce natural resource degradation?
4.2
c. Does the project “green” the process of energy production? 4.0
d. Does it foster development, dissemination of new energy technologies/sources?
4.0
The framework was applied to the 215 projects registered by the Executive Board as of June 15, 2006. The results are presented in Annex 3, and are analyzed in some detail below. An overall development dividend score (DD score) is derived for each project by applying the weights above to the raw scores reported in Annex 3, and then scaling up the results to obtain a figure between zero and one hundred. The basis for the application of the frameworks was, again, the PDDs and validation reports for each project, as well as publicly available statistical information. Each PDD contains a description of the sustainable development benefits the proponent expects the project to deliver, as well as other relevant information, such as detailed descriptions of the technology used and baseline calculations. This approach, while subject to significant shortcomings (discussed in detail below) allows for project-specific variation without losing the simplicity of the project-type assessments discussed above. 4.3. Limitations of the development dividend framework
There are several limitations to the approach used here, and they should be fully explained before the presentation of the analysis. First, and foremost, this framework assumes that sustainable development can in fact be defined at the international level, and that those definitions will be appropriate in varying national and regional contexts. This is obviously untrue, but it is also a necessary simplifying assumption, barring the resources necessary to engage stakeholders in each of the 32 host countries for the registered projects under analysis, and to have them create and weight criteria and indicators relevant to their particular settings.28 Second, it uses the PDDs and validation reports as a basis for assessment, meaning it cannot evaluate projects on the basis of how they are implemented in practice. But implementation matters a great deal. Lohmann (2005) assembles a damning critique of LULUCF projects, but in fact most of the damnation is based on egregious project implementation such as exploitation of local landowners, disregard for the sustainability of the resource base, etc. Similarly, it has been charged that some biomass energy projects in India, despite claims in the PDDs that they
28 Even where such exercises have been carried out (see supra. at 19), there is uncertainty as to the legitimacy of the results; were the stakeholder groups representative? Is a national-level approach appropriate, or should the exercise be carried out at regional or sub-national levels? How often should the criteria, indicators and weights be re-evaluated to respond to new circumstances?

Chapter 1: Defining and Measuring the Development Dividend
Development Dividend Phase II 16
would use only surplus biomass as fuel, are actually causing significant deforestation.29 These sorts of deficiencies, while vitally important to the final character of the project impact, are not readily discernable ex-ante from the PDDs and validation reports, and can only be derived from careful monitoring and ex-post analysis. As such, the DD scores are best understood as ratings of the development dividend potential for each project, assuming good practice is followed in the project implementation. A related issue is that many of the sustainable development related claims made in the PDDs (such as employment generation projections, promises to contribute to employee and community well-being, etc.) are not verified in the monitoring process, and thus are less credible than might be desired for rigorous analysis. As such, the framework relies almost exclusively on PDD information that is subject to monitoring. A final related issue is that using the PDDs and validation reports does not allow us to judge the projects on some grounds that are widely agreed to be important for sustainable development. In particular, it is difficult to judge from those sources whether there was meaningful public participation in the consultations leading up to the project. There is, of course, a requirement for public consultations in the process leading to registration, but it is notoriously difficult to discern, from written accounts such as those found in the PDDs, whether the consultations were undertaken in good faith.30 Third, the analysis undertaken here is limited in scope. It uses only those projects which are already registered – the minority of what has been called the project pipeline, which also includes projects for which registration has been requested and projects in the process of validation. Ideally the analysis would be conducted on this larger group, which presumably better reflects the trends in CDM project development, even if some of them may not eventually become registered projects. A specific illustration of the problems with limited scope is this: the analysis includes no LULUCF projects, since none were registered at the time of this analysis. Yet some analysts argue that LULUCF projects have enormous potential for delivering development dividend-type benefits, particularly in those countries where there is little opportunity for other types of CDM investment. Fourth, the DD score by itself does not reward projects for quantity, but rather only for quality. A very small project might deliver good development dividend results in many categories, and be rated significantly higher than a project that delivers mediocre DD scores, but which is of a much larger scale (and thus potentially more beneficial overall). This problem also means that it is impossible to tally up the “amount” of development dividend in a buyer’s portfolio—one of the requirements for a good assessment framework, according to a background paper prepared for this exercise.31 Comparison based on project size must be left to analysis that goes beyond the basic DD score (as does some of the analysis below). Finally, it is difficult to use the framework for comparing project types when elements of the scoring depend on national circumstances. For example, geothermal projects rate high in the DD score, but that is at least in part because the existing projects all occur in regions of energy poverty. A similar geothermal project in an energy-rich region would not rate as well. So the DD score obtained by geothermal projects overall is not solely derived from the characteristics of that project type alone. This is a shortcoming that erodes the value of the project-type comparisons made in the analysis below. But it certainly does not extinguish that value; most of the indicators are project- and technology-specific, rather than dependent on national circumstances.
29 CSE (2005a). 30 CSE (2005b) found convincing evidence that some consultations had been perfunctory exercises, or worse, the validators’ reports of the meetings having simply been copied and pasted verbatim from one project to another. 31 Zhu (2006).

Chapter 1: Defining and Measuring the Development Dividend
Development Dividend Phase II 17
It is important to stress that the Development Dividend Framework presented here is a first attempt, and undoubtedly will benefit from the refinement that can come from public exposure and input. In that sense, it should be seen as a living effort, open to constant improvement.
5. Analysis: Applying the Development Dividend Framework
5.1. Scores by project category
Figure 3 shows the results of the scoring by project category. They range from a high of over 50 (all DD scores are expressed in a range of zero to 100)32 for solar and household energy efficiency to a low of under 10 for HFCs, N2O and agriculture (agriculture projects in the roster are almost exclusively animal waste management operations, aimed at reducing methane emissions through flaring). It is worth noting that the top scoring project categories involve only a few projects: there are three household energy efficiency projects, two solar projects and one energy efficiency service project, which combined constitute less than 3 percent of registered projects. All of these have the characteristics of traditional development assistance projects, with the deliberate aim of improving the lot of the poor.
Figure 3: DD Scores by Project Category
0
10
20
30
40
50
60
HFCsN2O
Agricu
lture
Fugitiv
e
Land
fill ga
s
Cemen
t
EE indu
stry
Fossil
fuel
switc
h
Biomas
s ene
rgy WindHyd
ro
Geothe
rmal
Biogas
EE servi
ceSola
r
EE hous
ehold
s
The three lowest scoring categories, by contrast, cover a larger number of projects; there are six HFC projects, two N2O projects and 21 agricultural projects, comprising over 13 percent of those registered. These projects all seem primarily aimed at reducing gases with high global warming potential, rather than at any sort of development
32 Recall that while scores may seem low out of a potential 100, it was cautioned earlier that the scores given here are only valid for cross-project and cross-project-type comparisons. They are not valid as indicators of the absolute level of development dividend benefits achieved by a project, or by the project roster. In other words, the generally low level of the scoring is not necessarily indicative of a low level of achievement of development dividend benefits in the roster as a whole.

Chapter 1: Defining and Measuring the Development Dividend
Development Dividend Phase II 18
objectives, and perhaps as a result they achieve a remarkable success in terms of total CERs generated. At just over 13 percent of projects, they account for 76 percent of CERs in the roster, or 51.7 million annually. The six projects in the top three categories, by contrast, aim to produce just under 0.1 million CERs annually, or about a hundred times less per project. Given the current interest in LULUCF projects, and in particular the debates over their inclusion in the European Trading System’s second phase, it would be instructive to analyze such projects. However at the time of this writing none had been registered, and there were only two in the pipeline, providing an insufficient base for analysis. 5.2. Is small beautiful?
The figures presented in the previous section lead to the obvious question: is there an inverse relationship between project size and development dividend? A number of analysts either make this assumption (for example, Humphry (2004), Cosbey et al (2005), Olsen (2005) – the latter two recommend research to test their assumption), or come to this conclusion as a result of their analysis (Begg et al. (2003)).33 Certainly the top three and bottom three scoring project categories show such a relationship, as noted above. To push this analysis further: the top-scoring 10 percent of projects in the roster (21 projects) account for just 1.4 percent of the roster’s CERs, at just under one million. The lowest-scoring 10 percent account for over 75 percent of the roster’s CERs, at over 50 million. Figure 4 attempts to display the relationship graphically, plotting annual CER volume against DD score. For the purposes of this graph, HFC and N2O projects are not included – they occur at an extreme position in the upper left quadrant of the graph, and if graphed would make the scale such that all remaining points appeared to lie along a horizontal line. While they are not shown here, the HFC and N2O results do support the inverse relationship we have hypothesized. The remaining project categories display the same trend, but there are some outliers: geothermal, landfill gas and fugitive gas capture, all of which are distinguished by a relatively strong performance on both CER generation and development dividend scoring. Figure 4: CERs and DD Score: A Trade-Off?
33 Note that while Begg et al. assert that sustainable benefits, including poverty alleviation, can be more directly provided through small-scale projects especially community projects,” they also find that some types of small-scale projects (such as charcoal kilns) are poor at doing so.

Chapter 1: Defining and Measuring the Development Dividend
Development Dividend Phase II 19
0
50
100
150
200
250
300
350
0 10 20 30 40 50 60
DD Score
Ann
ual C
ERs/
proj
ect (
1,00
0s)
Agriculture
FugitiveLandfill gas
Cement
EE industryFossil fuel switch
Wind
Hydro
Biomass energy
Geothermal
BiogasEE service
EE houseSolar
Note: HFC and N2O projects are not plotted on this graph.
It is also possible to break down the projects by scale, using the Kyoto Protocol definition of small scale projects, and dividing large-scale projects into large and very large projects – the latter being those that generate over 500,000 CERs annually. Figure 5 shows such a breakdown. The dynamic here seems clear: small-scale projects tend to yield greater development dividends, and very large-scale projects yield comparatively few. The basic relationship holds across all three elements of sustainable development: social, economic and environmental, though the spread is much weaker in the area of economic benefits. As noted above, the superiority of small-scale projects has often been assumed in the literature (see Cosbey et al., 2004), but to date has not been demonstrated. While it may seem intuitively reasonable that smaller projects deliver greater DD scores, there is no obvious reason to think that they might do so a priori, so this sort of assessment is a valuable backstop for policy-making.

Chapter 1: Defining and Measuring the Development Dividend
Development Dividend Phase II 20
Figure 5: Scores by Project Characteristics
0
5
10
15
20
25
30
35
40
45
50
DD Score Economic Social Environment
SmallScale
LargeScale*
Verylarge**
*Large scale includes all Kyoto-defined large scale projects, excluding those that are defined here as very large.
**Very large projects are defined as producing over 500,000 CERs annually.
The scores for environment, social and economic criteria have been normalized here to a scale of zero to 100.
The argument in favour of small scale is not clear cut, however. For one thing, the variation in development dividend delivered as a function of project size is not nearly as great as the variation as a function of project type.34 That is, in terms of delivering the development dividend it makes much more difference what kind of project it is than what size it is. For another thing, there are some glaring exceptions to the “small is beautiful” relationship noted above. Two small-scale projects in fact are among the worst 10 percent of DD scorers in the roster. One of them – the Lages methane avoidance project – begs the question of whether the definition of small-scale as currently used is appropriate. The project is, in terms of CER generation, fairly large – yielding over 220,000 CERs annually. These volumes, however, are due to methane emission avoidance, while the emissions generated by the project activity are minimal enough to qualify it as small-scale, with all the attendant simplifying benefits conferred by that designation.35 It is worth noting that the EB, at its 25th meeting, noted the lack of small scale energy efficiency projects in the roster, and called for public inputs on the current definition of small scale projects of this type.36 It is also worth noting that of the seven registered small scale energy efficiency projects, four are among the top ten DD scorers.
34 This line of analysis takes its lead from the analysis in Olsen and Fenhann (forthcoming). 35 This loophole in the definition of small-scale was closed by the Executive Board at its 26th meeting, September 2006 (See the meeting report, Annex 26). 36 As of August 6 2006, there were no inputs in response to this call.

Chapter 1: Defining and Measuring the Development Dividend
Development Dividend Phase II 21
Exceptions in the other direction also exist. There are two significant CER generators in the top 10 percent of DD scorers: the Lihir geothermal power project (278,904 CERs annually) and the Essaouira wind power project (156,026 CERs annually). The lesson to be drawn here is that it is possible to have both of the Kyoto Protocol Article 12 objectives simultaneously fulfilled, generating high volumes of low-cost GHG emission reduction, and at the same time fostering sustainable development in the host country. A related lesson is a reiteration of the conclusion from above: while small-scale may have better tendencies toward development dividend benefits, it is not the only option (or even necessarily the best one) for achieving those benefits. A focus on project types, for example, might yield greater benefits. A final consideration is that the very large projects have much higher potential to contribute to sustainable development through the imposition of taxes that could then be devoted to sustainable development initiatives. This possibility is taken up in greater detail in the following section. 5.4. Is big bad?
There are at least two arguments against rushing to negative judgement of large-scale CDM projects on development dividend grounds. For one thing, the framework applied here is not able to deliver scoring on an absolute basis, where large-scale projects may have an advantage. For another, large-scale projects may be large enough to allow the creation of beneficial “shadow projects.” Both of these arguments are explored in this section. The Development Dividend Framework, as noted in section 4.3, can only assess how well a project performs relative to its size. That is, it can tell us that a project does very well for a small-scale project, or that it does very poorly for a large project. But it cannot tell us whether the large project, in spite of its poor performance, still manages to turn in a better absolute level of benefits than does the small-scale project. That is, a large project may generate very few economic benefits per CER, but even so, if it produces many megatonnes of emissions reductions it may easily out-perform a small-scale project on an absolute basis. While the intrinsic quality of a project—as measured by the Development Dividend Framework—is important, from a policy-maker’s perspective, the absolute level of benefits is at least as important. But it would be impossible on the basis of the PDDs and validation reports to deliver any information on the latter. To do so we would need to know the absolute level of performance on each of the various indicators: how many person-years of employment, amount of balance of payments impact, levels of reduction in local pollution levels, and so on. In the end, we can only inject a note of caution about the conclusions reached above on the relative merits of small and large projects. A second argument for such caution relates to the potential of very large-scale projects, by dint of their size and profitability, to fund parallel sustainable development projects that improve their overall impact. For example, China’s 65% levy on HFC-derived CERs will mean, assuming a price of EUR 10/tonne and counting just the HFC projects in the pipeline as of September 2006, a contribution to its sustainable development fund by 2012 of over EUR 3 billion. The final size of this fund will undoubtedly be many times this amount. The World Bank, as a large-scale purchaser of CERs, has been involved in trying to persuade governments hosting very large projects to “tax” the rents for sustainable development, in an approach similar to the Chinese levy system. The final result of all these levies will undoubtedly be a significant development dividend-type impact. None of these benefits, however, are counted in the framework used here, for obvious reasons: it is impossible to evaluate the contributions made by funds that have not yet been spent, constructed on principles and managed by rules that are not yet known. Moreover, there is no requirement to monitor any such benefits as part of the CDM process. It should also be noted that the value of the tax/fund-based model rests on the assumption that governments will spend the collected funds on successful sustainable development initiatives that would otherwise not have been undertaken. There is no reason to believe, a priori, that these criteria will always be fulfilled. As an instructive study in the potential problems with this model, note the difficulties encountered by the World Bank in making the government of Chad stick to a condition of its oil infrastructure lending: that 10% of derived oil revenues be

Chapter 1: Defining and Measuring the Development Dividend
Development Dividend Phase II 22
funneled into a fund for fighting long-term poverty.37 An absolute minimum prerequisite for success is that the national priorities remain focused on the achievement of sustainable development (in Chad, priorities were diverted to military pursuits). Beyond that, success depends on the ability of governments to select and invest in cost-effective sustainable development initiatives. The question of additionality adds another layer of complexity; would the initiatives have been undertaken even if the fund had not existed? In the end, we should not be too quick to say big is necessarily bad under the CDM, though the results obtained in the application of the Development Dividend Framework are rather unequivocal in this regard. 5.3. Programmatic and unilateral CDM
There are at least two other types of CDM activities that bear analysis under the development dividend framework: programmatic CDM activities and unilateral projects. Unilateral CDM projects have no declared investor at the time of registration – that is, the host country actors are the only proponents. Many of these projects are undertaken by firms performing in-house process changes. At one point in the evolution of the CDM rules there was some controversy about registering this project type at all, with some arguing that it went against the intentions of the Marrakech Accords, and would not foster the kind of technology transfer that many hoped for as a result of the CDM. Now nearly half of the registered projects are unilateral (102 of 215), and there is very little rules-based discrimination against them. Some analysts argue that these types of projects have a number of potential advantages over non-unilateral projects, for example by lowering transaction costs and increasing supply of CERs.38 UNDP (2006) argues that they also make the CER market work better, by eroding the price influence of the major buyers and increasing price transparency.
Figure 5a gives a comparison between unilateral and non-unilateral projects, assessing how well each scores overall, and by the individual elements of sustainable development: economic, social and environmental. In the final event there is very little measured qualitative difference between the two project types. While environmental benefits are higher in unilateral projects and economic benefits are higher in non-unilateral projects, the overall DD scores are almost identical. On the basis of development dividend results, at least, there seems to be little ground for discriminating between unilateral and non-unilateral projects. Programmatic CDM is not a project as
such, but rather a program of activities (such as the administration of an appliance efficiency standard) that results in GHG emission mitigation. Programmatic CDM was not explicitly approved as legitimate until the EB’s 22nd meeting
37 See World Bank (2005). Also see the BBC News report “Chad Defies World Bank over Oil,” January 12, 2006. Accessed at http://news.bbc.co.uk/1/hi/world/africa/4604964.stm, August 30, 2006. 38 See Kjellen et al. (2005), pp. 9-10.
Figure 5a: Unilateral vs. Non-unilateral
0
5
10
15
20
25
30
35
40
DD Score Economic Social Environment
Unilateral
Non-unilateral

Chapter 1: Defining and Measuring the Development Dividend
Development Dividend Phase II 23
in November 2005 in Montreal, 39 but Figueres et al. (2005) argue that several CDM activities already in the pipeline at that point (including one registered project) had programmatic characteristics. Since that analysis a number of new methodologies have been proposed (and one approved), and several “projects” have been registered, giving us a small but viable group of 14 CDM activities to run through the development dividend framework for analysis. Box 5 describes the activities in question, and the development dividend framework results.40 Programmatic CDM, like small-scale CDM, has been held up by several analysts as promising from the perspective of environmental, social and economic benefits.41 Figueres et al. (2005: 36) argue that:
“The lessons learned from the programmatic CDM activities in the current UNFCCC CDM pipeline support the intuitive understanding that this type of CDM activity can broaden the scope of the CDM for energy efficiency and for fuel switching measures, as well as for the use of renewable energies in the household sector, in transportation and in small enterprises, areas with significant social and economic benefits that are currently under-represented in the CDM.”
Sareen and Bhandari (2006), on the basis of a survey of 25 registered Indian CDM projects, argue that programmatic CDM may have a better chance of effecting fundamental systemic change than would a myriad of uncoordinated smaller projects. One problem with using the PDDs from the five pre-validation projects is that most of the methodologies have not yet been approved, and the final versions may be revised to reflect a more conservative estimate of GHG emission reductions, or may be rejected. In fact, as of mid-August 2006, the compact fluorescent lighting (CFL) projects in Ghana and China have been sent back for methodological revisions (the latter will need substantial changes). Nonetheless, the CFL projects were kept in the analysis on the assumption that the changes needed would affect mostly the monitoring methods used, and would not significantly affect the emission reductions projected (though the Chinese project will likely have to revise its leakage calculations upward).
39 See UNFCCC (2005), para. 20. There remain significant uncertainties as to what the EB actually approved in Montreal—uncertainties that will probably only be resolved in course of the project approval process. 40 Two CDM activities are not included in Box 3, or in the analysis of programmatic CDM activities: NM 144 Mongolia ESCO boilers, for lack of national data, and NM 158 Mexico Insurgentes, because as of August 8 the Methodology Panel had recommended that this methodology be rejected. 41 See for example Cosbey et al. (2005).

Chapter 1: Defining and Measuring the Development Dividend
Development Dividend Phase II 24
Box 5: Programmatic CDM Activities in the Pipeline
Title Host Party
Annual CERs Type
DD score Status
Open-DSM type CDM for Green Lighting in Shijiazhuang city, China China 85,292
Demand-side management 19
methodology needs revision (NM 157)
Ghana efficient lighting retrofit project Ghana 121,790Demand-side management 15
methodology needs revision (NM 150)
Implementation of an Efficiency Testing, Consumer Labelling and Quality-Assurance Program for Air Conditioners in Ghana Ghana 434,754 Energy demand 24
methodology under consideration (NM 159)
Methane abatement through composting. (Version 02 Date: 30 Dec 2005) Malaysia 165,074 Biomass energy 23
methodology under consideration (NM 147)
BRT Bogotá, Colombia: TransMilenio Phase II to IV
Colombia 246,563 Transportation 18
methodology approved (AM 0031)
Marketing of low cost irrigation devices in rural areas of Bihar and Uttar Pradesh India 10,623
Energy efficiency 38
in process of validation
Biodiesel production and switching fossil fuels from petro-diesel to biodiesel in transport sector - 30 TPD Biodiesel CDM Project in Andhra Pradesh, India India 25,948
Biomass energy, fuel switching 38
in process of validation
Kuyasa low-cost urban housing energy upgrade project, Khayelitsha (Cape Town; South Africa)
South Africa 6,580 EE household 48 registered
Photovoltaic kits to light up rural households in Morocco Morocco 38,636 Solar 51 registeredBiogas Support Program - Nepal (BSP-Nepal) Activity-1 Nepal 46,990 Biogas 58 registered
Bagepalli CDM Biogas Programme India 19,553 Biogas 56 registered
CDM Solar Cooker Project Aceh 1 Indonesia 3,500 Solar 56 registeredMoldova Biomass Heating in Rural Communities (Project Design Document No. 2) Moldova 17,888 EE household 57 registeredMoldova Biomass Heating in Rural Communities (Project Design Document No. 1) Moldova 17,888 EE household 57 registered
Totals 1,241,079Averages 88,649 39.9
Note: Source is UNFCCC web site. Information current as of August 8, 2006.
Figure 6 presents the scoring results plotted in the same graphical space used for Figure 4 above. Results for the entire group of projects are shown, as well as results for the five pre-validation projects. Both represent a welcome

Chapter 1: Defining and Measuring the Development Dividend
Development Dividend Phase II 25
departure from the trendline, doing relatively well at both DD score and CER generation. It is worth noting, however, that the newer projects (those not yet registered or in the process of validation) represent a fundamentally different sort of proposition, focused mainly on demand-side management and standards & labeling. These show a strong ability to generate CERs, and a somewhat lower scoring on the development dividend. Another consideration in assessing the potential of programmatic CDM is that the projects currently in the pipeline (the “programmatic pioneers”) are not reflective of the full potential of this project type. The Kuyasa energy upgrade project, for example, is in essence a pilot project, capable of being scaled up to a massive level of coverage. This is an inherent characteristic of the programmatic project type, but has not yet been exploited, as the first few projects seek to development new methodologies and learn the hard lessons of early practice. All in all, the results seem to validate the intuitive assumption that programmatic CDM has potential to deliver both quality and quantity. A true assessment of that potential, however, will have to wait for the registration and implementation of more projects than are currently available for analysis. Figure 6: Programmatic CDM, CERs and DD Scores
0
50
100
150
200
250
300
350
0 10 20 30 40 50 60
DD Score
Ann
ual C
ERs/
proj
ect (
1,00
0s)
Agriculture
Fugitive
Landfill gas
Cement
EE industryFossil fuel switch
Wind
HydroBiomass energy
Geothermal
BiogasEE service EE house
Solar
Programmatic (new meths)
Programmatic (all)
Notes: HFC and N2O projects are not plotted on this graph.
New programmatic CDM includes the five projects from Box 5 that are seeking methodology approvals. All programmatic CDM also includes seven registered projects, and two in the process of validation.

Chapter 1: Defining and Measuring the Development Dividend
Development Dividend Phase II 26
5.4. Regional distribution of projects
In section 1.1 three types of concerns were raised with respect to the trends in CDM activity: concerns about the quality of the projects, concerns about the quantity of CERs produced and concerns about equity, or the international distribution of CDM investment. The previous sections have addressed the first two of these concerns, through the application of the development dividend framework, and more will be said in the concluding section. This section will address the third, in an analysis that does not involve the application of the framework. As noted in section 1.2, the overwhelming majority of CDM investment has bypassed the poorest of states, concentrating in only a few developing country hosts. Figure 7 shows that China has captured just under a third of the CERs in the project pipeline as of June 20, 2006.42 India, with over 20 percent of the pipeline’s CERs and over 38 percent of total projects, is another huge draw. As noted in Section 1.2, these two countries, together with Brazil, account for two thirds of the CERs in the pipeline and just under two thirds of the projects.
Figure 7: Unweighted Distribution of CERs in Pipeline(total to 2012, as of June 20 06)
0.0%
5.0%
10.0%
15.0%
20.0%
25.0%
30.0%
35.0%
China
IndiaB
razilS
outh Korea
Mexico
Argentina
Chile
Nigeria
Malaysia
Egypt
IndonesiaThailandS
outh Africa
Vietnam
Pakistan
Peru
Ivory Coast
Guatam
alaTunisiaH
ondurasE
l SalvadorC
olombia
Ecuador
Nicaragua
Bolivia
Philippines
Morocco
Bangladesh
Costa R
icaP
apua New
Guinea
Uruguay
Notes: Only the top 31 countries are shown. CERs are total to 2012. Data taken from UNEP-Risø CDM Pipeline, June 20, 2006.
On its face, this sounds like cause for concern. But while it may be true that they account for the lion’s share of CDM investment, it is also true that China, India and Brazil account for the lion’s share of population, GDP and energy use among non-Annex I parties. As such, it is to be expected that they would also represent more opportunities for CDM projects, having more industry, more demand for power, more GHG emissions than other developing countries. In other words, nobody would expect China and Fiji to have similar CDM profiles.
42 Data taken from the Unep-Risø CDM pipeline, June 20 2006 update. Included in the pipeline are registered projects, projects for which registration has been requested, and projects in the process of validation.

Chapter 1: Defining and Measuring the Development Dividend
Development Dividend Phase II 27
Figure 8: GDP-Deflated Distribution of CERs in Pipeline(total to 2012, as of June 20 06)
0.0%
5.0%
10.0%
15.0%
20.0%
25.0%
30.0%
Mongolia
Nicaragua
Honduras
Papua N
ew G
uineaIvory C
oastN
igeriaIndiaM
oldovaB
oliviaC
hileA
rmenia
Brazil
Kyrgyzstan
El S
alvadorC
hinaG
uatamala
TajikistanA
rgentinaV
ietnamTunisiaE
gyptS
outh Korea
Malaysia
Uruguay
Ecuador
Nepal
Costa R
icaP
eruM
exicoP
akistanC
ambodia
Notes: Only the top 31 countries are shown. CERs are total to 2012. GDP is 2004, current US dollars. CER data taken from UNEP-Risø CDM Pipeline, June 20, 2006.
Figure 9: Population-Deflated Distribution of CERs in Pipeline
(total to 2012, as of June 20 06)
0.0%
5.0%
10.0%
15.0%
20.0%
25.0%
30.0%S
outh Korea
Chile
Brazil
Argentina
Malaysia
Mongolia
Cyprus
El S
alvadorN
icaraguaH
ondurasM
exicoC
osta Rica
Uruguay
Guatam
alaTunisiaIvory C
oastP
apua New
Guinea
Arm
eniaB
oliviaP
anama
China
Ecuador
Peru
IsraelIndiaFijiS
outh Africa
Moldova
Nigeria
Jamaica
Egypt
Notes: Only the top 31 countries are shown. CERs are total to 2012. Population is 2004 data. CER data taken from UNEP-Risø CDM Pipeline, June 20, 2006.

Chapter 1: Defining and Measuring the Development Dividend
Development Dividend Phase II 28
Figures 8 and 9 try to present the regional distribution of CERs in a way that reflects this reality, deflating CERs first by GDP and then by population. The distribution of projects when plotted in this manner is clearly more equitable, resulting in a flatter curve with a much lower peak. Mongolia is the only country to achieve more than a 10 percent share of the GDP-deflated CERs, and only South Korea and Chile do so according to population-deflated figures. Does this equitable result change if we use a regional framework for analysis? In particular, it would be useful to assess the argument that there has been a dearth of CDM investment in sub-Saharan Africa. Figure 9a shows a weighted distribution of CERs in the pipeline for the various regions. If CERs were distributed equitably among countries of similar GDP and population (which we are using as rough proxies for opportunity for CDM investment), we would see a completely equal regional partition of CERs.
Figure 9a: Weighted Regional Distribution of CERs
46%
33%
11%
6%4%
Latin America andCaribbean
Asia Pacific
Sub-Saharan Africa
North Africa &Middle East
Europe & CentralAsia
Notes: CERs refers to total CERs to 2012 as per the UNEP-Risø pipeline as of June 20, 2006. Weighting is an average of population-deflated figures and GDP-deflated figures. Population and GDP are for non-Annex I UNFCCC Parties of the various regional groupings, using 2004 figures (where available). Not included in this calculation (for lack of data) are: Afghanistan, Cook Islands, Cuba, Democratic Republic of Korea, Myanmar, Nauru, Niue, San Marino and Tuvalu. Clearly that is not the case. Both Latin America & the Caribbean and Asia Pacific are vastly over-represented, at 46% and 33% respectively. Sub-Saharan Africa garners a mere 11%. But note that, even so, it out-performs North Africa & the Middle East and Europe & Central Asia, which weigh in at 6% and 4% respectively. So, while a weighted CER count yields a much more equitable distribution on a country-by-country basis, a weighted regional analysis shows wide disparities. In large part this is due to the fact that the country-by-country analysis did not consider those countries that are non-Annex I Parties (and thus eligible hosts for CDM), but which do not have any CDM investment. A regional analysis does take such Parties into account, and in the end finds some cause for concern. There is, however, an argument for some moderation in the concern over regional distribution. Setting up a conducive environment in which to foster CDM investment is a difficult and resource-intensive effort, which simply may not make sense for some countries. A major part of creating a conducive environment is a functional Designated National Authority (DNA). UNDP (2006) enumerates the various responsibilities that a DNA might cover, including:

Chapter 1: Defining and Measuring the Development Dividend
Development Dividend Phase II 29
• “linking CDM policy and strategies to national climate change and sustainable development agendas; • providing supporting data and information to project proponents (for example, establishing electricity grid
emission factors and identifying national CDM sector priorities); • making available information on the CDM project cycle, DNA structures, and project review procedures
(through the use of a websites, newsletters and other sources); • facilitating the development of administrative capacity at state/provincial levels to screen projects and
promote CDM project activity; • establishing links between project proponents and potential financiers and CER buyers; and • CDM promotional and marketing activities.”
DNAs, which vary considerably in form from country to country, can be housed within an existing Ministry, or be separate agencies made up of representatives from a variety of Ministries. They often involve a Secretariat serviced by one or more formal advisory bodies, drawn from governmental and non-governmental sources. UNDP (2006) notes that none of these arrangements are costless, and that indeed most DNAs are hamstrung by lack of human and financial resources. They caution that, “Host countries need to be aware of the resource implications involved and balance these against the potential longer term benefits that CDM projects could provide.” In other words, it may be that for countries with limited potential for attracting CDM investment, and where resources are scarce, the opportunity costs are simply too high to devote the necessary resources to chasing CDM investment. The same resources might be more effectively directed to improving the overall environment for foreign direct investment, or attending directly to social needs such as health and education. As such, a pursuit of regional equity in CDM investment is probably misguided from the perspective of some countries. This is most likely to be the case in resource-strapped countries with limited CDM opportunities—precisely those countries where the absence of such investment gives rise to equity concerns in the first place.
6. Conclusions and Recommendations This analysis began by recapping the concerns expressed in the first phase of the Development Dividend Project: quality, quantity and equity. In concluding, we will review those concerns in light of the analysis performed above, and draw out broad recommendations for strengthening the development dividend yield of CDM activities. In doing so, however, we need to be mindful of the limitations of the analysis, discussed in detail in section 4.3. With respect to the quality and quantity of the projects in the roster of registered CDM activities, there seems to be some cause for concern. While it is encouraging that a number of high-achieving projects exist, the preponderance of projects falls far short of the high mark set by these exceptions. Only a few projects break the pattern of a trade-off between high DD scores and high CER generation. However, it is precisely the combination of these two characteristics that we are looking for. Figure 10 shows the individual project scores plotted in the familiar “DD Score – CERs” space (as in Figures 4 and 6, not including the HFC and N2O projects). Note the large volume of projects that exceed a 30 score for DD, and the large volume that exceed an annual production of 200,000 CERs. However, only five projects manage to do both (see Table 3).

Chapter 1: Defining and Measuring the Development Dividend
Development Dividend Phase II 30
Figure 10: Project CERs & DD Scores
0
200,000
400,000
600,000
800,000
1,000,000
1,200,000
0 10 20 30 40 50 60 70DD Score
Ann
ual C
ERs/
proj
ect
Note: HFC and N2O projects are not plotted on this graph.
Table 3: Five High-Achieving Projects
Title Host Meth CERs p.a. Type DD ScoreLDEO Biomass Steam and Power Plant in Malaysia Malaysia
AMS-I.C., AMS-III.E. 208,871
Biomass energy 32
SEO Biomass Steam and Power Plant in Malaysia Malaysia
AMS-I.C., AMS-III.E. 216,831
Biomass energy 30
Nanjing Tianjingwa Landfill Gas to Electricity Project China
ACM0001, AMS-I.D. 246,107 Landfill gas 31
Lihir Geothermal Power Project Papua New Guinea ACM0002 278,904 Geothermal 36
San Jacinto Tizate Geothermal Project Nicaragua ACM0002 280,703 Geothermal 30
With respect to equity of distribution of CER investment, on the other hand, it was argued that this particular concern might not be as pressing as it appears. The admittedly skewed distribution of CDM investment in fact looks much less skewed when deflated by GDP or population. While investment in least-developed countries is quite low, it was also argued that in some of those countries the resources necessary to attract CDM investment might be more effectively directed toward other social priorities. If the challenge is to address the issues of quality and quantity, what possible avenues suggest themselves in light of the analysis carried out above?

Chapter 1: Defining and Measuring the Development Dividend
Development Dividend Phase II 31
One such avenue might be to effect changes to the rules of CDM, in such a way as to favour known high-achieving projects. It was noted, for example, that programmatic CDM seemed to hold some promise in this regard – particularly in the form embodied by the recent proposed activities related to energy efficiency, and standards & labeling. It was also noted that small-scale projects seem to consistently perform better than large or very large projects on the DD scoring, though the number of CERs generated by each tends to be quite small. The prospects and possible modalities for rules changes in both of these areas (and others) are explored in the next chapter. Another track for progress is actions at the national level. Clearly one area for action here is the promotion and enforcement of clear and sensible criteria for sustainable development – criteria that are founded in broader national policies and priorities for sustainable development (as elaborated in, for example, PRSPs, NAPAs, ad hoc national exercises). Here there is an obvious role for official development assistance, given the resource-intensive nature of this sort of effort. A related area for action at the national level involves discrimination according to project types and other project characteristics, in line with sustainable development priorities. It was noted above, for example, that China had enacted a system of levies on those CDM projects that accorded least with its stated priorities. And Colombia grants tax advantages to CDM projects with social benefits. While these are good models, and while the Chinese model of taxation will undoubtedly raise significant amounts of money for the express purpose of sustainable development spending, this kind of proactive shaping of the national CDM roster is presently the exception, rather than the rule. Moreover, it was noted above that the relevant spending is well outside the CDM regime, and thus not subject to monitoring, binding commitments or evaluation of additionality. A related mode of national-level strategic actions to foster development dividend benefits is demonstrated by several of the registered CDM projects under analysis. Annex IV describes 16 projects in which the proponents commit to undertaking sustainable-development-related efforts not directly related to the project itself. These range from vague commitments for social good with no monitoring plan to cases where the proponents have entered into legal contracts with the local or national governments, complete with monitoring provisions. The Cote Small-Scale Hydropower Plant, for example, contracted with the host government (Costa Rica) to a monitored performance on six environmental sustainability indicators and two socio-economic ones, and agreed to contribute USD 36,000 payment for the use of environmental services. The Santa Ana Hydroelectric Plant in Colombia was required as a prerequisite to obtaining its concession to pledge a portion of the proceeds of its CER revenues for restoration and conservation initiatives in the Colombian National Park system. This sort of contract, offered as a condition of awarding a concession or operating permit, or as a prerequisite to accepting a project as contributing to sustainable development, might be an excellent way to ensure that projects high in CER generation can also contribute to a strong development dividend. One of the keys to achieving such a result is effective enforcement provisions; it is not obvious how some of the proponents of the Annex 4 projects will be held accountable for their commitments. Obviously this sort of contract can be the initiative of actors outside the host governments as well. Private sector actors have a role to play; many of the Annex 4 project proponents seem to have unilaterally offered their commitments (though this is not clear from the information presented in the PDDs). Large purchasers such as the World Bank may also have a role to play. As noted above, the CDCF has for some time been negotiating with proponents to add such benefits to projects, and will pay premiums to offset some or all of the costs involved. In general, buyers willing to pay a premium for development dividend-related benefits—whether intrinsic to the project or “added on” to boost the project’s attractiveness—play a positive role. Chapter 3 explores in greater depth the realities and modalities of the private sector’s potential role in fostering the development dividend. A final avenue for strengthening the quality and quantity of CDM projects falls squarely on the shoulders of the Parties of the UNFCCC and the Kyoto Protocol. The Phase I report of the Development Dividend Project warned

Chapter 1: Defining and Measuring the Development Dividend
Development Dividend Phase II 32
that continued uncertainty on the role of the CDM post-2012 would effectively dry up the supply of CDM projects –both good and bad – within a few years. This concern, still unaddressed, is the 800-lb gorilla in the room, beside which many of the other issues addressed in this book pale to insignificance.
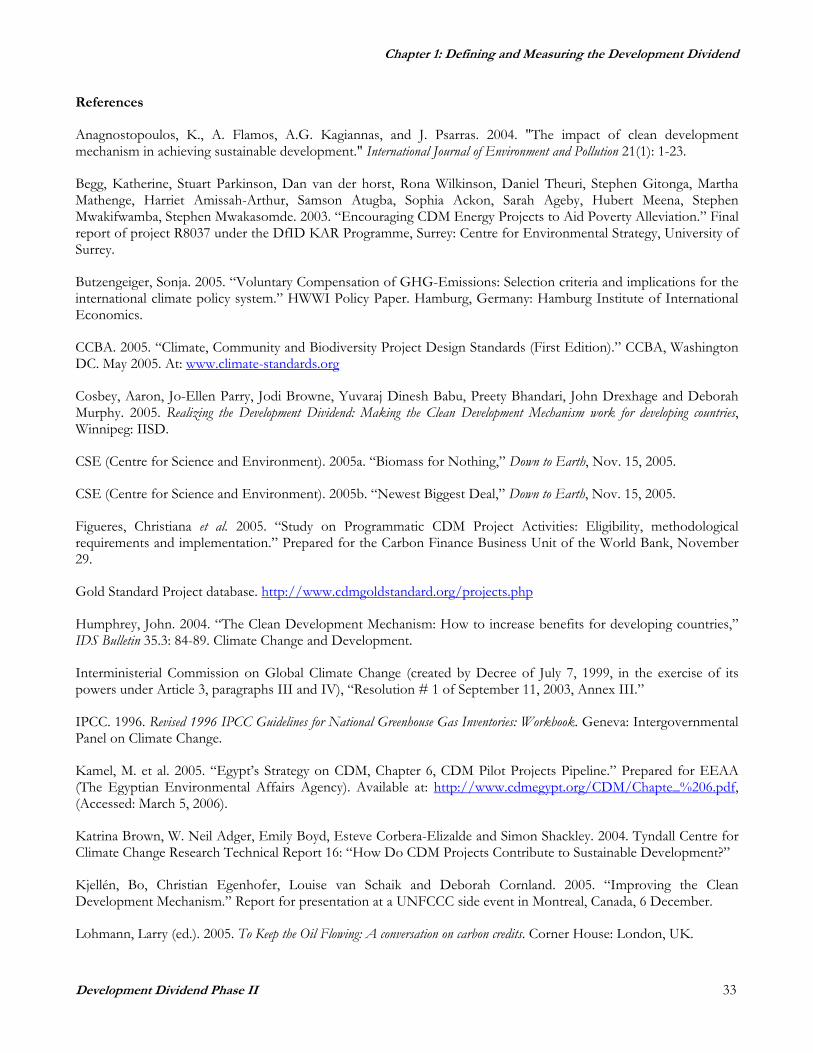
Chapter 1: Defining and Measuring the Development Dividend
Development Dividend Phase II 33
References
Anagnostopoulos, K., A. Flamos, A.G. Kagiannas, and J. Psarras. 2004. "The impact of clean development mechanism in achieving sustainable development." International Journal of Environment and Pollution 21(1): 1-23.
Begg, Katherine, Stuart Parkinson, Dan van der horst, Rona Wilkinson, Daniel Theuri, Stephen Gitonga, Martha Mathenge, Harriet Amissah-Arthur, Samson Atugba, Sophia Ackon, Sarah Ageby, Hubert Meena, Stephen Mwakifwamba, Stephen Mwakasomde. 2003. “Encouraging CDM Energy Projects to Aid Poverty Alleviation.” Final report of project R8037 under the DfID KAR Programme, Surrey: Centre for Environmental Strategy, University of Surrey.
Butzengeiger, Sonja. 2005. “Voluntary Compensation of GHG-Emissions: Selection criteria and implications for the international climate policy system.” HWWI Policy Paper. Hamburg, Germany: Hamburg Institute of International Economics.
CCBA. 2005. “Climate, Community and Biodiversity Project Design Standards (First Edition).” CCBA, Washington DC. May 2005. At: www.climate-standards.org
Cosbey, Aaron, Jo-Ellen Parry, Jodi Browne, Yuvaraj Dinesh Babu, Preety Bhandari, John Drexhage and Deborah Murphy. 2005. Realizing the Development Dividend: Making the Clean Development Mechanism work for developing countries, Winnipeg: IISD.
CSE (Centre for Science and Environment). 2005a. “Biomass for Nothing,” Down to Earth, Nov. 15, 2005.
CSE (Centre for Science and Environment). 2005b. “Newest Biggest Deal,” Down to Earth, Nov. 15, 2005.
Figueres, Christiana et al. 2005. “Study on Programmatic CDM Project Activities: Eligibility, methodological requirements and implementation.” Prepared for the Carbon Finance Business Unit of the World Bank, November 29.
Gold Standard Project database. http://www.cdmgoldstandard.org/projects.php
Humphrey, John. 2004. “The Clean Development Mechanism: How to increase benefits for developing countries,” IDS Bulletin 35.3: 84-89. Climate Change and Development.
Interministerial Commission on Global Climate Change (created by Decree of July 7, 1999, in the exercise of its powers under Article 3, paragraphs III and IV), “Resolution # 1 of September 11, 2003, Annex III.”
IPCC. 1996. Revised 1996 IPCC Guidelines for National Greenhouse Gas Inventories: Workbook. Geneva: Intergovernmental Panel on Climate Change.
Kamel, M. et al. 2005. “Egypt’s Strategy on CDM, Chapter 6, CDM Pilot Projects Pipeline.” Prepared for EEAA (The Egyptian Environmental Affairs Agency). Available at: http://www.cdmegypt.org/CDM/Chapte_%206.pdf, (Accessed: March 5, 2006).
Katrina Brown, W. Neil Adger, Emily Boyd, Esteve Corbera-Elizalde and Simon Shackley. 2004. Tyndall Centre for Climate Change Research Technical Report 16: “How Do CDM Projects Contribute to Sustainable Development?”
Kjellén, Bo, Christian Egenhofer, Louise van Schaik and Deborah Cornland. 2005. “Improving the Clean Development Mechanism.” Report for presentation at a UNFCCC side event in Montreal, Canada, 6 December.
Lohmann, Larry (ed.). 2005. To Keep the Oil Flowing: A conversation on carbon credits. Corner House: London, UK.

Chapter 1: Defining and Measuring the Development Dividend
Development Dividend Phase II 34
Olhoff, A., A. Markandya, K. Halsnaes, T. Taylor. 2004. CDM Sustainable Development Impacts, developed for the UNEP project ‘Capacity Development for CDM (CD4CDM).’
Olsen, Karen Holm. 2005. “The Clean Development Mechanism’s Contribution to Sustainable Development: A review of the literature.” Roskilde, Denmark: UNEP-Risø Centre.
Olsen, Karen Holm and Jørgen Fenhann. (forthcoming). “Sustainable Development Benefits of Clean Development Mechanism Projects: Development of a new methodology for text analysis of the project design documents submitted for validation.” Submitted to Global Environmental Change.
Pearce, D. W., E.W. Barbier, & A. Markandya (1990), Sustainable Development. Earthscan Publications Ltd., London, UK
Sareen, Jagjeet S. and Preety Bhandari. 2006. “Clean Development Mechanism and Development Dividend: An empirical study from India.” National Background Paper prepared for the Development Dividend Project.
Senter. 2001. Terms of Reference for CERUPT (CER Procurement Tender – CDM).
Steve Thorne and Stefan Raubenheimer, undated. “Sustainable Development Appraisal of Clean Development Mechanism Projects: Experiences from the SouthSouthNorth.” Available at: http://www.southsouthnorth.org/download.asp?name=Sustainable%20Development%20-%20Thorne%20and%20Raubenheimrer.pdf&size=149892&file=library/Sustainable%20Development%20-%20Thorne%20and%20Raubenheimrer.pdf
SSN (undated). “The SouthSouthNorth Appraisal and Ranking Matrix Tool for Sustainable Development,” http://www.southsouthnorth.org/download.asp?name=SSN%20Matrix%20Tool.pdf&size=1103967&file=library/SSN%20Matrix%20Tool.pdf
Sutter, Christopher. 2003. Sustainability Check-Up for CDM Projects. Berlin: Wissenschaftlicher Verlag.
Sutter, Christopher and Juan Carlos Parreño. 2005. ”Does the Current CDM Deliver its Sustainable Development Claim?” Paper presented at the HWWA conference Climate or Development?, Hamburg, October 28-29, 2005.
Tayab, Nadaa. 2005. “The Market for Voluntary Carbon Offsets: A new tool for sustainable development?” IIED Gatekeeper Series 121. London: International Institute for Environment and Development.
Trexler, Mark C. and Laura H. Kosloff. 2006. “Selling Carbon Neutrality.” The Environmental Forum, March/April: 34-39.
UNDP. 2006. An Assessment of Progress with Establishing the Clean Development Mechanism. New York: United Nations Development Programme.
UNFCCC. 2005. Decision 7/CMP.1: Further Guidance Related to the Clean Development Mechanism.
World Bank. 2005. “World Bank Statement on Chad.” Press Release No. 2006/194/AFR. Dated December 8, 2005.
Zhu, Xianli. 2006. “Promoting the Sustainable Development Contribution of CDM Projects: Actions in China.” National Background Paper prepared for the Development Dividend Project.

Chapter 1: Defining and Measuring the Development Dividend
Development Dividend Phase II 35
Annex I: Indicators and Scoring for Various Project Types: Notes: What is presented here is the list of stock scoring guidelines used in the Development Dividend Framework. A project is still able to score even in those criteria of which no mention is made in the list below, but that score will be an ad hoc assignment based on special circumstances. The assignment of scores described below was done for the most part on a subjective basis which, as noted in section 4.3, means that the resulting scores are not good absolute measures of development dividend potential. However, care was taken to ensure consistency of application across project categories, allowing a valid approach to cross-project-type analysis. “BOP score” is net energy imports divided by total energy production (both expressed in metric tonnes of oil equivalent). The resulting figure in almost all cases corresponds to a score of between zero and two. Negative figures are assigned a zero score. Figures over two are assigned a two score. All data is taken from IEA Energy Statistics, 2003 figures.43 “Energy poverty index” is (2 – NormTPES/cap), where NormTPES/cap is the total primary energy supply per capita (in metric tonnes of oil equivalent), normalized to yield a score of between zero and two. All data is taken from IEA Energy Statistics, 2003 figures.44 “Baseline emission factors” are taken from the PDDs, and have been converted, where necessary, to a common expression as kg CO2e/kWh. “Pollution score” is the CEF of the fuel in question (carbon emission factor, as given by IPCC’s Revised 1996 Guidelines for National Greenhouse Gas Inventories: Workbook, Table 1-2 (IPCC 1996)), normalized to a score of between zero and two. GHG emission intensity is used here as a proxy for polluting effects (non-GHG) of fuel burning. Agriculture:
1a: 0.5 points for construction, ongoing employment
1c: 0.5 for introduction of new technology – pretty well automatic score, since low penetration rate everywhere
2b: 0.5 points for odour and non-GHG emissions reduction, risk reduction if sited in populated area (almost automatic)
3a: 0.5 points for odour and non-GHG emissions reduction, risk reduction
3c: 1 point for gas-to-energy; 1.5 points if small-scale meth is used to claim CERs for energy produced; 2 points if large-scale meth is used.
general: no credit for optional gas-to-energy possibilities – need to be claimed, monitored.
Biogas:
1a: 0.5 points for construction, ongoing employment
43 Exceptions are Papua New Guinea, taken from the APEC Energy Overview 2002, table 26, Fiji, where BOP figures are taken from the project PDD, and Bhutan, where an estimate is used based on figures from similarly situated countries in the region. 44 Exceptions are Papua New Guinea, taken from the APEC Energy Overview 2002, table 26, and Fiji and Bhutan, where an estimate is used based on figures from similarly situated countries in the region.

Chapter 1: Defining and Measuring the Development Dividend
Development Dividend Phase II 36
1b: if the project scores under 3c (is producing energy), then divide the score in 3c by 2, and multiply by the country’s BOP score.
1c: 0.5 for introduction of new technology – pretty well automatic score, since low penetration rate everywhere
2c: if gas used in community, score Energy Poverty index for country
3a: 0.5 points for odour and non-GHG emissions reduction if large-scale aerobic digestion is replaced with anaerobic; no points for displacing fuelwood with biogas (reduced particulates)
3b: 1.5 points if fuelwood is replaced with biogas
3c: if primary aim of project is to replace traditional fuels with biogas, score 2 points. If biogas is a used by-product of a project with another aim, then 0.5 points for gas-to-energy if no claim for GHG reduced. If a claim is made, then 1.5 points if small-scale meth is used to claim CERs for energy produced; 2 points if large-scale meth is used.
Biomass Energy:
1a: 0.5 points for construction, ongoing employment
1b: equal to country’s BOP score
2a: if fuel is sourced as by-product from local producers, score 1 (or 0.5, if this displaces previous commercial use of by-product)
2b: 0.5 points for odour reduction if avoids methane-producing rotting of biomass, or 0.5 points if avoids open-air burning of biomass
2c: if it frees up grid power, score Energy Poverty index for country
3a: score = 2 times the baseline emission factor (combined margin). If biomass is diverted from landfill or methane-producing compost, score additional 0.5, unless it is claimed as GHG emission reduction credits (in which case no score). If fly ash blended with clinker score 0.5.
3c: automatic 2 points
Cement
1a: if it’s a fuel-switch, no credit for construction employment; no ongoing employment necessary. If its energy efficiency (e.g., use of excess heat), then score 0.5.
1b: equal to country’s BOP score
2a: if alternative fuel is sourced as by-product from local producers, score 1 (or 0.5, if this displaces previous commercial use of by-product)
2b: 0.5 points for odour reduction if avoids methane-producing rotting of biomass, or 0.5 points if avoids open-air burning of biomass
3a: if it’s a fuel switch, score = pollution score. If it’s energy efficiency and displaces grid power, score 2* baseline emissions factor.
3c: automatic 2 points
EE Households:
1b: equal to country’s BOP score
2c: score Energy Poverty index for country, unless poor communities targeted, in which case bonus of (½ * (2-D))

Chapter 1: Defining and Measuring the Development Dividend
Development Dividend Phase II 37
3a: score = 2 times the baseline emission factor
EE Industry:
1a: 0.5 points for construction, ongoing employment, unless it’s a simple process fix with no ongoing operating employment
1b: equal to country’s BOP score
2c: if it frees up grid power, score Energy Poverty index for country
3a: score = 2 times the baseline emission factor
3c: automatic 2 points
3d: unless the technology penetration is high, 0.5 points
EE Service:
1b: equal to country’s BOP score
2c: equal to country’s Energy Poverty index
3a: score = 2 times the baseline emission factor
Fossil fuel switch:
1a: no credit for construction employment; no ongoing employment necessary.
1b: equal to country’s BOP score
3a: 1.8 points if replacing polluting fuels (more than 75 percent fossil fuel in existing mix) with renewables. 1.3 points if more than 62 percent. 1 point if more than 50 percent in existing mix. 0.5 points automatically.
If replacing fossil fuel with less polluting fossil fuel (e.g., coal to gas – ref. IPCC CEFs), then 1 point.
3c: automatic 2 points
Fugitive:
2c: if fugitive gas is converted to energy and sold into grid, score Energy Poverty index for country
3c: 2 points if fugitive gas converted to energy
Geothermal:
1a: 0.5 points for construction, ongoing employment
1b: equal to country’s BOP score
1c: 0.5 if low penetration in country – demonstration effect. Pretty well automatic
2c: score country’s Energy Poverty Index
3a: 1 if it displaces fossil fuel use
3c: 2 points

Chapter 1: Defining and Measuring the Development Dividend
Development Dividend Phase II 38
HFCs:
1a: 0.5 points for construction, ongoing employment
Hydro:
1a: 0.5 points for construction, ongoing employment. 1 point if over 50k CERs claimed per year, 1.5 if over 150k.
1b: equal to country’s BOP score
2a: 0.5 points if energy is used to electrify a rural area.
2c: if power is being sold into grid (not wheeled to industrial customers), then score country’s Energy Poverty Index. If it is retained in community, score 2.
3a: score = 2 times the baseline emission factor (combined margin)
3b: negative 0.5 points if it involves a reservoir over 75,000 m3, even if it’s a run-of-river, or diversion-type, project. Negative 1 point if over 150,000 m3, or if it’s not a run-of-the-river project.
3c: automatic 2 points
Landfill gas:
1a: 0.5 points for construction, ongoing employment
1b: if the project scores under 3c (is producing energy), then divide the score in 3c by 2, and multiply by the country’s BOP score.
1c: 0.5 for introduction of new technology – pretty well automatic score, since low penetration rate everywhere
2a: 0.5 points if significant portion of operating profits goes to municipality
2b: 0.5 points for reducing odours
2c: if the project scores under 3c (is producing energy), then divide the score in 3c by 2, and multiply by the country’s Energy Poverty index.
3a: 1 point for containing leachate (if not previously done); automatic 0.5 for odours, risk reduction
3c: 1 point for gas-to-energy; 1.5 points if small-scale meth is used to claim CERs for energy produced; 2 points if large-scale meth is used.
general: no credit for potential to run gas-to-energy in future
N2O:
1a: 0.5 points for construction, ongoing employment
3c: 0.5 points for reducing NOx emissions
Solar:
1c: 0.5 points if tech is new in country; 0.5 points for training, outreach
1b: equal to country’s BOP score
2c: score country’s energy poverty index

Chapter 1: Defining and Measuring the Development Dividend
Development Dividend Phase II 39
2d: 0.5 points for insulating population from higher fossil fuel prices
3a: no points for displacing fuelwood (reduced particulates)
3c: 1.5 points for providing energy; 2 points if it actually displaces more polluting energy source.
Wind:
1a: construction, ongoing operation – 0.5
1b: equal to country’s BOP score
1c: 0.5 points if first use of tech in country, even if tech is old.
2c: If it’s sold into the grid, score country’s energy poverty index
3a: 1.8 points if displacing polluting fuels (more than 75 percent fossil fuel in existing mix). 1.3 points if more than 62 percent. 1 point if more than 50 percent in existing mix. 0.5 points automatically.
3c: automatic 2 points

Chapter 1: Defining and Measuring the Development Dividend
Development Dividend Phase II 40
Annex II: The Development Dividend Task Force Governments Canada Sushma Gera (Foreign Affairs) Canada Jodi Browne (Environment Canada) Canada Paul Samson (CIDA) Columbia Martha Patricia Castillo India R.K. Sethi Norway Georg Børsting Denmark Frode Neergaard Multilateral Institutions IFC Alan Miller UNEP – Risoe Centre Sami Kamel UNDP Brian Dawson World Bank Mahua Acharya Business/Industry BP Chris Mottershead Chicago Climate Exchange Michael Walsh Development Bank of Japan Takao Aiba DNV Einar Telnes IEA Richard Baron IETA Andrei Marcu International Financial Consulting Diana Smallridge/John Balint Natsource Aline Ribas/Doug Russell TC+ES Mark Trexler Transalta Don Wharton NGOs and Research Institutes Centre for Clean Air Policy Jake Schmidt Chinese Academy of Social Sciences Xianli Zhu Development in the Americas Christiana Figueres ECM Centre Tom Owino EMBRAPA Luciano Mattos Federal University of Rio de Janeiro Suzana Kahn Ribeiro Hamburg Institute Sonja Butzengeiger ICRAF Brent Swallow IISD John Drexhage IDRC Simon Carter Joanneum Research, Austria Neil Bird NRTEE Alex Wood SouthSouthNorth Emily Tyler TERI Preety Bhandari WRI Kevin Baumert IISD John Drexhage

Chapter 1: Defining and Measuring the Development Dividend
Development Dividend Phase II 41
Annex III: Results of the Framework Analysis
Title Host Parties
Methodology * Annual CERs **
Project type
Total Score
1A
ECN
EMP
1B
ECN
BOP
1C
ECN
TEC
2A
SOC
ECN
2B
SOC
ENV
2C
SOC
NRG
2D
SOC
RES
3A
ENV
POL
3B
EVN
DEG
3C
ENV
NRG
3D
ENV
NEW
POTENTIAL: 100 8.2 7.6 9.4 8.6 9.3 9.3 8.0 10.4 10.1 9.6 9.6 Project for GHG Emission Reduction by Thermal Oxidation of HFC23 in Jiangsu Meilan Chemical CO. Ltd., Jiangsu Province, China
China ACM0001 8,411,432 HFCs 2 2.0
Shandong Dongyue HFC23 Decomposition Project
China AM0001 10,110,117 HFCs 2 2.0
HFC23 Decomposition Project of Zhejiang Juhua Co., Ltd, P. R. China
China AM0001 5,789,682 HFCs 2 2.0
GHG emission reduction by thermal oxidation of HFC 23 at refrigerant (HCFC-22) manufacturing facility of SRF Ltd
India AM0001 3,833,566 HFCs 2 2.0
Project for GHG emission reduction by thermal oxidation of HFC 23 in Gujarat, India.
India AM0001 3,000,000 HFCs 2 2.0
HFC Decomposition Project in Ulsan
Korea AM0001 1,400,000 HFCs 2 2.0
Quimobásicos HFC Recovery and Decomposition Project
Mexico AM0001 2,155,363 HFCs 2 2.0
N2O Emission Reduction in Paulínia, SP, Brazil
Brazil AM0021 5,961,165 N2O 4 2.0 2.4
N2O Emission Reduction in Onsan, Korea
Korea AM0021 9,150,000 N2O 4 2.0 2.4

Chapter 1: Defining and Measuring the Development Dividend
Development Dividend Phase II 42
Off gases utilisation from C – 03 washing tower in Primary Reformer as fuel
India AMS-III.D. 7,226 Biogas 7 2.0 0.2 2.4 2.4
Lages Methane Avoidance Project
Brazil AMS-III.E. 220,439 Fugitive 7 2.0 2.6 2.4
GHG capture and combustion from swine manure management systems at Faxinal dos Guedes and Toledo
Brazil AM0006 24,277 Agriculture 9 2.0 2.4 2.3 2.6
AWMS GHG Mitigation Project BR05-B-07, Mato Grosso, Minas Gerais and Goiás, Brazil.
Brazil AM0016 149,915 Agriculture 9 2.0 2.4 2.3 2.6
Granja Becker GHG Mitigation Project
Brazil AM0016 5,086 Agriculture 9 2.0 2.4 2.3 2.6
Methane capture and combustion from swine manure treatment for Pocillas and La Estrella
Chile AM0006 247,428 Agriculture 9 2.0 2.4 2.3 2.6
Methane capture and combustion from swine manure treatment for Peralillo
Chile AM0006 78,867 Agriculture 9 2.0 2.4 2.3 2.6
Methane capture and combustion from swine manure treatment for Corneche and Los Guindos
Chile AM0006 84,083 Agriculture 9 2.0 2.4 2.3 2.6
AWMS GHG Mitigation Project, MX05-B-15, Sonora, México
Mexico AM0016 61,486 Agriculture 9 2.0 2.4 2.3 2.6
AWMS GHG Mitigation Project, MX05-B-14, Jalisco, México
Mexico AM0016 97,405 Agriculture 9 2.0 2.4 2.3 2.6
AWMS GHG Mitigation Project, MX05-B-13, Sonora, México
Mexico AM0016 86,102 Agriculture 9 2.0 2.4 2.3 2.6
AWMS GHG Mitigation Project, MX05-B-08, Sonora, México
Mexico AM0016 51,408 Agriculture 9 2.0 2.4 2.3 2.6
AWMS GHG Mitigation Project, MX05-B-12,
Mexico AM0016 63,562 Agriculture 9 2.0 2.4 2.3 2.6

Chapter 1: Defining and Measuring the Development Dividend
Development Dividend Phase II 43
Sonora, México
AWMS GHG Mitigation Project, MX05-B-10, Aguascalientes, Guanajuato and Queretaro, México
Mexico AM0016 27,812 Agriculture 9 2.0 2.4 2.3 2.6
AWMS GHG Mitigation Project, MX05-B-04, Jalisco, México
Mexico AM0016 73,927 Agriculture 9 2.0 2.4 2.3 2.6
AWMS GHG Mitigation Project, MX05-B-05, Jalisco, México
Mexico AM0016 83,010 Agriculture 9 2.0 2.4 2.3 2.6
AWMS GHG Mitigation Project, MX05-B-06, Jalisco, México
Mexico AM0016 147,953 Agriculture 9 2.0 2.4 2.3 2.6
AWMS GHG Mitigation Project, MX05-B-09, Nuevo León, México
Mexico AM0016 20,984 Agriculture 9 2.0 2.4 2.3 2.6
AWMS GHG Mitigation Project, MX05-B-07, Sonora, México
Mexico AM0016 120,925 Agriculture 9 2.0 2.4 2.3 2.6
AWMS GHG Mitigation Project MX05-B-03, Sonora, Mexico
Mexico AM0016 127,914 Agriculture 9 2.0 2.4 2.3 2.6
AWMS GHG Mitigation Project, MX05-B-01, México
Mexico AM0016 147,380 Agriculture 9 2.0 2.4 2.3 2.6
AWMS GHG Mitigation Project, MX05-B-02, Sonora, México
Mexico AM0016 121,689 Agriculture 9 2.0 2.4 2.3 2.6
AWMS Methane Recovery Project MX05-S-11, Baja California, México
Mexico AMS-III.D. 21,601 Agriculture 9 2.0 2.4 2.3 2.6
ESTRE’s Paulínia Landfill Gas Project (EPLGP)
Brazil AM0003 212,558 Landfill gas 9 2.0 2.4 2.3 2.6
Lepanto Landfill Gas Management Project
Chile ACM0001 400,350 Landfill gas 12 2.0 2.3 7.8
El Molle – Landfill gas (LFG) capture project
Chile ACM0001 160,130 Landfill gas 12 2.0 2.3 7.8

Chapter 1: Defining and Measuring the Development Dividend
Development Dividend Phase II 44
Methane Extraction and Fuel Conservation Project at Tamil Nadu Newsprint and Paper Limited (TNPL), Kagathipuram, Karur District, Tamil Nadu
India AM0013 35,860 Biogas 12 2.0 0.4 2.4 2.6 4.8
Olavarría Landfill Gas Recovery Project
Argentina ACM0001 18,688 Landfill gas 15 2.0 2.4 2.3 7.8
Caieiras landfill gas emission reduction
Brazil ACM0001 770,932 Landfill gas 15 2.0 2.4 2.3 7.8
Salvador da Bahia Landfill Gas Management Project
Brazil AM0002 664,674 Landfill gas 15 2.0 2.4 2.3 7.8
Copiulemu landfill gas project (Center for the Storage and Transfer, Recovery and Control of Waste, Treatment and Disposal of Industrial and Household Waste)
Chile ACM0001 90,125 Landfill gas 15 2.0 2.4 2.3 7.8
Cosmito landfill gas project (Improvement of Gas Extraction System in Old Cosmito Dump)
Chile ACM0001 84,724 Landfill gas 15 2.0 2.4 2.3 7.8
Hiriya Landfill Project Israel ACM0001 93,452 Landfill gas 15 2.0 2.4 2.3 7.8 Lawley Fuel Switch Project
South Africa
AM0008 19,159 Fossil fuel switch
15 5.2 9.6
Sibimbe Hydroelectric Project
Ecuador ACM0002 57,870 Hydro 15 4.1 6.4 -5.1 9.6
Landfill gas recovery at the Norte III Landfill, Buenos Aires, Argentina.
Argentina 296,807 Landfill gas 17 2.0 2.4 2.3 2.5 2.6 4.8
Landfill gas extraction on the landfill Villa Dominico, Buenos Aires, Argentina
Argentina AM0011 588,889 Landfill gas 17 2.0 2.4 2.3 2.5 2.6 4.8
Santa Cruz landfill gas combustion project
Bolivia AM0003 82,680 Landfill gas 17 2.0 2.4 2.1 2.3 7.8

Chapter 1: Defining and Measuring the Development Dividend
Development Dividend Phase II 45
Emission reduction through partial substitution of fossil fuel with alternative fuels like agricultural by-products, tyres and municipal solid waste (MSW) in the manufacturing of portland cement at Grasim Industries Limited-Cement division South (GIL-CDS)
India ACM0003 51,932 Cement 17 0.8 4.3 2.3 9.6
Electric Power Co-Generation by LDG Recovery – CST - Brasil
Brazil ACM0004 44,026 EE industry 17 2.0 0.6 2.8 9.6 2.4
Thermal Efficiency Improvement Initiatives in Coal Fired Boiler System
India AMS-II.B. 5,424 EE industry 18 0.8 7.2 9.6
Onyx Landfill Gas Recovery Project – Trémembé, Brazil
Brazil AM0011 70,063 Landfill gas 18 2.0 0.3 2.4 2.3 3.4 2.6 4.8
Energy efficiency through installation of modified CO2 removal system in Ammonia Plant
India AM0018 24,449 EE industry 18 0.8 5.1 9.6 2.4
Coruripe Bagasse Cogeneration Project (CBCP)
Brazil AM0015 5,784 Biomass energy
20 2.0 0.6 6.8 0.8 9.6
Demand-side energy efficiency programme in the ‘Humidification Towers’ of Jaya Shree Textiles
India AMS-II.C. 3,393 EE industry 20 0.8 9.3 9.6
Energy efficiency projects-Steam system upgradation at the manufacturing unit of Birla tyres.
India AMS-II.D. 4,585 EE industry 20 0.8 9.3 9.6
Energy efficiency through steam optimisation projects at RIL, Hazira,
India AM0018 23,391 EE industry 20 0.8 7.3 9.6 2.4
Waste Heat Recovery Power Project at JK Cement Works (Unit of JK Cement Limited),
India ACM0004 70,796 Cement 21 2.0 0.8 8.2 9.6

Chapter 1: Defining and Measuring the Development Dividend
Development Dividend Phase II 46
Nimbahera, Chittorgarh, Rajasthan
Optimal Utilization of Clinker in PPC manufacturing at Birla Corporation Limited, Raebareli Unit
India ACM0005 26,415 Cement 21 0.8 10.4 9.6
ACC Blended cement projects at New Wadi Plant, Tikaria Cement Plant, Chanda Cement Works, Kymore Cement Works, Lakheri Cement Works and Chaibasa Cement Works
India ACM0005 405,314 Cement 21 0.8 10.4 9.6
“Optimal Utilization of Clinker” project at Shree Cement Limited (SCL), Beawar, Rajasthan
India ACM0005 68,014 Cement 21 0.8 10.4 9.6
Usinas Itamarati Cogeneration Project
Brazil AM0015 7,990 Biomass energy
22 2.0 0.6 6.8 2.8 9.6
Equipav Bagasse Cogeneration Project (EBCP)
Brazil AM0015 31,821 Biomass energy
22 2.0 0.6 6.8 2.8 9.6
Moema Bagasse Cogeneration Project (MBCP)
Brazil AM0015 13,139 Biomass energy
22 2.0 0.6 6.8 2.8 9.6
Central Energética do Rio Pardo Cogeneration Project (CERPA)
Brazil AM0015 16,290 Biomass energy
22 2.0 0.6 6.8 2.8 9.6
Cruz Alta Bagasse Cogeneration Project (CABCP)
Brazil AM0015 10,061 Biomass energy
22 2.0 0.6 6.8 2.8 9.6
Zillo Lorenzetti Bagasse Cogeneration Project (ZLBC)
Brazil AM0015 53,774 Biomass energy
22 2.0 0.6 6.8 2.8 9.6
Termoelétrica Santa Adélia Cogeneration Project (TSACP)
Brazil AM0015 22,204 Biomass energy
22 2.0 0.6 6.8 2.8 9.6
Alto Alegre Bagasse Cogeneration Project (AABCP)
Brazil AM0015 9,674 Biomass energy
22 2.0 0.6 6.8 2.8 9.6

Chapter 1: Defining and Measuring the Development Dividend
Development Dividend Phase II 47
Iturama Bagasse Cogeneration Project (IBCP)
Brazil AM0015 12,841 Biomass energy
22 2.0 0.6 6.8 2.8 9.6
Southeast Caeté Mills Bagasse Cogeneration Project (SECMBCP)
Brazil AM0015 30,326 Biomass energy
22 2.0 0.6 6.8 2.8 9.6
Cerradinho Bagasse Cogeneration Project (CBCP)
Brazil AM0015 34,742 Biomass energy
22 2.0 0.6 6.8 2.8 9.6
Bioenergia Cogeradora S.A. (“Bioenergia”), corresponding to the Santo Antonio Mill (USA – from the Portuguese “Usina Santo Antônio”) and the São Francisco mill (USFR – from the Portuguese “Usina São Francisco”)
Brazil AM0015 20,840 Biomass energy
22 2.0 0.6 6.8 2.8 9.6
Vale do Rosário Bagasse Cogeneration (VRBC)
Brazil AM0015 25,277 Biomass energy
22 2.0 0.6 6.8 2.8 9.6
Colombo Bagasse Cogeneration Project (CBCP)
Brazil AM0015 28,018 Biomass energy
22 2.0 0.6 6.8 2.8 9.6
Coinbra-Cresciumal Bagasse Cogeneration Project (CCBCP)
Brazil AM0015 17,481 Biomass energy
22 2.0 0.6 6.8 2.8 9.6
Serra Bagasse Cogeneration Project (SBCP)
Brazil AM0015 6,644 Biomass energy
22 2.0 0.6 6.8 2.8 9.6
Campo Florido Bagasse Cogeneration Project (CFBCP)
Brazil AM0015 10,175 Biomass energy
22 2.0 0.6 6.8 2.8 9.6
Jalles Machado Bagasse Cogeneration Project (JMBCP)
Brazil AM0015 8,955 Biomass energy
22 2.0 0.6 6.8 2.8 9.6
Lucélia Bagasse Cogeneration Project (LBCP)
Brazil AM0015 14,362 Biomass energy
22 2.0 0.6 6.8 2.8 9.6
Santa Cândida Bagasse Cogeneration Project
Brazil AM0015 10,604 Biomass 22 2.0 0.6 6.8 2.8 9.6

Chapter 1: Defining and Measuring the Development Dividend
Development Dividend Phase II 48
(SCBCP) energy
Alta Mogiana Bagasse Cogeneration Project (AMBCP)
Brazil AM0015 12,024 Biomass energy
22 2.0 0.6 6.8 2.8 9.6
Nova América Bagasse Cogeneration Project (NABCP)
Brazil AM0015 12,027 Biomass energy
22 2.0 0.6 6.8 2.8 9.6
Santa Elisa Bagasse Cogeneration Project (SEBCP)
Brazil AM0015 45,801 Biomass energy
22 2.0 0.6 6.8 2.8 9.6
Nagda Hills Wind Energy Project (India)
India AMS-I.D. 11,120 wind 22 2.0 0.8 9.4 9.6
Abanico Hydroelectric Project
Ecuador ACM0002 156,660 Hydro 22 6.1 6.4 9.6
Reduction in steam consumption in stripper reboilers through process modifications
India AM0018 34,807 EE industry 22 2.0 0.8 7.3 9.6 2.4
Graneros Plant Fuel Switching Project
Chile AM0008 13,543 Fossil fuel switch
22 7.6 5.2 9.6
Anding Landfill Gas Recovery and Utilisation Project
China ACM0001 75,557 Landfill gas 23 2.0 0.0 2.4 2.3 3.4 7.8 4.8
Meizhou Landfills Gas Recovery and Utilization as Energy
China ACM0001 286,525 Landfill gas 23 2.0 0.0 2.4 2.3 3.4 7.8 4.8
Rang Dong Oil Field Associated Gas Recovery and Utilization Project
Viet Nam AM0009 677,000 Fugitive 23 2.0 8.6 2.6 9.6
Bandeirantes Landfill Gas to Energy Project (BLFGE)
Brazil ACM0001 1,070,649 Landfill gas 23 2.0 0.3 2.4 2.3 3.4 7.8 4.8
Brazil MARCA Landfill Gas to Energy Project
Brazil AM0003 231,405 Landfill gas 23 2.0 0.3 2.4 2.3 3.4 7.8 4.8
Brazil NovaGerar Landfill Gas to Energy Project
Brazil AM0003 670,133 Landfill gas 23 2.0 0.3 2.4 2.3 3.4 7.8 4.8
Yuzaikou Small Hydropower Station
China AMS-I.D. 40,480 Hydro 23 2.0 0.0 6.8 7.6 -2.5 9.6
La Higuera Hydroelectric Chile ACM0002 477,586 Hydro 24 6.1 7.6 6.1 -5.1 9.6

Chapter 1: Defining and Measuring the Development Dividend
Development Dividend Phase II 49
Project, Chile
Koblitz - Piratini Energia S. A - Biomass Power Plant – Small Scale CDM Project
Brazil AMS-I.D., AMS-III.E.
172,763 Biomass energy
24 2.0 0.6 6.8 5.5 9.6
BT Geradora de Energia Elétrica S. A. – Ferradura Small Hydro Power Plant – Small Scale CDM Project
Brazil AMS-I.D. 23,496 Hydro 24 2.0 0.6 6.8 5.5 9.6
Agua Fresca Multipurpose and environmental services project
Colombia AMS-I.D. 27,510 Hydro 24 2.0 8.3 4.5 9.6
Santa Ana Hydroelectric Plant
Colombia 20,642 Hydro 24 2.0 8.3 4.6 9.6
Jepirachi Wind Power Project
Colombia ACM0002 18,028 wind 25 2.0 2.4 8.3 2.6 9.6
Landfill Gas to Energy Facility at the Nejapa Landfill Site, El Salvador
El Salvador
ACM0001 183,725 Landfill gas 25 2.0 1.7 2.4 2.3 4.1 7.8 4.8
Sahabat Empty Fruit Bunch Biomass Project
Malaysia AMS-I.C. 53,986 Biomass energy
25 2.0 3.3 10.4 9.6
Composting of Organic Waste in Dhaka
Bangladesh 89,259 Fugitive 25 2.0 2.4 6.4 7.0 2.6 5.1
BII NEE STIPA Mexico ACM0002 309,979 wind 26 2.0 2.4 5.2 6.8 9.6 Youngduk Wind Park Project
Korea ACM0002 60,071 Wind 26 2.0 7.6 6.8 9.6
CAMIL Itaqui Biomass Electricity Generation Project
Brazil AMS-I.D., AMS-III.E.
57,341 Biomass energy
26 2.0 0.6 2.3 6.8 4.8 9.6
5 MW Wind Power Project at Baramsar and Soda Mada, district Jaisalmer, Rajasthan, India.
India AMS-I.D. 5,804 wind 26 2.0 0.8 8.7 5.2 9.6
14.8 MW small-scale grid connected wind power project in Jaisalmer state Rajasthan, India by RSMML
India AMS-I.D. 13,352 wind 26 2.0 0.8 8.7 5.2 9.6

Chapter 1: Defining and Measuring the Development Dividend
Development Dividend Phase II 50
Tétouan Wind Farm Project for Lafarge Cement Plant
Morocco AMS-I.D. 28,651 wind 27 2.0 7.6 2.4 5.2 9.6
UTE Barreiro S.A. Renewable Electricity Generation Project
Brazil AMS-I.D. 48,565 EE industry 27 2.0 0.6 6.8 5.5 9.6 2.4
San Carlos Bagasse Cogeneration Project (SCBCP)
Ecuador AM0015 43,731 Biomass energy
27 2.0 8.1 7.5 9.6
Landfill Gas to Energy Project at Lara Landfill, Mauá, Brazil
Brazil AM0003 751,148 Landfill gas 27 2.0 0.3 2.4 4.3 2.3 3.4 7.8 4.8
Partial replacement of fossil fuel by biomass as an alternative fuel, for Pyro-Processing in cement plant of Shree Cements Limited at Beawar in Rajasthan, India
India ACM0003 107,074 Cement 27 0.8 4.3 2.3 10.4 9.6
Poechos I Project Peru ACM0002 31,463 Hydro 28 2.0 1.3 9.0 5.7 9.6 Matanzas Hydroelectric Plant
Guatemala 38,493 Hydro 28 2.0 1.4 8.4 8.7 -2.5 9.6
Rio Azul landfill gas and utilization project in Costa Rica
Costa Rica AM0011 156,084 Landfill gas 28 2.0 3.6 2.4 2.1 2.3 5.5 2.6 7.2
Ningxia Helanshan Wind-farm Project, Ningxia Autonomous Region, China
China ACM0002 172,500 Wind 28 2.0 0.0 6.8 9.4 9.6
Zhangbei Manjing Windfarm Project
China AM0005 94,095 wind 28 2.0 0.0 6.8 9.4 9.6
Santa Rosa Peru AMS-I.D. 13,845 Hydro 28 2.0 1.3 9.0 6.0 9.6 Bundled Wind power project in Jaisalmer (Rajasthan in India) managed by Enercon (India) Ltd.
India ACM0002 98,225 Wind 28 2.0 0.8 8.7 6.8 9.6
Bundled wind power project in Chitradurga (Karnataka in India) managed by Enercon
India ACM0002 42,221 wind 28 2.0 0.8 8.7 6.8 9.6

Chapter 1: Defining and Measuring the Development Dividend
Development Dividend Phase II 51
(India) Ltd.
12.3 MW wind energy project in Tamil Nadu, India
India AMS-I.D. 14,416 wind 28 2.0 0.8 8.7 6.8 9.6
4.5 MW Maujhi Grid-connected SHP in Himachal Pradesh, India
India AMS-I.D. 13,168 Hydro 28 2.0 0.8 8.7 6.8 9.6
5 MW Dehar Grid-connected SHP in Himachal Pradesh, India
India AMS-I.D. 16,374 Hydro 28 2.0 0.8 8.7 6.8 9.6
LaGeo, S. A. de C. V., Berlin Geothermal Project, Phase Two
El Salvador
ACM0002 176,543 Geothermal 28 2.0 3.3 8.1 5.2 9.6
Gangwon Wind Park Project
Korea ACM0002 149,536 wind 28 2.0 7.6 2.4 6.8 9.6
Vaturu and Wainikasou Hydro Projects
Fiji AMS-I.D. 24,928 Hydro 28 2.0 1.7 8.4 6.8 9.6
Trupan Biomass Power Plant in Chile
Chile ACM0006 101,846 Biomass energy
29 2.0 7.6 4.8 4.5 9.6
Cote small-scale hydropower plant
Costa Rica AMS-I.D. 6,431 Hydro 29 2.0 4.8 7.3 5.1 9.6
Biomass Energy Plant-Lumut.
Malaysia AMS-I.C. 32,545 Biomass energy
29 2.0 3.3 5.6 8.3 9.6
Nueva Aldea Biomass Power Plant Phase 2
Chile ACM0006 125,424 Biomass energy
29 2.0 7.6 4.8 4.9 9.6
Pesqueiro Energia Small Hydroelectric Project (PESHP)
Brazil AMS-I.D. 42,009 hydro 29 2.0 0.6 2.1 9.3 5.5 9.6
Vajra and Chaskaman small hydro projects of Vindhyachal Hydro Power Ltd., Maharashtra, India.
India AMS-I.D. 19,132 Hydro 29 2.0 0.8 8.7 7.9 9.6
Aleo Manali 3 MW Small Hydroelectric Project, Himachal Pradesh, India
India AMS-I.D. 13,614 Hydro 29 2.0 0.8 8.7 8.0 9.6
18 MW Biomass Power Project in Tamilnadu, India
India AM0004 66,821 Biomass energy
29 2.0 0.8 8.7 8.2 9.6

Chapter 1: Defining and Measuring the Development Dividend
Development Dividend Phase II 52
BK Energia Itacoatiara Project
Brazil AMS-I.D., AMS-III.E.
145,370 Biomass energy
30 2.0 0.6 2.3 6.8 8.3 9.6
18 MW Kemphole Mini Hydel Scheme (KMHS), by International Power Corporation Limited, India
India ACM0002 35,775 Hydro 30 2.0 0.8 8.7 8.5 9.6
6MW Somanamaradi grid connected SHP in Karnataka, India
India AMS-I.D. 16,977 Hydro 30 2.0 0.8 8.7 8.6 9.6
10.25MW Chunchi Doddi Grid-connected SHP in Karnataka, India
India AMS-I.D. 25,490 Hydro 30 2.0 0.8 8.7 8.6 9.6
20 MW Kabini Hydro Electric Power Project, SKPCL, India
India ACM0002 44,968 Hydro 30 2.0 0.8 8.7 8.7 9.6
SRS Bagasse Cogeneration Project
India AMS-I.D. 22,000 Biomass energy
30 2.0 0.8 8.7 8.8 9.6
San Jacinto Tizate geothermal project
Nicaragua ACM0002 280,703 Geothermal 30 2.0 2.8 2.4 8.5 9.6 4.8
SEO Biomass Steam and Power Plant in Malaysia
Malaysia AMS-I.C., AMS-III.E.
216,831 Biomass energy
30 2.0 3.3 2.3 5.6 7.3 9.6
San Isidro Hydroelectric Plant
Guatemala 13,389 Hydro 30 2.0 1.4 8.4 8.7 9.6
Antonio Moran Wind Power Plant Project in Patagonia Region, Argentina
Argentina AMS-I.D. 26,928 wind 30 2.0 9.3 9.4 9.6
JCT Hoshiarpur Small Scale Biomass Project
India AMS-I.D. 31,270 Biomass energy
30 2.0 0.8 8.7 9.3 9.6
3.75 MW Small Scale Grid Connected “Demonstration Wind Farm Project” at Chalkewadi, District Satara, State Mahararashtra, India.
India AMS-I.D. 6,890 wind 31 2.0 0.8 8.7 9.4 9.6
LHSF Bagasse Project India AMS-I.D. 18,506 Biomass energy
31 2.0 0.8 8.7 9.6 9.6
Ajbapur Sugar Complex Cogeneration Project
India AMS-I.D. 40,392 Biomass energy
31 2.0 0.8 8.7 9.6 9.6

Chapter 1: Defining and Measuring the Development Dividend
Development Dividend Phase II 53
RSCL cogeneration expansion project
India AM0015 80,157 Biomass energy
31 2.0 0.8 8.7 9.7 9.6
Babanpur, Killa and Sahoke Mini Hydroelectric Projects
India AMS-I.D. 21,292 Hydro 31 2.0 0.8 8.7 9.8 9.6
Dolowal, Salar and Bhanubhura Mini Hydroelectric Projects
India AMS-I.D. 21,026 Hydro 31 2.0 0.8 8.7 9.8 9.6
Lohgarh, Chakbhai and Sidhana Mini Hydroelectric Projects
India AMS-I.D. 25,347 Hydro 31 2.0 0.8 8.7 9.8 9.6
Taraila Small Hydroelectric Project of Ginni Global Ltd.
India AMS-I.D. 25,190 Hydro 31 2.0 0.8 8.7 9.9 9.6
Russfin Biomass CHP Plant Project.
Chile AMS-I.C., AMS-III.E.
37,405 Biomass energy
31 2.0 7.6 12.0 9.6
Process Waste Heat utilization for power generation at Phillips Carbon Black Limited, Gujarat
India ACM0004 45,721 EE industry 31 2.0 0.8 8.7 7.9 9.6 2.4
Waste heat based 7 MW Captive Power Project Godawari Power and Ispat Ltd (GPIL)
India ACM0004 17,828 EE industry 31 2.0 0.8 8.7 7.9 9.6 2.4
Nanjing Tianjingwa Landfill Gas to Electricity Project
China ACM0001, AMS-I.D.
246,107 Landfill gas 31 2.0 0.0 7.1 2.3 5.1 7.8 7.2
Nueva Aldea Biomass Power Plant Phase 1
Chile ACM0006 106,122 Biomass energy
32 2.0 7.6 4.8 7.5 9.6
Grid connected bagasse based cogeneration project of Ugar Sugar Works Limited (USWL).
India AM0015 63,934 Biomass energy
32 2.0 0.8 8.7 10.4 9.6
TSIL – Waste Heat Recovery Based Power Project
India ACM0004 31,762 EE industry 32 2.0 0.8 8.7 8.6 9.6 2.4
LDEO Biomass Steam and Power Plant in Malaysia
Malaysia AMS-I.C., AMS-III.E.
208,871 Biomass energy
32 2.0 3.3 2.4 2.3 5.6 7.3 9.6
Huitengxile Windfarm Project
China AM0005 51,429 wind 32 2.0 0.0 4.7 6.8 9.4 9.6

Chapter 1: Defining and Measuring the Development Dividend
Development Dividend Phase II 54
Hapugastenne and Hulu Ganga Small Hydropower Projects.
Sri Lanka AMS-I.D. 44,842 Hydro 33 2.0 3.4 9.1 8.8 9.6
Small Hydropower Projects at Alupola and Badulu Oya.
Sri Lanka AMS-I.D. 25,109 Hydro 33 2.0 3.4 9.1 8.8 9.6
Magal Ganga Small Hydropower Project
Sri Lanka AMS-I.D. 34,179 Hydro 33 2.0 3.4 9.1 8.8 9.6
Biomass in Rajasthan - Electricity generation from mustard crop residues
India AMS-I.D. 31,374 Biomass energy
33 2.0 0.8 4.3 8.7 7.5 9.6
Clarion 12MW (Gross) Renewable Sources Biomass Power Project
India AMS-I.D. 26,300 Biomass energy
33 2.0 0.8 4.3 8.7 7.6 9.6
Rithwik 6 MW Renewable Sources Biomass Power Project
India AMS-I.D. 13,370 Biomass energy
33 2.0 0.8 4.3 8.7 7.6 9.6
CECECAPA Small Hydroelectric Project
Honduras AMS-I.D. 1,877 hydro 33 2.0 5.1 8.7 7.7 9.6
Cortecito and San Carlos Hydroelectric Project
Honduras 37,466 Hydro 33 2.0 5.1 8.7 7.7 9.6
LA GLORIA Hydroelectric Project
Honduras AMS-I.D. 20,464 Hydro 33 2.0 5.1 8.7 7.8 9.6
6.5 MW biomass based (rice husk) power generation by M/s Indian Acrylics Ltd. and replacement of electrical power being imported from state electricity grid/ surplus power supply to grid.
India AMS-I.D. 20,467 Biomass energy
33 2.0 0.8 4.3 8.7 7.8 9.6
Nubarashen Landfill Gas Capture and Power Generation Project in Yerevan
Armenia AMS-I.D., ACM0001
135,000 Landfill gas 33 2.0 5.4 2.4 2.3 6.2 7.8 7.2
La Esperanza Hydroelectric Project
Honduras AMS-I.D. 37,032 Hydro 34 2.0 5.1 8.7 8.3 9.6
RIO BLANCO Small Hydroelectric Project
Honduras AMS-I.D. 17,800 Hydro 34 2.0 5.1 8.7 8.3 9.6

Chapter 1: Defining and Measuring the Development Dividend
Development Dividend Phase II 55
Pandurang SSK RE Project
India AMS-I.D. 42,446 Biomass energy
34 2.0 0.8 2.1 8.7 10.4 9.6
Replacement of Fossil Fuel by Palm Kernel Shell Biomass in the production of Portland Cement
Malaysia ACM0003 61,946 Fossil fuel switch
34 2.0 3.3 4.7 9.4 9.6 4.8
Rice Husk based Cogeneration project at Shree Bhawani Paper Mills Limited (SBPML), Rae Bareli, Uttar Pradesh, India
India AMS-I.D. 14,744 Biomass energy
34 2.0 0.8 4.3 8.7 8.3 9.6
DSL Biomass based Power Project at Pagara
India AMS-I.D. 17,424 Biomass energy
34 2.0 0.8 4.3 8.7 8.3 9.6
24 MW Biomass Based Renewable Electricity Generation & Consumption in Ropar, Punjab, India
India AM0004 25,937 Biomass energy
34 2.0 0.8 4.3 8.7 8.3 9.6
Rice Husk Based Power Project
India AMS-I.D. 21,076 Biomass energy
34 2.0 0.8 4.3 8.7 8.5 9.6
8.5 MW Biomass based Power Project
India AMS-I.D. 46,098 Biomass energy
34 2.0 0.8 4.3 8.7 8.6 9.6
KMS Power 6 MW Renewable Sources Biomass Power Project.
India AMS-I.D. 16,266 Biomass energy
34 2.0 0.8 4.3 8.7 8.6 9.6
Sri Balaji 6 MW Non-Conventional Renewable Sources Biomass Power Project
India AMS-I.D. 28,590 Biomass energy
34 2.0 0.8 4.3 8.7 8.6 9.6
3.5 MW Rice Husk based Cogeneration Project at Oswal Woolen Mills Ltd.
India AMS-I.C. 22,267 Biomass energy
34 2.0 0.8 4.3 8.7 8.8 9.6
3.5 MW Rice Husk based Cogeneration Project at Nahar Spinning Mills Ltd.
India AMS-I.C. 22,267 Biomass energy
34 2.0 0.8 4.3 8.7 8.8 9.6
Landfill Gas Extraction and Utilization at the Matuail landfill site, Dhaka, Bangladesh
Bangladesh 80,000 Landfill gas 34 2.0 0.9 2.4 2.3 9.3 7.8 9.6

Chapter 1: Defining and Measuring the Development Dividend
Development Dividend Phase II 56
PROJECT FOR THE REFURBISHMENT AND UPGRADING OF MACHO DE MONTE HYDROPOWER PLANT (PANAMA).
Panama AMS-I.D. 10,963 Hydro 35 2.0 7.6 7.5 8.0 9.6
PROJECT FOR THE REFURBISHMENT AND UPGRADING OF DOLEGA HYDROPOWER PLANT (PANAMA).
Panama AMS-I.D. 12,167 Hydro 35 2.0 7.6 7.5 8.0 9.6
LOS ALGARROBOS HYDROELECTRIC PROJECT (PANAMA)
Panama AMS-I.D. 37,213 Hydro 35 2.0 7.6 7.5 8.0 9.6
JCT Phagwara Small Scale Biomass Project
India AMS-I.D. 28,032 Biomass energy
35 2.0 0.8 4.3 8.7 9.5 9.6
APCL proposed 7.5 MW Mustard Crop Residue based Power Project
India AMS-I.D. 40,313 Biomass energy
35 2.0 0.8 4.3 8.7 9.5 9.6
Chambal Power Limited’s (CPL) proposed 7.5 MW biomass based power project at Rangpur, Kota District, Rajasthan, India
India AMS-I.D. 50,327 Biomass energy
35 2.0 0.8 4.3 8.7 9.8 9.6
Biomass based independent power project at Malwa Power Private Limited, Mukatsar, Punjab
India AMS-I.D. 43,854 Biomass energy
35 2.0 0.8 4.3 8.7 9.8 9.6
Lihir Geothermal Power Project
Papua New Guinea 278,904 Geothermal 36 2.0 4.7 9.3 5.2 9.6 4.8
Zacapa Mini Hydro Station Project
Honduras AMS-I.D. 915 Hydro 36 2.0 5.1 2.1 9.3 7.7 9.6
Cuyamapa Hydroelectric Project
Honduras 35,660 Hydro 36 2.0 5.1 2.1 9.3 7.7 9.6
Cuyamel Hydroelectric Project
Honduras AMS-I.D. 25,353 Hydro 36 2.0 5.1 2.1 9.3 7.8 9.6
Wigton Wind Farm Project (WWF)
Jamaica ACM0002 52,540 wind 36 2.0 7.6 2.4 5.2 9.4 9.6
Indur 7.5 MW Non-Conventional Renewable
India AMS-I.D. 35,116 Biomass energy
36 2.0 0.8 4.3 2.3 8.7 8.6 9.6

Chapter 1: Defining and Measuring the Development Dividend
Development Dividend Phase II 57
Sources Biomass Power Project
Biomass Power Project at Kalpataru Energy Venture Private Limited, Bayana Tehsil, Bharatpur District, Rajasthan
India AMS-I.D. 44,882 Biomass energy
38 2.0 0.8 4.3 2.3 8.7 9.8 9.6
Essaouira wind power project
Morocco ACM0002 156,026 Wind 38 2.0 7.6 9.2 9.4 9.6
Yojoa Small Hydropower Project
Honduras AMS-I.D. 1,069 Hydro 38 2.0 5.1 2.1 9.3 7.7 2.5 9.6
e7 Bhutan Micro Hydro Power CDM Project
Bhutan AMS-I.A. 524 Hydro 41 2.0 3.8 2.1 4.6 9.3 9.4 9.6
"Las Vacas" Hydroelectric project
Guatemala AM0005 90,363 Hydro 43 4.1 1.4 6.4 4.6 8.4 8.4 9.6
Kuyasa low-cost urban housing energy upgrade project, Khayelitsha (Cape Town; South Africa)
South Africa 6,580 EE households
48 4.1 4.7 8.6 4.6 5.5 2.0 9.3 9.6
Moldova Energy Conservation and Greenhouse Gases Emissions Reduction
Moldova AMS-II.E., AMS-III.B.
11,567 EE service 50 2.0 7.6 8.6 7.0 7.8 2.0 5.1 9.6
“Photovoltaic kits to light up rural households in Morocco”
Morocco AMS-I.A. 38,636 Solar 51 8.2 7.6 2.4 2.1 4.6 9.3 2.0 5.2 9.6
CDM SOLAR COOKER PROJECT Aceh 1
Indonesia AMS-I.C. 3,500 Solar 56 4.1 4.7 4.3 9.3 9.3 2.0 10.1 9.6 2.4
Bagepalli CDM Biogas Programme
India AMS-I.C. 19,553 Biogas 56 2.0 0.8 4.7 8.6 9.3 8.7 2.0 10.1 9.6
Moldova Biomass Heating in Rural Communities (Project Design Document No. 2)
Moldova AMS-I.C., AMS-III.B., AMS-II.E.
17,888 EE households
57 2.0 7.6 4.7 8.6 7.0 8.6 2.0 5.1 9.6 2.4
Moldova Biomass Heating in Rural Communities (Project Design Document No. 1)
Moldova AMS-I.C., AMS-III.B., AMS-II.E.
17,888 EE households
57 2.0 7.6 4.7 8.6 7.0 8.6 2.0 5.1 9.6 2.4
Biogas Support Program - Nepal (BSP-Nepal) Activity-2
Nepal AMS-I.C. 46,893 Biogas 58 4.1 0.5 4.7 8.6 9.3 9.3 2.0 10.1 9.6

Chapter 1: Defining and Measuring the Development Dividend
Development Dividend Phase II 58
Biogas Support Program - Nepal (BSP-Nepal) Activity-1
Nepal AMS-I.C. 46,990 Biogas 58 4.1 0.5 4.7 8.6 9.3 9.3 2.0 10.1 9.6

Chapter 1: Defining and Measuring the Development Dividend
Development Dividend Phase II 59
Annex IV: Add-On Commitments in CDM Projects
Title Host
Parties Annual CERs
Project type
DD Score Add-Ons
Aleo Manali 3 MW Small Hydroelectric Project, Himachal Pradesh, India
India 13,614 Hydro 29 Committed to local village within two years of implementation: re-do main road, add street lighting, build community shed. No monitoring plan.
Bandeirantes Landfill Gas to Energy Project (BLFGE)
Brazil 1,070,649 Landfill gas 23 Half of CER revenues to municipal government
Caieiras landfill gas emission reduction
Brazil 770,932 Landfill gas 2% of net CER profits go to local SD projects (undefned).
Cote small-scale hydropower plant Costa Rica
6,431 Hydro 15 Contract with government: monitored performance on six environmental sustainability indicators and two socio-economic ones. Includes USD 36,000 payment for environmental services.
Cuyamapa Hydroelectric Project Honduras 35,660 Hydro 36 Vague commitments on reforestation of the watershed, and activities directed at women to improve their quality of life.
Jepirachi Wind Power Project Colombia 18,028 wind 25 As described in the social management plan, a host of activities, including cultural sensitivity training for employees, training locals on inidgenous legal rights, and a compensation program including: water desalinization plant, water storage, and rehabilitation of the school, health centre and graveyard. Supposed to be built into monitoring methodology, but not evident in PDD.
LaGeo, S. A. de C. V., Berlin Geothermal Project, Phase Two
El Salvador
176,543 Geothermal 28 Proponent is a good corporate citizen locally - both on environment and on social. Asserts that CER revenue will help them be even more so.
Landfill Gas to Energy Project at Lara Landfill, Mauá, Brazil
Brazil 751,148 Landfill gas 27 Impressive plan: literacy campaign, environmental education, support to particular local slum, skills training for the poor
"Las Vacas" Hydroelectric project Guatemala 90,363 Hydro 43 Reforestation initiatives
Matanzas Hydroelectric Plant Guatemala 38,493 Hydro 28 Proponent supports an archeological preservation effort by means of a cooperative agreement with an NGO. Also does community projects. No details on either arrangement, how they are monitored, or how it's linked to project.
Olavarría Landfill Gas Recovery Project
Argentina 18,688 Landfill gas 15 Unspecified portion of CER revenues to municiapl government for purchase of potable water supplies in nearby village.
Project for GHG emission reduction by thermal oxidation of HFC 23 in Gujarat, India.
India 3,000,000 HFCs 2 Proponent to allot 1.375 million EUR of income from CERs to local sustainable development spending. (PDD Annex 12, para. 3.3.)
Salvador da Bahia Landfill Gas Management Project
Brazil 664,674 Landfill gas 15 Proponent proposes to donate 5% of net value of CERs to local community for unspecified SD-related investment.
San Isidro Hydroelectric Plant Guatemala 13,389 Hydro 30 Propoentn supports a reforestation effort in the watershed (somewhat self-serving) by means of a cooperative agreement with an NGO. Also does community projects. No details on either arrangement, how they are monitored, or how it's linked to project.
Santa Ana Hydroelectric Plant Colombia 20,642 Hydro 24 Unspecified proportion of the proceeds of CERs sales must go to restoration and conservation initiatives in the Colombian national Park system (prerequisite to obtaining concession).
Santa Rosa Peru 13,845 Hydro 28 Proponent will share unspecified percentage of CER revenue with community of la Merced. Also, free power to local orphanage.

Chapter 2: Options for Fostering the Development Dividend Deborah Murphy

Chapter 2: Options for Fostering the Development Dividend
Development Dividend Phase II 61
1.0 Introduction The aim of this chapter is to explore in-depth some alternatives that could foster the development dividend in CDM projects, with an emphasis on solutions that assist in increasing the amount of CERs delivering a stronger development dividend. This has become a critical issue in the short and medium terms as the vast majority of purchasers during the initial Kyoto phase are likely to be governments representing Annex B Parties (those with reduction commitments under the Kyoto Protocol) and as noted in the previous Chapter, these governments are faced with domestic pressure that international investments in GHG reductions provide real environmental and commercial benefits and that, at the same time, these projects be cost effective. Section 2 reviews the challenges with the current methods for assessing additionality, and identifies options for improved methods that could encourage the development dividend. Section 3 examines programmatic CDM, looking at the decisions of COP-11/MOP-1 and the options for moving forward in a manner that will promote the development dividend. A case study of transportation in Brazil helps to identify barriers and the potential development dividend benefits in this sector. Section 4 examines small scale projects through the development dividend lens, and Section 5 looks at an expanded role for LULUCF CDM projects, and uses a case study to highlight both the potential and practical difficulties associated with these projects that could influence the development dividend. Section 6 examines options for fostering investment in CDM projects in least developed countries (LDCs), and the chapter concludes with Section 7, an assessment of promising options for the development dividend in the short, medium and long term.
2.0 Additionality As set out in paragraph 43 of the Marrakesh Accords, a CDM project is additional “if anthropogenic emissions of greenhouse gas by source are reduced below those that would have occurred in the absence of the registered CDM project activity.” Additionality has been one of the more difficult concepts in the CDM, and the paper produced in the first phase of the Development Dividend Project, Realizing the Development Dividend: Making the CDM Work for Developing Countries, indicated a wide range of opinions on this subject. Some wanted the bar lowered, arguing that financial additionality is not required in the Marrakesh Accords and the barriers tests can only be passed by fundamentally weak projects or shameless storytellers. Environmental additionality, it was argued, must be the real focus and even if a few false positives get through the system, this is a small price to pay for the increase in the number of projects, the engagement that entails for developing countries, and the push that it might give to new technologies. Those that argued against lowering the bar noted that false positives increase the level of emissions. Public submissions on the issue of additionality received by the EB in March 2006 reflect this contention, with input ranging from the need to keep the current tool to suggestions for streamlining and improvement. .45 The Meth Panel, at their twenty-third meeting, put forward the “Combined tool to identify the baseline scenario and demonstrate additionality” (Combined Tool), which merges the baseline methodology and the demonstration of additionality. The EB will report to COP-12/MOP-2 on the public submissions, this Combined Tool and other options for improving the tool for demonstrating additionality.46
45 The EB approved the Tool for demonstration and assessment of additionality at its Sixteenth Meeting in October 2004. The additionality tool provides a step-wise approach that includes: identification of alternatives to the project activity consistent with current laws and regulations; investment analysis to determine that the proposed project activity is not the most economically or financially attractive; barriers analysis; common practice analysis; and impact of registration of the proposed project activity as a CDM project activity. 46 The EB approved the Tool for demonstration and assessment of additionality at its Sixteenth Meeting in October 2004. The additionality tool provides a step-wise approach that includes: identification of alternatives to the project activity consistent with current laws and regulations; investment analysis to determine that the proposed project activity is not the most economically or financially attractive; barriers analysis; common practice analysis; and impact of registration of the proposed project activity as a CDM project activity.

Chapter 2: Options for Fostering the Development Dividend
Development Dividend Phase II 62
It is important to note that the EB has taken other steps to provide clarification on additionality, including a decision at its 22nd meeting in November 2005 to help address the issue of perverse incentives related to additionality and the CDM.47 Although it was never explicitly stated, for several years there was an underlying assumption that the existence or introduction of a climate-friendly policy or regulation in a developing country would make a project in the sector non-additional, and thus not eligible for the CDM. For example, if a country passed mandatory energy efficiency standards, projects that upgraded technology in order to meet the standard were considered probably excluded from the CDM. Thus some countries actually delayed the introduction of proactive policies, in order to prevent those policies from being integrated into the baseline and disqualifying projects from the CDM. The ruling of the 22nd meeting (UNFCCC 2005a) differentiated between national and/or sectoral policies or regulations that give comparative advantages to “more emissions-intensive technologies or fuels over less emissions-intensive technologies or fuels”, and “less emissions-intensive technologies over more emissions-intensive technologies” (e.g., public subsidies to promote the diffusion of renewable energy or to finance energy efficiency programs). Annex 3 regulated the consideration of these two types of policies in the definition of a baseline. In order to remove the temptation for countries to now or in the future institute harmful policies that would inflate the emission reductions claimed by project activities but be detrimental to the atmosphere, the EB ruled that higher emission policies could only be taken into account when developing a baseline scenario if they were implemented before the adoption of the Kyoto Protocol in December 1997. If such policies were implemented since that date, the baseline scenario of a project activity should refer to a “hypothetical situation without the national and/or sectoral policies or regulations being in place”. In the future countries may decide to enact fiscal or regulatory policies that are harmful to the environment, but thanks to this ruling they will at least not do so for the benefit they could get out of the CDM. By contrast, in the case of policies that encourage lower emissions, Annex 3 determined that the baseline scenario need not take these policies into account if the policy was implemented since the adoption of the CDM Modalities and Procedures in November 2001 (i.e. the baseline scenario could refer to a hypothetical situation without the national and/or sectoral policies or regulations being in place). Many feel that this decision closed the door to the perverse incentive of the CDM by reassuring developing countries that their CDM project activities will not be considered non-additional due to climate-friendly policies that have been enacted by governments since 2001.48 In respect to the development dividend, this decision may encourage proactive policies and programs in developing countries that encourage large scale emission reductions, including encouraging host governments to link CDM activities with PRSPs. 2.1 Challenges with the Current Methods for Assessing Additionality
The current methods for assessing additionality have been criticized for their complexity, high costs, resistance to standardization, weak environmental integrity and susceptibility to gaming. As well, some stakeholders feel that including additionality in the methodology has distracted the Methodology Panel and lengthened the approval process. A key criticism, articulated by IETA (2005a), is that the additionality consideration has often focused on the intent of the projects (was it undertaken for CDM purposes?) as opposed to finding the right baseline and ensuring that the emissions are under that baseline. This latter focus, it is argued, would ensure that additionality is addressed as stated in paragraph 43 of the Marrakesh Accords. Proving intent is almost impossible and introduces a subjective approach that will only work in a limited number of cases, and – important from a development dividend perspective – it will not stimulate changes in the energy investment patterns of non-Annex I countries and produce the large amounts of emission reductions needed.
47 The discussion on the elimination of the perverse incentive of the CDM draws largely on the background paper, Programs in the CDM, developed by Christiana Figueres and Erik Haites under the Development Dividend Project. 48 Others caution that the precise intent of the EB is not clear in the EB22 decision, arguing that it appears that the decision applies only to incentive-type policies affecting GHG emissions, and not to regulatory measures. If this interpretation is proved accurate, all regulatory measures will immediately become part of the relevant baseline for the purposes of CDM.

Chapter 2: Options for Fostering the Development Dividend
Development Dividend Phase II 63
While the tool for additionality is meant to alleviate some of the difficulties, reactions have been mixed. Some believe the tool provides sufficient guidance; while others state that it is too complex. Business perception is that the additionality tool exposes each CDM project to a subjective assessment of CDM eligibility and a project-by-project review by the EB. The tool has been criticized for focusing on investment additionality, which is not required in the Marrakesh Accords. Different companies use different criteria that are often company-specific to determine if a project is economically attractive. Because these differences in perception cannot be measured by quantitative standards, determination as to whether or not a project should be deemed additional through investment additionality, to a certain extent, becomes a subjective decision. Investment additionality may also work against the approval of projects in certain sectors. The barriers assessment also has been criticized in that barriers exist in all markets, and a qualitative assessment of barriers is open to interpretation and a weak means of proving additionality. An IISD (Murphy, et al. 2005) review of EB and Methodology Panel decisions on baseline and monitoring methodologies found that the additionality tool, while creating greater clarity, might have led to a narrow interpretation of additionality. Methodology Panel recommendations and comments on new methodologies often made reference to the tool, and at times suggested that project proponents use the tool to organize their assessment of additionality or to assess additionality when the proposed methodology was insufficient. This is not entirely appropriate and might be limiting the ability of project proponents to develop new tools to assess additionality, as the EB has stated that the use of the tool is not mandatory. IETA (2005a) notes that many project developers believe the tool’s use is mandatory in practice because most use it to avoid a possible delay of project approval. Its use is encouraged by its inclusion in consolidated methodologies and the EB has not approved other options. The complexities surrounding additionality may have had impacts on attaining the development dividend: the difficulties obtaining approvals due to concerns of additionality may have discouraged project developers and limited the number of projects entering the pipeline. The opening of the door to new methods and tools for assessment may present opportunities to increase the number of CDM projects, and therefore the quantity of quality projects offering a development dividend. 2.2 Additionality and the Development Dividend
New proposals and ideas for assessing additionality have been put forward including 22 submissions to the EB in March 2006 in response to the call for inputs on how to improve the additionality tool and how to guide projects in selecting a correct baseline. Some of these ideas have potential to increase the development dividend of CDM projects. For example, many argue that the focus of additionality assessment should be on environmental additionality – reducing GHG emissions through a project relative to the baseline – and not on intent. An option in this regard is to combine the selection of the baseline scenario and the demonstration of additionality, whereby the project activity is deemed additional if an approved baseline methodology has been followed and the project emissions are lower than the baseline emissions. The emphasis is on the baseline methodologies and the selection of the baseline – if the approved methodology is used and the project emissions are lower than the baseline then the project is automatically additional. It is argued that this would introduce a transparent and objective standard that leads to the calculation of the tonnes of CO2 reduced or avoided, and helps to reduce the subjectivity of the assessment. The Combined Tool, which will be considered at the 27th EB meeting in November 2006, may help to address these concerns and create more clarity for project proponents. The Combined Tool provides a four step approach (identification of alternative scenarios, barrier analysis, investment analysis and common practice analysis) to identify the baseline scenario and simultaneously demonstrate additionality. It can be applied in project activities where potential alternative scenarios to the proposed project activity are under control of project participants. Another option, put forward by IETA (2005a), is a simplified additionality tool. This tool would allow project developers to choose one or more of the steps in the current additionality tool, with the option to select the approach (or approaches) that is most appropriate. For example, the common practice analysis and investment analysis could be included in the barriers analysis, and the “impact of CDM registration” be removed. Such an approach may help to address the equity side of the development dividend by encouraging broader participation of

Chapter 2: Options for Fostering the Development Dividend
Development Dividend Phase II 64
LDCs and African countries, which would be able to demonstrate additionality using a common practice analysis because many technologies have not been widely disseminated in these countries. Multi-project baselines have been put forward as an option to standardize the additionality assessment and reward performance instead of intention or motivation (e.g., IETA 2006; Leining & Helme 2000). Additionality could be assessed by comparing the proposed project to one or more stringent benchmarks or performance-based standards in the sector, such as best plant or the 10th percentile level. Projects that perform better than these levels, which should be sufficiently stringent to discourage the approval of non-additional projects, could be assumed to result in GHG emissions reductions that would not have otherwise occurred. An emissions-based benchmark additionality test presumes that technologies with emissions lower than a given emissions standard are unlikely to be employed in the absence of the incentive offered through the CDM. Benchmarks or performance standards could be developed in a top-down approach, on a sectoral, national or regional basis, where appropriate. In regard to the development dividend, this approach might encourage an increase in the number of projects in large emerging or middle-income economies, as these nations are likely to have better data in place. Another option for determining project additionality on a multi-project basis has been put forward by Kartha, et al. (2005), who suggest that technology penetration rates can be a standardized means to assess additionality. The idea is that technologies with low but increasing penetration rates in a given market are more likely to occur with some type of support, such as that provided by the CDM, given the difficulty of competing in the broader marketplace. They note that the EB (UNFCCC 2004) previously endorsed the concept of penetration rates through the approved tool to demonstrate project additionality by providing “an indication that the project type is not common practice (e.g., occurs is less that [<x%] of similar cases) in the proposed area of implementation.” While such an approach holds promise, it may in actual practice be difficult to implement as there are many ways to demonstrate that a technology is emerging, and the estimation of penetration rates and thresholds can present methodological challenges. The technology penetration rate assessment may hold promise in the development of fast-track processes for projects in LDCs and African countries. Kartha, et al. (2005) note that a looser definition of additionality could work in these countries, where wrong answers will have fewer negative implications, and it may be easier to demonstrate that the technology has achieved only a low rate of penetration. A fast track assessment, limited to projects in LDCs or Africa that receive little foreign investment, could include only a qualitative barriers assessment and a review of activities for removing such barriers. If it can be demonstrated that the particular type of project/technology does not exist in the country, the project would automatically be deemed additional. Consistent with this line of thinking, the World Bank (2006) and the Government of Canada (2006) have both proposed a positive list of project types or technologies that if invested in, would automatically be additional. A list of technologies or project types could be developed for the current commitment period and then updated for post-2012. Applicability criteria for such a list would need to be developed, but could include certain countries, time periods and rates of market penetration. Such an approach could help to address issues of equity by including those countries with low rates of CDM investment. There is also the option of eliminating the additionality test in certain sectors in favour of “getting things done”. Trexler and Shipley (2005) argue that there is no such thing as a perfect additionality standard for GHG mitigation projects – and an additionality test is inherently ambiguous. What’s BAU in one country may be additional in another country, and BAU will change over time as technologies are demonstrated and accepted. False positive and false negatives can never be fully eliminated, and the appropriate balance is likely to depend on how a whole series of objectives are balanced, from cost effectiveness to sustainable development. For example, if we want to favour those projects that promote a larger development dividend, attention will need to be paid to the structure of the additionality test. It might be best to encourage additionality assessments that are less intolerant of false positives in regard to sectors and projects that deliver significant development dividend benefits – that is, having a positive list of project types that would automatically be considered additional. Further, Michaelowa and Stronzik (2002) have suggested eliminating the additionality assessment in small scale projects in the renewable sector, given the political will to fast track them due to their high transactions costs. Given the small number of CERs involved, the negative impact of any false positives under such a scheme might be less significant than the positive impacts of a streamlined process. This would be significant for the development dividend because, as elaborated in the previous Chapter,

Chapter 2: Options for Fostering the Development Dividend
Development Dividend Phase II 65
most small scale projects score well under the Development Dividend Framework. Small scale projects are discussed in more detail in Section 4.0.
3.0 Programmatic CDM49 Programmatic CDM, approved at COP/MOP-1, is a promising option for increasing the development dividend. The decision on programmatic CDM coupled with the decision on national and/or sectoral policies to eliminate the perverse incentive related to additionality, has potentially opened the door to an increased development dividend in the CDM by allowing climate-friendly programs in a number of sectors, such as transportation and energy efficiency. The analysis in Chapter 1 concluded that programmatic CDM activities demonstrate a strong ability to generate CERs as well as sustainable development benefits. A CDM program of activities is one in which emission reductions are achieved by multiple activities executed over time, often as a result of a government measure or private sector initiative. Examples include a program to implement an energy efficiency standard, a DSM program, a program to convert public transportation from diesel or gasoline to natural gas, or a soft loan program to encourage the installation of renewable energy sources. The acceptance of programs under the CDM arose from the decision at COP/MOP-1 in Montreal on Further guidance relating to the clean development mechanism (UNFCCC 2005a: 5), in which paragraph 20 states:
Decides that a local/regional/national policy or standard cannot be considered as a clean development mechanism project activity, but that project activities under a programme of activities can be registered as a single clean development mechanism project activity…”
In other words, the adoption of a policy or standard in and of itself cannot be submitted as a CDM project. However, there are cases where a program is put in place with specific activities to actually implement a policy. In such cases the program of activities can be submitted as a single CDM project activity if the resulting GHG reductions are real, measurable and verifiable according to the CDM procedures and modalities. A CDM program of activities is different from a stand-alone CDM project in the following ways:
1. It is a deliberate program, which could be public or private sector based. Public programs could include an appliance labeling and testing program for the enforcement of an energy efficiency standard, or a public utility DSM program. Private sector based programs could include the substitution of inefficient wood-fired mud stoves with efficient biogas units, or a program to disseminate photovoltaic (PV) technologies for lighting or water heating in rural areas.
2. The program results in a multitude of GHG reducing actions occurring in multiple sites. The sites could be located within one city, one region or one country, depending on the design of the program. Were it not for the enactment of the program, these actions would not occur.
3. The GHG reducing actions do not necessarily occur at the same time. Although all actions respond to the same program, they can occur either simultaneously, or throughout the life of the program.
4. The type and the size of the emission reducing actions induced by the program may not be known at the time of project registration. However possible types and sizes of expected actions have to be identifiable ex ante, and all actions must be measured ex post, using approved baseline and monitoring methodologies, in order to ascertain the actual reduction achieved by the overall program. CERs are issued based on the ex post identification and verification of GHG emission reductions achieved as a result of the program.
49 This section, Programmatic CDM, is based on the background paper developed by Christiana Figueres and Erik Haites, Programs in the CDM. The paper was developed under the Development Dividend Project.

Chapter 2: Options for Fostering the Development Dividend
Development Dividend Phase II 66
5. While GHG-reducing actions can be implemented by one or more entities, the program has one coordinating agent, responsible for designing the program and overseeing the execution of the various activities under the program. The coordinating agent must be one of the “project participants”. The nature of the coordinating agent can be as varied as a public sector institution, a non-governmental organization, a private sector company, or a financial institution. CERs or CER revenues could be used to cover the operational costs of the coordinating agent and/or to provide financial incentives for the entities (e.g. households) implementing the individual activities.
Table 1 shows the characteristics of a CDM program of activities and how these apply to programs that implement a national energy efficiency standard, a city wide DSM program and a transportation project to implement a biodiesel standard. Table 1: Characteristics of a Program of Activities under the CDM
Examples Characteristics of a Program of Activities Implementation of a
national appliance standard
Implementation of a city wide DSM program
Implementation of a biodiesel standard in
city bus fleets
Deliberate program
Labeling, testing and quality assurance program
Targeting, financing and installing program
Production and distribution of biodiesel, use in bus fleets
Multiple sites
Appliances covered under the standard will be located in households, thus multiple sites throughout the country.
Installations in residences, buildings, streets, etc., thus in multiple sites within the city.
Production and distribution, and buses would be located throughout the city, thus in multiple sites.
Not simultaneous
New efficient appliances will be purchased by individuals over period of time according to purchasing power.
Program must delineate a plan of action, as not all installations can occur at the same time.
Program will delineate a plan of action as production and distribution of biodiesel and use in buses will take place over a period of time.
Exact type and size of GHG reducing action may be unknown at registration
Cannot predict ex-ante what size appliance will be purchased. The level of GHG reductions will only be known once the appliances are purchased and functioning, and CERs are not issued until verification using approved B&M methodologies has taken place.
May not know which buildings/ residences will adopt the new technology. The level of GHG reductions achieved will only be known once the new technologies are installed and functioning, and CERs are not issued until verification has taken place. However an ex ante estimation of the maximum amount of CERs a program can achieve is possible and should be done.
Can estimate ex ante an amount of CERs. The actual level of GHG reductions will be a result of the number of buses using biodiesel, and fewer emissions generated in the production and distribution of fuel. The actual number of CERs will be verified through approved B&M methodologies.
One coordinating agent
Could be utility, standards bureau, energy efficiency agency. Responsible for distribution of CERs and avoidance of double counting.
Could be utility, energy efficiency agency.
Could be bus company or transportation agency. Responsible for distribution of CERs and avoidance of double counting.
It is important to note that not all actions that introduce replacement equipment to meet a new energy efficiency standard necessarily generate carbon credits. Replacement equipment is normally more efficient due to new technology; for example, refrigerators today are generally 60 to 70 percent more efficient than they were 20 years ago. As such, replacement refrigerators are not necessarily beyond “business as usual” and the project developer may

Chapter 2: Options for Fostering the Development Dividend
Development Dividend Phase II 67
need to prove that the standard or program of activities led to early retirement. A more realistic and easily verifiable approach is to credit activities that go beyond the minimum standard. 3.1 Barriers and Challenges to Effective Implementation of Programmatic CDM
The immediate challenges and barriers to the effective implementation of programmatic CDM lie in obtaining approval for methodologies from the EB. The first methodologies for programmatic CDM have been submitted to the EB, and it remains to be seen exactly how the Board will interpret the text in the Montreal decision. The Board has received public comments on programmatic CDM, which the Methodology Panel will use to prepare a list of options for definitions, boundary, monitoring, additionality, crediting period and approaches to address large project bundles. The decision at COP/MOP-1 to allow programs of activities in the CDM is explicit in requiring that these project activities comply with existing CDM modalities and procedures:
“Decides that … project activities under a programme of activities can be registered as a single clean development mechanism project activity provided that approved baseline and monitoring methodologies are used that, inter alia, define the appropriate boundary, avoid double-counting and account for leakage, ensuring that the emission reductions are real, measurable and verifiable, and additional to any that would occur in the absence of the project activity.” (UNFCCC 2005a: 5).
Specific considerations must be accorded to methodological requirements in a CDM program of activities, some of which are noted below.50 The project boundary is the geographic region and/or set of entities where the emission reducing actions are expected to be implemented. Even though the location of the individual GHG reducing actions may not be known at the outset, the boundary of a program can be delineated ex ante (e.g., a particular city, a region, the whole country) and considered fixed for the duration of the crediting period. The exact locations where actual emission reductions occur over time (e.g., households where new more efficient refrigerators displace inefficient ones) can be determined ex post and constitute the project boundary, as in other CDM project activities. The sources of leakage depend upon the nature of the project activity. Programs that cover an entire country could induce emission increases (or reductions) outside that country. It is likely not feasible to measure and attribute the higher emissions in one country due to an energy efficiency program in another country, so the higher emissions would not be considered leakage. In any case, it is the obligation of the project proponent to identify all potential leakages of the program, and determine whether they are measurable and attributable to the program. In the case of programs, which often implement a government policy or a private sector initiative, the more appropriate baseline options are Paragraph 48(a) and/or (b) of the Marrakech Accords (UNFCCC 2006). Paragraph 48(a) refers to “existing actual or historical emissions”, and one likely baseline alternative for a program of activities that implement a post November 2001 policy could be defined as the policies/regulations in effect prior to that date.51 Using paragraph 48(b), the project proponent could alternatively identify a plausible scenario that represents an economically more attractive course of action. If the implementation of a program needs an up-front investment that is so significant that it constitutes a barrier, it may be financially more feasible to not institute the program. CDM programs that result in a number of types of activities will have to use multiple baseline and monitoring methodologies in one PDD.
50 The background paper by Figueres and Haites goes into considerable detail on the methodological requirements and should be consulted for more information. 51 The Board’s current decision does not specify the period for which the baseline scenario would reflect the pre-11 November 2001 policies. At some point the date of the baseline scenario may have to be updated. This will be an issue for all CDM project activities.

Chapter 2: Options for Fostering the Development Dividend
Development Dividend Phase II 68
Additionality must be determined for all programs of activities. However, the additionality of a program may not be sufficient to guarantee that all emission-reducing actions implemented are additional. Three situations are possible:
• The emission reduction actions implemented are by their nature additional. In the case of an energy efficiency program that implements a mandatory standard, the additionality is reflected in the difference between the average efficiency before and after the standard is implemented.
• The individual emission reduction actions are few in number but large in size, and some may not be additional. Then the additionality of each action implemented under the program could be assessed. A voluntary program to encourage fuel switching at industrial facilities is a possible example.
• The individual emission reduction actions are small in size and many in number, and some may not be additional. In this case, participation needs to be restricted so that the actions are likely to be additional and the monitoring methodology must estimate the emission reductions due to “free riders”.
Emission reductions by free riders can be estimated using a control group, econometric methods, participant surveys, review of documents in business decision processes, payback comparisons, and engineering modeling (TecMarket 2004). Not all of the approaches are suitable for a given program, and the approaches differ with respect to their cost and the accuracy of their estimates. The fact that participants are not known in advance also complicates the choice of methods.52 A program of activities would need to specify the proposed approach used to estimate the emission reductions created by free riders as part of the proposed baseline and monitoring methodology. The EB has recently requested public input on how to avoid double counting. All project activities, including programs, will have to abide by the guidance that is eventually developed by the EB. In the meantime, double counting in programs can be avoided by stipulating that the coordinating agent is the only project participant authorized to claim CERs for the program. The coordinating agent could use the income from the CERs to cover the costs of operating the program, or it could have agreements with other potential claimants indicating that they cede their claims to the coordinating agent in exchange for a share of the CERs issued or the value equivalent. That agreement could be either a separate agreement or it could be reflected in the agreement regarding the distribution of CERs, submitted at the time of registration. In the cases where a public agency is the coordinating agent, potential double counting must be verified by the DOE. In the case of a program of activities, the crediting period must be determined at the time of submission for registration. In most cases the provisions for the crediting period are adequate. However, if the emission reducing actions have a relatively long life and are implemented over a long time, (e.g., if the actions had a life of 15 years and were implemented over 10 years) there would be a potential loss of CERs.53 This potential loss can be addressed by registering a series of separate projects each covering the actions implemented during a specified period, such as one or two years.54 The baseline and monitoring methodology would be the same for each of the projects, so the administrative costs would be relatively low.55
52 A control group appears to be the most accurate way to estimate free riders. However, establishing a control group ex ante and excluding them from the benefits of participating in the program raises philosophical issues. As well, the ex ante control group may not be representative of the actual participants. A control group selected ex post from non-participants may be unrepresentative due to adverse selection bias; the behavior of non-participants may not be representative of that of participants. 53 If the start date chosen for the crediting period is the date at which the first activities reduce emissions, the reductions that are not counted are those for subsequent activities that will still yield emissions 21 years later. The discounted present value of those emission reductions is likely to be relatively small. 54 Assuming that each project covers the actions implemented during a two-year period, the program would consist of five projects each with its own crediting period. Assuming that each of the projects selected a seven year renewable crediting period, the participants could renew the crediting period once to get CERs for 13 to 14 years of reductions from each vintage. The project participants could also decide to renew the crediting period a second time to get CERs for the remaining one to two years of reductions from each vintage. 55 The project participants could choose between registering all of the actions implemented as a single project activity and renewing the crediting period twice to capture emission reductions for 21 years or registering multiple (five to ten) projects each with its own crediting period that is renewed once and hence capturing the emission reductions for 13 or 14 years of the 15 year life of each action.

Chapter 2: Options for Fostering the Development Dividend
Development Dividend Phase II 69
The potential loss of CERs for emission reductions achieved when long-lived actions are implemented over an extended period of time could also be addressed by establishing crediting periods for specific vintages of actions. For example, all actions implemented during a given period, such as one, two or five years, would constitute a vintage with the same crediting period. Although it is not currently practiced, the COP/MOP or the EB could agree to allow a program of activities to cover multiple vintages, identifying vintages for emission reduction actions that start during the program lifetime but not after termination of the (renewed) crediting period of the first vintage.56 Vintaging has the further advantage that it may more closely mirror the relatively short lifespan of technologies typically used in energy efficiency programs (solar water heaters, efficient lighting, etc.). Vintaging is currently not allowed in the determination of the crediting period and it would be useful in the context of programs; but it is not critical, as programs can be structured so that they are not substantially disadvantaged by the existing provisions relating to crediting periods. Each type of program of activities would need an approved monitoring methodology. Small scale programs are easy to monitor. In some cases, the only monitoring required covers a collection of the number of small systems (PV), biogas) in operation. Where the program of activities involves implementing a few large actions, such as industrial fuel switching, the monitoring methodology could be the same as that for a similar single plant CDM project activity. Where the program involves implementing many small actions, such as motor replacement or appliance installation, an appropriate monitoring methodology would need to be developed. If the program involves many sites, monitoring would typically not be implemented at every site. Rather, a sampling plan would be used to select participants to be monitored and to extrapolate the monitored results to the full program with a quantifiable level of statistical precision. Sampling is already part of the approved methodologies for some small scale and regular CDM project activities. Depending upon the measures implemented, the energy savings, and hence emission reductions, may be monitored by combinations of metering and calculations, billing analysis and/or use of models.57 Each approach would have a different cost and level of accuracy. The project participants would have to propose a monitoring methodology they considered appropriate for approval by the EB. The above summary notes that a number of methodological considerations will have to be accounted for in the development of a CDM program of activities. As noted in the case study on the transportation sector in Brazil (see Box 1), while programmatic CDM offers considerable opportunity for the development dividend, there are also challenges and barriers that will need to be overcome. Box 1: Case Study: Programmatic CDM and Transportation Case Study: Programmatic CDM and Transportation58 Transportation was singled out at the Earth Summit in Rio de Janeiro in 1992 as a key area to achieve CO2 emissions stabilization. The sector accounts for approximately 30 percent of global-related GHG emissions making it the second largest contributor after the electricity and heat supply sectors. Reducing GHGs in the transport sector can lead to many additional benefits, such as improved air quality, lower dependence on oil often imported from other countries, less time spent in traffic in the case of public transport improvement, and job creation in rural areas in the case of biofuels. Given the high level of emissions in the sector and the co-benefits associated with improved technologies, CDM projects in the transportation sector
56 The provisions relating to the crediting period are specified in the Marrakesh Accords, so the use of separate crediting periods for “vintages” of actions as part of a single program of activities would likely require a COP/MOP decision rather than an EB decision. 57 Here metering means meters installed to measure the performance of the measure installed, such as run time or energy use. Billing analysis means analysis of the gas or electric bill for the facility. Metering is more costly to implement, but yields estimates specific to the measures installed. Billing data is already available, but reflects changes in addition to the measures implemented, such as changes in the level of production as well as changes in the efficiency of the motors. 58 This case study has been updated and is taken from Opportunities and Constraints on Possible Options for Transport Sector CDM Project: Brazilian Case Studies, developed by Suzana Kahn Ribeiro in 2006 as a background paper for the Development Dividend Project.

Chapter 2: Options for Fostering the Development Dividend
Development Dividend Phase II 70
offer opportunity to increase the development dividend – that is, increase the quantity of quality CDM projects.
One large scale methodology was approved in July 2006 for bus rapid transit projects, and one small scale project was at the validation stage in the CDM pipeline in June 2006. These numbers are extremely low given the total current and projected emissions in the sector. There is often a lack of data and transportation projects that fit well under the CDM tend to have small emissions impacts. Programmatic CDM has the potential to overcome some of these constraints and act as an incentive for developing countries to pursue emissions reductions through the transportation sector.
A case study from Brazil is used to demonstrate how a hypothetical program of activities could increase the use of biodiesel in a bus fleet in Rio de Janeiro. The Government of Brazil has indicated that it will not allow the biodiesel program to be submitted as a CDM activity, and this case study is put forward only as an example.
In Brazil, the energy matrix is relatively “clean”, since all gasoline in the country is a mixture of pure gasoline and ethanol. Diesel oil makes up 55.7 percent of the transportation fuel mix, and in 2005 Brazil acted to make this fuel “cleaner” through the introduction of a law establishing a minimum percentage of biodiesel mixture and a timeline for the rate of penetration in the market - 2 percent in the first five years and 5 percent thereafter. Consistent with the COP/MOP-1 decision, actions to implement this policy could be eligible as a CDM program of activities as biodiesel provides significant reductions in GHG emissions compared to diesel fuel on a “wells-to-wheels” basis. Because the introduction of biodiesel in the hypothetical CDM program is driven by an intentional program to meet the new standard, and not on an individual basis, the activities could be eligible as a CDM program.
The hypothetical program could aim to reduce emissions in Rio De Janeiro through the introduction of a 10 percent biodiesel mix – a program designed to exceed the standard. Specific activities in the program would be the production of biodiesel, transport of biodiesel to service stations and biodiesel use in the bus fleet, within a project boundary of the city. The GHG reducing actions would be achieved by the fuel substitution within the city boundary, and the reductions would occur as a result of an increased number of buses using biodiesel in their fuel mix. The levels of biodiesel produced and the number of buses using the biodiesel would determine the actual reductions, which would be verified through approved procedures; but it is estimated that over a ten year period, this program of activities could lead to a total of 188,157kg CO2 avoided emissions.
If such a program could prove feasible at the city level (where issues of data collection and monitoring are less problematic), the possibility could exist to develop such a program at the national level that would cover emissions from total biodiesel sold. This could significantly decrease the amount of CO2 emitted and encourage a move toward large, long term reductions in the transportation sector.
Despite the opportunities presented by programmatic CDM in the transportation sector, there are a number of barriers to overcome before a program of activities can be developed as a CDM project on both a city- and national-scale. The case study notes a number of constraints to overcome before Brazil will be able to develop rigorous baseline and monitoring methodologies:
• Lack of data to develop quality baselines; much of it is not available and much is expensive to collect as it is based on end-use levels.
• Calculation of leakage can be difficult as the main raw material is derived from agricultural activities, and the calculation of the emissions of these gases is not always as simple as that of CO2. Calculations must account for the life cycle of the raw material, including emissions of GHGs during the cultivation, harvesting and production of the biomass used as the in the biodiesel manufacturing process.
• Investment additionality may be difficult to prove with the current additionality tool. CER revenues will make up only a small portion of the investment cost as the cost of the biomass feedstock for biodiesel is relatively low in Brazil, given the climate and low labour costs.
• Double counting may be a problem as there are many stakeholders in transportation projects: government regulators, technological producers (e.g., fuel), intermediaries (retailers, utilities) and consumers.
• An overall monitoring system for transportation programs may be difficult to establish in Brazil, given the large fleet of vehicles, the high growth rate and a fuel mix consisting of diesel, gasoline and ethanol. The recently implemented inspection and maintenance program in Rio de Janeiro may help to overcome the lack of data at the city level, and would have to be expanded for a national CDM program of activities.
Programmatic CDM offers the opportunity to increase the number of projects in the transportation sector by allowing governments to introduce activities that can promote fuel-switching, technology up-grades and travel demand within one program. As the CER returns to transportation projects are generally low but the sustainable development benefits are high, programs offer the opportunity to act on a large scale that can make a substantial contribution to setting the sector on a sustainable path. As the case study notes, there are significant constraints to be overcome, but programmatic CDM has opened a door to move forward in a positive manner that meets national development and climate change goals.

Chapter 2: Options for Fostering the Development Dividend
Development Dividend Phase II 71
3.2 Development Dividend Benefits of Programmatic CDM
The recent opening of the CDM to programs has several important benefits in regard to the development dividend. First, it promotes the “decarbonization” of developing country economies by increasing the relative participation of energy projects in the CDM because the structure of programmatic CDM lends itself particularly well to energy projects. Energy-related emissions account for 66 percent of developing country emissions59 (WRI 2004), and two-thirds of the future increase (up to 2030) in global energy-related emissions is expected to come from developing countries (IEA 2004). Energy is a critical contributor to global warming, and hence energy also has to be part of the solution, including via the CDM. Energy projects are increasing within the CDM, but the low global warming potential of CO2, the long lead times of electricity projects, and above all the dispersed nature, small credit flows and high transaction costs of energy efficiency projects have made energy projects comparatively less attractive in the CDM market. The possibility of structuring energy-related projects as programs could help to increase the representation of energy projects; currently 21 percent of CDM reductions come from electricity generation based on renewables, and 6 percent can be attributed to energy efficiency measures (UNEP-Risø Centre 2006). Noted in the analysis in Chapter 1 was that a high development dividend often, but not always, accompanies energy-efficiency and renewable energy projects. Second, programs tend to “democratize” the CDM. Perhaps the two areas that will be most positively affected by the program approach are fossil fuel switching and energy efficiency. In these areas clean technology deployment does not typically occur on an individual basis but rather on a gradually collective basis as the result of intentional programs. These programs are able to reach large numbers of individual households and small industry, offering them cleaner technology (appliances, transportation fuel, motors, air conditioners, etc.) installed according to the client’s purchasing power and willingness to pay.60 Thus programs open the benefits of the CDM to many small users who have not participated in the mechanism. Third, a program approach promotes long term shifts toward less GHG intensive options in the respective sector. Traditional single-site projects tend to be individual efforts at a “carbon upgrade” within the limited boundary of a single facility or enterprise, and thus produce little to no transformational effect on the sector or economy. While such a project may well improve the GHG intensity of the facility, it makes little contribution – if it is the only of its kind implemented – to decarbonizing production or consumption patterns. By contrast, a program approach could promote the much-needed transformation in the energy trends of developing countries. 3.3 Options for Promoting the Development Dividend under Programmatic CDM
CDM programs mark an important opportunity in the meaningful participation of developing countries in the global climate regime. By assigning a CER value to reductions achieved under a program of activities, the regime is providing an incentive for developing countries to adopt and implement climate friendly policies and measures. In the short term this could significantly increase the supply of CERs on the market for the period 2008-2012. In the medium term, it can help prepare developing countries for a broader participation in the future climate regime, by stimulating the necessary technical capacity and infrastructure for large-scale climate protection policies. As mentioned, the first methodologies for programmatic CDM have been submitted to the EB, and it remains to be seen exactly how the Board will interpret the text in the Montreal decision. These first approvals will lay the groundwork for an uptake of programmatic CDM, thus timely approval and clarity in the decisions to approve or reject methodologies will be of assistance to project developers and host countries. The Meth Panel and the EB have taken an initial step to provide clarity for project proponents by developing a proposed definition of a “programme
59 Excluding land use change and forestry emissions. 60 Bundling is not appropriate for these cases where there could be various types of technologies and a period of time during which they are installed.

Chapter 2: Options for Fostering the Development Dividend
Development Dividend Phase II 72
of activities”. This definition, which is open to decision at the 27th meeting of the EB in November, includes eight parts (CDM EB 2006):
1. A programme will have one host country, i.e., the project will take place within a country although the physical boundary of the “programme of activities” could extend to more than one country.
2. Each programme can involve more than one project group. Separate PDDs for each project group are to be submitted to EB.
3. Consistent with the present guidance of the EB in assessing additionality, voluntary activities are allowed, and if it is demonstrated that a regulation or law is not enforced then a particular action though required by law could be considered additional.
4. Each individual project activity in a programme must result directly in emissions reduction that can be monitored.
5. Each individual project activity must be traceable, i.e., the reductions can be identified and localized in an unambiguous manner at either the validation or verification stage.
6. The programme of activities can be put in place by any coordinator/managing entity including government or a government agency.
7. The actors implementing the emissions reduction activity are not necessarily the same as the coordinator/ managing entity. Agreements between the coordinator/managing entity and the actors implementing the individual emissions reducing activity will prevent double counting.
8. Two options regarding the crediting period (CP) are to be discussed at the EB meeting. Both options determine that programmes of activities shall have single CPs, and that individual project activities can have individual CPs and start at any time within the CP as defined in the “programme of activities”. The difference between the two options lies in how the end dates of the project activities impact on the end date of the programme of activities, but both options encourage project proponents to implement activities early on.
Project developers and host countries also have a role to play in the short-term; they will need to submit CDM programmes with new or existing methodologies to ensure that programmatic CDM takes off. Analysis of the fourteen activities and related methodologies in the CDM pipeline that have programmatic characteristics (see Chapter 1, Section 5.3) may offer lessons for CDM program developers. There is significant potential in developing countries to take advantage of programmatic CDM in a way that would give positive incentives for progressive environmental legislation, and would earn the financial resources necessary for strong implementation of any new standards. To ensure a wide uptake, there is a need for an analysis of the nature of the opportunity arising through programmatic CDM, including the types of policies and programs that might have the greatest potential, and the types of institutional arrangements that would yield the greatest chances for success. There is also a need for capacity building to assist countries in developing suitable baselines and additionality tools. This is particularly important as many countries may lack the required technical capacity to develop and implement programmatic CDM, which could exacerbate the already unequal regional distribution of projects. Over the longer term, programmatic CDM may be a learning ground for the introduction of policy-based CDM. Active participation in programmatic CDM could assist developing countries in building up the necessary technical capacity and system tools to consider non-binding pledge-based Sustainable Development Policies and Measures (SD-PAMs), as presented by Baumert and Winkler (2005), which could assist in the integration of GHG considerations into national development plans. The SD-PAM approach seeks to make developing countries adopt policies and measures that are geared toward development but also entail climate benefits.
4.0 Small Scale CDM Projects Small scale projects have better tendencies toward development dividend benefits than large projects (see Chapter 1, Section 5.2), and as such, should be given special treatment in the approval process. They already have a number of advantages, such as simplified baseline and monitoring methodologies, simplified PDDs, the ability to bundle several small scale projects, simplified provisions for environmental impact analysis, a shorter review period before

Chapter 2: Options for Fostering the Development Dividend
Development Dividend Phase II 73
registration, exemption from the adaptation fee (if implemented in an LDC), ability to use the same DOE for validation and verification, and lower registration fees. But it is still argued that more can be done. A review of the UNEP Risø Pipeline of June 20, 2006 reveals that 410 of 860, or 48 percent of the CDM projects in the pipeline are small scale. Table 2 indicates the number of small scale projects by type, with the largest number of small scale projects being biomass energy (111 projects or 27 percent of total small scale projects), hydro (96 projects, 23 percent), energy efficiency - industry (49 projects, 12 percent) and wind (40 projects, 10 percent). These four project types comprise 72 percent of the total small scale projects. A total of 272 projects (66 percent) are in the renewable energy sector, and 53 projects (14 percent) are in the sector of energy efficiency. The percentage of projects in these two sectors, which are generally considered to have high sustainable development benefits, suggests that additional special treatment for small scale projects could be justified on a development dividend basis.
Table 2: Percentage of Small Scale CDM Projects in the Pipeline – by Type
Type Total Number of Small scale
Projects
Total Number of Projects
% of Total Project that are Small
scale
% of Type of Total Small scale
Projects (of a total 410)
Biomass energy 111 194 57.2% 27.1%
Hydro 96 145 66.2% 23.4%
EE industry 49 110 44.5% 12.0%
Wind 40 100 40.0% 9.8%
Agriculture 37 91 40.7% 9.0%
Biogas 20 32 62.5% 4.9%
Landfill gas 18 75 24.0% 4.4%
Fossil fuel switch 15 32 46.9% 3.7%
EE service 10 10 100% 2.4%
Solar 5 5 100% 1.2%
EE households 4 4 100% 1.0%
Fugitive 2 7 28.6% 0.5%
Energy distribution 2 2 100% 0.5%
Transport 1 1 100% 0.2%
Other project types1 0 52 0% 0%
Total of all project types 410 860 47.7% 100%
1Project types with no small scale projects include: afforestation, cement, coalbed/mine methane, geothermal, HFCs, N20, other industrial processes, reforestation and tidal.
Source: UNEP Risø Centre on Energy, Climate and Sustainable Development, 20 June 2006.

Chapter 2: Options for Fostering the Development Dividend
Development Dividend Phase II 74
Table 3: Small scale Projects – Number and 2012 kCERs – by Level of Development
Level of Development/Country for Total CDM projects Number 2012 kCERs Total SS % of SS total SS % of SS Least Developed Countries 10 7 70.0% 3905 1376 35.2%Bangladesh 3 1 33.3% 1952 94 4.8%Bhutan 1 1 100.0% 4 4 100.0%Cambodia 1 1 100.0% 293 293 100.0%Lao PDR 1 1 100.0% 44 44 100.0%Nepal 2 2 100.0% 696 696 100.0%Tanzania 1 0 0.0% 672 0 0.0%Uganda 1 1 100.0% 245 245 100.0%Other Low Income Countries 350 204 58.3% 262636 46917 17.9%India 260 161 59.4% 209512 44663 21.3%Ivory Coast 1 0 0.0% 5661 0 0.0%Kyrgyzstan 1 0 0.0% 513 0 0.0%Moldova 4 3 75.0% 766 278 36.3%Mongolia 1 1 100.0% 1358 1358 100.0%Nicaragua 3 0 0.0% 2872 0 0.0%Nigeria 2 0 0.0% 25126 0 0.0%Pakistan 1 0 0.0% 6900 0 0.0%Papua New Guinea 1 0 0.0% 1836 0 0.0%Tajikistan 1 1 100.0% 356 356 100.0%Vietnam 5 3 60.0% 7736 262 3.4%Lower Middle Income Countries 280 118 42.1% 211385 35349 16.7%Armenia 2 1 50.0% 957 553 57.8%Bolivia 4 1 25.0% 2521 33 1.3%Brazil 160 63 39.4% 142415 25399 17.8%Colombia 7 2 28.6% 3395 304 9.0%Dominican Republic 1 0 0.0% 627 0 0.0%Ecuador 10 2 20.0% 3365 343 10.2%Egypt 3 0 0.0% 11392 0 0.0%El Salvador 5 1 20.0% 3467 301 8.7%Guatemala 11 5 45.5% 5451 147 2.7%Honduras 19 11 57.9% 3610 1621 44.9%Indonesia 9 5 55.6% 10554 815 7.7%Jamaica 1 0 0.0% 456 0 0.0%Peru 7 2 28.6% 6252 2102 33.6%Philippines 22 18 81.8% 2442 874 35.8%Sri Lanka 5 5 100.0% 1025 1025 100.0%Thailand 12 2 16.7% 9331 1832 19.6%Tunisia 2 0 0.0% 4125 0 0.0%Upper Middle Income Countries 201 72 35.8% 465990 30269 6.5%Argentina 9 1 11.1% 25961 302 1.2%Chile 23 4 17.4% 25857 3342 12.9%China 71 13 18.3% 336304 5481 1.6%Costa Rica 4 1 25.0% 1870 63 3.4%Fiji 1 1 100.0% 164 164 100.0%Malaysia 18 15 83.3% 14177 12951 91.4%Mexico 54 25 46.3% 48597 4997 10.3%Morocco 4 2 50.0% 1991 435 21.8%Panama 5 5 100.0% 824 824 100.0%South Africa 10 5 50.0% 8770 1727 19.7%Uruguay 2 0 0.0% 1475 0 0.0%More Advanced Countries 19 9 47.4% 91932 987 0.3%Cyprus 2 1 50.0% 407 101 24.8%Israel 4 3 75.0% 1349 631 46.8%South Korea 13 5 38.5% 90176 255 0.3%World 860 410 47.7% 1035850 114898 11.1%
Source: UNEP Risø Centre, CDM Project Pipeline, 20 June 2006; OECD-DAC, 2005.

Chapter 2: Options for Fostering the Development Dividend
Development Dividend Phase II 75
A review of the number of small scale projects in countries when grouped by level of development (as defined by the OECD-DAC) also supports the assumption that additional special treatment for small scale projects could be justified on a development dividend basis. As noted in Table 3, the percentage of small scale projects in the UNEP-Risø pipeline making up the total CDM projects in countries grouped by level of development, declines from LDCs (70 percent) to Other Low Income Countries (58 percent), Lower Middle Income Countries (42 percent) to Upper Middle Income Countries (36 percent). The More Advanced Countries do not follow this trend, with small scale projects making up 47 percent of total projects. But the trend holds when examining the percentage of total expected emission reductions by 2012 to be delivered through small scale projects, which also decreases by level of development. Small scale projects account for 35 percent of 2012 emissions in LDCs and only 0.3 percent in More Advanced Developing nations.
If India and Brazil are removed from the analysis, the trends change somewhat. Without India, the percentage of small scale projects of the total CDM projects in Other Low Income Countries drops to 48 percent, accounting for only 4.2 percent of total expected emission reductions by 2012 (note that two large fugitive emission projects in Nigeria account for 47 percent of the total expected emission reductions). For Lower Middle Income Countries without Brazil, the percentage of small scale projects of the total CDM projects increases to 46 percent, accounting for 14 percent of total expected emission reductions by 2012. The low number of CDM projects in LDCs makes it difficult to determine if small scale projects have a better likelihood of being implemented in these nations than large projects. If early trends are indicative of the developing CDM market, it suggests that actions to promote small scale projects in LDCs and Other Low Income Countries may be needed to assist these countries in accruing development dividend benefits. 4.1 Barriers and Challenges to Small Scale Projects
Given the number of small scale projects in the pipeline, 48 percent of all projects, it might be assumed that the special rules accorded to small scale projects are working. Indeed, this assumption is likely true, but small scale projects still face unique barriers and constraints. Transaction costs are high relative to the expected direct emission benefits. Small scale projects are challenging to transact in the marketplace due to a combination of perceived risk factors and lack of economies of scale. A 2001 study (UNDP 2003) determined that small scale projects are expensive in terms of cost per unit of CO2 offset. The study found that off-grid projects were more expensive than on-grid; projects in rural areas were more expensive than those in urban areas, and projects in Africa were more costly than anywhere else in the world. The UNDP (2006: 53) determined that transaction costs are significant for very small projects and can make these projects relatively unattractive. Ecosecurities (2002) noted that project developers involved in community-focused or development-oriented projects are less able to meet the transaction costs associated with preparing CDM projects. The upfront nature of the costs associated with CDM project development is a problem frequently encountered by small scale project developers, particularly if there is uncertainty in finding a buyer. A study undertaken by IT Power (Bhardwaj, et al. 2004) in India concluded that the simplified procedures for small scale projects do not sufficiently reduce transaction costs for projects generating less than 10,000 tonnes of annual CO2 reductions, which is the low end of small scale projects. For projects of this size in the energy sector, the transaction costs associated with project development amounted to 21 percent of the total CER revenues. They determined that bundling could be an option to reduce transaction costs, but a lower frequency of verification (e.g., every two years, instead of every one) would be required to improve the viability of bundling. The rules for bundling may present barriers, as the opportunity to spread the transaction costs across a number of projects is constrained by the rule that the total size of a bundle of project activities cannot exceed the limits set for small scale CDM projects. This limit may prevent bundling from having the desired effect of bringing down transaction costs. The UNDP (2006) notes that there is little data available on bundled projects so it is difficult to determine transaction cost savings. A World Bank (2005) study noted that the inflexible bundling rules could have significant impact on transaction costs, using the Nepal Biogas Project as an example. To stay below the 15 MW threshold for small biogas plants, the project would need to be split into 31 small scale projects, with each bundling

Chapter 2: Options for Fostering the Development Dividend
Development Dividend Phase II 76
approximately 6,500 plants. This would result in a total cost of US$4,200,000 for the validation, registration and certification for the umbrella project – compared to a total cost of US$110,000 if bundling rules did not impose the threshold. The definition of small scale projects may also be a barrier to certain project types, as the small scale renewable energy, energy efficiency and other climate change mitigation projects are considered by some to not be equitably defined. CCAP (Kelly 2000: 6) provided an example of this inequity in their analysis of options to fast track small scale CDM projects in the Caribbean:
“A 15MW-biomass plant generates approximately 111,690 MWh, compared with 46,500 MWh for a wind plant, 7,000 MWh for a solar PV plant, and 42,000 for a small hydro plant of the same size. If the Caribbean regional baseline emission rate of 752 CO2/MWh were applied to these project types, the associated annual CO2 emission reductions for the biomass, wind, solar PV, and hydro plants would be estimated at 84 ktCO2, 31.6 ktCO2, 5.3 ktCO2, and 35 ktCO2, respectively, which is a considerable range. Using the same Caribbean baseline, a small scale energy efficiency project, which by definition is limited to 15 GWh, would generate 11.3 ktCO2 per year.”
These figures demonstrate that the definitions of small scale projects will result in very different emission reductions, depending on project type. Biomass projects are much more attractive in regard to emission reductions than solar PV, suggesting that the definition may act as a disincentive for the development of certain types of projects. For other project types, however, the definitions may act as perverse incentives. The EB has begun address this issue, recommending revisions to the definition of two of the categories for small scale projects, which will be discussed at COP-12/MOP-2. The first category, for renewable energy project activities with a maximum output capacity equivalent of up to 15MW, was kept unchanged. The second category, for energy efficiency improvement projects, was increased to encompass projects that reduce energy consumption by up to 60 GWh per year. The new definition for type three small scale projects specifies that this category will apply to projects that reduce emissions by 60,000 tCO2e or less. This will make it more difficult for big projects to qualify, such as the The Lages Methane Avoidance Project. As noted in Chapter 1, this project, which should arguably be considered large, received all the special treatment accorded to small scale projects. The EB requested public input on barriers to developing small scale energy efficiency projects in August 2006.61 Submissions indicated that the current definition poses a barrier because the allowable size of small scale projects is too small, that transaction costs are high for small scale projects, and that post-2012 CER market uncertainly acts as a deterrent to CDM project development. Inputs to the EB also included recommendations: set the threshold criteria of small scale project types in terms of tons of CO2e; increase the size limits of small scale projects; and allow carbon credits to be generated by projects that reduce consumption of non-renewable sources of biomass. The EB has not been able to make a decision on how to judge small scale biomass projects under the CDM. Methodologies for small scale non-renewable biomass projects proposed by the Small Scale Working Group (SSWG) to the EB at their July 2006 meeting were not approved, and the issue will go back to the COP (which had asked the EB to develop the methodology in the first place). The issue was raised because of a decision taken at the 21st EB meeting in September 2005 to remove non-renewable biomass as a baseline methodology. The decision, which was to address concerns that non-renewable biomass projects might circumvent the prohibition of deforestation avoidance in the CDM, indicated that credits resulting from increased carbon pools are only possible if the project is managed as an afforestation/reforestation project. But there is no consolidated methodology for combined forest and biomass energy projects at this time. The issue has generated considerable interest because projects that reduce the consumption of non-renewable biomass, such as improved biofuel stoves, have significant development benefits (e.g., improved indoor air quality and health impacts) for poor and least developed countries, as well as considerable environmental benefits in terms of avoided deforestation and biodiversity preservation.
61 Public input to the EB can be accessed at: http://cdm.unfccc.int/public_inputs/meth_ssc_typeII/index.html.

Chapter 2: Options for Fostering the Development Dividend
Development Dividend Phase II 77
4.2 Development Dividend Benefits of Small Scale Projects
Chapter 1 concluded that small scale projects have better tendencies toward development dividend benefits, and the basic relationship holds across all three elements of sustainable development: social, economic and environmental. Of the 20 projects with the highest development dividend scores, 16 are small scale and in the sectors of biogas, energy efficiency (households), solar, energy efficiency (services), hydro and biomass energy. Small scale projects have the potential to stimulate sustainable development through local and national benefits for host countries, including rural electrification, reduced fuel costs, increased employment, improved air quality, local capacity building and technology transfer. Small scale projects also hold great potential for the development of projects in rural areas, providing a means to overcome technological and financial barriers in areas where the range of energy options are limited and often unsustainable (e.g., unsustainable consumption of biomass, kerosene). 4.3 Options for Promoting the Development Dividend for Small Scale Projects
The original intent of the Parties in developing special rules for small scale projects was “to promote projects which due to their size attract little commercial interest but are considered desirable for reasons of equity and sustainable development” (Greiner 2005). If we consider this intent in light of the barriers and constraints that still exist for small scale projects, it stands to reason that more can be done. It is important to note that these measures to promote small scale projects could also improve the prospects for CDM projects in LDCs, an issue further elaborated in Section 6. The definition of “small scale” should be reexamined with the intent of creating equity between project types. While the recommended revisions to the definitions of type II and type II small scale actviites begins to address this issue by making the three types equivalent to each other. Yet, the discrepancy within type I still exists, whereby different types of renewable energy plants of the same output capacity (15MW or equivalent) generate very different CO2 emission reductions. A revised definition could be based on the environmental impact (i.e., emissions reductions), which is consistent with the intent of Marrakesh Accords. The issue of small scale non-renewable biomass projects will be taken up by the COP/MOP in Nairobi in November 2006. If the COP/MOP does not take a decision, this category will be excluded from the CDM. Strong support should be demonstrated for including improvements in the efficiency of stoves and indoor fuel use in the CDM. Options include developing an alternative small scale CDM category to accommodate the particular methodological requirements of cookstove projects; and developing methodologies for combined forest and biomass energy projects. A simplified additionality test could be considered for small scale projects to help in reducing transaction costs. This could include, as discussed in Section 2, a positive list of small scale project types that would automatically be considered additional. The trade-off between environmental integrity and simplification of the rules for small scale projects would be met by assuring that those projects approved for streamlined procedures bring significant development dividend impacts to host countries. The development dividend framework developed in Chapter 1 could be used in this regard. An Ecosecurities (2002) study determined that the risk of free-riding under the CDM is lowest for development-focused small scale projects because they have the greatest technological and economic barriers to development and the least certainty in the baseline emission estimates. If there is no agreement to move forward on changes to the rules for small scale projects, special regulations for micro-projects in designated sectors might be considered. As there is no agreed definition, for the sake of example, it will be assumed that all CDM projects in the pipeline that are expected to have total emission reductions by 2012 of

Chapter 2: Options for Fostering the Development Dividend
Development Dividend Phase II 78
less than 50 ktCO2 will be considered micro-projects.62 A list of the 63 projects that meet this criterion is included in Annex I. These 63 projects represent 7.7 percent of the total projects in the pipeline and they collectively are estimated to result in emission reductions of 1726 ktCO2 by 2012, or less than one percent of the overall total. While agricultural and industry energy efficiency projects (17 and 16 projects respectively) are not high scorers in the Development Dividend Framework, the remaining micro-projects (primarily in the renewable energy sector) provide high development benefits. Simplified approval procedures as described above and automatic assumption of additionality for micro-projects in designated sectors might be a means to increase the development dividend. While some non-eligible emission reductions might occur, the impact of a few non-additional projects in the system would be small given the scale and scope of such projects.
5.0 CDM LULUCF Projects The LULUCF sector offers opportunity to implement CDM projects in developing countries. To date, there is a noticeable absence of afforestation/reforestation (A/R) projects, an important area for increasing the development dividend in the CDM. These projects present opportunities to involve developing countries that may have few energy-based CDM projects while allowing Annex I countries to postpone part of their emissions reduction commitment and yet still be in compliance. Changes in land use and forest activities can have a significant impact on CO2 concentrations in the atmosphere, as these sources represent up to 20 percent of current emissions from burning fossil fuels (Brown, et al. 1996, in Pearson, et al. 2005). Changes in land-use can impact positively on CO2 concentrations by decreasing emissions that would occur without intervention (e.g., preventing deforestation and preventing drainage of wetlands) and sequestering carbon from the atmosphere into vegetation and the associated soil (e.g., afforestation, reforestation and changing agricultural practices). Eligible sinks projects in the CDM are limited to A/R activities for the first commitment period (2008-2012). During this commitment period, Annex I Parties are limited in the extent to which they can use offsets from LULUCF to meet their reduction commitments. The use of CERs is limited to one percent of a country’s base year emissions, multiplied by five to cover the commitment period 2008–2012 (UNFCCC 2001). This formula represents a maximum global ceiling of about 64 Mt CO2 for the entire commitment period (Cau, et al. 2006). Two A/R projects, one in India and one in China, are listed as at the validation stage in the UNEP-Risø June 20th 2006 CDM pipeline. Three methodologies have been approved for A/R projects to date. Methodology development for projects in this sector is taking longer than for other types of CDM projects, given the complexity of estimating carbon stocks and flows (World Bank 2005). The issue of permanence of emission reductions makes this area conceptually and technically different, while the views of some Annex I governments on purchasing LULUCF credits establishes a political obstacle as well. One baseline and a related monitoring methodology for the conversion of grassland and cropland to forested land has been approved for small scale A/R CDM projects. The small scale threshold is defined as “projects with new anthropogenic GHG removals by sinks of less than 8 kilotonnes of carbon dioxide per year if the average projected new anthropogenic GHG removals by sinks for each verification period do not exceed 8 ktCO2e per year” (UNFCCC 2004). These small scale activities are to be developed and implemented by low-income communities or individuals, as defined by the host country. As noted in the Marrakesh Accords, all LULUCF project activities should be governed by the principle of contributing to the conservation of biodiversity and the sustainable use of natural resources.
62 The definition of micro-project used, total emission reductions by 2012 of less than 50ktCO2, is put forward only as an example to demonstrate the numbers and types of projects that could be eligible for fast-track approvals. The authors are not suggesting that this is the preferred definition of micro-project.

Chapter 2: Options for Fostering the Development Dividend
Development Dividend Phase II 79
The decision to include LULUCF projects in the CDM has been controversial, with critics maintaining that these projects will serve as a mechanism for Annex I countries to avoid emissions reductions – allowing them to continue to pollute while funding carbon offset projects, that emission reductions through LULUCF projects are non-permanent, and that the creation of A/R projects will lead to monoculture plantations in developing countries that damage biodiversity and impact negatively on communities. Advocates say that LULUCF projects are important to keep down the cost of meeting Kyoto targets; build recognition of the value for carbon in trees; and allow developing countries to participate in the climate market in projects that will benefit the world’s climate, forests, biodiversity and local communities. 5.1 Barriers and Challenges to LULUCF Projects
LULUCF projects in the CDM are bound to play a relatively minor role in the first commitment period (Forner & Jotzo 2005), and this would likely be the case even if there were no caps on the amount of emission offsets from A/R projects. Demand and supply for sinks CERs will be relatively low due to a range of factors relating to the economics of land use and investment in such long term projects, as well as socio-political aspects of sequestration projects. In the short-term, the significant transaction costs of the CDM (reflecting the technical difficulties associated with LULUCF projects, including establishing additionality, baselines, system boundaries and leakage, monitoring and the permanence of mitigating effects) may favour larger operations that benefit from economies of scale. There is concern that a CDM market that includes only A/R carbon credits could end up encouraging large scale conventional forestry schemes, with a focus on single species plantations on land with good growth rates and the use of exotic or genetically modified species to improve those rates (Skutsch 2004; IUCN 2002). These projects can be very effective at storing carbon, but if poorly planned, might reduce biodiversity, affect access to land, affect food security, use large amounts of water, and have other adverse environmental and social effects. Many NGOs (Greenpeace 2002; Friends of the Earth 2005; FERN 2005) have opposed LULUCF projects on these and other grounds. They maintain that these projects are used to avoid Annex I domestic reductions–diverting political and financial resources away from the urgent task of reducing fossil fuel-related GHG emissions and encouraging transformational change. Such actions delay the obligation to reduce emissions into the future, increasing the burden of mitigation for future generations. They also provide examples of “bad” projects, for example monoculture plantations that have not provided the expected economic and social benefits to communities, as arguments against implementing sinks projects under the CDM. Lohmann (2006) provides examples of projects that reinforce this argument – including a CARE project in Guatemala and a FACE Foundation project in Ecuador – where forestry projects have made the local community worse off than before the project. The project developers demanded unpaid labour to fulfill communities’ contractual obligations, traditional land rights were weakened, and communities were not consulted on the projects. While acknowledging that there can be very bad projects and all efforts should be taken to not allow such projects under the CDM, these problems are not the inherent character of forestry projects; as mentioned in Chapter 1, most criticism of LULUCF projects has to do with poor project implementation rather than the projects themselves. Lessons should be taken from these projects, including the need for clear and transparent management and oversight processes, reliable reporting on stakeholder consultations, and monitoring and verification rules. The IPCC Special Report on LULUCF (Watson, et al. 2000) identified a number of risks for LULUCF project activities. These risks affect the permanence of emission reductions, including natural risks (e.g., storms and other adverse weather event, pests, disease, fire and climate change), and human-induced risks (e.g., fire, encroachment, uncertain land tenure or property rights, and changes in the price and opportunity cost of land). The issue of non-permanence of the carbon sequestered through LULUCF projects has been addressed in the CDM through the establishment of two expiring crediting options: temporary CERs (tCERs) and long term CERs (lCERs). Annex I countries can acquire these units to temporarily offset their emissions and thus postpone permanent emission reductions. tCERs expire at the end of the commitment period following the one during which they were issued, while lCERs expire at the end of the project’s crediting period, which can be 20 years (renewable up to two times) or 30 years (without a renewal option). Once these tCERs and lCERs expire, the Annex I country holding them must replace them with new ones or achieve an equivalent amount of emissions reductions elsewhere.

Chapter 2: Options for Fostering the Development Dividend
Development Dividend Phase II 80
The expiring nature of tCERs and lCERs means that LULUCF projects are regarded as less attractive investment options than other types of CDM projects. There are high uncertainties in the market, related both to the buyer’s liability for A/R projects and the uncertain future of the international climate regime. Dutschke et al. (2004) note that the latter uncertainty has greater impact on expiring CERs as the integrity of an A/R project’s CERs remains at risk until the end of the crediting period. As such, most projects will opt for lCERs. The complex A/R modalities and procedures could lead to a specialist’s market niche, and risk mitigation measures may mean that LDCs will be systematically disfavored. The risk and uncertainty, combined with the expiring nature of the credits, has resulted in limited demand for sinks projects and will likely lead to lower prices for A/R CDM project credits (Bird, et al. 2005; Bayon 2005; Locatelli & Pedroni 2004). The European Union Emissions Trading Scheme (EU-ETS), the world's largest carbon market, has so far decided not to allow the trade of carbon credits generated through forestry. As reported at the Seminar on Linking the Kyoto Project-Based Mechanisms with the European Union Emissions Trading Scheme (IISD 2005), the Linking Directive excluded forestry-related projects in order to prevent an excessive amount of Kyoto-originated credits from entering the system. There is divided opinion as to whether the European Commission will choose to include forest projects, with issues of concern including technical problems related to the use of temporary credits from A/R projects under the ETS. Many (e.g., Schlamadinger & Dutschke 2004; Bayon 2005) maintain that the exclusion of forestry credits from the ETS could prevent the broad uptake of such projects by limiting demand, and send a negative signal to developing countries, for many of which these projects are the only way to participate in the CDM. If the European Commission were to approve the inclusion of credits from land-use projects under the CDM and Joint Implementation, these credits would be included beginning with the second period of the EU-ETS, which coincides with the Kyoto Protocol’s first commitment period. The limitation of LULUCF projects to A/R activities in the first commitment period is an issue of concern given the significance of land use based emissions in a number of developing countries. Emissions originating from tropical deforestation rates forecasted for the next three decades could easily undo all of the emissions reductions achieved under the Kyoto Protocol (Carvalho, et al. 2003). Tropical forests are an important part of the climate equation, and conservation, development and climate abatement goals can and should be complementary. Carvalho, et al., argue that the scale of the capacity for climate change mitigation of A/R activities pales in comparison to the potential benefits that might be achieved through initiatives to reduce deforestation. 5.2 Development Dividend Benefits of LULUCF Projects
LULUCF projects, if developed and implemented properly, have the potential to increase the development dividend. Parties to the UNFCCC are guided by the principle that forestry and land-use activities should contribute to biodiversity conservation and the sustainable use of natural resources. They are also requested to abide by commitments under the Convention on Biological Diversity (CBD) and other relevant international environmental agreements related to sustainable forest management and agriculture. Many organizations, including the IUCN (2002) have emphasized the need for LULUCF activities under the Kyoto Protocol, including the CDM, to be environmentally sound and socially equitable. A/R projects have adaptive elements that can positively impact on sustainable development by helping to reduce vulnerability to climate-related disasters and climate change (Dutschke 2005). Deforestation and forest degradation have eliminated forest cover from steep and unstable terrain, setting the stage for calamities that are more frequent and severe. Many countries have recently experienced hurricanes, floods, mudflows and landslides that have set them back years in development terms (Forner & Jotzo 2004). Future projections of climate change suggest that higher temperatures with more droughts, fires, intense tropical storms and precipitation events will occur over the next century. Rebuilding forests and protecting biodiversity increases the ability of ecosystems to adapt to climate change, by stabilizing the landscape and providing a buffer against these threats. By providing social, economic and environmental benefits to land users, A/R projects can help households and communities become more resilient. Properly implemented forest projects can contribute to both climate change mitigation and adaptation. In addition to Carvalho, et al., a number of researchers (e.g., Seroa da Motta & Ferraz 2000; Bass et al., 2000) have determined that the positive effects derived from initiatives to reduce deforestation are stronger than those from A/R projects, though reducing deforestation and degradation are not eligible under the Kyoto Protocol. Taking into

Chapter 2: Options for Fostering the Development Dividend
Development Dividend Phase II 81
consideration the carbon storage capacities of mature tropical forests, the additional environmental benefits of maintaining mature tropical forests (biodiversity, hydrological cycle, soil conservation), and the significance of land use based emissions in a number of developing countries (over 20 percent of global emissions), controlling deforestation has considerable potential for climate mitigation, and it is argued that it should recognized as an abatement activity under the future climate regime, yet inclusion of this activity is not without its difficulties (Forner, et al. 2006; Skutsch, et al. 2006). Considerable interest has been expressed in reducing forest degradation and deforestation, including the proposal to create incentives for reducing forest degradation and deforestation was brought forward by Papua New Guinea and Costa Rica at COP-11/MOP-1 (UNFCCC 2005b). The SBSTA (UNFCCC 2006) is undertaking research in this area, including a workshop on reducing emissions from deforestation in developing countries held in August/September 2006. At this workshop Brazil reviewed their proposal on avoided deforestation, examining a “positive incentive arrangement” that includes financial incentives for developing countries that voluntarily reduce their GHG emissions from deforestation. 5.3 Options for Promoting the Development Dividend for LULUCF Projects
Consensus is beginning to emerge on some previously contentious issues related to sinks. The importance of addressing emissions from tropical deforestation is becoming accepted as a critical piece of the international climate regime, and two ideas have emerged from this initiative – that developing countries should be compensated for the environmental services provided through tropical forests, and that addressing climate change requires involvement of the developing world. Addressing tropical deforestation in the context of the post-2012 reduction targets could mean a group of tropical nations offer Annex I emissions offsets for the second commitment period. This offers the opportunity for Annex 1 countries to set higher targets and tropical nations to reap substantial financial benefits – while creating a benefit to the atmosphere. Increasing the development dividend of CDM LULUCF projects presents an argument for including avoided deforestation in the CDM in the post-2012 regime – but of course, this will be dependent on the outcomes of the discussions related to the work of the SBSTA, the Papua New Guinea and Costa Rica submission, the Brazil proposal and other activities in this area. The decision to include avoided deforestation, either under the CDM or the broader Convention will be influenced by the relationship between deforestation avoidance and development; the reluctance to have targets, the risks of failure and the level of knowledge required to make a reasonable baseline. There will be a need for national baseline development to assist with measurement and verification because avoided deforestation will deal with the net effect on the land carbon stock in the country as a whole. Avoiding deforestation offers significant benefit to developing and developed nations, regardless of how it is promoted under the UNFCCC. Houghton (2005), in a book launched by NGO experts at COP-11/MOP-1 on tropical deforestation and climate change, reports that current GHG emissions from deforestation amount to about 25 percent of the enhanced greenhouse effect estimated to result from all anthropogenic emissions. A case study from Brazil (see Box 2) exhibits clear development dividends providing an example of a program that could benefit from a change in the rules to allow avoided deforestation projects under the CDM. Increasing the development dividend of CDM LULUCF projects might also include expanding the definition to include not only avoided deforestation, but also reducing forest degradation and improved agricultural practices to increase carbon capture in agricultural soils. Activities with the rural poor, such as reducing land degradation, hold particular promise for enhancing the development dividend in LULUCF CDM projects. Efforts need to be taken to ensure development dividends result from CDM A/R projects. While forest conservation is known to be highly beneficial from an ecological point of view, the socio-economic assessment depends on the specific circumstances of the site and surroundings as well as the project design (Vohringer 2004). The benefits of large scale A/R can be even more elusive, as the ecological benefits of the project can be questionable if large scale monoculture plantations are established. Screening, management and monitoring mechanisms can be put in place to ensure that local populations are not “worse” off and receive their share of the benefits.

Chapter 2: Options for Fostering the Development Dividend
Development Dividend Phase II 82
For these reasons small scale A/R projects should be considered more closely, but unfortunately the benefits of these projects have not fully been tested due to the lack of activity. Small scale A/R projects have the potential to create large local development benefits that could range from creating a sustainably managed source of

Chapter 2: Options for Fostering the Development Dividend
Development Dividend Phase II 83
Box 2: Case Study - Avoiding Deforestation in Brazil63
Brazil’s principal contribution toward GHG emission reductions could be through the control and avoidance of deforestation in the Amazon, which releases approximately 200 million tons of CO2 per year (Houghton, et al. 2000; Nepstad, et al. 1999). This amount corresponds to about two-thirds of Brazil’s emissions and more than that emitted nationwide through the burning of fossil fuels. Tremendous development potential exists in Amazonia for activities that focus on the preservation of standing forests - activities that are not supported by the current rules of the CDM.
Avoided deforestation projects could be of great benefit to Brazil, as the proposed Amazon development plans could convert 120,000 and 270,000 km2 of forests in the next 25 to 35 years through expansion of the economic infrastructure, including modernizing the transportation system. This would be in addition to the current deforestation rates of approximately 17,000 km2/yr, representing an increase of 25 to 40 percent (INPE, 2000). The increased deforestation rate could lead to an increase in CO2 emissions in the order of 2.5 to 6 billion tons of carbon in the same 25-35 year period, or an additional 105 to 168 million tones of carbon per year, in addition to the current net releases of 100 to 300 million tons per year.
The forecasted emission increase could be curtailed if these infrastructure projects were implemented in conjunction with development programs such as PROAMBIENTE, which aims to control deforestation and frontier expansion and create sustainable economic alternatives for the population of Amazonia. PROAMBIENTE could become more economically attractive and more prevalent in the region if programs to avoid deforestation were allowed under the emerging climate regime.
PROAMBIENTE is based on a program proposed by the Brazilian State Federations of Rural Workers of Amazonia to reformulate the government’s existing program of agricultural credit. The program will provide credit to farmers who wish to invest in permanent forms of agriculture and forest management, watershed protection, fire prevention, biodiversity conservation, soil recuperation, and forest restoration. Credit provided through PROAMBIENTE will be repaid through demonstrated farm performance in slowing deforestation, recuperating forests and reducing the incidence of fires. The program will create incentives for forest conservation and the adoption of sustainable agriculture practices – to help farmers make the transition from traditional slash and burn practices.
PROAMBIENTE will be comprised of three pools of money: The Agricultural Credit Fund will provide credit to agricultural investments. The Support Fund will provide funding for technical assistance, certification, local organizational activities, and monitoring to help participating farmers meet their performance commitments. The Environmental Fund will compensate participating farmers for their investments in environmental protection, and will be paid directly against the farmer’s loan drawn on the Agricultural Fund, up to a maximum of 40 percent of the loan value. Farmers must be organized as associations to request funds, and associations can be formed even if farmers do not have land titles.
The program will be administered at the level of “PROAMBIENTE Centers” - regional agricultural centers established in each state. Each center will undertake socio-economic appraisals, technical analyses of the production systems, surveys of productive experiences with the potential to provide ecological services, as well as gather information for baselines for carbon-based projects. The Centers will provide training, including methods for monitoring carbon. The integrity of the program will be maintained with the installation of carbon monitoring systems (including satellite imagery to assess avoided deforestation), socio-environmental certification and independent field audits.
The first phase of the project is expected to result in 960,000 tons of avoided CO2 emissions per year, and 150,000 tons of sequestered carbon in agro-forests and recuperated forests. The program has the potential to eventually avoid emissions of up to 3.1 million tons of carbon per year. Other environmental benefits will include lower incidence of fire, lower sedimentation in streams and rivers, increased biodiversity values, protection of regional rainfall patterns and soil recuperation. The socioeconomic benefits are also impressive, with increased employment (including 1000 jobs created at each Centre), higher income, lower incidence of smoke-related illnesses, lower incidence of water-related illness, improved nutrition and strengthening of rural cultural values.
Carbon finance could help to provide the required support for the program, including funding for the regional centers and the environmental and support funds. The PROAMBIENTE program would benefit from a change in the CDM rules and supports the argument for including an expanded role for sinks in the future climate regime.
biofuel or timber to promoting sustainable forest management (not specifically A/R) and agroforesty techniques. One such project is Scolel Té in Mexico. Although not specifically a CDM A/R project because it was started during
63 This case study is based on the background paper developed for the Development Dividend Project, Effectiveness of the Clean Development Mechanism in the Context of Forest Activities in Brazil: A Critical Analysis, by André Cau, Luciano Mattos & Paulo Moutinho.

Chapter 2: Options for Fostering the Development Dividend
Development Dividend Phase II 84
the Activities Implemented Jointly (AIJ) pilot project phase, it shows some of the development benefits that can be achieved through a properly designed small scale A/R project (DTZ Pieda Consulting 2000). The Climate, Community & Biodiversity Project Design Standards (CCB Standards) discussed in Chapter 1 have been developed to evaluate land-based carbon management approaches in project design and evolution, which can help to ensure that benefits accrue to local communities. International organizations also have processes for defining and certifying sustainably-managed forests, such as the Forest Stewardship Council, which has stringent guidelines for meeting environmental and social goals that reflect years of negotiations between environmental, timber, human rights and labor interests (Subak 2002). The Marrakesh Accords provide for a review of the current rules on LULUCF in the CDM in the second commitment period, when these projects are expected to play a significantly greater role in developing countries. In this context, it is likely that many of the rules concerning LULUCF (Schlamadinger et al, 2006), and specifically the cap on LULUCF CERs will also be revisited. As well, it is likely that emission targets of developed countries will also be adjusted if the rules concerning LULUCF are modified (Schlamadinger et al; 2006, Skutsch et al, 2006). Comparing a regime where there is a cap on the demand for LULUCF CERs, as implied by the Marrakesh Accords, to one with a cap on aggregate supply of LULUCF CERs, Forner and Jotzo (2002) conclude that supply caps on sinks under the CDM could lead to overall improved financial outcomes for developing countries, and possibly favour sequestration projects with better impacts on sustainable development. In a competitive international emission offsets market, prices would be higher if supply were restricted or demand was increased due to renegotiated targets, thus, increasing overall revenue flowing to developing countries, and at the same time opening up opportunities to implement higher cost projects. Better environmental and social impacts could be the outcome. Supply restrictions on sink CERs could also help address equity issues in the CDM, through negotiated allocation of sales quota among countries. Annex I net buyers would incur higher total compliance costs, but Forner and Jotzo suggest that this might be an acceptable price to pay to address concerns about LULUCF in the CDM. To stimulate the market for A/R CDM projects, the inclusion of such projects should be encouraged in the EU-ETS. This is the largest cap-and-trade GHG emission reduction scheme, and a decision not to include sinks has negative impacts on this developing market. Research efforts are underway (e.g., Schlamadinger et al. 2005) to address issues of concern and environmentally sound alternatives are available to achieve the integration of expiring credits in the EU-ETS starting in 2008. Schlamadinger & Dutschke (2004a) demonstrate that it is possible to link A/R temporary credits into products that could be traded in the ETS in a simple and credible manner. For example:
“[A]n lCER could be converted into two parallel products: a) an allowance and b) a bond to cover the liability. The allowance could be traded in the ETS as long as the bond is “covered” in one of the following ways: Either, there is a pool of projects from which only a portion (e.g., 70%, depending on the quality of credits etc.) is used to issue credits, and the remainder is used as a self-insurance; or the bond is insured by other means, including for replacement after the crediting period. With this, the conversion of an lCER into an allowance is virtually risk-free. Costs of potential nonpermanence and restitution are internalized into the price of the resultant allowance.”
Other products are under development to mitigate the risk associated with expiring credits, such as insurance and levying a charge on the tCER or lCER when it comes into the system, which goes into a fund that is used to purchase permanent credits in the future. These and the products proposed under the ETS could be used by Annex I governments to mitigate risk associated with expiring credits, providing the necessary assurances to encourage investment in CDM A/R projects. The development dividend can be increased in LULUCF CDM projects by stimulating a market for A/R credits which are generated by project activities that are designed, delivered and monitored with sustainable development at the forefront.
6.0 Fostering CDM Investment in LDCs A review of the UNEP-Risø (2006) project pipeline demonstrates that LDCs have had limited success in attracting CDM projects. The pipeline included 810 CDM projects as of June 20, 2006, which, if approved, could mitigate about 1,036 Mt CO2e by 2012. Of the 48 LDCs that are Party to the UNFCCC, only seven have projects in the

Chapter 2: Options for Fostering the Development Dividend
Development Dividend Phase II 85
pipeline, for a total of ten projects, or 1.2 percent of the total number (see Table 4). These ten projects, if approved, could mitigate 3,905kt CO2e by 2012, or less than one percent of the total expected emission reductions. Seven projects are small scale, and seven are in sectors measuring high on the development dividend scale (biogas, biomass energy, solar, small scale hydro and energy efficiency). While Chapter 1 concluded that the distribution of projects is not that inequitable when regional distribution is deflated by GDP or population, the issue of uneven regional distribution has been raised a number of times at the COPs by African and least developed Parties. Despite a slow start for CDM projects in LDCs, the possibility of increasing development benefits in LDCs encourages the examination of options for fostering appropriate CDM investment. 6.1 Barriers and Challenges to Fostering CDM Investment in LDCs
A number of variables impact on the ability of LDCs to attract CDM projects, including a lack of capacity to host CDM projects; the complexity and high transaction costs associated with CDM projects; a poor investment climate; slow growth in demand for energy as compared with other countries; and lack of information on project opportunities and emissions profiles of industrial sectors. Many LDCs have limited capacity to implement CDM projects. Forty-seven LDCs have ratified the Kyoto Protocol, but only 22 have established DNAs.64 Given the number of development priorities facing LDCs (e.g., poverty alleviation, food security, health and education), it is not surprising that many have not invested resources in establishing the required institutional structures to approve CDM projects. This lack of capacity is reinforced by the complete dearth of DOEs from these countries. Project validation and verification are undertaken by these entities, which are generally large international consultancy firms whose rates are expensive for project developers in LDCs. The requirement (for large scale projects) that the DOE visit the project site adds to the financial burden of developing and implementing CDM projects in LDCs, and can act as a disincentive to local project developers. Many LDCs have suffered from a lack of capacity building to help them become effective players in the CDM market. A large amount of CDM capacity building to date, much of it funded through ODA, has gone to middle-income countries, which are better positioned to capitalize on carbon funding, partly because of their attractive investment environment and their potential for reductions. Michaelowa and Michaelowa (2005) reported that over US$42 million had been spent by developed countries and multilateral institutions on CDM capacity and institution building, yet only a small part had been targeted to initiatives in LDCs with most of these funds focused on large emerging economics. This is partly because many poor countries are very low energy users and reductions are more difficult to identify.
64 There are six DNAs in LDCs in Asia – Bangladesh, Bhutan, Cambodia, Laos, Maldives, Nepal; fifteen in Africa – Benin, Burkina Faso, Democratic Republic of the Congo, Ethiopia, Guinea, Liberia, Madagascar, Malawi, Mali, Niger, Rwanda, Senegal, Tanzania, Uganda, Zambia; and one in the Middle East – Yemen.

Chapter 2: Options for Fostering the Development Dividend
Development Dividend Phase II 86
Table 4: Distribution of CDM Projects in the Pipeline by Level of Development
Level of Development/Country Total
Number % 2012 kCERs % Least Developed Countries 10 1.2% 3905 0.4% Bangladesh 3 0.3% 1952 0.2% Bhutan 1 0.1% 4 0.0% Cambodia 1 0.1% 293 0.0% Lao PDR 1 0.1% 44 0.0% Nepal 2 0.2% 696 0.1% Tanzania 1 0.1% 672 0.1% Uganda 1 0.1% 245 0.0% Other Low Income Countries 350 40.7% 262636 25.4% India 330 38.4% 209512 20.2% Ivory Coast 1 0.1% 5661 0.5% Kyrgyzstan 1 0.1% 513 0.0% Moldova 4 0.5% 766 0.1% Mongolia 1 0.1% 1358 0.1% Nicaragua 3 0.3% 2872 0.3% Nigeria 2 0.2% 25126 2.4% Pakistan 1 0.1% 6900 0.7% Papua New Guinea 1 0.1% 1836 0.2% Tajikistan 1 0.1% 356 0.0% Vietnam 5 0.6% 7736 0.7% Lower Middle Income 280 32.6% 211385 20.4% Armenia 2 0.2% 957 0.1% Bolivia 4 0.5% 2521 0.2% Brazil 160 18.6% 142415 13.7% Colombia 7 0.8% 3395 0.3% Dominican Republic 1 0.1% 627 0.1% Ecuador 10 1.2% 3365 0.3% Egypt 3 0.3% 11392 1.1% El Salvador 5 0.6% 3467 0.3% Guatemala 11 1.3% 5451 0.5% Honduras 19 2.2% 3610 0.3% Indonesia 9 1.0% 10554 1.0% Jamaica 1 0.1% 456 0.0% Peru 7 0.8% 6252 0.6% 1 withdrawn Philippines 22 2.6% 2442 0.2% Sri Lanka 5 0.6% 1025 0.1% Thailand 12 1.4% 9331 0.9% Tunisia 2 0.2% 4125 0.4% Upper Middle Income 201 23.4% 465990 45.0% Argentina 9 1.0% 25961 2.5% Chile 23 2.7% 25857 2.5% China 71 8.3% 336304 32.5% Costa Rica 4 0.5% 1870 0.2% Fiji 1 0.1% 164 0.0% Malaysia 18 2.1% 14177 1.4% 1 withdrawn Mexico 54 6.3% 48597 4.7% Morocco 4 0.5% 1991 0.2% Panama 5 0.6% 824 0.1% South Africa 10 1.2% 8770 0.8% Uruguay 2 0.2% 1475 0.1% Other More Advanced 19 2.2% 91932 8.9% Cyprus 2 0.2% 407 0.0% Israel 4 0.5% 1349 0.1% South Korea 13 1.5% 90176 8.7% World 860 100.0% 1035850 100%
Source: UNEP Risø Centre on Energy, Climate and Sustainable Development, 20 June 2006; OECD-DAC, 2005.

Chapter 2: Options for Fostering the Development Dividend
Development Dividend Phase II 87
The market-based nature of the mechanism makes it difficult to increase the number of CDM projects in LDCs, and it is unlikely that LDCs will attract CDM investment at market shares equivalent to other regions of the world. In reviewing the literature on determinants of inward FDI at the national level, Kumar (1996) concluded that low income, agrarian economies with relatively poor infrastructure have limited scope for attracting FDI inflows, regardless of whether their policies are trade-friendly (e.g., investment incentives, protection of intellectual property rights). As the CDM is a vehicle for FDI, this may help to explain the low levels of CDM investment in LDCs, which have attracted only very modest shares of FDI. Yet, Niederberger and Saner (2005) suggest that the simplistic assumption that CDM financial flows will be correlated closely with FDI flows may not hold and warrants further analysis. They note that countries that have not been successful at attracting FDI, such as India or Latin American nations, have been successful as CDM host countries perhaps because the CDM helps to overcome non-financial barriers. The nature of the opportunities in LDCs, which have relatively low levels of industrial facilities and energy consumption, may limit their ability to attract CDM investment. In the short-term, many investors in Annex I countries are seeking the rapid generation of CERs to meet commitments for 2008-2012 – and LDCs are unlikely to ensure that the necessary institutional prerequisites are met and offer up attractive high-CER generating projects. Projects in the sectors of renewable energy and A/R generally create relatively few emission reductions over a long time period. The uncertainty regarding the post-Kyoto framework can act as a disincentive to CDM investment in the renewables and A/R sectors over the longer-term, as there is no guarantee that CERs will have value post-2012. 6.2 Development Dividend Benefits of Fostering CDM Projects in LDCs
From a development dividend perspective, there are many advantages to encouraging and enabling CDM projects in LDCs. Demand is acute in most LDCs for jobs, foreign currency, industrial development and sustainable livelihoods, and investors can often more easily create a development dividend through the CDM than in many other locations. Applied in an appropriate manner, the CDM can bring a number of sustainable development benefits, including technology transfer, local job creation and local environmental improvements. The special rules for small scale CDM projects mean that investments can also be targeted at small to medium size enterprises (SMEs), which comprise a large segment of the economy in LDCs. Many LDCs offer potential in the sectors of renewable energy and A/R. These sectors generate large development dividend benefits – A/R projects can help to reverse land degradation, alleviate poverty and adapt to climate change; and the increased production and trade of renewable energy can help to ensure energy security and reduce poverty. Investment in LDCs may offer investors an improved corporate profile and reputation as a result of funding projects that bring about lasting community, environmental and economic benefits. From the perspective of developed country governments, many of whom have developed carbon funds, focused investments in the CDM could assist in meeting broader objectives of helping poorer countries address climate change. 6.3 Options for Promoting the Development Dividend in LDCs
A suite of complementary initiatives is required to increase the number of CDM projects with development dividend benefits in LDCs. Capacity building is integral to fostering improvements. The necessary institutional prerequisites, specialized capacity and incentives to facilitate CDM investments and keep transaction costs low, are generally lacking in potential LDC host countries. A number of organizations have been active in LDCs (e.g., World Bank CF Assist, World Bank CDCF, UNEP Risø , UNIDO), working to increase the capacity of governments to approve and monitor CDM projects, and working with governments and the private sector to increase the number of CDM projects. The awareness of the CDM among public and private sectors in LDCs is relatively lower than other countries, and donors can play an important role in LDCs in building capacity and the necessary institutional structures. Capacity building will likely generate the best result in those LDCs that are proactive in attracting CDM investments. Lessons may be learned from CDM front-runners, such as India and China, which have adopted supportive institutional, regulatory and policy frameworks to capture CDM potential; and opportunities for South-South cooperation should be explored. Niederberger and Saner (2005) note that further research is needed to determine how nations that have not traditionally attracted large flows of FDI can attract CDM investment or enhance their ability to export CERs.

Chapter 2: Options for Fostering the Development Dividend
Development Dividend Phase II 88
Research is needed in a number of areas, including the sources of demand; the dynamics of the carbon market; information on the drivers; and financial structure and transaction types of emerging private sector CDM deals. As outlined in the previous chapter, demand for CERs comes from both governments and the private sector, which might have different motivations and preferences.65 An increasing number of OECD country governments are developing and implementing public procurement programmes to purchase Kyoto credits, and how they choose to use these programmes to ensure compliance could affect the regional distribution of CDM transactions. There could be potential for OECD countries to increase CDM investments in LDCs, perhaps agreeing to allocate a percentage of public CDM investments to projects in these countries. Buyer governments have the ability to develop differentiated project portfolios, allowing them to support investments with high development dividends in LDCs, if they desire. Some governments have expressed a willingness to pay a premium for sustainable development on top of the credit price; for example, the Dutch CERUPT tender. Annex I governments could also consider allocating funding toward risk reduction schemes for LDCs, such as investment guarantee facilities and various instruments to manage CER-related risks including delivery risks due to force majeours. The emerging role of the insurance industry and CDM-specific products in investment guarantee agencies should be examined for lessons in this regard. For example, the IFC has recently collaborated with World Bank’s Mulitlateral Investment Guarantee Agency (MIGA) to offer such an instrument. This approach potentially could contribute to increased CDM investment in LDCs as buyers might be more willing to consider countries with higher sovereignty risks if CER delivery is covered by an insurance instruments. For carbon funds administered by international development organizations such as the World Bank, UNDP and ADB, investing for development is part of their organizational mandate. Certain programs have a greater likelihood of increasing investment in LDCs, such as the World Bank’s Community Development Carbon Fund (CDCF) and the UNDP Millennium Development Goal (MDG) Fund. A review of the impacts of these funds on CDM investment in LDCs will be useful over time, particularly in respect to appropriate actions to increase investment in the post-2012 timeframe. Unilateral CDM also offers potential to address the issue of low levels of CDM investment in LDCs. Support for unilateral CDM projects could be provided to assist governments unable to attract buyers at an early stage of the CDM project life cycle. These governments would be able to implement their own CDM projects and then offer the issued CERs to the highest bidder. These CERs would be able seek a premium as risk-free CERs. The high-risk LDCs would be able to gain even more through this approach, as they would be able to sell CERs (issued) at a price considerably higher than what would be offered for a conventional, non-unilateral project. This approach also holds promise for programmatic CDM, where is could assist governments to implement transportation and energy efficiency projects with high development dividend benefits. Donor-funded programs need to consider how to offer special support to this approach in LDCs. Consistent with the conclusions in Chapter 1, it must be recognized that the CDM may not be a suitable investment vehicle for all LDCs. Some countries may best be positioned to promote investment and sustainable development outside of the CDM framework; and Parties may need to concede that trying to facilitate CDM in such countries for the sake of equity is not the most productive use of resources. The window of opportunity for the first commitment period under the Kyoto Protocol (2008-2012) is rapidly closing, and considerable uncertainty exists in regard to the post-2012 framework. Given the priority sectors of renewable energy and A/R in many LDCs, a viable strategy may be to get the CDM “fundamentals” in place and develop LDCs as sources of CERs for the post-2012 regime.
7.0 Options for Fostering the Development Dividend
65 Lecocq and Capoor (2005, p. 21) noted that as of May 2005, private entities represented about two-thirds (69 percent) of total purchases of emission reductions. But they note that it is unclear if this trend will continue as demand from governments is growing rapidly, while it is not clear that private demand is growing as fast.

Chapter 2: Options for Fostering the Development Dividend
Development Dividend Phase II 89
The previous sections have identified a number of options for increasing the ability of the CDM to deliver a development dividend. This section looks at those options that hold promise to foster the development dividend in the short-term, and over the medium and long term in the post-2012 period. As many of the options identified in earlier sections are inter-related (e.g., changes to the additionality assessment could have impacts on small scale projects), the following list could be viewed as a framework for moving forward, with the intent of increasing the quality and quantity of CDM projects in the short-term in a manner that prepares developing countries to participate in the post-2012, whatever shape it may take. In the short term, certainty the market is a key factor in increasing the development dividend in the CDM. Participants in the market have told Point Carbon (2006b) that the lack of clarity on what will happen when the Kyoto Protocol expires is starting to have an impact on the willingness of companies to invest in CDM projects. The dual-track process agreed to at COP/MOP-1 indicates an international commitment to develop and shape the post-2012 climate regime, but the details will remain unknown for the short-term. Track one will consider future commitments under the Kyoto Protocol for the period beyond 2012, and track two, under the UNFCCC (2005), will “analyze strategic approaches for long term cooperative action to address climate change.”
A number of the options put forward to increase the development dividend in CDM projects could contribute to both discussions. Increasing the quality and quantity of CDM projects, and improving CDM opportunities in LDCs could assist in achieving deeper emission reductions on the part of developed countries, while offering ways to increase the voluntary participation of developing countries in projects and programs that meet development goals while addressing climate change.
7.1 Options over the Short-term
In the short-term, options to increase the development dividend should focus on those actions that can increase the number of projects in the pipeline through improvements in the approval process and efforts to ensure programmatic CDM begins quickly. Increasing the ability of the CDM to provide a development dividend can help developing countries meet their development goals while addressing climate change goals, as well as provide an increased supply of CERs to the market to assist developed countries in meeting their targets. Develop Additionality Tools based on Environmental Additionality – While the EB will report at COP/MOP-2 on new methods for assessing additionality, the focus should be on those tools that combine the selection of the baseline scenario and the demonstration of additionality. Ensure Timely Approval and Development of Programmatic CDM Methodologies – Programmatic CDM offers opportunity to increase the amount of CERs on the market for the period 2008-2012. The first methodologies for programmatic CDM have been submitted to the EB, and approvals or rejections of these and other methodologies will lay the groundwork and indicate how the Montreal decision will be interpreted. A timely response with clarity on the decisions is needed to get programs off the ground. Project developers will be watching these first “test cases” closely, looking for direction based on the Methodology Panel and EB decisions. Project developers should develop methodologies for CDM programs of activities to ensure that a wide variety of sectors can benefit in the short term. Analyze the nature of opportunities presented through programmatic CDM – There is a need to determine which sectors offer the greatest potential for programmatic CDM, and indeed, if it offers the much-anticipated boost in the number and size of CDM transportation projects. It is yet to be determined if the recent decision will unfold in a manner to allow the potentially large numbers of CERs from the transportation sector to enter the market, but efforts should be undertaken to identify priority programs in this and other sectors. An examination of the 14 CDM activities with programmatic characteristics could help to identify concrete lessons for potential developers of CDM programs of activities. Redefine Small Scale Projects to Focus on Environmental Impacts – The definition of small scale projects should be reexamined with the intent of basing the definition on environmental impacts (i.e. emissions reductions).

Chapter 2: Options for Fostering the Development Dividend
Development Dividend Phase II 90
This could increase equity between project types and eliminate the current disincentive toward sectors with high development dividends, such as solar. Simplify Approval Procedures for Small Scale Projects – A default screening tool for additionality assessment in small scale projects should be developed. For example, small scale projects scoring high on the development dividend scale would be able to use a simplified additionality test, use simplified information in the baselines and verification would take place less often. Encourage the Development and Approval of Methodologies for Non-Renewable Biomass CDM Projects – There is a need to develop methodologies for combined forest and biomass small scale energy projects. An analysis of the non-renewable biomass issue should be prepared to assist negotiators in their preparations for COP-12/MOP-2, particularly those representatives from LDCs that have a large percentage of their population relying on fuelwood. Encourage the Inclusion of Credits from LULUCF Projects in the EU-ETS – A decision to include credits from LULUCF projects under the EU-ETS would be key for stimulating the market for A/R CDM projects. A positive decision in this regard should be encouraged. The modalities and processes to integrate expiring credits in the ETS offer significant lessons for other Annex I countries, and demonstrate that options exist to effectively incorporate LULUCF projects in GHG trading schemes. Encourage an increase in the number of small scale A/R projects - The benefits of small scale A/R projects have not fully been tested due to the lack of activity, indicating that Annex I countries might be encouraged to support such projects to increase lessons learned, particularly in regard to the development dividend benefits generated by such projects. Encourage Annex 1 government to develop risk reduction schemes for LDCs, such as investment guarantee facilities; and to examine options to provide support for unilateral projects (both in regard to LDCs and for programmatic CDM), with the intent of assisting governments unable to attract buyers at an early stage of the CDM project life cycle. 7.2 Options over the Medium to Long Term
Over the medium to long term efforts to increase the ability of the CDM to deliver development dividend benefits should focus on options that help to prepare developing countries for participation in the post-2012 climate regime, ensuring that countries incorporate climate change considerations in their development goals. Build Capacity to Develop Programmatic Baselines and Additionality Tools – EB approval of methodologies is only a first step. After the initial methodologies have been approved and CDM programs of activities are launched, there will be a need, as noted in the case study from Brazil, for capacity building in a number of non-Annex I countries to develop the data, tools and skills necessary to implement such programs. Over the long term the goal will be to have sectoral CDM programs operational in sectors including transportation, as the CDM is likely to have a limited impact on transportation emissions up to 2012 (Winkelman, 2005; Browne, et al. 2004). The development of in-country technical expertise will also assist countries to participate in sectoral or policy-based elements of a future regime, where international GHG considerations could be integrated into national development plans. Introduce Additionality Assessment using Multi-project Baselines based on Benchmarks or Performance Standards – Additionality assessment using multi-project baselines based on benchmarks or performance standards could be introduced in the cement and aluminum sectors in the medium-term, with the intent of developing standards in other sectors over the longer term. This would help to open up options for developing country participation in the post-2012 regime, and be particularly useful if sectoral or policy-based options are elements of that regime.

Chapter 2: Options for Fostering the Development Dividend
Development Dividend Phase II 91
Develop a Positive List of Small Scale Projects/Sectors that do not Require an Additionality Test – As the learning increases regarding the results and impacts of CDM projects, the additionality test should be eliminated in those sectors of small scale projects that have been shown to deliver a development dividend. The list could be developed through an examination of those projects that used the simplified additionality assessment based on Development Dividend Framework. If there is resistance to waiving additionality for small scale projects, it may be feasible to develop a new project category – micro-projects – where additionality in designated sectors would automatically be assumed. Expand the Definition of CDM LULUCF Projects - The definition could be expended in the second commitment period to include avoided deforestation, reduction of forest degradation and improved agricultural practices. Including avoided deforestation will be dependent on the outcomes of the discussion on the various submissions. The environmental benefits of avoided deforestation, reduction of forest degradation and improved agricultural practices are well-known but mechanisms must be in place to ensure that such projects have environmental integrity, while making positive contributions to developing countries and local communities. Critical case studies outlining the successes and failures of both A/R CDM and avoided deforestation projects are needed to contribute to the debate. Use Public Procurement Programs to Purchase CERs from LDCs - Annex I countries should make a commitment to use a portion of public procurement programs to purchase CERs from LDCs. By supporting those projects that score high on the Development Dividend Framework, Annex I countries can meet emission reduction targets through projects that support climate change mitigation and development goals in host countries. The premium paid for the development dividend benefits on top of the credit price is a small price to pay to proactively engage LDCs in the climate regime. Establish the Fundamentals to Ensure LDCs are sources of CERs in the post-21012 regime – The public procurement of CERs from LDCs will start to increase the involvement of these countries in the CDM. But to ensure the CDM offers a lasting development dividend, capacity building will be required to build up the necessary technical and institutional capacity in a number of LDCs. Complementarities between credit procurement and ODA programs could be pursued, and South-South capacity building projects could be considered over the short and medium-term, whereby the CDM front-runners assist countries in establishing institutional processes and procedures. Efforts will need to be made to ensure that small scale and larger projects are developed to meet the long-term goals of sustainable development and significant emissions reductions, and to ensure that LDCs are active players in the post-2012 CDM market.

Chapter 2: Options for Fostering the Development Dividend
Development Dividend Phase II 92
Bibliography Bass, S., O. Dubois, P. Moura Costa, M. Pinard, R. Tipper and C. Wilson. 2000. Rural livelihood and carbon management. IIED Natural Resources Issues Paper No 1, IIED, London.
Baumert, Kevin A. & Harald Winkler. 2005. “Sustainable Development Policies and Measures and International Climate Agreements”, in Bradley, Rob & Baumert, Kevin A. (eds.), Growing in the Greenshouse: Protecting the Climate by Putting Development First. World Resources Institute Report. pp. 15-23.
Bayon, Ricardo. 2005. Carbon Sinks and Emissions Trading: Room for Optimism? Katoomba Business Group.
Bhardwaj, B., B. Parthan, H.C. de Coninck, N.H. van der Londen, J. Green & J. Mariyappan. 2004. Realizing the Potential of Small scale Projects in India. paper developed by IT Power under the EU-Synergy Programme.
Bird, D. N., M. Dutschke, L. Pedroni, B. Schlamadinger, A. Vallejo. 2005. Should one trade tCERs or lCERs?<http://www.joanneum.at/encofor/publication/Should_one_trade_tCERs_or_lCERs-ENCOFOR_policy_brief.pdf>.
Browne, Jodi, Eduadro Sanhueza, Erin Silsbe, Steve Winkleman and Chris Zegras. 2004. Getting on Track: Finding a Path for Transportation in the CDM Winnipeg: IISD.
Bumpus, Adam. 2006. “What Montreal did for the CDM.” Carbon Finance, issue 24, December 2005/January 2006.
Carvalho, Georgia, Paulo Moutinho, Daniel Nepstad, Luciano Mattos & Márcio Santilli (IPAM). 2003. An Amazon Perspective on the Forest-Climate Connection: Opportunity for Climate Mitigation, Conservation and Development? Woods Hole Research Center and Instituto de Pesquisa Ambiental da Amazônia (IPAM).
Clean Development Mechanism Executive Board. 2006. Annex 1 - Definitions of policy and programme of activities. EB 27 Proposed Agenda – Annotations. UNFCCC.
Clean Development Mechanism Methodology Panel. 2006. Draft methodological tool: “Combined tool to identify the baseline scenario and demonstrate additionality”. Annex 10, Twenty-third Meeting Report. 13 October. UNFCCC.
de Jonge, Lex. 2005. “How to deal with additionality” presentation at IETA side event 29 November 200.5 <http://www.ieta.org/ieta/www/pages/getfile.php?docID=1267>.
Development Assistance Committee. 2005. DAC List of ODA Recipients – Effective from 2006 for reporting on 2005, 2006 and 2007. Paris: OECD. <http://www.oecd.org/document/45/0,2340,en_2649_33721_2093101_1_1_1_1,00.html>.
DTZ Pieda Consulting. 2000. An Evaluation Study of FRP’s Carbon Sequestration Project in Southern Mexico. <http://www.eccm.uk.com/scolelte/documents/DTZ_report.pdf>
Dutschke, Michael. 2005. Forestry and the ultimate objective of the Climate Convention. Hamburg climate+ paper 2/2005. Hamburg: Hamburg Institute of International Economics.
Dutschke, Michael, Bernhard Schlamadinger, Jenny L. P. Wong & Michael Rumberg. 2004. Value and Risks of Expiring Carbon Credits from CDM Afforestation and Reforestation. HWWA Discussion Paper 290. Hamburg: Hamburg Institute of International Economics (HWWA). http://www.hwwa.de/Publikationen/Discussion_Paper/2004/290.pdf
Ecosecurites. 2002. Clean Development Mechanism (CDM): Simplified Modalities and Procedures for Small scale Projects. report developed for Department of International Development, U.K.

Chapter 2: Options for Fostering the Development Dividend
Development Dividend Phase II 93
Executive Board. 2005. “Annex 3: Additional Clarifications Regarding the Treatment of National/sectoral Policies and Circumstances.” Executive Board 22nd Meeting Report. 23-25 November, 2005.
Executive Board. 2003. “Annex I: Further Clarifications on Methodological Issues.” Executive Board 10th Meeting Report. 28-29 July, 2003.
FERN. 2005. ‘Carbon offset’ – no magic solution to ‘neutralise’ fossil fuel emissions. FERN Briefing note. <http://www.fern.org>.
Forner, Claudio & Jotzo, Frank. 2002. “Future restrictions for sinks in the CDM. How about cap on supply?” Climate Policy 2 (4): 335-351.
Forner, Claudio, Jurgen Blaser, Frank Jotzo & Carmenza Robledo. 2006. “Riding a rodeo bull: foreseeing an agreement on reducing emissions from deforestation under the UNFCCC.” Climate Policy (in press).
Friends of the Earth. 2005. Forest Campaign. <http://www.foei.org/forests>.
Government of Canada. 2006. Government of Canada Submission on Additionality to the Executive Board of the clean development mechanism. <http://cdm.unfccc.int/public_inputs/meth_add_tool/cfi/C57D3I09E5RBH298KCW4TPQY507GVQ>.
Green, William. 2006. Carbon Finance for Africa – an investor’s guide. London: Africapractice. <http://www.africapractice.com/uploads/Carbon_Report.pdf>.
Greiner, Sandra. 2004. How to Define small-scale landfill gas projects? Discussion paper of the World Bank Carbon Finance Business Unit.
Houghton, R. A. 2005. “Tropical deforestation as a source of greenhouse gas emissions” in Moutinho, Paulo & Stephan Schwartzman (eds.). Tropical Deforestation and Climate Change. Belem: Amazon Institute for Environmental Research and Washington, D.C.: Environmental Defense Fund. pp. 13-21.
International Energy Agency (IEA), 2004. World Energy Outlook 2004. Paris: IEA.
International Emissions Trading Association (IETA). 2006. IETA Position on Additionality & BaselineSelection. <http://cdm.unfccc.int/public_inputs/meth_add_tool/cfi/5KYTDWCZU0FDZ9RPBL37GBO2PERRJB>.
IETA. 2005a. IETA Position on Additionality. IETA position paper.
IETA. 2005b. Strengthening the CDM: IETA Position Paper for COP11 and COP/MOP 1. IETA position paper.
International Institute for Sustainable Development (IISD). 2005. “Summary of the Seminar on Linking the Kyoto Project-Based Mechanisms with the European Union Emissions Trading Scheme: 15-16 September 2005”. Earth Negotiations Bulletin, 115: 1.
IUCN and United Nations Environment Programme. 2002. Carbon, Forests and People: Towards the integrated management of carbon sequestration, the environment and sustainable livelihoods. IUCN Forest Conservation Programme - Livelihoods and Landscapes Series No.1. Cambridge: IUCN Publications Unit.. http://www.unep.org/themes/climatechange/PDF/Forests_People_Climate.pdf
Kartha, Sivan, Michael Lazarus & Maurice LeFranc. 2005. “Market penetration metrics: tools for additionality assessment?” Carbon Policy 5: 147-165.
Kelly, Cathleen. 2000. Fast Track Mechanisms for Small scale Clean Development Mechanism (CDM) Projects: Viewpoint. Washington D.C.: Centre for Clean Air Policy.

Chapter 2: Options for Fostering the Development Dividend
Development Dividend Phase II 94
Kenny, Alice. 2006. “New Science: Should Carbon Grow on Trees?” The Katoomba Group’s Ecosystem Marketplace. <http://ecosystemmarketplace.com/pages/article.news.php?component_id=4194&component_version_id=6007&language_id=1>.
Kumar, Nagesh. 1996. Foreign direct investments and technology transfers in development: a perspective on recent literature. Institute for New Technologies Discussion Paper 9606. Maastricht: United Nations University. pp. 8-9.
Lecocq, Franck & Karen Kapoor. 2005. State and Trends of the Carbon Market 2005. Washington, D.C.: World Bank and IETA.
Leining, Catherine & Ned Helme. 2000. Implementing the Additionality Requirement and Ensuring the Stringency of Project Baselines under the CDM. Washington, D. C.: Center for Clean Air Policy.
Locatelli, Bruno & Lucio Pedroni. 2004. Will simplified Modalities and Procedures Mark more Small scale Projects Viable under the Clean Development Mechanism? Working Paper, CIRAD France – CATIE Costa Rica.
Lohmann, Larry (ed.) 2006. To Keep the Oil Flowing: A Conversation on Carbon Credits. Draft extract from a forthcoming issue of Development Dialogue. Uppsala: Dag Hammarskjold Foundation and Dorset: The Corner House.
Michaelowa, Axel & Katharina Michaelowa. 2005. “Sustainable Development: the Forgotten Aspect of the CDM?” Joint Implementation Quarterly 11(4): 8. <http://www.jiqweb.org>.
Michaelowa, Axel & M.. Stronzik. 2002. Transaction costs of the Kyoto Mechanisms. HWWA Discussion Paper No. 175, Hamburg.
Murphy, Deborah, Warren Bell, John Drexhage and Deborah Stowell. 2005. Review of Executive Board Decisions on Baseline and Monitoring Methodologies. Unpublished IISD working paper developed for Canada’s CDM & JI Office.
Niederberger, Anne Arquit & Raymond Saner. 2005. “Exploring the relationship between FDI flows and CDM potential”. Transnational Corporations, vol. 14 (1) (April).
OECD. 2001. Fast-tracking small CDM projects: implications for the electricity sector.
Pearson, Tim, Sarah Walker & Sandra Brown. 2005. Sourcebook for Land Use, Land Use Change and Forestry Projects. Winrock International and the BioCarbon Fund.
Pew Center. 2005. International Climate Efforts Beyond 2012: Report of the Climate Dialogue at Pocantico. Washington, D.C.: Pew Center.
Point Carbon. 2006a. “Africa to push for a bigger share of CDM”, CDM & JI Monitor. 10 January. p. 4.
Point Carbon. 2006b. Market looking for further post-2012 clarity. CDM & JI Monitor 7 March. p.5.
Schlamadinger, Bernhard, Benoit Bosquet, Charlotte Streck, Ian Noble, Michael Dutschke and Neil Bird. 2005. “Can the EU emission trading scheme support CDM forestry?” Climate Policy 5(2).
Schlamadinger, Bernard & Michael Dutschke. 2004. “How can Carbon Credits from CDM Afforestation and Reforestation Projects be used by Annex I Countries and Governments. CDM Investment Newsletter Nr. 2/2004.
Schlamadinger, Bernard & Michael Dutschke. 2004a. Linking terrestrial carbon sequestration to the EU ETS (Guest commentary).Carbon Market Europe. Point Carbon, February 27, 2004.
Schlamadinger, Bernhard, N. Bird, S. Brown, J. Canadell, L. Ciccarese, B. Clabbers, M. Dutschke, J. Fiedler, A. Fischlin, P. Fearnside, C. Forner, A. Freibauer, P. Frumhoff, N. Höhne, T. Johns, M. Kirschbaum, A. Labat, G. Marland, A. Michaelowa, L. Montanarella, P. Moutinho, D. Murdiyarso, N. Pena, K. Pingoud, Z. Rakonczay, E.

Chapter 2: Options for Fostering the Development Dividend
Development Dividend Phase II 95
Rametsteiner, J. Rock, M.J. Sanz, U. Schneider, A. Shvidenko, M. Skutsch, P. Smith, Z. Somogyi, E. Trines, M. Ward, Y. Yamagata. 2006. “Options for including LULUCF activities in a post-2012 international climate agreement: Part I – Synopsis of LULUCF under the Kyoto Protocol and Marrakech Accords and criteria for assessing a future agreement”. Environmental Science and Policy, in press.
Schlep, Michael. 2005. “One goal is not enough.” Carbon Finance (September 2005), pp. 14-15.
Seroa da Motta, R., C. Ferraz and C. Young. 2000. “Brazil: CDM opportunities and benefits”, Financing
Sustainable Development with the Clean Development Mechanism, Washington, DC: World Resources
Institute, pp. 18–31.
Skutsch, Margaret. 2004. Reducing Carbon Transaction Costs in Community-based Forest Management. Enschede, Netherlands: University of Twente. <http://www.iapad.org/publications/ppgis/Skutsch.pdf>.
Skutsch, Margaret, Neil Bird, Eveline Trines, Michael Dutschke, Peter Frumhoff, Ben de Jong , Peter van Laake, Omar Masera, and Daniel Murdiyarso. 2006. Clearing the way for reducing emissions from tropical deforestation. Environmental Science and Policy, in press.
Subak, Susan. 2002. “Forest certification eligibility as a screen for CDM sinks projects”. Climate Policy 2: 335–351.
TecMarket Works Framework team, 2004, pp. 133-146.
Trexler, Mark & J. Shipley. 2004. “Back to the Future.” Carbon Finance (September 2004), pp. 12-13.
UNEP Risø Center on Energy, Climate and Sustainable Development. 2006. “CDM Pipeline Overview – 20th June 2006.” CD4CDM. <http://cd4cdm.org/>.
UNEP Risø Center on Energy, Climate and Sustainable Development. 2005. “Using Carbon Finance for Sustainable Energy in Africa: CF-SEA Project”, E+: Energy, Climate and Sustainable Development. November: p.7. <http://uneprisoe.org/E+/November05.pdf>.
UNDP. 2003. “Chapter 4: Simplified Procedures for Small-Scale Projects.” The Clean Development Mechanism: A User’s Guide.
UNFCCC. 2006. Decision 3/CMP.1: Modalities and procedures for a clean development mechanism, as defined in Article 12 of the Kyoto Protocol. COP/MOP-1, Montreal, 28 November to 9 December 2005.
UNFCCC. 2006b. UNFCCC Workshop on Reducing Emissions from Deforestation in Developing Countries. Food and Agriculture Organization of the United Nations (FAO), Rome, Italy, 30 August - 1 September 2006. <http://unfccc.int/methods_and_science/lulucf/items/3764.php>.
UNFCCC. 2005a. Decision -/CMP.1: Further guidance relating to the clean development mechanism. COP/MOP-1, Montreal, 28 November to 9 December 2005.
UNFCCC 2005b. Reducing emissions from deforestation in developing countries: approaches to stimulate action. UNFCCC: FCCC/CP/2005/MISC.1
UNFCCC. 2004. Simplified modalities and procedures for small-scale afforestation and reforestation project activities under the clean development mechanism. Bonn, Technical Paper FCCC/TP/2004/2.
UNFCCC. 2001. Decision 17/CP.7: Modalities and Procedures for a Clean Development Mechanism as Defined in Article 12 of the Kyoto Protocol. Marrakech, 28 October to 9 November.

Chapter 2: Options for Fostering the Development Dividend
Development Dividend Phase II 96
Vohringer, Frank. 2004. Forest Conservation and the Clean Development Mechanism: Lessons from the Costa Rican Protected Areas Project. Mitigation and Adaptation Strategies for Global Change 9: 217–240.
Winkelman, Steve. 2005. Transportation and the Clean Development Mechanism. Washington D.C.: Center for Clean Air Policy.
World Bank. 2006. Comments on the “tool for the demonstration and assessment of additionality” and the “draft baseline scenario selection tool”, including suggestions on a merging of baseline selection and additionality determination. <http://cdm.unfccc.int/public_inputs/meth_add_tool/cfi/WXMCGKGW0KOFR3NDAP2KDNU0SCRIM7.>.
World Bank. 2005. The Importance of Flexible Bundling Rules for Small CDM Projects. Washington, D.C.: World Bank Carbon Finance Unit.
World Resources Institute. 2005. Making Small Projects Competitive in the Clean Development Mechanism: A proposal for discussion to the UNFCCC Parties. <http://www.wri.org/cdm/fast_track.html>.
World Resources Institute. 2004. CAIT – Climate Analysis Indicators Tool. <http://cait.wri.org/>.

Chapter 2: Options for Fostering the Development Dividend
Development Dividend Phase II 97
List of Background Papers Cau, André, Luciano Mattos & Paulo Moutinho. 2006. Effectiveness of the Clean Development Mechanism within the Context of Forest Activities in Brazil: A Critical Analysis.
Figueres, Christiana & Erik Haites. 2006. Programs in the CDM.
Kahn Riberio, Suzana. 2006. Opportunities and Constraints on Possible Options for Transport Sector CDM Projects – Brazilian Case Studies.

Chapter 2: Options for Fostering the Development Dividend
Development Dividend Phase II 98
Annex A: Micro projects in the CDM pipeline Micro-projects are defined, for the purposes of this paper, as CDM projects that are expected to have total emissions of less than 50ktCO2 by 2012.
Title Host
country Type ktCO2/yr2012 ktCO2
1 E7 Bhutan 70 kW micro hydro power project Bhutan Hydro 0.5 4.0
2 El Condor and Punutuma Hydroelectric Project Bolivia Hydro 6 33
3 USINAVERDE: Incineration of urban solid wastes Brazil Biomass energy 4 32
4 Cucaú Bagasse Cogeneration Project Brazil Biomass energy 2.4 43
5 Petrobras Project for Switching Fossil Fuel at Macau_RN Brazil Fossil fuel switch 1 9
6 Cuchildeo Hydroelectric Project Chile Hydro 5 27
7 Biomass thermal energy plant – Ecoenergía S.A., Escuintla Guatemala Biomass energy 6 38
8 Cececapa run of river Hydroelectric Project Honduras Hydro 1.9 13
9 Yojoa Small run of river Hydropower Project Honduras Hydro 1.1 7.8
10 Zacapa run of river Mini Hydro Station Project Honduras Hydro 0.9 7.2
11 Solar steam for cooking and other applications India Solar 0.6 4
12 Energy efficiency projects - Steam system upgradation at the manufacturing unit of Birla Tyres
India EE industry 5 30
13 Demand-side energy efficiency programme in the ‘Humidification Towers’ of Jaya Shree Textiles
India EE industry 3.0 37
14 Capacity enhancement for export of surplus power to grid at Lakshmipuram, Andhra Pradesh, India.
India Biomass energy 3 22
15 Energy efficiency measures in a Portland Cement plant India EE industry 3.5 34
16 Energy efficiency measures at thermal power generating station of CESC at Budge Budge
India EE industry 5 50
17 Efficient utilization of waste heat and natural gas at the Dahej complex of GACL
India EE industry 5 46
18 Installation of Additional Urea Trays in Urea Reactors India EE industry 3 22
19 NG Preheating through E 204 coil India EE industry 3 21
20 Replacement of BFW pump turbine by Electric Motor India EE industry 3 30
21 Energy efficiency measures at paper production plant at APPM in Andhra Pradesh
India EE industry 4 44
22 Energy efficiency measures in a sugar plant by GMR Industries Ltd (GIDL)
India EE industry 5 31
23 Zero hydrocarbon (HC) emissions from Glycol Dehydrating Unit (GDU) at Hazira Gas Processing Complex (HGPC) of ONGC
India EE industry 2 12
24 Improvement in energy consumption in a Hotel India EE service 3.0 21
25 Switching of fossil fuel from HSD to Natural gas in a 5 MW gas turbine at Samtel Color Ltd at Ghaziabad, Uttar Pradesh
India Fossil fuel switch 6.0 49
26 Switching of fossil fuel from HSD to Natural gas replacing Diesel engines (1.6MWe*2) with Gas engines (1.5 MWe*2) at Samcor Glass Ltd at Kota, Rajasthan
India Fossil fuel switch 1.5 13
27 Lower Manair Mini Hydel Scheme at Kakatiya India Hydro 7 47 28 1.00 MW Janapadu grid-connected SHP in Andhra Pradesh India Hydro 2 14
29 2.4 MW Small Hydro Project of m/e Kallam Spinning Mills Limited in Andhra Pradesh, India.
India Hydro 4 44

Chapter 2: Options for Fostering the Development Dividend
Development Dividend Phase II 99
30 Generation of electricity from 1.2 MW capacity wind mills by Sun-n-Sand Hotels Pvt. Ltd at Satara, Maharashtra
India Wind 2 25
31 Generation of electricity from 2.5 MW capacity wind mills by Gujarat JHM Hotels Ltd. Ltd at Soda Mada, Rajasthan
India Wind 3 32
32 2.76 MW Grid Connected Renewable Energy Project in Rajastahn by Kalani Industries
India Wind 5 48
33 CDM Solar Cooker Project Aceh 1 Indonesia Solar 3.5 25
34 Bio-Diesel Fuel Production Project Indonesia Biomass energy 5.5 31
35 Energy efficiency improvement project at a beer brewery Lao PDR EE industry 7 44
36 Factory energy-efficiency improvement project Malaysia EE industry 2 13 37 Factory energy-efficiency improvement project (MTPDM) Malaysia EE industry 7 47
38 Factory energy-efficiency improvement project in Malaysia Malaysia EE industry 7 50 39 Lazaro Energy Efficiency Project Mexico EE industry 6 43
40 AWMS Methane Recovery Project MX06-S-23, Guanajuato Mexico Agriculture 3 16
41 AWMS Methane Recovery Project MX06-S-28, Coahuila, Mexico Agriculture 8 47
42 AWMS Methane Recovery Project MX06-S-24, Guanajuato Mexico Agriculture 4 27
43 A joint venture project of cogeneration of el. and hot water using biogas fom wastewater, Conservas la Costeña
Mexico Biogas 4.6 36
44 D&C Farm Corporation Methane Recovery and Electricity Generation
Philippines Agriculture 1.5 11
45 Everlastin & Sentra Farm Corporation Methane Recovery and Electricity Generation
Philippines Agriculture 4.1 31
46 Gold Farm Corporation Methane Recovery and Electricity Generation
Philippines Agriculture 3.3 24
47 Goldi Lion Farm Corporation Methane Recovery and Electricity Generation
Philippines Agriculture 3.3 24
48 Red Dragon Farm Corporation Methane Recovery and Electricity Generation
Philippines Agriculture 1.5 11
49 Unirich Farm Corporation Methane Recovery and Electricity Generation
Philippines Agriculture 3.3 24
50 Bondoc Reality Methane Recovery Philippines Agriculture 3.5 25
51 Gaya Lim Methane Recovery Philippines Agriculture 3.3 24
52 Jhon & Jhon Methane Recovery Philippines Agriculture 1.4 10
53 Joliza Methane Recovery Philippines Agriculture 3.9 28
54 Lanatan Methane Recovery Philippines Agriculture 3.8 27
55 Red Dragon (II) Methane Recovery+A36 Philippines Agriculture 3.0 21
56 Rocky Farm Methane Recovery Philippines Agriculture 3.4 25
57 Santo Domingo Methane Recovery Philippines Agriculture 3.0 22
58 Superior Methane Recovery Philippines Agriculture 2.2 16
59 Kuyasa low-cost urban housing energy upgrade project South Africa EE households 7 48
60 Yangyang Renewable Energy Project South Korea Hydro 4 22
61 1 MW Donghae PV(photovoltaic) Power Plant South Korea Solar 0.7 4
62 Yangyang Renewable Energy Project South Korea Wind 6 34
63 Song Muc Hydro Power Station Regeneration Project Vietnam Hydro 4 23
TOTAL 232 1726
Source: UNEP Risø Center on Energy, Climate and Sustainable Development. 2006. “CDM Pipeline Overview – 20th June 2006.” CD4CDM. <http://cd4cdm.org/.

Chapter 2: Options for Fostering the Development Dividend
Chapter 3: Financing the Development Dividend John Balint

Chapter 3: Financing the Development Dividend
101
1.0 Introduction The objective of this chapter is to explore ways to increase available financing for CDM projects that yield a development dividend. In addition, this chapter considers how such financing for CDM projects can be used to encourage project stakeholders to include and/or enhance the development dividend.66 The chapter focuses on the challenges facing project proponents that are seeking equity and/or debt to finance the construction of small scale projects. This type of financing is pursued in small scale projects in the biomass energy, hydro, wind, solar and landfill gas sectors. The financing issues and potential solutions discussed in this chapter are relevant to local developers of small scale projects with high development dividends. The case studies (two in Kenya and two in South Africa, included in Annexes A to D) discussed in this chapter indicate that the project proponents have difficulty obtaining the necessary financing to build and operate these projects, despite the expectation that the case study projects will be approved by the EB (one of the four projects has already been approved). The experiences described in the case studies also indicate that local developers may be more attuned to ensuring that projects deliver development benefits, consistent with the argument in chapter 1 that small scale projects have greater tendencies to generate higher development dividends. Sections 2 and 3 set the context for the ensuing discussion by describing the market for carbon credits and potential financial support mechanisms for CDM projects. Section 4 describes the financing challenge faced by developers of small CDM projects with high development dividends by looking at risk factors in CDM projects and providing examples from the case studies. Section 5 examines the financing gap from both the supply side (the sources of financing) and the demand side (project proponents), and Section 6 identifies possible actions to help bridge the financing gap between demand and supply.
2.0 The Market for Carbon Credits SouthSouthNorth (2006: 10-11) divides the market for carbon credits into three categories for consistency of referencing: credits for the Kyoto compliance market, voluntary market credits and credits for use in the offset market. Carbon credits are normally paid for when the certified carbon credit is delivered to the buyers during the operation of the project. It is rare to find buyers willing to pay for carbon credits before delivery, during the construction period of the project. Compliance Markets - Kyoto compliance credits are Certified Emission Reductions (CERs) from CDM projects, Emission Reduction Units (ERUs) from Joint Implementation projects and Assigned Amount Units (AAUs) from International Emissions Trading. In compliance markets, buyers purchase carbon credits to meet a mandatory, legally imposed emission reduction target as an alternative to achieving reductions in-house or in-country. Various financial intermediaries have emerged in these markets: brokers who facilitate trades; funds developed by several buyers who are short of credits and invest money in a fund which sources emission reduction credits on their behalf and reduces risk through a portfolio approach in combination with larger overall volumes; and financial investors and speculators who buy credits intending to resell them for a profit at a later stage. Voluntary Carbon Markets - Voluntary carbon markets are based on voluntary efforts to reduce emissions; and voluntary market credits are those used in non-Kyoto emissions trading schemes, such as the Chicago Climate Exchange or the New South Wales scheme. Credits in voluntary markets are called Verified Emission Reductions
66 Financing could include equity, debt or other financial instruments which enhance the project’s financing structure such as guarantees, grants and insurance. Project stakeholders are broadly defined to include the project proponents, its developers, investors, local governments, local communities and the suppliers and buyers of product(s), including carbon credits.

Chapter 3: Financing the Development Dividend
102
(VERs), and they undergo a third-party check during validation and/or verification to increase their credibility. The voluntary carbon market is largely driven by the threat of governmental regulation and compliance targets in non-Kyoto countries. For example, in anticipation of mandatory targets, companies in the United States are learning how carbon markets work by trading through voluntary schemes. These markets follow a similar pattern to compliance markets, but the framework for transactions and criteria for projects are completely defined by an individual scheme or buyer. Retail Offsets Markets - Offset credits can be either Kyoto compliant or voluntary credits which are used specifically by purchasers to attain carbon neutrality. In the retail offset market, secondary trades are rare unless carried out by a project aggregator/retailer/broker to end-users of the credits. Credits sold to end users are removed from the market by retiring, which means that the credits are cancelled and can never be used again. Retail offset purchasers are typically corporations, event holders or individuals aspiring to become carbon neutral. These markets aim at offsetting/compensating emissions from activities through investments in emission reduction efforts elsewhere. In the retail offset market, credits are mostly purchased for corporate image purposes or out of genuine concern for climate change. Given their end-use, purchasers of these credits tend to prefer projects which have demonstrable sustainable development benefits. They also tend to buy smaller volumes than those purchased for the voluntary or compliance markets, and therefore represent a good market for smaller projects which have high development dividends. The projects in the case studies generate a relatively small volume of carbon credits, which makes them less likely to attract the interest of carbon credit buyers, particularly buyers from the compliance market. In addition, the transaction costs associated with developing CDM projects is high relative to the overall construction costs of the projects.
3.0 Financial Support Mechanisms There are a number of financing sources, described below, that could be considered as potential sources of support for viable CDM projects with significant development dividends. While in some cases an Annex 1 country or a company has provided debt financing or taken equity in a CDM project, most CDM projects have involved the sale of CERs separate from the underlying project (Baker and MacKenzie, 2004). That is, the CERs generated by the project are sold under a discrete contract. The financing for a CDM project can be structured in a number of ways, with the nature of the project, the number of participants and the role of the CERs in overall financing taken into consideration. The sustainable development aspects of CDM projects have not generally been a factor in decisions to support these projects (although there are notable exceptions, such as the Kuyasa Project in South Africa discussed in Annex A.). Some CDM projects with high development dividends may be funded entirely by the project proponents. For example, an industrial energy efficiency project may be financed with internally generated funds, borrowed funds based on the firm’s access to lines of credit, or funds raised based on the acceptable credit rating of the firm’s balance sheet. In three of the four case studies and other CDM projects having high development dividends, the financing structure for the cost of constructing the proposed project will most likely rely on both equity and debt sources of financing. The following section briefly reviews the potential sources of financing for the construction of the project, as well as potential sources for the purchase of carbon credits generated by the successful operation of the project. International financial institutions (IFIs) include the World Bank, International Financial Corporation (IFC), and regional development banks. These institutions have a strong presence in CDM host countries, and undertake research and country analysis. They can be a political risk mitigant in a project and their endorsement may attract other investors to the project. The IFI carbon funds are market leaders in CDM projects, provide capacity building for CDM project development (e.g., for governments establishing DNAs, the private sector and potential investors),

Chapter 3: Financing the Development Dividend
103
and provide grant financing to assist with CDM project development costs. The IFIs have been criticized for a lack of understanding of local priorities and issues, acting on behalf of investors rather than project developers and negotiating contracts where the balance of power remains with buyer. Considerable support to the CDM is offered through the World Bank’s Prototype Carbon Fund, which supports project-based greenhouse gas emission reductions while promoting sustainable development. The PCF includes a number of carbon funds supported by national governments (Denmark, Italy, Netherlands, Italy and Spain), as well as the Umbrella Carbon Facility which is an aggregating facility to pool funds from existing IBRD-managed carbon funds and other participants for the purchase of emission reductions from large projects (e.g., the first tranche supports HFC-23 projects in China). Specialized funds include the BioCarbon Fund that demonstrates projects that sequester or conserve carbon in forest and agro-ecosystems, and the Community Development Carbon Fund (CDCF) that supports projects that combine community development attributes with emission reductions to create "development plus carbon" credits. The Carbon Finance Unit of the IFC assists project sponsors in emerging markets to access the market for carbon credits. The Unit also works with buyers of emission reductions, including an arrangement with the Netherlands Carbon Facility, under which two emissions reduction purchase agreements (ERPAs) in India and Argentina worth more than $6 million each have been negotiated.
The Asian Development Bank’s CDM Facility assists member countries in sourcing funds for emissions reductions and processing the CDM requirements for identified projects.
The UNDP (which is not an IFI, but a multilateral development organization) has established the MDG Carbon Facility to mobilize carbon finance and direct it towards a portfolio of projects that yield tangible sustainable development and poverty reduction benefits across a diverse group of developing countries, including the least developed countries. The facility will purchase both CERs and VERs
National Carbon Funds have been set up in by a number of European governments (IETA 2006). These funds are similar to those offered by the IFIs, although public sector funds may have a broader purchasing mandate (than just compliance) and can include sustainable development criteria in their tenders. For example, the Finnish tender targeted small scale renewable energy projects in Africa, Latin America and India. The Belgium tender offers up-front payment for up to 50 percent of the project costs and seeks a broad portfolio of projects (e.g., in LDCs, small scale, renewable energy, energy efficiency). The tender of the Flemish government focuses on renewable energy and energy efficiency projects. Private Carbon Funds have been set up to purchase CERs, VERs, AAUs, and Renewable Energy Certifications (RECs). Some may invest equity or quasi-equity in GHG reduction projects. Examples include the European Carbon Fund, ICECAP, Japan Carbon Fund Finance Ltd., KfW Carbon Fund and the GG-CAP Greenhouse Gas Credit Aggregation Pool (IETA 2006). These funds are less risk tolerant than those of the IFIs and most of the national funds. This is a reflection of their private sector approach and the likelihood that they will prioritize high volume, low cost credits. There is usually little incentive to prioritize sustainable development benefits (indeed, the fund managers might argue that CDM projects have been approved by host countries on the basis of their sustainable development benefits), and these funds do not transfer financing capacity to project developers. Export Credit Agencies (ECAs) offer loans, guarantees and credit insurance; with a few offering equity financing. ECAs offer expertise in CDM host countries and have significant capacity to assess the political and commercial risks associated with projects in these countries. These agencies are generally more risk-tolerant than other sources of funding and have the required capacity to operate in host countries. They emphasize export benefits, not sustainable development benefits, and their consensus guidelines limit term and rate flexibility. In regard to CDM projects, concern has been expressed that ECAs may replace local technologies with imports and limit employment creation for the host country. Many would argue that ECAs do not have the host country interests at heart, and their

Chapter 3: Financing the Development Dividend
104
mandates do not include transferring financing capacity to local players. ECAs do not purchase carbon credits since these are not exports of goods and services from their respective countries. International Equity Providers, such as LaGuardia type equity funds, may have some interest in CDM projects. The opportunities provided by these finance providers are limited for CDM project developers as most will require a high return on investment (ROI) given the higher risk profile of CDM projects. As well, international equity providers have demonstrated a limited understanding of climate change and sustainable development projects, and have not developed the required capacity to enter CDM markets. Local Equity Providers have the same criteria as international equity providers, but may be more tolerant of a less than favourable investment climate. The local equity providers are better able to leverage unconventional local financing partners in response to projects with development dividends. Venture Capital and Start Up or “seed money” providers are usually more risk tolerant but seek high yields for taking early stage, pre-construction risk and may seek to exit the project at an early stage, either during or shortly after project completion. This type of investor tends to specialize in certain sectors including, for example, renewable energy projects. International Banks offer loans, guarantees and investment advice for CDM project developers. International banks have demonstrated a limited understanding of or interest in CDM projects, but this is changing due to greater understanding of climate change impacts on economies and credit, as well as initiatives such as the Equator Principles which encourage social and environmental financing.67 These banks have not yet factored carbon credits into financing decisions and have limited available capacity for CDM projects (often due to a lack of experience in and understanding of host countries), yet awareness of opportunities is present. The risk mitigation aspects of development dividends in well constructed CDM projects could be beneficial in seeking finance from these sources. Local Development Banks offer loans, guarantees and advisory services. These banks may be more tolerant of less than favourable country risks, and they are able to consider projects in the light of the infrastructure and development needs of host countries. These banks are particularly well-positioned to tap into and leverage government and other sources of local financing for the underlying project. Local Commercial Banks offer loans and guarantees. These banks have limited ability to finance CDM projects because of their low risk tolerance, limited capacity with regard to CDM projects and a lack of appreciation of non-monetary gains (i.e., risk reduction, corporate social responsibility (CSR)) presented through projects with high development dividends. Compliance Market Buyers generally favour high volume, low cost purchases of CERs. They may offer spot purchases or forward sales, but generally provide payment on delivery according to a pre-agreed Emission Reduction Purchase Agreement (ERPA). These purchasers seek low delivery risk and usually undertake transactions through brokers. These purchasers tend to be countries or large carbon emitters looking to offset their emissions, and despite an interest in the CERs, they generally have little interest in the sustainable development characteristics of CDM projects. These and other buyers bring foreign revenue to projects during the operation phase but to date have not paid for the carbon credits during the project construction or prior to delivery. Non-Compliance Markets Buyers are more likely than other buyers to purchase VERs up front and pay a premium for development dividends. Currently this is the only market which recognizes the value of sustainable development characteristics in monetary terms; but VER buyers are not easily identified, and the market is immature,
67 The Equator Principles are a financial industry benchmark for determining, assessing and managing social and environmental risk in project financing. More information can be accessed at: http://www.equator-principles.com/principles.shtml.

Chapter 3: Financing the Development Dividend
105
not transparent and not centrally organized. The Gold Standard and other credible processes for determining sustainable development benefits and project priorities can assist in the decision to purchase. Private Credit Insurers Offering Carbon Credit cover climate change non-delivery specified commercial risks and political risks. But these insurers have limited capacity in the CDM market, and because they are offering an unrated investment grade, charge a higher premium for a higher risk category of project.
Equipment Suppliers can offer CDM project developers equity or debt financing to secure the sale of equipment, particularly in the case of large companies. This type of financing is limited for small CDM projects and for CDM activities that involve innovative and new technologies that are not supplied through traditional large companies. Official Development Assistance (ODA) may be a form a grant support for front-end CDM project development costs, but its use must be carefully assessed as the provision of grant finance by Annex 1 countries is limited by the Marrakesh Accords’ prohibition on any diversion of ODA resulting in CDM finance. The financing support mechanisms discussed above demonstrate three key themes. First, traditional financing is not driven or influenced by sustainable development benefits. Many projects with high sustainable development benefits produce small amounts of carbon credits and thus may be less attractive to potential financiers, as banks, equity providers and insurers prefer large scale projects where transaction costs can be absorbed more easily. ECAs focus on immediate “export” benefits and are seldom concerned with generating sustainable development benefits. The second theme is that the expectation of traditional or existing financing in terms of adequate reward for risk taken in a development dividend project is not balanced. For example, equity investors seek a higher return on investment than most development dividend project economics can reasonably support. As well, debt providers seek to minimize the length of risk exposure and to maximize lending interest rate and security, whereas development dividend projects usually require softer terms and a more flexible tolerance for risk and loan structure. A third theme is that traditional sources of financing have scarce technical and resource capacity to handle “one off” or more complex development dividend projects. 4.0 Understanding the Finance Challenge Project proponents usually seek financing from a wide variety of potential sources, a number of which are described in the previous section. Each phase of the project – development, construction and operating – presents a different risk profile to the project developers, equity investors, and debt and insurance providers, as well as to other stakeholders such as equipment suppliers (e.g., suppliers of new renewable energy and energy efficiency technology) and the purchasers of the project’s “products” including the buyers of carbon credits. The potential suppliers of finance for a project will seek a balance between risk taken and reward received. Start up or venture capital equity investors who fund the early stages of a project will expect a higher return on investment than those with equity invested in the project’s operating phase. Debt providers look to minimize risk exposure by seeking acceptable security and limiting the exposure period. In doing so, they consider the credit and reputation risk of the project developer and equity providers. Reward for risk taken is not limited to acceptable equity returns, insurance premiums and interest rates. Certain types of financing will look for additional “reward” for risk taken which is often contingent on the sources of financing. For example, ECAs will look for increased exports from their country to the project. Jackson (2003), Policy Analyst of the Development Bank of South Africa, summarizes what potential sources of financing are looking for: “in a nutshell, private sector investors and development finance institutions (DFIs) -- or ‘bankers’ for short -- seek the following: good returns, reliable returns, risk-adjusted returns and socially responsible investments. Each category of investor might give different weights to each of the above, but all need to be present in one form or another.”

Chapter 3: Financing the Development Dividend
106
4.1 Risk factors in CDM Projects A number of risk factors can impact on the “bankability” of a CDM project by influencing the amount, terms and risk mitigating requirements of potential sources of financing. Most of these risk factors are regularly considered in assessments of project financing, while some are unique to CDM projects, such as the risk of using carbon credits as a source of financing and the risk that the project may not be approved by the CDM Executive Board. Generally, developing countries will be considered to present a higher host country/investment climate risk than developed countries. The less developed the legal, regulatory and institutional frameworks, the greater the perception of risk to investors. Political risks are a reflection of the likelihood of political upheaval (e.g., strikes, civil unrest, terrorism); the confiscation or nationalization of project assets; and the inability to transfer currency or convert investment proceeds. Levels of corruption and crime impact on investment climate risk, and the host country’s investment policy will impact on competitiveness. Economic risks are associated with the financial regime, including the country’s experience with foreign direct investment, the costs of financing and tax rates. Potential investors also consider project risk factors, such as cost overruns, project under-performance and events beyond the control of the parties that may impact the ability of the project to operate (e.g., natural disasters). Factors considered include the size and cost of the project, and if the developers and key counterparts are creditworthy and reputable. Investors also consider the technology used by the project – Is it proven? Is it produced locally or sourced from abroad? The level of infrastructure (roads, water, power) in the project area will be assessed, as will the risks associated with construction (permits, materials, labour) and operation (permits, labour, operations and maintenance, raw materials, product buyers). The level of local government and/or community commitment and support (or likelihood of opposition) is also a key risk factor. Finally, if the project’s viability depends on sales revenues, the dependability of those revenues is considered, ideally in the context of a sound business plan. From the perspective of investors, CDM projects include a number of additional CDM risks. While an additional revenue stream is introduced to the project, there are additional transaction costs associated with the development and approval of CDM projects (e.g., development of Project Design Document (PDD), EB registration costs, possible Designated National Authority (DNA) fees for host country approval). There are also CER delivery risks (e.g., the GHG emission reductions are not properly monitored and verified, or the project does perform as expected resulting in non-delivery of CERs and non-payment), which can impact on an investor’s decision to include payment for carbon credits up front or on delivery. The ownership of emission reductions can also be a risk, especially if there are a number of stakeholders involved in a CDM project. Community or NGO opposition to a CDM project, often mounted because the project is not seen to generate sustainable development benefits, could delay project implementation and impact on the generation of CERs. There are also CER market risks which impact the price of CERs (e.g., the prospects for CDM post-2012, status of Emissions Trading Schemes). The use of Official Development Assistance (ODA) can also be a risk to a CDM project. The more traditional providers of project equity, debt and insurance are not aware of, or willing to factor into their decision, the potential risk mitigating effects of sustainable development benefits, which include possible strong local government support, reduced likelihood of community or NGO protest, and increased likelihood of CDM project approval by the DNA. As a result, CDM projects with high development dividends often experience financing gaps that derive from the process of defining the risk/reward balance, assessing these risks and rewards, and valuing the risk factored rewards in terms of enhanced ROI to investors or security to lenders. Large, reputable and creditworthy developers of a good project are usually better able to secure financing than locally based small and medium sized project developers of CDM projects with high development dividend benefits. A lack of training and experience on the part of the small and medium-sized project developer—who, in the case of many development-dividend-rich projects is not a businessperson, but a development practitioner—may be exacerbated by a lack of access to reasonably priced guidance and advice. This affects the developer’s ability to identify and approach appropriate sources of financing (equity, debt and guarantees) that have experience with sustainable development projects and possibly are more risk tolerant. This lack of expertise can also negatively impact on the

Chapter 3: Financing the Development Dividend
107
developer’s ability to identify and secure markets for the project’s products, including carbon credits. Small and medium-sized developers of CDM projects often lack the expertise to appropriately structure and present the CDM project to both attract appropriate sources of financing and address requirements for CDM registration. Project proponents must understand what investors and lenders are looking for in a “bankable” project to successfully raise capital for CDM projects having development dividend benefits. In other words, project proponents must know how to think like a banker, investor or buyer of carbon credits when they begin to develop the project. Each of the potential sources of financing will undergo its own due diligence of the project, identifying risks and the ways to reduce or mitigate these risks to an acceptable level, each according to their own set of criteria. Understanding the risk criteria used by financing sources can assist a project developer in preparing a successful business case. 4.2 Risk Factors in the Case Studies
Annexes A to D provide case studies that illustrate the risk factors described above and demonstrate financing challenges in CDM projects with high development dividends. Annex E summarizes the financing issues in the case study projects in the three risk categories described above. The four case studies include one existing and three potential CDM projects that are seeking financing and are located in Africa (two in Kenya and two in South Africa). All of these projects would score high in the Development Dividend Framework in chapter 1. For example, the Kuyasa Energy Upgrade Project in South Africa that was registered with the CDM Executive Board in August 2005 scored 48 in the Development Dividend Framework and ranked 9th of 215 projects evaluated in the Framework. This project is both the first African and first Gold Standard project to be registered.68 Host country/investment climate risk has a greater impact on CDM projects in Kenya than South Africa, the latter of which is considered to have a favourable investment climate. This is partially based on well-developed financial institutions and capital markets, liberal regulations on repatriation of profits and other earnings, excellent transportation and communication links and strong macroeconomic polices. Kenya has a less than favourable investment climate with economic performance during the past two decades far below its potential. Levels of poverty have risen over the past fifteen years and there have been decreasing levels of foreign and domestic investment. The poor investment climate is demonstrated by the inability of the Poverty Eradication Council of the Kenyan Government to provide an agreed-to loan to the Jatropha-Vanilla Project to help establish a revolving fund to assist farmers in purchasing seedlings. In regard to project risks, there are risks associated with project equipment supply credit and delivery. The use of local suppliers for manufacturing and delivering equipment used in a project may add significant development dividends in the form of technology transfer, development of local labour skills and new technology expertise, and economic benefits. However, investors and lenders may not be willing to accept the risk of project delays because of potential failure of key suppliers to deliver the equipment needed either because of credit failure or inability to manufacture and deliver as planned. The Kuyasa Low Cost Housing Energy Upgrade project is an example of this situation. Local employment is increased by having the solar water heaters (SWH) manufactured locally by small suppliers, but these manufacturers may not be sufficiently creditworthy to expand to take on the demands of the project. The contract for supply of SWH represents the largest ever in South Africa’s history and will be awarded to between one and five of the country’s SWH suppliers, who will need to scale up significantly. Suppliers of financing will need to be satisfied with these small scale manufacturers and feel confident that they have the financial capability to expand and deliver equipment in accordance with the supply contract—a tougher prospect than would have prevailed if a large
68 As described in Chapter 1, the Gold Standard is a premium label awarded to ‘best practice’ CDM projects in terms of sustainable development contribution and emissions reduction. Source: SouthSouthNorth - Kuyasa Case Study Brief.

Chapter 3: Financing the Development Dividend
108
international supplier had been contracted. Project proponents, on the other hand, acknowledge that the project becomes more risky through working with low income manufacturers; yet they may not be willing to compromise a sustainable development benefit for the sake of making the project more bankable. Equipment and labour supply technical risks are also present in these projects. To attract funding, project proponents must establish that the equipment used in a project’s operation will be manufactured, installed, operated and maintained as envisaged in the project plan. Technical self reliance as a development dividend in the Kuyasa project may present unacceptable risks to ‘bankers’ if the manufacturers cannot produce SWH equipment at an acceptable standard of reliability and efficiency, and install and maintain the equipment. In some cases the requirement for skilled labour may be less relevant but it is a question on the checklist of most suppliers of financing. The reliance on larger, perhaps foreign suppliers of SWHs for the initial phase could compromise the development dividend; yet suppliers of financing may feel this will make the technical risks of the project more acceptable. However, imported technology can be more costly and involve an additional tax expense. As well, imported technology may make the project unacceptable to the Cape Town city council, the project proponents and owners, who have very strict tender requirements including the use of local labour and technologies where possible. There may also be an outcry from the local manufacturers as the project is driven by the public sector. The Solar Technology Electricity Provision (STEP) project faces similar risks as installation and maintenance of the solar photovoltaic systems will be undertaken by local technicians who will have to be trained to undertake the tasks. The reliance on low income purchasers of products in this project and the Jatropha-Vanilla project must also be addressed to satisfaction of lenders. The significant role played by poorer, small farmers may affect feedstock supply, and adds significant risk in the eyes of most financiers. Project infrastructure risks were also notable in the two Kenyan projects. Roads for transporting feedstock and products are poor in the regions where the Jatropha-Vanilla Project is located. The STEP Project will cover a large rural area where roads and transportation infrastructure are poor. The Landfill Gas Recovery project in South Africa has sustainable development objectives that should not compromise the project’s ability to attract financing, which is conditional on the project’s gas capping costs being funded in a manner that will provide the necessary project economics and returns to potential lenders and investors. Indeed, the development dividends should enhance the project’s acceptance, and its design should reduce any risk of the project not meeting environmental standards. CDM risks are impacted by the complexity of the CDM approval process, which may discourage suppliers of financing from considering the risk mitigating effects of Kyoto compliance credits. The CDM process and carbon credit benefits are not well understood by project decision makers and potential investors in many host countries, which can increase the CDM risks associated with the projects. The limited potential for carbon credits as a significant, reliable source of financing for a variety of reasons including project size and the amount generated and price paid for carbon credits may not improve project viability to attract both investors and lenders. The costs associated with creating compliance credits may not be justified on a project-by-project basis. As demonstrated in the case studies, the costs of developing a CDM proposal are high. The costs associated with approval of Kyoto compliance credits, including the submission and registration processes, and independent and credible monitoring and verification systems, do not always justify the benefits—a problem that becomes more acute as the project size goes down. This is particularly true for smaller projects having a high development dividend and relatively low carbon credit volume. For example, the Kuyasa project had a development cost of US$194,000 million (or 6.2 percent of total project costs) to obtain CDM and Gold Standard approval. (This amount is particularly high due to the development of the suppressed demand methodology, which was new and challenging). The project generates 5,600t CO2e, or CERs, per annum over a 21 year crediting lifetime. The CDM development costs for the Jatropha-Vanilla Project in Kenya were estimated to be US$97,500 (or 4.9 percent of total project costs), which may

Chapter 3: Financing the Development Dividend
109
increase as this figure includes only provisional approval by the DNA and the project has not been approved by the EB. The project would generate 93,200t CO2e, or CERs, per annum over a 10 year crediting lifetime. There are also risks associated with carbon credit delivery and ownership/title of the carbon credits. The Jatropha-Vanilla Project has a high carbon delivery risk as the CERs generated by the project are not expected to be substantial until after 2010, assuming that planting of seedlings begins in 2006. The delivery risk is compounded by the reliance on a large number of small farmers, the potential impact of drought and low water supply, and poor infrastructure. The ownership of credits is uncertain in the STEP project, where it is debatable if the credits would belong to the project entities or the communities where they are actually realized. Many factors can affect the price paid for CERs, including location, type and viability of a project, the baseline methodology, volume of carbon credits being sold, objectives of the buyer(s) in purchasing the carbon credits, sponsors and local government support. The main reasons for the Kuyasa project securing a high price was that it was transacted once registered by the CDM EB, and it was also registered as a Gold Standard project. As well, the project had relatively low risk of non-implementation compared with similar projects of its type, and a low transaction volume. The Jatropha-Vanilla Project, because of the poor country investment climate, considerable project risk and high CER delivery risk, would have to offer a significant discount to attract buyers of CERs. The case studies illustrate the potential for voluntary carbon market buyers to show interest in GHG reduction projects with significant development dividends, particularly where the volume of CERs may be small relative to the cost of selling to the Kyoto compliance carbon market. But buyers in the voluntary offset market need to be made aware of the projects and their relatively high development dividends. 5.0 Understanding the Financing Gaps Financing gaps exist on both the “supply side” (the sources of financing as noted in Section 3) and on the “demand side” (the requirements of project developers as noted in the case studies). There are considerable financing challenges in regard to making development dividend projects bankable, particularly projects promoted by local small project developers. On the supply side, the elements which provide a project with high development dividends may in some cases also cause a project to be less bankable. In order to obtain financing for a project, project proponents may need to consider adjusting the sustainable development objectives in a project’s business plan. With respect to demand, proponents of projects having sustainable development benefits require more flexible and innovative financing which may not be currently available from traditional financing sources. 5.1 Overcoming the Supply Gap
High sustainable development benefits can help to mitigate political risks in financial assessments. For example, project approval by a DNA can lessen risks associated with the CDM, and the high sustainable development benefits may mitigate environmental impact assessment (EIA) risk and lessen the likelihood of community and NGO protest. Moreover, such projects may get strong local government support. However, sustainable development benefits could create unacceptable risks in the view of traditional sources of financing and may weaken a project from a financing perspective.
Project proponents and other stakeholders need to have a clear understanding of the banking issues associated with carbon credits and the banker’s ‘checklist’ of potential risk mitigation efforts. This will assist project proponents in determining if suppliers of financing give any consideration to this revenue stream in their credit decisions to support or not support a project. Structuring Sustainable Development Projects to be ‘Bankable’, i.e. Creditworthy - Jackson (2003:1) argues that a project’s “investment proposals must be supported by a financial model that includes accurate estimates of investment requirements (over time), projected income, debt servicing and an overall cash flow that remains positive. The investments should be based on achievable plans, which are not always politically popular in a developing country environment where promises regularly outstrip resources.” A project must avoid potentially wasted time

Chapter 3: Financing the Development Dividend
110
developing several iterations for approval or rejection by financing ‘credit committees’. Significant project delays can be avoided by knowing a project’s financing needs well, determining how and when to approach the potential sources of financing, and developing the necessary information required to help with informed investment decisions. While some CDM project developers and proponents may feel bankers need to be better educated about the risk mitigating effects of CDM and carbon credits, it should also be noted that it could take more than CERs, persistence and perseverance for proponents and stakeholders of development dividend projects to convince credit committees of the creditworthiness of their projects. A project proponent in one of the Kenyan cases remarked that if he had known the requirements of suppliers of financing before designing the projects, he would have been able to design them in a more bankable manner.
All four CDM case studies are coping with the need to provide the information required by the potential sources of financing. For example, the Kuyasa project has received funding to develop a business plan and financial model that is replicable. The Landfill Gas Recovery project has undergone a number of scenarios to make the project acceptable to the project operators. The implementation of the LFG project is contingent on how the financing for the major capital costs of the project will be structured. Proponents of the two Kenyan projects recognize that banking skills and experience required to obtain financing are lacking. Project stakeholders have to be trained on the financial analysis of projects, a skill lacking in the private sector in Kenya even among MBA graduates. This deficiency is more prevalent among other stakeholder groups (e.g., NGOs and local governments) who feel the projects should only need to be justified on the basis of social good. Proponents of smaller development dividend projects in the more challenging host countries may in fact require more ‘banking’ skills and experience than do the proponents of larger CDM projects in less difficult markets.
Project by Project Approach (“One Offs”) - Suppliers of financing are usually approached by project proponents on a project-by-project basis. This means each project will pass or fail the ‘bankability test’ - is the project able to repay debt and provide a reasonable return to investors on its own merits? An approach involving several development dividend projects bundled together may be more attractive and stand a better chance of being approved for a number of reasons. First, some of the costs for both the proponents and the financers may be spread over a larger number of projects, making the development costs more acceptable. Next, certain risks common to each project can be mitigated through bundling, such as the need for local governments to provide guarantees to DFIs or banks. As well, assets of the projects, including carbon credits, may be pooled and made more bankable at less cost. And the skills and resources required to develop individual projects into a bankable format may achieve greater effect if pooled. Structuring the financing for a bundle of projects, particularly on a limited recourse basis, requires a unique borrowing structure. This could involve a single special purpose borrower and operating company for purposes of lowering risk to an acceptable level for key stakeholders. Projects similar in nature and location with a common purchaser of product may provide some advantage, although there may be some advantage to developing a diverse portfolio to spread the risk. Bundling could also increase the efficiency with which carbon credits generated by each project go through host country buyers/brokers (if they existed), but the capital outlay is one of the barriers to obtaining financing. Carbon Credits as a Potential Source of Financing - The sale of CERs can be an additional source of revenue to the project during operations. But, the revenues generated from such sales may represent a relatively small portion of total revenues derived from the primary activity of the project and depend on the project type and impact of reducing GHG emissions.

Chapter 3: Financing the Development Dividend
111
Carbon credits are normally paid for when the certified carbon credit is delivered to the buyers during operation of the project. It is rare to find buyers willing to pay for carbon credits during the construction period of the project. However, there are some examples of GHG emission reduction projects able to attract construction period financing based on carbon credit purchase agreements from creditworthy buyers.69 This type of project financing has similar characteristics to project financing based on long term product sales agreements such as power purchase agreements with a creditworthy electrical utility. Investors and lenders to the project can rely on these carbon credit purchase agreements to increase ROI and provide additional security. In addition, most sales of carbon credits are in US Dollars or Eurocurrency, providing perhaps the only hard currency generated by the project. Carbon credits can be an incremental source of revenue during project implementation or a potential source of financing during construction. However, the proponents of a project having development dividends must understand that most investors and lenders give little weighting at conception, if any, to the incremental revenue stream, ROI or potential security in their decisions to invest in, or lend to, a project. Understanding carbon credit markets, how they work and who the players are will help proponents of projects with high development dividends incorporate the benefits of carbon credits into the project’s cash flow, risk mitigation analysis and financing needs. In three of the four case studies, the carbon credits are relatively small and in all four the sustainable development benefits are high. Project proponents can consider the benefits and costs of registering the project’s carbon credits with the CDM EB or consider alternative compliance and voluntary carbon credit markets. Understanding the Motivations of Compliance Buyers - Project proponents may need to understand what motivates the various compliance buyers to purchase carbon credits from a project with high development dividends. Carbon credits may be viewed as a financing source by project proponents, but buyers who require compliance carbon credits to offset a Kyoto or regulatory requirement are motivated to purchase sufficient volume at an acceptable value for risks taken. Value, or the price to be paid for a carbon credit, is usually based on buying the maximum amount of carbon credits with the minimum cost, and discounted further by such factors as carbon credit delivery risk determined by the project and host country risks. For example, IFI carbon fund entities may be motivated to purchase carbon credits in larger volume on behalf of their investors who are member countries and large international corporations, i.e., such pressures may override sustainable development objectives. National funding may be mandated by the need to procure compliance carbon credits and promote renewable energy and energy efficiency technology transfer. Private carbon funds are motivated by volume, purchasing price, spot price at delivery, liquidity and return. Lenders to a project who are considering carbon credits as security are also motivated to ensure carbon credit buyers (ERPA or “ERPA” counterparty) are creditworthy and paying a fair price in sufficient volume to cover shortfalls and projected future prices should the carbon credit security need to be realized and liquidated to repay obligations. Equity providers are motivated by the potential enhancement to project ROI that accrues from carbon credits. Small scale projects may not generate enough carbon credit volume to attract the interest of high volume compliance carbon credit buyers. Understanding the Motivations of Buyers of Noncompliance Credits - Suppliers of financing for projects with development dividends would likely view an enforceable, well structured ERPA agreement for the purchase of noncompliance carbon credits (that is, either voluntary or offset credits) from a creditworthy counterparty as an acceptable project risk mitigant. Buyer conditions for purchase could change this view unless such noncompliance carbon credit payments are received before the actual financing is used in the project. Project risks and carbon credit delivery risks are less relevant to noncompliance buyers operating in a voluntary market than compliance buyers. Noncompliance carbon credit purchasers may be more focused on project risks
69 The Plantar Project in Brazil involved the World Bank Prototype Carbon Finance Fund purchase of carbon credits at delivery during operations and a European bank provided a loan to the project based in part on the agreement.

Chapter 3: Financing the Development Dividend
112
which might impact a project’s ability to achieve its sustainable development objectives. Furthermore, verification and monitoring of the carbon credits generated by the project may be less rigorous for noncompliance purchasers than required for compliance purchasers. However, registration, to avoid double counting, may be of concern to both noncompliance carbon credit purchasers and any compliance carbon credit purchasers also involved in the project. Motivation to Support a Sustainable Development Project - Financing sources might be convinced to participate in a project because of other party engagement, which may reduce risk. For example, IFIs such as the World Bank and African Development Bank can be perceived to reduce political risk, a result of close relations with host country governments. Participation in a multilateral bank loan may reduce the credit risk associated with a project. Risk mitigation is less apparent in the case of national entities such as ECAs. Stakeholders in a project with high development dividends, including host country governments, should be familiar with the reasons why buyers of noncompliance carbon credits will select one project over another. Based on the Kuyasa experience, purchasers of noncompliance carbon credits may be motivated to buy carbon credits from projects that have been approved by the CDM EB. They also might be motivated to purchase carbon credits based on Gold Standard endorsements, perhaps even paying a premium knowing there is a credible, independent process for approving the project based on its sustainable development benefits which will in turn, positively impact the buyers’ corporate social responsibility (CSR) returns. The Kuyasa project is an example where voluntary market carbon credits being sold to buyers is based in part on the project’s endorsement by the CDM and its Gold Standard ranking. Using ODA to Assist with CDM Project Development Costs - The restrictions on the use of ODA for CDM projects should be understood by project proponents. Use of ODA to buy CERs is prohibited, but possibilities exist to use ODA to help defray certain transaction costs, such as the development of Project Information Notes, PDDs and EIAs. Potential sources of ODA grant funding and their project selection criteria should also be understood by project proponents, although what can be funded by ODA is still a “gray” area requiring clarification. Host Countries Actions - Host countries can improve the creditworthiness of CDM projects and facilitate financing by establishing clear, transparent and efficient CDM project approval processes, identifying priority CDM sectors, and working to establish facilities to support the development and financing of CDM projects, such as a ‘one-stop-shop’ for local project developers to access financing and buyers, obtain verification, etc. Host countries can also help to improve the development dividend in CDM projects by establishing credible independent processes for assessing sustainable development benefits and approving projects to standard criteria that is recognized internationally. The Development Dividend as a Source of Financing - As discussed in the Kuyasa case study, the City of Cape Town entered into a transaction with DEFRA to sell the first 10,000 CERs in order to offset the carbon emissions of the UK’s G8 presidency of 2005. This transaction was worth £100,000 to the project proponents, with the credits transacted at €15 each - the highest price disclosed in the CDM market at the time. The number of CERs sold represented approximately two years of credits from the project and payment would be made upon delivery. This is an example of the pre-delivery purchase of CERs, which was influenced by the project’s high visibility and its link to the UK effort to influence the agenda and outcome of the G8 Heads of State meetings. This, combined with the sustainable development benefits and Gold Standard designation, may have played a significant part in the UK government purchase decision. As noted above, the noncompliance carbon credit market has the potential to be a source of financing that is paid during the higher risk project development stage, or during the project construction stage, if the project proponents can ‘market’ the project’s sustainable development benefits. The Development Dividend Framework, outlined in Chapter 1, although aimed at the international policy community, might encourage sources of financing to support a CDM project with high development dividends. If, on the international side, the process of scoring were viewed as transparent, efficient, cost effective and not too

Chapter 3: Financing the Development Dividend
113
complex, and if the framework were widely recognized and accepted as significant, a project scoring high on the framework might be better positioned to attract funding 5.2 Overcoming the Demand Gap Proponents of projects with high development dividends require more flexible and innovative financing which may not currently be available from traditional financing sources. Non-traditional Equity and Debt Sources - The objectives of many projects are such that the projects themselves do not meet the risk-reward criteria of most private sector sources of financing. For example, Kuyasa proponents acknowledge that project revenues will come from savings of low income households - households that would not have been able to afford the transfer to more energy efficient services. It is fundamentally a public sector services project, targeting low income earners with limited ability to pay. In the short to medium term, therefore, this project requires subsidization in order to be implemented. It is a project where long term success and replicability may ultimately depend on the project proponents developing a financing structure to attract grants and/or high risk tolerant debt which is both long term, low cost, most likely raised directly by the municipality or on its behalf by the federal and state governments. Kuyasa is essentially a municipal project which may have parallels to similar projects in other countries and their financing solutions may be applied in this case. The two Kenyan projects are noticeably different than the Kuyasa Project. The Vanilla-Jatropha project does have equity investors as proponents of the project and uses a business model showing an acceptable return despite the involvement of low income farmers. The STEP project has attracted an NGO investing group, operating on not-for-profit principles as both a proponent and a key component in the actual operation and success of the project. The Land Gas Recovery project in Cape Town on the other hand, has the potential to be structured and developed as a traditional concession project with funding by traditional sources of equity and debt, including purchasers of the carbon credits. International Financial Institutions - IFIs provide a wide range of programs to support development goals in developing countries, including support for CDM projects. These institutions, in general, need to achieve a greater balance between development dividends, GHG emission reductions and the generation of carbon credits. For example, projects with a high development dividend require mitigation of the risks associated with such projects in order to attract other sources of financing from the private sector that may not be able to accept such risks. The low carbon credit volume of many projects with high development dividends means that these projects may find it too costly to seek CDM approval or enter into ERPA agreements with purchasers of compliance carbon credits and/or noncompliance purchasers. In addition, proponents of these projects require capacity building to develop project financing proposals in a format familiar to the sources of financing, and a relatively simple financing structure for the size of the project. The World Bank has recognized many of these issues and developed the CDCF to support projects that combine community development attributes with emission reductions to create projects that generate carbon credits while significantly improving the lives of the poor and their local environment. The CF-Assist initiative provides capacity building and technical assistance to enhance capacity and expertise of host countries to engage in the GHG market. Export Credit Agencies - ECAs can take risks or protect others against certain political and/or commercial risks resulting from the export of goods or services in CDM markets through the provision of export credit guarantees or insurance (political and/or commercial risk), investment insurance (political risk insurance only) or direct loans. ECAs have considerable potential to support CDM projects with high development dividends given their mandate to support exports, their experience in CDM host countries, and the use of a more risk tolerant approach than commercial lenders, insurers and guarantors. However, national interests must be satisfied, which affects these benefits. The UNEP/SEFI Executive brief (2004) noted that ECAs could do more in CDM markets by developing new products related to carbon credits and a more flexible approach to national benefits requirements:

Chapter 3: Financing the Development Dividend
114
“Certain risks linked to trading of certificates gained with projects under the Kyoto mechanisms CDM and JI, can act as a barrier for further uptake of emission trading. [However,] based on their experience in political and commercial risk coverage ECAs could develop new products related to emissions trading of GHG emissions reductions occurring under the CDM and JI.”
Renewable energy projects often require equipment to be sourced from more than one country. However, ECAs can offer a “one-stop shop” to project sponsors through the use of co-financing and re-insurance arrangements with other ECAs that are providing goods and services to the project. Carbon Credit Impact on Project Risk - Credit decision making committees and officers from most traditional private sector sources of financing currently do not consider carbon credits as a revenue stream in their decision to support or not support a project. There are many reasons beyond the control of the project proponents for this, such as the uncertain and relatively small carbon credit markets. Yet project proponents, developers and their advisors should be better positioned to inform and present the risk mitigating impact of carbon credits. An understanding of the private sector decision making process and factors affecting such decisions can assist project developers in promoting the risk mitigating effect of strong development dividends. It should be noted that progress is being made by the financial sector regarding the impact of sustainable development on credit risk. For example, many commercial financial institutions and some ECAs recognize and support the Equator Principles. 5.3 The Differing Views of Suppliers and Demanders of Financing There are often differing needs and views between the financing sources in order to “supply” financing to a development dividend project, and the “demands” or expectations of the proponents of these projects. Understanding these differing views, which are described below in the three risk areas, can assist in identifying solutions. Country Risks Suppliers of financing seek an acceptable investment climate in the host country, which means acceptable and adequate regulatory and policy frameworks in the form of strong and consistent governmental leadership in sustainable development and GHG reduction. Strong financial, legal and institutional frameworks also lessen risk. Project proponents seeking financing require involvement from stakeholders at local, state and federal levels in the process to select and prioritize sustainable development projects, and who will provide direct and indirect support for the financing of such projects. Local investors and lenders may also be required to support the project. Project Risks Suppliers of financing expect that CDM projects will be financially viable, creditworthy and have financing terms that are security based with adequate return for risk taken. They expect that project technology will be proven, reliable and competitive; that project infrastructure will be at an acceptable standard; and that project supplies of critical raw materials (e.g., feedstock) will be assured. Suppliers will require that the project need be clearly identified and buyers both identified and creditworthy. Project cash flows need to be positive or sources to cover any shortfall need to be committed, creditworthy and unconditional. Any additional risks due to sustainable development objectives will need to be addressed and mitigated. Project proponents seeking funding often believe that locally sourced technology must suffice, transfer of technology should be without conditions, or traditional methods will work. The perception that non-viable projects need to receive special financing terms (such as high risk low return equity, soft debt or grants, premiums for carbon credits) is often based on the sustainable development benefits of the project, which are assumed to have a positive impact

Chapter 3: Financing the Development Dividend
115
on the project. The proponents often believe that creditworthiness and experience of suppliers should not be a major factor in sustainable development projects, and subsidized prices should be covered by grants or government budget at federal, state or municipal levels. Carbon Credit Risks Suppliers of financing require a greater understanding and recognition of the risks and potential risk mitigating instruments available or required for CDM projects. Suppliers will also need to consider the risk mitigating effects of carbon credits and sustainable development as relevant to investment and lending decisions. Suppliers will insist that CER delivery and carbon market risks are addressed. For example, buyers of CERs are reluctant to enter into ERPAs without acceptable assurance the credits will be delivered or any shortfall covered to compensate for losses incurred. The purchasers of VERs are less likely to trade and more likely to treat the support of projects with high development dividends as a non-financial return on CSR or personal social responsibility. The question of ownership of CERs must be clearly answered, as buyers of CERs, VERs and RECs will be reluctant to commit to purchase credits if ownership and use of proceeds is uncertain. Sources of financing, particularly the public sector, need to be encouraged by their stakeholders to be more flexible and risk tolerant in order to reduce dependence on fossil fuels in non-Annex I countries. Project proponents seeking financing require a greater understanding and awareness of the decision process and financing criteria of various financing sources and how these can be addressed when seeking support for a CDM project with high development dividends. Perceptions of those seeking financing often differ from the potential suppliers. For example, public sector stakeholders and beneficiaries of CDM projects with development dividends often consider carbon credits and sustainable development benefits as reason enough for the project to be financed by others; or fail to consider GHG emission reductions, carbon credits and sustainable development as an important part of their core business or expertise. Project proponents for a development dividend project producing carbon credits face pressure from compliance buyers seeking to buy at low carbon prices with secure delivery that are not always interested in ensuring that the project is designed to enhance sustainable development. Project proponents need to understand that projects generating a small amount of carbon credits and/or having unacceptable delivery risks are not able to forward sell the carbon credits. Although spot prices at delivery may be beneficial to future revenue stream for the project, the absence of up front ERPAs may reduce potential interest of equity and/or debt sources to fund construction and commissioning of the project. Projects with sustainable development benefits may have overly complex business plans and uncertainty in regard to the ownership of carbon credits.
6.0 Possible Actions to Increase Financing for CDM Projects with High Development Dividends
A financing gap exists for projects with high sustainable development benefits. CDM projects with high development dividends are usually more risky, due in part to their sustainable development benefit objectives. Encouraging financing on the basis of the sustainable development benefits can be contradictory to and challenging for most financing sources. To overcome the financing gap, suppliers of financing need good “bankable” projects regardless of the sustainable development benefits. Risk sharing and credible, timely, cost-effective CDM approval processes are also important. Demand-side project proponents require more flexible, risk tolerant debt and equity sources; up-front purchases of carbon credits; ODA/grants for project development and sustainable development funds. Possible actions to overcome these gaps and meet the needs of both the supply and demand sides of the financing equation are discussed below. Actions to Improve the Supply Side of Financing Outreach/capacity building is needed for investors and lenders (banks, development finance agencies, ECAs, entire development finance sector in host countries at the federal, state and local levels) who currently give little consideration to the risk mitigating options available from the generation of carbon credits.

Chapter 3: Financing the Development Dividend
116
The development of tailored insurance and other risk mitigating financing instruments for use in ERPAs might enhance the attractiveness of a CDM project with high development dividends. There is a need to define the risk taking roles of the providers of these risk mitigating financing instruments, recourse (most likely to public sector entities, such as ECAs and IFIs) and price. Two stage financing may be of use for development dividend projects. Financing support is required for early stage project development, particularly for local small and medium-size projects. Such financing needs to be more risk tolerant at project start up and commissioning than traditional sources. The potential of non-Kyoto compliance buyers to purchase up front the carbon credits generated from development dividend projects needs to be explored. Governments of Annex 1 countries can play a lead role by putting a greater emphasis on the purchase of CERs from projects with high development dividends. This is already happening in some instances, but leadership is needed to provide clear direction to public sector financial institutions to be more risk tolerant towards CDM projects with high development dividends. Annex 1 countries can also play a role in influencing IFIs to increase support for development dividends in their carbon funds. The role of rural and community development banks in CDM host countries to leverage financing needs to be stronger. The case studies indicate a need to define the roles of local commercial and development financing institutions and to provide them with the capacity to assess projects and to ensure adequate security and/or recourse to appropriate public sector to offset unacceptable risks or through innovative financing structures. The case studies demonstrate a clear need for grant funding or similar financial assistance to assist in the design of projects with high development dividends. While ODA can not be used to buy CERs, it has been used for front-end project development costs (e.g., feasibility studies, PDDs, EIAs). The role of ODA needs to be clarified to allow ODA to catalyze CDM projects realizing a high development dividend. This is a valid need for ODA to assist those projects that have high sustainable development benefits but are not financially viable due, in part, to those same sustainable development benefits. There is a need to “test the limits” of the use of ODA in CDM projects through the submission to the EB of a CDM project that includes significant ODA in front-end development. Exerting pressure on the buyer’s side might increase the purchase of CDM carbon credits with high development dividends (by, for example, strengthening the offset market; standardizing and categorizing where possible, including the voluntary market; developing best practices examples and models, etc.). The case studies illustrate that CER purchasers are basing their decisions on volume, value and delivery risk with little segmentation of the impact of sustainable development benefits. However, pressure to buy a development dividend in CERs would require addressing volume, value and delivery risk. More risk tolerant, less volume and value sensitive purchasers on the voluntary market may respond to organized “pressure” based on country sustainable development programs rather than a project by project approach. Defining the development dividend in terms understood by suppliers of financing, with an emphasis on benefits such as risk mitigation would be of value. Developing a standard, acceptable, monetary measure of the sustainable development benefits may not be possible or practical if the compliance carbon credit cannot be “split” to sell the sustainable development benefit to noncompliance buyers, i.e., a “super credit” which disaggregates each level of benefit and makes it explicit without double counting the aggregate carbon credit for compliance purposes. Actions to Improve the Demand Side of Financing Demystification of the financing process is necessary for project developers to increase awareness of carbon credit markets, and to understand and address the risks of and potential gains from the different carbon revenue streams, including the carbon offset market. Capacity building is required to increase the financing skills of and

Chapter 3: Financing the Development Dividend
117
introduce realistic expectations to the proponents of CDM projects, who may have higher expectations of the impact of carbon credits on financial viability of a project than justifiable. Project proponents need to build skills to develop business cases that properly present the improved bankability and risk mitigating attributes of CDM projects with high development dividends. Project proponents also need capacity building to help them identify more flexible, less risk adverse financing structures, and to promote financing terms that include the recognition of the potential carbon credit revenue streams. CDM transaction costs need to be reduced. The case studies illustrate an exceptionally costly and time consuming process under the current CDM process. Bundling or pooling of carbon credits by the seller may be an option to reduce transaction costs as well as access financing for projects that do not generate a significant amount of carbon credits on a case-by-case basis. The case studies indicate a project-by-project approach to obtaining financing can possibly result in failing the ‘bankability’ test. Host country governments need to understand the importance of linking CDM and sustainable development priorities with other national priorities. Capacity needs to be built within host country financial departments to understand and make use of carbon finance for CDM projects. Host country government could encourage regional and international multilateral financial institutions, ECAs and private sector equity funds and banks to participate in CDM projects with development dividends that support national priorities. Host country governments can develop a national (or perhaps regional) “clearing house” for CDM projects. Those with high sustainable development benefits (perhaps using the Development Dividend Framework as an assessment tool) could be highlighted and noted as priorities. The development of a credible process of prioritizing CDM projects could help to: (a) identify and structure financing options, (b) identify and approach appropriate financing sources, and (c) mitigate key financing risks to acceptable levels for the investors, lenders and other risk takers in the projects.
7.0 Conclusion Local state owned development banks, IFIs and public sector programs in Annex I countries are likely best positioned to take a leading role to include sustainable development benefits in their investment decision processes. Voluntary carbon market buyers of carbon credits could be potential significant purchasers of projects with development dividends based on their ability to pay a premium and possibly provide financing prior to project completion. A credible, internationally recognized standard for determining development dividend benefits could help carbon market buyers in identifying potential projects, while assisting project proponents in marketing their market carbon credits, particularly to voluntary carbon market buyers. An acceptable measure of the development dividend and its impact on reducing project risks could help to overcome the financing gap. A credible, internationally accepted method for calculating the impact of the development dividend on a project’s economics could be included in the project approval criteria used by sources of financing. In particular, it might be useful to employ (and modify if necessary) the Development Dividend Framework discussed in Chapter 1 within a voluntary carbon credit marketplace registry system to identify and list projects that have high development dividend scores.

Chapter 3: Financing the Development Dividend
118
Bibliography
Baker and MacKenzie. 2004. Legal Issues Guidebook to the Clean Development Mechanism. Roskilde, Denmark: UNEP Risoe Centre on Energy, Climate and Sustainable Development.
International Emissions Trading Association (IETA). 2006. Project Finance.
<http://www.ieta.org/ieta/www/pages/index.php?IdSiteTree=1267>. Jackson, Barry M. 2003. Financing Municipal Infrastructure in Developing Countries: the need for utility engineers to learn new
skills, an updated version of a keynote speech prepared for the Annual Congress of the International Federation of Municipal Engineers, November.
SouthSouthNorth and the Gold Standard. 2006. Renewable Energy and Energy Efficiency in Africa: Carbon Finance Guide.
prepared for the Renewable Energy and Energy Efficiency Partnership. <http://southsouthnorth.org/>. UNEP/Sustainable Energy Finance Initiative (SEFI). 2004. Making it Happen: Renewable Energy Finance and the Role of
Export Credit Agencies. Executive Brief prepared for the Bonn Renewables Conference, June. <http://www.gvep.org/files/8517_Role_ECA.pdf>.

Chapter 3: Financing the Development Dividend
119
Annex A: Kuyasa Energy Upgrade Project in South Africa A1. Project The Kuyasa Low Cost Housing Energy Upgrade Project involves retrofitting 2,300 low cost houses in Kuyasa, Khayelitsha in Cape Town, South Africa, with energy efficient lighting, insulated ceilings and solar water heaters. These interventions result in a reduction in GHG emissions through the avoidance of electricity or alternative fossil fuel use by the households. The project provides numerous additional sustainable development benefits such as improved health, access to energy services through an innovative ‘suppressed demand baseline,’70 and employment creation. In August 2005 the project was registered with the CDM Executive Board. It is both the first African and first Gold Standard project to be registered.71 The project offers high development dividend benefits, scoring 48 in the Development Dividend Framework in Chapter 1 and ranking 9th of 215 projects registered as of June 2006. The first phase retrofit of 2,300 households has a project cost of approximately US$3.6 million and generates 5,600t CO2e or CERs per annum over a 21 year crediting lifetime.72 At a CER price of €15 (or US$19) which is due to the project being registered as a Gold Standard CDM project, the CER revenue provides around 15 percent of the upfront funding required on a Net Present Value (NPV) basis. There are over 1.5 million existing low income houses in South Africa which could benefit from this energy upgrade project design. This is in addition to the many greenfield housing developments planned for which these and potentially other energy saving/renewable retrofit interventions are suitable. A2. Country Investment Climate South Africa is considered to have a favourable investment climate for both domestic and foreign investors and for public and private sector financial institutions including multi-lateral development banks and export credit agencies. The following are excerpts from two investment climate reports:
• South Africa offers an attractive climate for foreign investors. As a result, a large number of American firms have invested or reinvested in SA since the lifting of apartheid sanctions in the early 1990s, making the US one of the largest sources of new investment in SA. South Africa has a substantially developed market with significant growth potential and access to other markets in Africa, well-developed financial institutions and capital markets, excellent communication and transport links, liberal repatriation of profits and other earnings, lower labor costs compared to industrialized countries, inexpensive electrical power and raw materials, and strong macroeconomic policies. The SAG has also made progress in establishing measures for good governance, such as regulation of industry, promotion of competition and prevention of corruption.73
• The World Bank’s most recent Country Investment Assessment report for South Africa may be summarized by the following graph.
70 A suppressed demand baseline is one which assumes that current demand for services is suppressed due to poverty. Therefore the baseline used is what would have happened in the absence of suppressed demand. For example, the Kuyasa homeowners do not currently use hot water. But were they able to afford it, they would install an electric geyser as in the case in middle income homes in South Africa. An electric geyser then becomes the baseline. The objective of this methodology is to provide incentives for communities to develop along ‘clean’ paths first, rather than becoming ‘dirty’ before being able to get credits for developing ‘cleanly’. 71 As described in Chapter 1, the Gold Standard is a premium label awarded to ‘best practice’ CDM projects in terms of sustainable development contribution and emissions reduction. Source: SouthSouthNorth - Kuyasa Case Study Brief. 72 Prices in South African Rand have been converted to US$. R7.75 is equivalent to US$1. 73 United States Department of Commerce, 2003. South Africa Country Commercial Guide FY 2003: Invest Climate.

Chapter 3: Financing the Development Dividend
120
A3. Project Financing Issues 1. The revenue stream has a significant shortfall.
• Sale of carbon credits over 21 years is expected to contribute 15 percent in NPV terms. • The estimated energy saving in each household is US$88 per annum or US$1,916 over the 21 year life. The
cost per household is US1,576. However, the low income characteristics of this community result in their being unable to afford to transfer this full saving on energy services as payment to the project.
• The cash flow shortfall in NPV terms, assuming a minimum ‘downpayment’ by each household of 15 percent is approximately US$2.583 million, or 70 percent of the total project cost.
• This project is fundamentally a public sector services project, targeting low income earners with limited ability to pay. In the short to medium term, therefore, this project requires subsidization in order to be implemented.
2. The project’s transaction development costs to date have been relatively high. The development costs of the Kuyasa project’s initial phase obtaining CDM EB registration and a Gold Standard designation, is US$193,777 or almost 6.2 percent.74 of the cost of the project.
3. There are no easily accessible funding sources for this type of project in South Africa. It does not fit into an existing government budget line item. The City of Cape Town applied for funding for the project from the National Department of Environment and Tourism (DEAT) out of their Poverty Alleviation fund. This fund requires that 30 percent of the monies awarded are spent on local employment creation and skills development. In a project as capital intensive as Kuyasa, this requirement does not necessarily make sense for the project. The project’s implementation team and the City are currently in negotiations with DEAT to try to overcome this barrier. Alternative sources of funds allocated to the project have been small, to date. A US$517,000 research grant is being awarded to the project by the Western Cape Provincial government and further smaller amounts have been awarded by Energy De France and the International Council for Local Environmental Initiatives. Attempting to combine a number of small grants brings its own challenges of co-ordination and fulfilling different donor objectives, which make this funding model sub-optimal.
4. Institutional issues have been barriers to the project’s financing process. As well, developing country
74 The total transaction costs for the development up to registration of the Kuyasa project are in the region of US$194,000 given the development of the methodology. The estimated costs of the transactions for replication projects are in the region of US$84,616.

Chapter 3: Financing the Development Dividend
121
government access to funding for projects dealing with environmental issues has previously come in the form of a grant, aid funding or donation, with a set of strict conditions which must be abided by in order to receive the money. The CDM represents the first use of market mechanisms for environmental or social good. This requires a very different approach and set of skills. These skills are not typically found in public sector organizations, characterized by bureaucracy, inflexibility, risk aversion and a slower pace.
5. The use of electric geysers is entrenched in South African society. The public utility is motivated to increase their use in order to sustain electricity sales. SWH technology is very poorly diffused amongst the high income sectors of society, giving the perception that it is an inferior technology and information regarding the effectiveness of the technology is not readily available. As a result, significant confusion exists, and the benefits in terms of energy cost savings of SWH are not well promoted. However, project and government approaches are underway to remedy this situation.
A4. Carbon Credit Market 1. The project does not have a significant volume of CO2 emission reductions relative to the project size.
• Reduction of greenhouse gas emissions is approximately 2.8 tonnes CO2/Household/year, or 5,600 tonnes of CO2/annum for the initial phase of retrofitting 2,300 low income houses.
• This project is expected to generate 130,000 CO2e tonnes over the 21 year life of the project. However, this assumes that the SWH equipment and the household will be adequately maintained to continue to achieve the projected energy savings.
2. The project has attracted international interest in purchasing its carbon credits; however, apart from an initial sale of 10,000 credits, decisions to pursue sales have been postponed by the seller. • The City of Cape Town entered into a transaction with the United Kingdom’s National Department of
Environment Food and Rural Affairs and Agriculture (DEFRA) in September 2005, to sell the first 10,000 CERs from Kuyasa to offset the carbon emissions of the UK’s G8 presidency of 2005. This transaction is worth £100,000, with the credits having been transacted at €15 (US$19) each, with payment at delivery of CERs. This is the highest price yet disclosed in the CDM market. (A similar premium may be replicable for other Gold Standard projects at a similar stage of development.) The project secured this price due to its Gold Standard status, its relatively low risk of implementation compared with similar project of its type, the low transaction volume, and its situation in Sub-Saharan Africa. The number of CERs sold represent the approximately two years of credits from the project.
• The City is refraining from any further transactions at this stage, whilst it establishes the necessary mechanisms within the City to manage and co-ordinate CDM transactions and project revenue flow.
• The project has been widely marketed, with numerous requests from intermediaries or direct purchasers operating in the carbon offset market.
• Not all buyers require the credits for CERs, some only require VERs. Most require Gold Standard status. 3. Carbon Credit Delivery Risk is linked to Project Financing.
• An initial assumption was that the CER revenue stream would play an important role. However, it became apparent very quickly that no buyer would enter into a contract to purchase CERs without reasonable security that the CERs would be delivered.
• Having the underlying project finance in place, or at least a plan to secure the project finance, is a minimum requirement in order to transact the CERs.
• Carbon revenues may still play an important role in leveraging other financing sources, rather than providing a significant portion of the financing themselves.
Many factors can affect the price paid for CERs, including location, type and viability of a project, the baseline methodology, volume of carbon credits being sold, objectives of the buyer(s) in purchasing the carbon credits, sponsors, and local government support. The main reasons for the Kuyasa project securing a high price was that it was transacted once registered by the CDM EB, and it was also registered as a Gold Standard project. As, well the project had relatively low risk of non-implementation compared with similar projects of its type, and a low transaction volume. This case illustrates the potential for voluntary carbon market buyers to show interest in GHG

Chapter 3: Financing the Development Dividend
122
reduction projects with significant development dividends, particularly where the volume of CERs may be small relative to the cost of selling to the Kyoto Compliance Carbon Market.

Chapter 3: Financing the Development Dividend
123
Annex B: Bellville Landfill Gas Recovery Project in South Africa B1. Project The Bellville South Waste Disposal Site is located approximately 30 km north-east of the Cape Town central business district. The adjacent land uses include the City of Cape Town’s Bellville South Wastewater Treatment Plant, the Sacks Circle industrial area and the low-income residential area of Belhar. The site has been operational as a formal domestic landfill site since the 1960’s. As of January 2005, there were approximately 3,222,328 tonnes of deposited waste at the site, covering an area of 30 ha, making it one of the biggest disposal facilities in the greater Cape Town area. The waste in the landfill is 95 percent municipal solid waste and about five percent construction and demolition waste that is used mainly for cover material and other construction purposes at the site. On average, the landfill has a waste depth of approximately 20 metres. The CDM project for the Bellville South Landfill involves two small scale project activities:
1. Capture of methane-rich gas that would otherwise have been emitted into the atmosphere. The cost at the time of calculation was in the region of US$8.8 million (this includes the cost of capping the landfill).75
2. The use of captured methane-rich gas as a renewable fuel. Methane can be converted to energy either through the generation of grid electricity on site, or through the sale of the gas to adjacent energy users. The cost of the first option has not been determined; the second option has an estimated cost of about US$2.1 million.
It is anticipated that the project will reduce approximately one million tonnes of CO2e over the project’s ten year crediting lifetime. The City of Cape Town owns the landfill, and hence currently the CDM project. However, landfill gas (LFG) extraction is not their core business, nor do they have the time, skills and capacity to implement the project. Furthermore, the City is struggling to ensure sufficient landfill space to serve a growing population within its jurisdiction, so the sustainable management of the LFG unfortunately comes further down on the priority list. A number of contractual models and ownership frameworks have been considered. One of the most attractive is a model whereby the City tenders out a concession over the LFG to a ‘gas utility’, which would then develop the site and sell the gas and the CERs. The price of the concession (a royalty) over both the gas and the CERs (together with other contractual terms particularly that involving the capping of the landfill) remains to be determined. While financing for such a project structure might normally be arranged by the project concession entity, a number of financing related issues have arisen. In summary, the project proponents feel the more attractive the project is to the concession operator, the more competitive the tender is likely to be, and therefore the higher the likelihood of the City securing optimal financial returns from the gas concession and the CER revenue stream. The City is unlikely to put the project out to tender until a number of the risks have been resolved, including, if at all possible, that the City cap the landfill. B2. Country Investment Climate South Africa has a favourable investment climate as noted above in section A2. B3. Project Financing Issues
75 Prices in South African Rand have been converted to US$. R7.75 is equivalent to US$1.

Chapter 3: Financing the Development Dividend
124
In 2006 the project was on hold until two rate determining steps have been resolved, both relating to the project’s risk profile and financial feasibility: 1) the City should secure the funding to cap the landfill and 2) the value of the CERs post-2012 should be known with greater certainty. 1. Responsibility for financing the project rests either with the City of Cape Town or the LFG Utility that will be
selected to build and operate the project. Since the identity of the project ‘LFG Utility’ is not known at this time the creditworthiness and technical ability to complete the project and successfully operate it cannot be determined by investors, lenders and purchasers of the carbon credits.
2. Delays in project implementation have created uncertainty on the project’s viability. The initial expectation was the combination of gas and CER revenues would enable the project implementer (the City or the LFG Utility) to cap the landfill and still return a profit based on the assumption the project would be commissioned by 2006, allowing seven years of the total ten of the project’s lifetime to fall within the Kyoto Protocol’s First Commitment Period. The planning and decision making process has been delayed for a number of reasons such that the CER revenues prior to 2012 may not be sufficiently attractive for potential CDM landfill project developers to view the project as viable if the costs of capping the landfill are included in their mandate.
3. Designating the project as a renewable energy project either generating electricity to be sold to the grid or selling gas to nearby industries increases the capital cost of the project, but also substantially increases its sustainable development benefits. The product buyer credit risks and product delivery obligations of the ‘LFG Utility’ are unknown at this time making it difficult to obtain preliminary indications of financing for the project.
4. Flaring projects are increasingly considered non-additional because of host country regulations that require LFG be extracted and flared for safety and environmental reasons. Beyond this, a flaring project is not sustainable. LFG is a potential energy source and flaring it destroys this opportunity. It is suggested that the South African DNA will not in any case approve flaring projects for this reason.
5. Until very recently, Independent Power Producers (IPPs) were unable to supply electricity to the South African grid, run by the national utility, Eskom. Despite a favourable investment climate, potential financing sources for the project will need to be satisfied of the regulatory environment for IPPs to compete successfully in South Africa. The contractual and other procedures required for IPPs are still therefore very much under development, and increase the risk and lead times associated with an IPP project. South Africa currently boasts the lowest grid electricity price in the world, and the price an IPP could charge remains uncertain, and hence too the viability of the project for the ‘LFG Utility’.
6. Potential nearby industrials buyers of landfill gas provides an option to the City. Both price and length of contract are important risk issues to the supplier of the gas, particularly if they have to deal with the very high upfront costs represented by the requirement to cap the landfill. Given that they have currently viable sources of fuel, it is unclear whether they will commit to a long term purchase contract, increasing the risk of the project.
7. Drought conditions in the Western Cape create uncertainty on ability to deliver gas as contracted. Concern has been expressed that recent drought conditions in the Western Cape will reduce the amount of gas generated by the landfill, as water is required to produce the gas from the waste.
8. The landfill is due to close in September 2006. However, due to the Solid Waste Department’s critical need for additional landfill space, it has called for an extension to this until 2009. The adjacent community is vigorously opposing the extension, as it prolongs the health and safety impacts of the landfill. This application is currently undergoing litigation, but at the time of writing remains unresolved. This has repercussions for the extent of the landfill gas that is generated by the project, and its timing. Until such time that it is resolved, it will represent a risk and uncertainty to the development of the project. There is also a risk regarding any delay that may occur to the project once the landfill is closed. The landfill gas generation peaks 18 months after the landfill is closed. Failure to develop the site immediately upon closure will therefore both reduce the amount of methane the project will eventually capture, and render the site increasingly dangerous to the surrounding community unless managed.
9. A complicating factor which could cause additional delays in the EIA is that the present relationship between the City and the adjacent community is not very good given the continued operation of the landfill. An independent ‘gas utility’ undertaking the EIA may or may not have a better relationship with the local community. More important than selecting an ‘LFG Utility’ to possibly undertake the EIA is to get the business plan settled, (i.e., will the project sell electricity to the grid or sell gas to nearby industries?) as this will affect not only the scope of

Chapter 3: Financing the Development Dividend
125
the EIA but also may influence acceptance by the community. Landfill EIAs have a history of problems in South Africa.
10. The Kyoto Protocol, CDM and carbon credits are a very different approach to dealing with an environmental concerns, presenting challenges for a municipality, which is typically concerned primarily with ensuring services are delivered to its constituents without the need to increases taxes. While local governments usually procure goods and services, the CDM involves:
a. The sale of a commodity, carbon credits, currently unidentified and unaccounted for by the local government.
b. The carbon market is a developing, fast changing market, with all the associated skills required around trading in order to optimize the commodity’s value.
c. The rules of the CDM are complex and evolving, requiring local government capacity on these issues, and dedication of scarce resources in order to remain up to speed.
d. There are unrealistic expectations regarding what the CDM can actually deliver. Different projects have different CER profiles, and therefore differ in their ability to generate revenue through the carbon market.
e. Some are more complex in terms of methodologies and PDDs, taking longer and being more expensive to complete the project cycle.
11. The City of Cape Town has also been organizationally challenged over the past few years due to: a split constituency, resulting in regular changes of government; implementation of a far-reaching organizational restructuring program, and functioning well below in delivery of its core services to the community.
B4. Carbon Credit Market Although the end use of recovered landfill gas has yet to be determined, it is anticipated that the project will reduce approximately 1 million tonnes of CO2e over the project’s ten year crediting lifetime. The City has been approached by all types of project developers wishing to develop the landfill and secure access to the credits. However, given the uncertainty for the project business plan and who will be selected to as the LFG Utility, the local municipality may not be able to optimize the returns which the CDM offers through its CER market. This scenario is particularly prevalent with regard to landfill projects, which are (sometimes erroneously) seen as ‘goldmines’ for their low cost credits. These approaches by project developers may have been confusing for the municipality who:
• Have had political pressure on them to ‘do a landfill CDM project’. • Have had the expectation that the project, including the revenues from carbon credits will pay for the
landfill’s capping, but have not confirmed through feasibility studies that the project is viable given its current risk profile.
• Have stewardship over a ‘public asset’ (the LFG) and a responsibility to ensure the maximum returns to Cape Town from the project.
Although a local municipal government may partner with a purchaser or another developed country entity to develop a landfill project and sell the credits, this may not be the preferred solution for this project.

Chapter 3: Financing the Development Dividend
126
Annex C: Vanilla Jatropha Project in Kenya C1. Project The Vanilla/Jatropha Project76 involves growing vanilla in two districts with the Jatropha tree used as the tutor for shade and for fencing the farms. The project at maturity (after eight years) would involve 200 acres of nucleus plantation and 100,000 farmers growing vanilla on one acre plots. Each year, the farmers would supply 198,300 tonnes of Jatropha oil seeds for pressing to produce about 65 million liters of oil and 138,8000 tones of nitrogen rich cake fertilizer. Specific development dividends would result from six million litres of oil being used for household lighting and cooking which would generate a cleaner smoke that naturally repels mosquitoes. The balance (59 million) litres would be converted into bio-diesel and glycerol through a trans-etherification process. The bio-diesel would replace diesel used in grinding grain and local transportation, while the glycerol would be used to make soap. The project proponents plan to develop two 100 acre seedling nurseries in each of the districts. Farmers would buy both the Jatropha and vanilla seedlings using money borrowed from a revolving fund. The project, having a cost of US$2.1 million, was designed to be partially funded by the Poverty Eradication Commission (PEC) of the government of Kenya, which is responsible for implementing the National Poverty Eradication Strategy, by a commercial loan secured by the project proponents, by farmers supplying seed and purchasing the products, and by the project proponents’ equity.77 However, the PEC loan, which was to be used to set up the revolving fund, has been delayed - a result of a failure in the Kenyan government to adequately fund PEC due to other national priorities. This has significantly slowed down project implementation. Development Dividend benefits of the project include increased household incomes from vanilla and Jatropha sales to the project developers and reduced expenditure on lighting and cooking oil (US$1.6 million reduction per year for the 100,000 farmers). Other economic benefits include increased availability of high quality organic cake manure for organic vanilla production, and increased income generation from the local production of Jatropha oil lamps and the production of soap from glycerol. There are also positive health impacts, including reduced incidence of bronchial diseases due to cleaner household fuel, and improved malaria control since Jatropha oil is a mosquito repellant The project would generate some 93,200 tCO2e, or CERs, per annum over a ten year crediting lifetime. For this project a price of US$7 per tonne CER78 was used for the compliance market. Annual carbon revenues from the project are therefore estimated to be in the range of US$652,000. It remains to be determined if the project will achieve a Gold Standard rating or attract potential buyers of carbon credits from the voluntary market. It is uncertain whether or not a premium will be paid over the CER market price; this will be a reflection of market acceptance of the project’s carbon credit delivery risks. C2. Country Investment Climate Kenya is considered to have an investment climate less than favourable than South Africa. However, local equity investment has been doing very well. Existing companies have raised significant capital through commercial paper or Nairobi Stock Exchange. Also the telecommunication sector continues to attract significant foreign investors.
76 The main crop from the project is Vanilla which has a very high value and absorbs most of the operating and administrative expenses such as land preparation, weeding and project management. 77 Prices in Kenyan Shilling have been converted to US$. KSh 73.08 is equivalent to US$1. 78 The estimated price of US$7/tonne is based on the project proponents understanding of market at the time the initial business plans were being developed with the aid of consultants.

Chapter 3: Financing the Development Dividend
127
The following excerpts, which are from readily available investment climate reports, provide an indication of Kenya’s investment climate:
• After experiencing moderately high growth rates during the 1960s and 1970s, Kenya’s economic performance during the last two decades has been far below its potential. As a result, per capita income in constant 1982 prices declined from US$271 in 1990 to US$239 in 2002, according to the Kenyan government’s Economic Recovery Strategy for Wealth and Employment Creation, 2003-2007. (The Central Bank of Kenya’s May 2004 monthly bulletin estimates 2003 per capita income at US$395.). The sharp deterioration in economic performance has worsened the poverty situation. The number of people living in poverty is estimated to have risen from 48 percent of the population in 1990 to 56 percent of the population in 2002 (the latest available statistics) and continues to rise. This disappointing development has further been complicated by the upsurge of the HIV/AIDS pandemic, which was estimated at 14 percent of the population in 2002, with an estimated decline to 6.7 percent in 2003. The decline in economic performance since 1980 has been accompanied by decreasing levels of both foreign and domestic investment79
• The World Bank’s most recent Country Investment Assessment report for Kenya is summarized by the following graph.
C3. Project Financing Issues The project is intended to be funded by local equity and debt sources as outlined in the summary below:
Ksh80 US$ Percentage (%)
Project proponents
13,745,830 190,132 9.1%
Loan secured 117,200,000 1,621,111 77.5%
PEC 16,942,500 234,349 11.2%
79 U.S. & Foreign Commercial Service and U.S. Department Of State. 2005.http://strategis.ic.gc.ca/epic/internet/inimr-ri.nsf/fr/gr126188f.html. 80 US$ 1 is equivalent to Kshs. 73.08 (as of October 3, 2006).

Chapter 3: Financing the Development Dividend
128
Farmers 3,356,250 46,424 2.2%
Total 151,244,580 2,092,016
Project implementation has started, but at a slower pace than planned, having been delayed by issues associated with the financing, which are discussed below. 1. Project risks of concern to lenders
• Input supply risk is considered to be a high risk for traditional project lenders because obtaining adequate supplies will depend on the training of thousands of small farms to plant and harvest seeds from the Jatropha plant, for the production of Jatropha oil and bio-diesel for local use, and the vanilla plant for the production and export of vanilla beans.
• Weather and reliable water supply may represent a challenge for production of the vanilla, but not the Jatropha which is a drought resistant hardy plant.
• Domestic demand for the bio-diesel will be highly dependent upon price relative to traditional fossil fuels which face an upward trend.
• Reliability of bio-diesel supply by the project entities and conversion by consumers to new stoves, lamps and generators to utilize the product may be of concern to institutions considering support for the project.
• Domestic consumers of the products from the Jatropha plant are relatively poor and their ability to purchase at the prices needed to provide investors with reasonable returns could be a concern. However, they are already paying double the projected price to buy kerosene. Nationally, the mean monthly expenditure on kerosene by the poor in 2000 was approximately US$1.
• Although the Vanilla-Jatropha project has a projected IRR of approximately 71.98 percent according to the proponents’ base case, most of the land preparation and administration costs have been absorbed by the vanilla component of the project which has been treated as a separate project with its own costs and revenue streams. The vanilla revenues are expected to be from export to overseas markets. This separation of a potential positive revenue stream in hard currency is likely to be unacceptable to foreign and domestic lenders.
• Development and transaction costs for CDM approval are US$ 97,464. These costs represent 4.9 percent of total project costs and have negligible impact on the IRR, reducing it by less than 0.001 percent (see Project Financial Analysis with and without CERs).
• The debt to equity ratio of 9:1 is high and likely unacceptable to traditional commercial bank lenders based on the project risks. Therefore a Revolving Fund is to be set up using the PEC contribution which is to be repaid, but the exact repayment period has not been established. The fund is to be used to set up two seedlings nurseries (one in each district), farmer training services and field monitoring services. The PEC loan has been delayed in part due to the current crisis in governance, and the drought and famine situation in the country. There are very limited options to replace the PEC loan: o Most banks in Kenya will not provide loans for this kind of fund and it will only come from the
government or development partners. Use of ODA may make this project ineligible as a CDM project. o The local banks and development banks in the country could play a key role in providing such funds,
but currently they are very risk averse. Most rain-fed agricultural projects are considered too risky by these banks.
2. Institutional factors influencing the financing • The project is at a relatively early stage of implementation within the local community and in its development
as a CDM project. The Kenya DNA has approved the project in principle at the PDD level but has not gone through a formal approval process.
• Financial institutions in Kenya are extremely risk averse and do not put any premiums on development dividends when evaluating projects.
• Government institutions tend to have inadequate funds for financing such projects. A case in point is the PEC, which was set up by the government in the mid 1990s but to date has been unable to fully implement its mandate due to inadequate funding and over reliance on ODA.

Chapter 3: Financing the Development Dividend
129
• There is lack of understanding of the CDM and inadequate capacity to build this understanding at all levels of government, and within NGOs and private institutions.
C4. Carbon Credit Market
Delivery risks for credits generated from the projects are judged high by potential buyers and brokers due to a higher than acceptable level of project risk generally, including:
• Reliance on a large number of small farmers. • Introduction of a new type of crop. • Weather, namely the impact of continuing drought and low water supply. • Losses due to infestation. • Farmers’ financial ability to deal with weather, economic and political uncertainty. • Infrastructure, namely roads. • Market risks for these potential credits are influenced by the type of credit under consideration.
The CERs generated by this project is not expected to be substantial until post-2010, assuming planting begins in 2006 and the logistics of relying on 100,000 farmers to supply seeds is proven. A significant discount would be required to attract buyers of CERs, who are currently focused on meeting Kyoto commitments and are not expected to make long term commitments. Buyers of VERs may be attracted to the high sustainable development benefits. Carbon credits will be owned by the project entities, although it may be debatable whether the CERs should belong to the project entities or the communities where they are actually realized. This is not considered to be a major issue if the CER funds are used to repay the PEC loan or for community projects such as schools and dispensaries.

Chapter 3: Financing the Development Dividend
130
Annex D: Solar Technology for Electricity Provision in Kenya D1. Project Solar Technology for Electricity Provision (STEP) is a program that encompasses two projects: the Energy for Schools Project (ESP) and the Rural Community Solar Home Systems Finance Project (RCSHSFP). The aim of the program is to facilitate the ease of acquisition of solar energy photovoltaic (PV) systems by rural schools and households through structured financial assistance. • Energy for Schools Project (ESP) helps schools acquire appropriate and efficient solar PV lighting systems
and reduce their annual energy bill. The Pilot phase (15 schools targeted) is being implemented in Nyando and Kisumu Districts with significant success. Funding has been provided by Ashden Trust UK and ITDG-EA is the local managing trust. The project is expanding in four provinces, building on successes in the pilot districts. Forty-eight schools are targeted for the second phase of the project, which recently started.
• Rural Community Solar Home Systems Finance Project (RCSHSFP) aims to establish a Solar Home Systems (SHSs) revolving fund for sustainable acquisition of SHSs by rural households in the same provinces where the ESP will be undertaken. This project is funded by UNDP-GEF/SGP Kenya and aims to showcase global climate change mitigation initiatives accomplished through cleaner energy uses in rural communities. The Michimikuru Tea Farmers Association's 5,000 members in Meru North district of Kenya piloted the initiative. The project, implemented jointly since 2001 by Solarnet and Thananga Tea SACCO, aims to electrify 5,000 households and develop a sustainable revolving solar fund managed by the community. The fund is to be replicated by Kenya’s co-operatives movements to provide off-grid rural members with electricity supply through solar PV systems as an alternative to grid based electricity.
• Other planned and on-going solar awareness and education programs support this project. The program will be implemented by Solarnet, a regional (East Africa) NGO committed to the widespread adoption and use of renewable energy resources. Its 500 members are comprised of renewable energy stakeholders from the region and abroad. Solarnet, founded in 1996, mobilizes resources to create awareness of solar energy potential and facilitates acquisition of solar energy lighting systems by off-grid communities. At the same time, the NGO undertakes capacity building to develop skills and capacities to maintain the systems in an affordable and sustainable manner. The NGO carries out advocacy initiatives and mobilizes stakeholders to pool resources for solar installations in rural communities and boarding schools. Solarnet aims to leverage financial resources from the donor community to assist with the acquisition of solar PV systems by the project beneficiaries. However, these project beneficiaries are also required to raise at least 50 percent of the total average costs of US$745 (for household systems) and US$2,750 (for schools systems) for the equipment and its installation.81 The organization aims to increase its operations by at least 20 percent annually for the next ten years. The project would generate some 147 tCO2e or CERs per annum over a 10 year crediting lifetime. For this project, the price of US$5 per tonne CER was used for the compliance market.82 Annual carbon revenues from are therefore estimated to be in the range of US$735.
D2. Country Investment Climate We consider Kenya to have a less than favourable investment as outlined above in section C2.
81 Standard household equipment costs US$595 while installing it costs US$152. A standard school system costs US$2,255, while installation is US$360. Note, there are some customization variations at times. 82 The estimated price of $5/CER is based on the project characteristics and the project proponent’s knowledge of CER market with inputs from consultants.

Chapter 3: Financing the Development Dividend
131
D3. Project Financing Issues The total project cost over the 10 years is US$14.8 million. Solarnet is expected to contribute 12 percent of the total costs, the equivalent of approximately US$1.78 million. While most of the Solarnet contribution is in terms of existing Solarnet infrastructure, staff salaries and administrative services, external funding in form of grants will be used to provide the liquid capital required to fund the equipment and its installation.
While each Solar PV installation in a school or home will be based on a standard module, actual installation will be based on established needs of each case. A school purchaser is expected to pay 50 percent of the total equipment and installation costs, with the remaining cost covered by a grant contribution. A household purchaser is expected to pay up to 50 percent of the total equipment and installation costs at purchase and obtain a 50 percent loan from a local co-operative.83 The cooperative will have entered into an agreement with Solarnet and received advances from the Solarnet trust fund for this purpose. The trust fund, which is managed by ITDG-EA, receives funds from Ashden Trust UK (for schools) and UNDP-GEF/SGP Kenya (rural homes).
D4. Project Barriers Kenya, and Africa as a whole, has the potential to generate substantial amounts of energy from renewable sources, but certain barriers and issues need to be addressed, as discussed below.
• Institutional Development: The Ministry of Energy, respective government departments and research institutes play a crucial role in influencing the promotion and implementation of Renewable Energy Technology [RET] programs in the region. These institutions need to provide an enabling environment (e.g., regulatory framework, research and data such as days of sunshine per year in different regions). The private sector is also important in promoting the wide-scale use of solar energy technologies (SETs) and ensuring long term sustainability.
• Financing and Economic Issues: The main obstacle to implementation of renewable energy projects is the absence of low-cost long term financing. This problem is compounded by competition for limited funds by diverse projects. Issues of default arise especially when such funds are accessed in the form of loans, mainly as a result of lack of credit referencing of potential borrowers. SETs also tend to be expensive with low IRR and ROI and long pay back periods.84 These kinds of investments are not suitable for poor people without a credit facility.
• Organization, Management and Maintenance: While knowledge of technical options for disseminating SETs in Africa has increased significantly with experience, the results of many initiatives have been below expectations. This is largely because developing, selecting and implementing the appropriate technical options are unexpectedly complex tasks. Poor performance is not just the outcome of external factors, such as lack financial resources, but also can be traced to institutional and human resource constraints affecting renewable energy organizations. These constraints affect the selection and the retention of management staff, as well as their behaviour and performance. A shortage of competent middle-level management and technical staff is often identified as an important contributor to the poor performance of the renewable energy equipment. The introduction of unfamiliar technologies requires the development of skills. The importance of engineers and trained technicians in better utilize energy resources to contribute to economic development has been recognized in the region. In spite of government efforts there is still a shortage of qualified personnel.
83 The household member will have been saving in the cooperative society and must have a minimum of 50 percent of the total cost saved at the time of purchase. 84 The Internal Rate of Return (IRR) for the STEP project is 12.32 percent (without CERs) and 16.56 percent (with CERs). The return on investment (ROI) is -0.61 percent (without CERs) and 2.78 percent (with CERs).

Chapter 3: Financing the Development Dividend
132
• Equity: Rapid urbanization is one of the most significant demographic changes taking place in the region. This demographic shift is strengthening the historical bias of channeling development resources to urban areas and continued to push rural energy issues into the background. Consequently, mobilizing support for developing and implementing technology options for rural areas has been and will continue to be an uphill battle. SETs can play a significant role in reducing the gap between energy services available in rural and urban areas, as well as between low income and high-income households. SETs reduce dependence on foreign energy resources and technologies, thus reducing the energy inequity between industrialized countries and oil-importing countries of Africa.
• Infrastructural Barriers: Nearly all home designs in Kenya, including house orientation in relation to the movement of the sun, are not geared toward solar PV or heating systems and sometimes expensive modifications have to be made before installation can take place.
• Security Barriers: Theft of installations, including roof mounted solar panels, mean that additional costs to improve security are a part of solar PV systems. Systems that can be dismantled every evening are an option. The threat of theft is an additional risk to purchasers, who lack access to insurance services.
• Other Barriers: There is a lack of knowledge among customers and technicians about solar PV systems.
D4. Carbon Credit Market
Annual emission reductions are estimated to be 147.16 tonnes CO2e/yr, or 1,471.60 for the 10 year crediting period. At US$5 per CER, the CER value is estimated to be US$ 7,350 for the 10 years project period. A price of US$ 5 per tonne of CO2e was used for this project (compared to US$7 for the Jatropha-Vanilla project) because potential buyers indicated that a higher discount would be demanded because of the low number of CERs. The transaction costs significantly outweigh the CER value (due to the low number of CERs), both from the project developer’s and the CER buyer’s perspectives; therefore, no buyer will be interested in the project despite its potential over the long term to realize significant CERs as more schools and households install solar PV systems.

Chapter 3: Financing the Development Dividend
133
Annex E: Summary of Case Study Financing Risks The following tables provide a summary of the main risks identified in the case studies in three categorie: 1.) Host country risk/investment climate, 2.) Project risk and, 3.) Carbon credits as a source of financing risk.
Table 1: Host country risk/investment climate
Investment Climate South Africa Kenya
Major concerns noted in the World Bank Country Investment Assessment report
Labour skills and education Labour regulations Macroeconomic activity Crime, theft and disorder
Corruption Cost of financing Crime, theft and disorder Tax rates Anti-competitive practices Tax administration Economic/regulatory policy
uncertainty Infrastructure
Credit rating - addresses the economic, political, legal and regulatory framework
OECD Country Risk Rating 3/7 S&P sovereign long term foreign
currency rating BBB+
OECD Country Risk Rating 6/7
Table 2: Project Risk
Project Financing
Issues South Africa
Energy Upgrade South Africa Landfill
Gas Recovery
Kenya Vanilla-Jatropha
Kenya Solar Technology Electricity
Project Status Delayed Delayed Delayed Very early stage of development
Reasons for project status
Funding gap for grants
Project on hold pending: - Municipal review - Approvals of project structure - Selection of project operator - Project risk profile more attractive to stakeholders
Local government contribution on hold
Potential funding gap for grants
Project Implement-ation
Feasible Relatively small
project for initial phase
Potentially very large, involving 1.5 million households
Proven technology Funding responsibility to be determined Builder, operator not identified
Introducing a new bio-diesel fuel source, thus 4-5 years to reach maximum production and cash flow
Requires relatively large organizational structure to deliver project objectives

Chapter 3: Financing the Development Dividend
134
Project size US$5 million (initial project)
US$13 million (as currently proposed)
US$2 million US$ 14.8 million
Project infrastructure
Supply of solar water heaters requires lead times
No issue Roads for transporting feedstock and product are poor in the regions where the projects are located
Large rural area to be covered by large technical sales force
Project input supply and product demand
No issue Feedstock potentially affected by water shortages Competitiveness/price of product may affect demand
Project feedstock relies on thousands of small rural farmers Demand for bio-diesel products dependent on conversion from traditional heating and cooking fuels, weather, economy Export product supply and demand to be determined
Installation and maintenance relies on trained technicians Demand for product depends on grant and low cost, long term loans
Project viability Requires subsidization of cost to retrofit each house to be viable
Believed not viable if capital cost of gas recovery cap part of builder/operator capital costs
Highly dependent upon debt financing, the terms and structure
Requires significant subsidy in form of grants to buyers of solar PV equipment
Project incremental viability from reduction of emissions
Carbon credits may partially offset high development costs and subsidy cost
Incremental viability high
Carbon credits revenues should have little impact on project viability
Carbon credit revenues should have little impact on project viability
Extent of community engagement and political complexity
Highly dependent upon: ο Development of
a replicable financing model acceptable to home owners, burdened with portion of cost, state and municipal stakeholders and DFI debt sources
ο Overcoming knowledge gaps associated with
Highly dependent upon: ο Community
acceptance of expansion
ο State electricity utility acceptance
ο IPP Regulatory environment
ο Avoidance of tax increase
ο EIA assessment ο Overcoming
knowledge gaps associated with carbon credit
Dependent on consumer acceptance of new bio-diesel fuels and low cost conversion of existing lanterns and stoves
Support of state and regional governments should not be an issue

Chapter 3: Financing the Development Dividend
135
carbon credit process and markets
process and markets
Table 3: Carbon credit as a source of financing risk
Carbon Credits as a potential
Source of Financing
South Africa Energy Upgrade
South Africa Landfill Gas
Recovery
Kenya Vanilla-Jatropha
Kenya Solar Technology Electricity
Project status CO2e volume low relative to project cost Percentage of carbon credits to project cost is around 15 percent
Carbon credits are a significant source (50 percent) of revenues to the project
CO2e volume high relative to project cost
CO2e volume high relative to project cost
Development dividends in relations to carbon credits
High development dividends with low carbon credits to project cost suggest this project should consider the voluntary market.
Project developers are interested in its CER potential. High volume carbon credits, lower sustainable development benefits.
High development dividends with low carbon credits to project cost however some interest in project’s CER potential.
High development dividends with low carbon credits to project cost suggest this project should consider the voluntary market.
Delivery risks Mitigated by nature of voluntary carbon credit market. Once funding sourced, mitigated by political implications of project success.
Project delays and drought may delay or reduce CERs in the 2008-2012 commitment period. Short term gas sale contract leaves emissions reductions through gas use at risk.
High CER risk until project sustainability and viability is proven.
Mitigated by nature of voluntary carbon credit market.
Market risks Mitigated by nature of voluntary carbon credit market.
To be determined. Current under-supply of CERs, particularly from large volume African projects mitigates this risk.
Low potential for project to attract pre-delivery payment. Moderate potential to attract long term forward purchases. Most likely to attract buyer interest in spot sales post 2010.
Mitigated by nature of voluntary carbon credit market.

Chapter 3: Financing the Development Dividend
136
Ownership issues
Potential issues of ownership depending upon the business structure.
Potential issues of ownership depending upon the tender structure.
Potential issues of ownership are partially mitigated if business plan to re-invest proceeds into new sustainability development initiatives is followed.
Potential issues of ownership depending upon the business structure.


![IP ADDRESS MANAGEMENT [IPAM]. What is IPAM? Windows Server 2012 introduces IP address management[IPAM], which is a framework for discovering, auditing,](https://static.documents.pub/doc/80x56/56649c7b5503460f9492f68a/ip-address-management-ipam-what-is-ipam-windows-server-2012-introduces.jpg)


