Making HIV-related maps in minutes: "Indiemapper" - free mapping tool for everyone AIDS-2014 Workshop, 24/07/2014, Melbourne, Australia Yuliia Sereda, PhD Institute for Economics and Forecasting, NAS, Ukraine [email protected]
Transcript
Making HIV-related maps in minutes: "Indiemapper" - free mapping tool for everyone
AIDS-2014 Workshop, 24/07/2014, Melbourne, Australia
Yuliia Sereda, PhDInstitute for Economics and Forecasting, NAS, [email protected]
Objectives• Basic concepts, reasoning and software • Indiemapper tools
• Practical exercise “HIV prevalence and affected populations in Europe”
• Questions and answers
Basic concepts
What is map?A graphic representation
of spatial concepts, where some real characteristics of geographical regions
are replaced with symbols
Photo credit: UNICEF Ukraine
Historical note• The first known world
map was made in 2300 century BC Babylonians (modern Iraq) on a clay tablet
Geographical Information Systems (GIS)• Type of software• Tool-kit• Approach to deal with spatial data
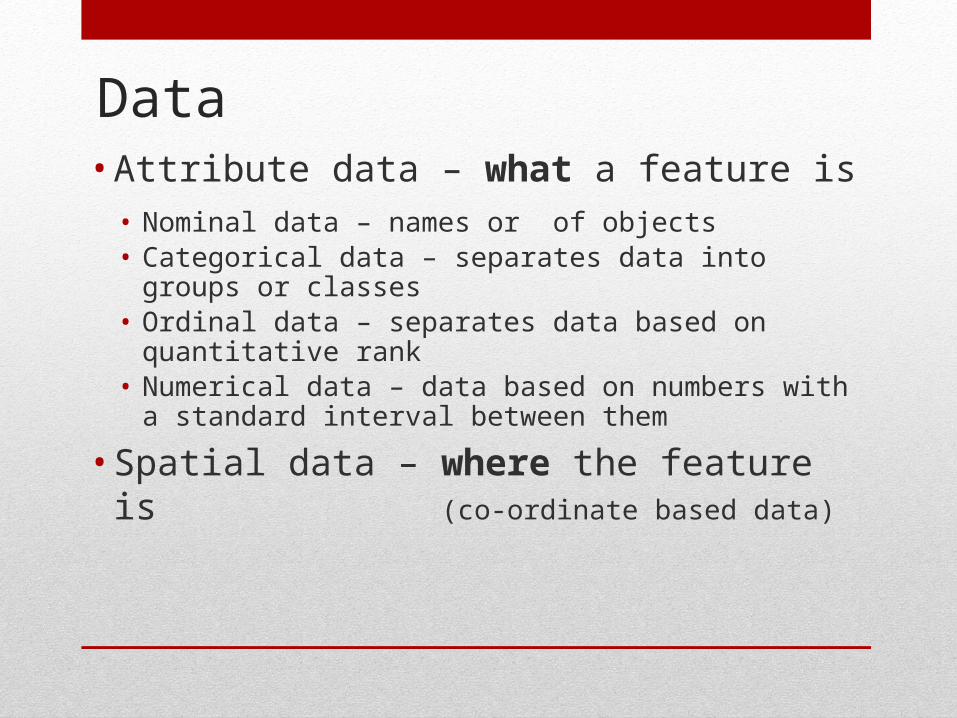
Data• Attribute data – what a feature is
• Nominal data – names or of objects• Categorical data – separates data into groups or classes• Ordinal data – separates data based on quantitative rank• Numerical data – data based on numbers with a
standard interval between them
• Spatial data – where the feature is (co-ordinate based data)
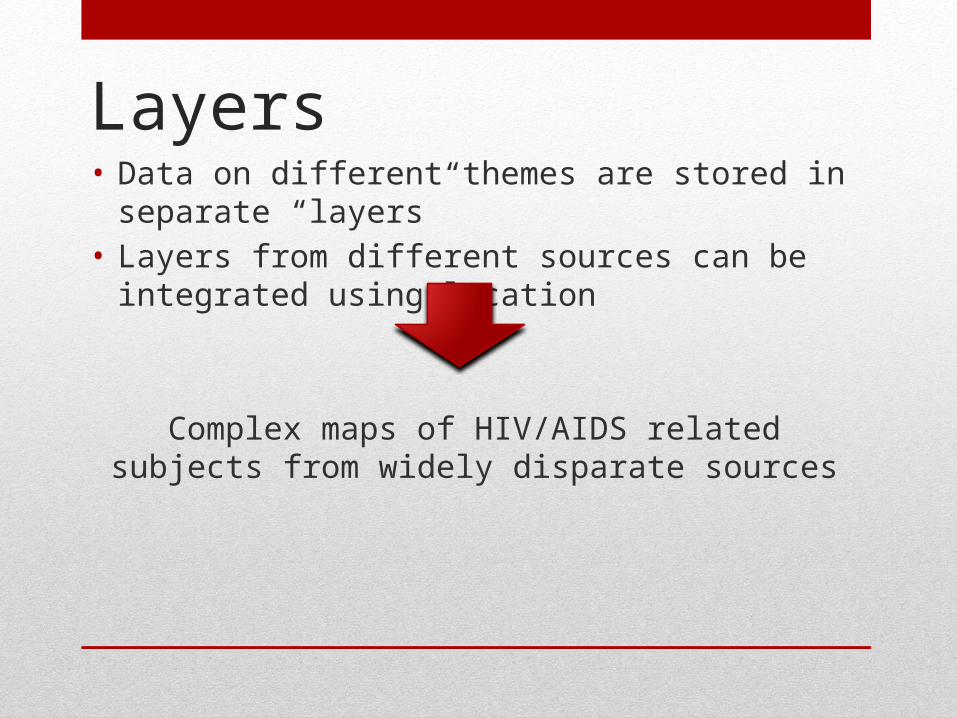
Layers• Data on different themes are stored in separate “layers”• Layers from different sources can be integrated using
location
Complex maps of HIV/AIDS related subjects from widely disparate sources
Why do we need maps?
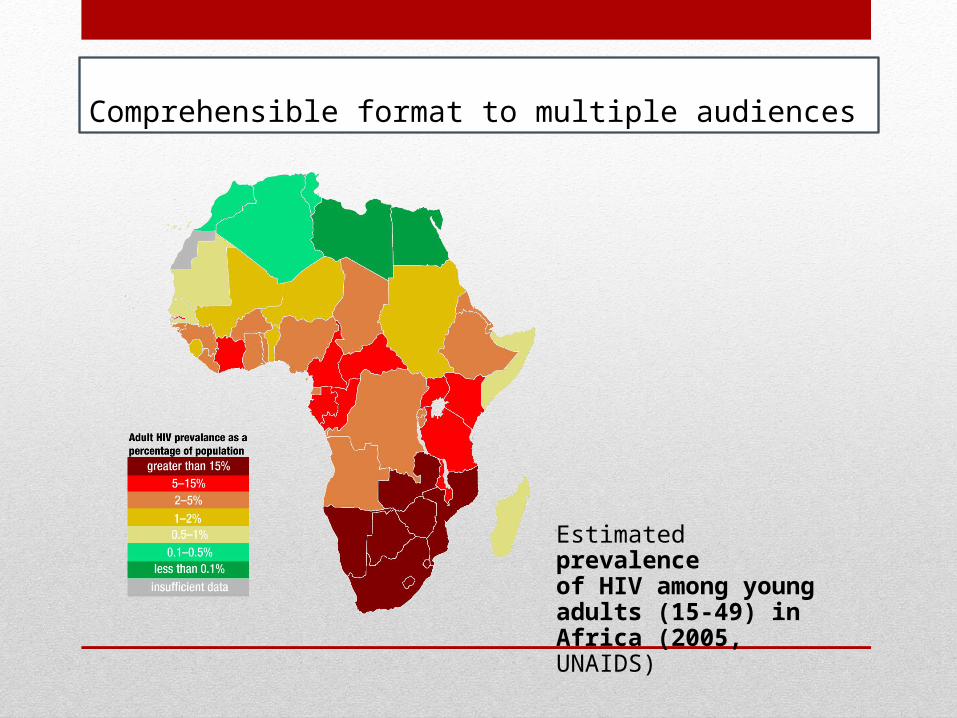
Comprehensible format to multiple audiences
Estimated prevalence of HIV among young adults (15-49) in Africa (2005, UNAIDS)
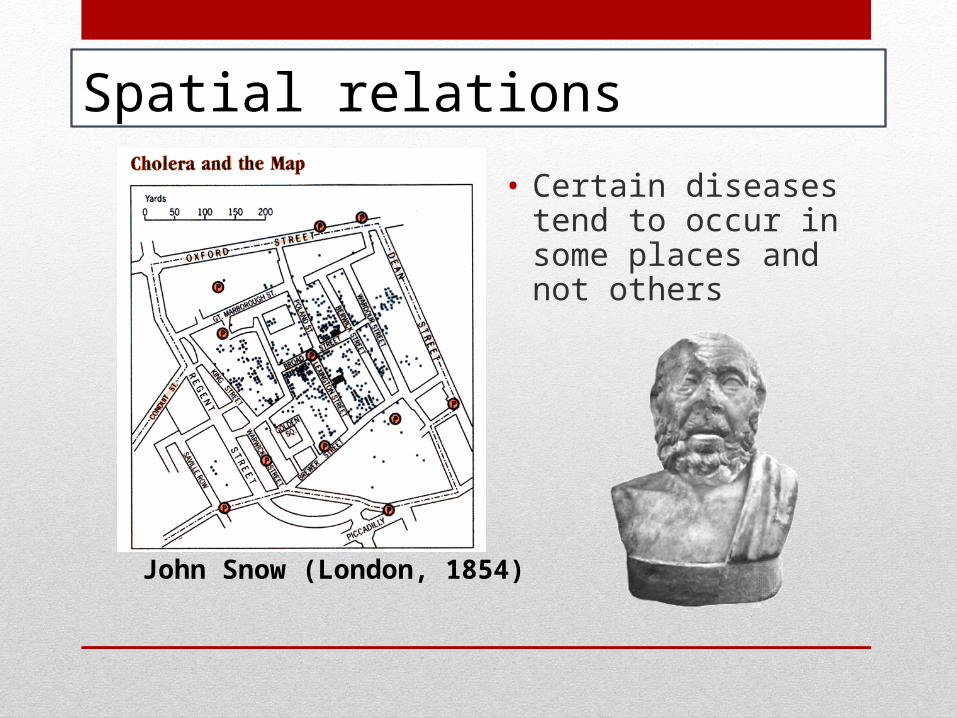
John Snow (London, 1854)
• Certain diseases tend to occur in some places and not others
Spatial relations
Yuliya Sereda
In 1854, a major cholera outbreak in London had already taken nearly six hundred lives when Dr. John Snow, using a hand-drawn map, showed that the source of the disease was a contaminated water pump.By plotting each known cholera case on a street map of Soho district (where the outbreak took place), Snow could see that the cases occurred almost entirely among those who lived near the Broad Street water pump.This pump belonged to the Southwark and Vauxhall Water Company, which drew water polluted with London sewage from the lower Thames River. The Lambeth Water Company, which had relocated its water source to the upper Thames, escaped the contamination.
Map for responsesWhere are the transmission main spots?
Where are the prevention services?
Are the right services in the right places?Do we have adequate coverage?
Needs assessment, program planning and evaluation
• Spatial distribution of disease• Mapping populations at risk• Trends, both temporal and spatial• Input, process, output and outcome evaluation• Planning and targeting interventions