118
MAKING PRE-K COUNT Improving Math Instruction in New York City Pamela A. Morris Shira K. Mattera Michelle F. Maier October 2016

MAKING PRE-K COUNTImproving Math Instruction in New York City
Pamela A. MorrisShira K. MatteraMichelle F. Maier
October 2016
MDRC BOARD OF DIRECTORS
Mary Jo BaneChairThornton Bradshaw Professor of
Public Policy and ManagementJohn F. Kennedy School of
Government Harvard University
Robert SolowChairman EmeritusInstitute Professor EmeritusMassachusetts Institute of
Technology
Rudolph G. PennerTreasurerSenior Fellow and Arjay and
Frances Miller Chair in Public Policy
Urban Institute_______________________________
Robert E. DenhamPartnerMunger, Tolles & Olson LLP
Ron HaskinsSenior Fellow, Economic StudiesCo-Director, Center on Children and
FamiliesBrookings Institution
James H. Johnson, Jr.William Rand Kenan Jr.
Distinguished Professor of Strategy and Entrepreneurship
Director, Urban Investment Strategies Center
University of North Carolina
Lawrence F. KatzElisabeth Allison Professor of
EconomicsHarvard University
Bridget Terry LongProfessor of Education and
EconomicsGraduate School of EducationHarvard University
Josh B. McGeeVice President of Public
AccountabilityLaura and John Arnold Foundation
Richard J. MurnaneThompson Professor of Education
and SocietyGraduate School of Education Harvard University
Jan NicholsonPresidentThe Grable Foundation
John S. Reed Retired ChairmanCitigroup
Michael RosterFormer General CounselStanford UniversityFormer Managing PartnerMorrison & Foerster, Los Angeles
Cecilia E. RouseDean, Woodrow Wilson School of
Public and International AffairsKatzman-Ernst Professor in the
Economics of EducationProfessor of Economics and
Public AffairsPrinceton University
Isabel V. SawhillSenior Fellow, Economic StudiesCo-Director, Center on Children and
FamiliesBrookings Institution
_______________________________
Gordon L. BerlinPresident, MDRC

Making Pre-K Count Improving Math Instruction in New York City
Pamela A. Morris Shira K. Mattera Michelle F. Maier
October 2016
This report is made possible through funding from the Robin Hood Foundation, the Heising-Simons Foundation, the Overdeck Family Foundation, and the Richard W. Goldman Family Foundation. Dissemination of MDRC publications is supported by the following funders that help finance MDRC’s public policy outreach and expanding efforts to communicate the results and implica-tions of our work to policymakers, practitioners, and others: The Annie E. Casey Foundation, Charles and Lynn Schusterman Family Foundation, The Edna McConnell Clark Foundation, Ford Foundation, The George Gund Foundation, Daniel and Corinne Goldman, The Harry and Jeanette Weinberg Foundation, Inc., The JBP Foundation, The Joyce Foundation, The Kresge Foundation, Laura and John Arnold Foundation, Sandler Foundation, and The Starr Foundation. In addition, earnings from the MDRC Endowment help sustain our dissemination efforts. Con-tributors to the MDRC Endowment include Alcoa Foundation, The Ambrose Monell Foundation, Anheuser-Busch Foundation, Bristol-Myers Squibb Foundation, Charles Stewart Mott Founda-tion, Ford Foundation, The George Gund Foundation, The Grable Foundation, The Lizabeth and Frank Newman Charitable Foundation, The New York Times Company Foundation, Jan Nichol-son, Paul H. O’Neill Charitable Foundation, John S. Reed, Sandler Foundation, and The Stupski Family Fund, as well as other individual contributors. The findings and conclusions in this report do not necessarily represent the official positions or policies of the funders. For information about MDRC and copies of our publications, see our website: www.mdrc.org. Copyright © 2016 by MDRC®. All rights reserved.

iii
Overview
In the context of a persistent achievement lag among low-income children despite substantial investments in early education, policymakers and practitioners continue to seek ways to improve the quality of children’s preschool experiences. The Making Pre-K Count study addresses whether strengthening prekindergarten (pre-K) instruction in math, hypothesized to be a “linchpin” skill in children’s development, can improve children’s short- and longer-term learning. Specifically, the study rigorously evaluated the effect of an evidence-based math curriculum called Building Blocks along with ongoing training and in-classroom coaching, relative to the typical pre-K experience. Making Pre-K Count took place in 69 pre-K sites and over 170 classrooms across New York City. Thirty-five of the pre-K sites were assigned to receive the math curriculum, training, and coaching over two years (the “BB-MPC” group), while the other 34 were assigned to continue their typical programming (as the “pre-K-as-usual” group). Outcomes for children were assessed in the second year of the study, after teachers were familiar with the program. Over the course of the study, the typical pre-K experience in New York City was changing rapidly, with a new focus on the Common Core math standards and a major expansion into universal pre-K.
This initial report provides early results on teachers and children at the end of pre-K during the second year of Making Pre-K Count implementation.
Key Findings • Implementation of the professional development and curriculum model generally went well.
Training and coaching were well attended and delivered with high quality. Teachers were able to implement three out of four main curricular components (Whole Group, Hands On Math Centers, and Small Group) successfully at levels prespecified by the research team. Implementa-tion of the Computer Activities component fell slightly below those levels.
• Teachers in BB-MPC classrooms spent more time on math — an additional 12 minutes of math instruction and an average of nearly two more math activities in a three-hour period — despite the surprisingly large amount of math instruction already taking place in New York City pre-K programs. BB-MPC led to slightly higher-quality instruction in math, but there was no impact on teachers’ general use of strategies that promote higher-order thinking (such as asking “why” and “how” questions).
• BB-MPC had no impact on direct assessments of children’s math competencies, language ability, or executive function (a set of skills underlying self-regulation). Children with stronger language skills at pre-K entry may have benefited from BB-MPC, but there was no evidence of gains for other subgroups of children.
These pre-K findings stand in contrast to previously published studies of Building Blocks, which found positive effects on both math instruction and outcomes for children. Many open questions remain about how the New York City context, including the substantial amount of math already in place and the unique sample of children, may have contributed to these initial findings. Future reports will address these questions, as well as the longer-term effect of BB-MPC on children’s outcomes as they move into kindergarten.


v
Contents
Overview iii List of Exhibits vii Preface ix Acknowledgments xi Executive Summary ES-1 Chapter 1 Introduction 1
A Focus on Math as a Route to Long-Term Child Gains 4 Making Pre-K Count 6 Organization of This Report 7
2 The New York City Context, Building Blocks Curriculum and Professional Development Model, and Study Design 9 The New York City Pre-K Environment 9 Building Blocks Math Curriculum 11 Professional Development: Training, Coaching, and Technical Assistance 16 Hypothesized Effects of BB-MPC on Teachers, Classrooms, and Children 18 Study Design 21
3 Implementation of the Professional Development and Curriculum Models 25 Fidelity to the Professional Development Model 25 Fidelity to the Curriculum 28 Summary 33
4 Impacts of Making Pre-K Count on Pre-K Teachers, Classrooms, and Children 35 Impacts on Teacher and Classroom Outcomes 35 Impacts on Child Math, Language, and Executive Function Outcomes 43 Where and for Whom Did Effects of BB-MPC Vary? 49 Summary 54
5 Discussion and Open Questions 55 Open Questions 56 What’s Next? 60

vi
Appendix A Baseline Equivalence of Teachers, Parents, and Children Across Program and
Control Groups 63 B Analysis Model 83 References 89

vii
List of Exhibits
Table
2.1 Building Blocks Curricular Component Definitions and Technical Assistance Benchmarks 14
2.2 Selected Baseline Characteristics of Year 2 (2014-2015) Lead Teachers 22
2.3 Selected Baseline Characteristics of Parents and Children, Full Consented and Fall Assessed Samples 23
3.1 Implementation of Building Blocks Curricular Components, Year 2 (2014-2015) 30
3.2 Coach-Reported Quality Ratings of Building Blocks Curriculum Implementation by Lead Teachers, Year 2 (2014-2015) 32
4.1 Primary Classroom-Level Impacts on Math Teaching Practices in the Spring of the Pre-K Year 38
4.2 Classroom-Level Impacts on the Number of Teacher-Led Math Activities and Informal Math Activities in Different Math Content Areas in the Spring of the Pre-K Year 40
4.3 Secondary Classroom-Level Impacts on Classroom Climate in the Spring of the Pre-K Year 42
4.4 Child-Level Impacts on Math Competencies in the Spring of the Pre-K Year 44
4.5 Child-Level Impacts on Language and Executive Function Skills in the Spring of the Pre-K Year 47
4.6 Classroom-Level Impacts on Math Teaching Practices and Child-Level Impacts on Math Competencies in the Spring of the Pre-K Year, by Venue 50
4.7 Subgroup Analyses of Child-Level Impacts on Math Competencies in the Spring of the Pre-K Year 52
A.1 Comparison of Baseline Teacher Characteristics, Full Baseline Sample and Subsample with CLASS Data 67
A.2 Comparison of Baseline Teacher Characteristics, Analytic Sample 70
A.3 Sensitivity Analyses for Impacts on Teacher Practices 73
viii
A.4 Comparison of Baseline Teacher Characteristics for Full Baseline Sample and Subsample of Blocks Balanced by Race and Ethnicity 75
A.5 Comparison of Baseline Parent and Child Characteristics, Full Consented Sample 77
A.6 Comparison of Baseline Parent and Child Characteristics, Baseline Assessed Sample 79
A.7 Child-Level Baseline Math and Executive Function Assessment Scores, by Time of Assessment 81
Figure
ES.1 Impacts on Classroom Outcomes in the Spring of the Pre-K Year ES-6
ES.2 Mean ECLS-B Math Scores in the Fall and Spring of the Pre-K Year ES-8
2.1 Timelines for New York City Pre-K Initiatives and Making Pre-K Count Data Collection 10
2.2 Building Blocks-Making Pre-K Count (BB-MPC) Theory of Change 19
4.1 Mean ECLS-B Math Scores in the Fall and Spring of the Pre-K Year 45
Box
ES.1 Brief Illustration of a Building Blocks Whole Group Activity ES-4
1.1 High 5s Math Clubs 3
2.1 Illustration of a Building Blocks Whole Group Activity Focused on Questioning and Eliciting Children’s Reasoning 12
2.2 What Is an Effect Size? 15
2.3 Building a Coaching and Training Infrastructure in New York City 18
3.1 Assessing Fidelity to the Professional Development Model 26
3.2 Assessing Fidelity to the Curriculum 29
4.1 Assessing the Amount and Quality of Math Instruction 37
4.2 Assessing Classroom Climate 42
4.3 Assessing Children’s Math Competencies 44
4.4 Assessing Children’s Language and Executive Function Skills 48
ix
Preface
Six years ago, concerned that investments in preschool programming were not making as big and lasting a difference as hoped, the Robin Hood Foundation, in partnership with the Overdeck Family Foundation, the Heising-Simons Foundation, and others, began working with MDRC to determine whether an increased focus on the amount and quality of math instruction could have long-term effects on students’ school performance. Coupling a developmentally appropriate math curriculum named Building Blocks with an intensive training and instructional coaching program for teachers, Making Pre-K Count is an ambitious effort in New York City to build evidence about early math’s role as a “linchpin” in improving children’s skills. The study was designed to learn whether skills improved not just in math but also in language and literacy, self-regulation, and executive function; assess whether gains can be generated on a large scale; and gauge whether gains are sustained as children move into kindergarten and elementary school.
During the years of this study, the New York City prekindergarten system began im-plementing a new set of pre-K Common Core learning standards specifically focused on increasing the amount and quality of math and literacy instruction. And in 2014, the city launched a major preschool expansion effort aimed at creating a universal pre-K model to reach an additional 32,000 children. These changes mirror efforts to expand and strengthen early childhood education across the nation — and constitute big changes in “business as usual.”
While recent studies of universal preschool programs in such locales as Tennessee and Boston tackle the question of whether preschool works at all, Making Pre-K Count asks a differ-ent question: How can we improve the quality of preschool instruction — both what is taught and how it is taught — above and beyond the business-as-usual classroom? And can this be done in a large, diverse array of pre-K programs, both in schools and in community-based centers?
The implementation story summarized in this interim report is a positive one. Teachers successfully delivered the Building Blocks curriculum, and the amount and quality of instruction rose relative to the business-as-usual setting. But even in the control group, the amount of math instruction students received increased dramatically. Possibly as a result, when students in both groups were tested at the end of the year, the two groups performed comparably. These prelimi-nary findings stand in contrast to those found in other studies of the Building Blocks curriculum. While there are reasons to believe that some differences may emerge by kindergarten, what might explain the results so far? Besides the surprisingly high level of typical math instruction, contrib-uting factors may include the distinct sample characteristics and an emphasis in the skills test on counting but not on geometry, which was an important part of the curriculum. These and other questions will be explored more fully as children progress through the kindergarten year. We will also have an opportunity to learn more about how well children sustain math skills gained in pre-K and about the effects of a math “booster” being tested in kindergarten.
Gordon L. Berlin President, MDRC


xi
Acknowledgments
Making Pre-K Count (MPC) reflects the efforts and contributions of many people. We are extremely grateful to the teachers and site administrators without whom the study would not have been possible. Thank you to the teachers for attending numerous trainings, for implement-ing the program, for allowing us to visit your classrooms, and for sharing your insights. Thank you to the administrators and other staff in each of the schools and centers that were part of the MPC study who generously gave their time, commitment, and cooperation throughout the project.
We extend our appreciation to current and former leadership at the New York City De-partment of Education’s Division of Early Childhood Education and the Administration for Children’s Services’ Division of Child Care and Head Start, who provided valuable support and guidance for implementing the study in schools and centers throughout the city.
Running and supporting an intervention at this scale requires a true collaboration with many contributing partners. We are particularly thankful for the dedicated consultation and deep engagement of the developers of the Building Blocks curriculum, Drs. Doug Clements and Julie Sarama, who helped the team conceptualize the Building Blocks intervention, led trainings for our teachers, and provided thoughtful comments on this report, as well as for the hard work of the Building Blocks trainers, Linda Bialek, Melissa Comerchero, Meg Gailey, Dorothy Jordan, Amy McCampbell, Shelley McLaughlin, Doug Van Dine, Beth Walker, and Jessica Walker-Beaumont, who trained teachers and conducted site visits. Thank you also to Mary Louise Hemmeter and Lindsay Giroux for providing training and support around classroom manage-ment. Bank Street College of Education was also an invaluable partner. The Bank Street team provided valuable input on the professional development model and technical assistance throughout the project, and their commitment to coaching the teachers on this project was vital. We could not have proceeded without the contributions of Sabrina Silverstein (Project Director Pilot Year and Year 1), Katherine Baldwin (Coach Pilot Year and Year 1, Project Director Year 2) and all the coaches from Years 1 and 2 whose commitment and enthusiasm were instrumen-tal in driving implementation and supporting teachers. Thank you to the current and former leadership at Bank Street College, including Josh Thomases and Jon Snyder, for their guidance, thoughtful partnership, and review of the report.
The design, planning, and execution of the research and data collection benefited from the thoughtful input of the Making Pre-K Count steering committee. Thank you also to our academic partners, including Sandra Barrueco of Catholic University; Karen Bierman of Pennsylvania State University; Greg Duncan of the University of California, Irvine; Dale Farran of Vanderbilt University; Linda Platas of San Francisco State University; Katherine Magnuson
xii
of the University of Wisconsin; and Cybele Raver of New York University. Without the tireless work in monitoring and ensuring high-quality data collection procedures of our research partners at RTI International, including Jean Lennon, Jennifer Keeney, Joe Simpson, and the many dedicated data collectors, the large of amount of data needed for our study would never have been collected and processed. Thanks also to Carol Bilbrey for her training and develop-ment work with the team on the Narrative Record and to the MDRC staff who participated in the site visits.
The project benefited tremendously from the ongoing support and commitment of the Robin Hood Foundation, the Heising-Simons Foundation, the Overdeck Family Foundation, and the Richard W. Goldman Family Foundation.
At MDRC, we thank Mike Bangser, Gordon Berlin, Howard Bloom, Barbara Goldman, JoAnn Hsueh, John Hutchins, Rob Ivry, Ginger Knox, Janet Quint, and Marie-Andrée Somers, who offered thoughtful guidance on the analysis and reviewed several drafts of this report. We thank Sharon Huang, Amena Sengal, Shay O’Brien, and the MPC operations team for their indispensable work in site recruitment and operations efforts; Chrishana Lloyd for her critical role in the early stages of the project; Samantha Wulfsohn, Robert Mesika, and the Bank Street College of Education team for providing technical assistance to the sites throughout the imple-mentation phases of the project; MDRC’s Information Technology department for managing the many complicated IT needs of this project and supporting teachers and sites; Adam Greeney and Lyndsay McDonough, who were integral to the data management and analysis on the project; Jocelyn Page for her careful and capable work as resource manager; MDRC’s legal and fiscal departments for producing 69 site agreements and processing payments for hundreds of teachers; Seth Muzzy and Marissa Strassberger for managing the data collection with RTI International; Nicole Leacock for her implementation work; Aimee Mun, Vinh Nguyen, Seata Shyon, and Nicolas Planet for their work processing and conducting the analysis for the report; Anne Kou for providing research assistance and coordinating the production of the report; Jennie Kaufman, who ably edited the report; and Ann Kottner, who prepared it for publication.
Most important, we thank the children, families, and teachers who participated in our study and generously gave their time, commitment, and cooperation throughout the project. Our research would not have been possible without them.
The Authors

ES-1
Executive Summary
Preschool has been championed as a poverty-fighting strategy that can — under certain circum-stances — improve outcomes throughout childhood and even into adulthood. Yet the “fade-out” of preschool effects, particularly as preschool programs expand to a larger scale, has emerged as one of the central challenges in the field. With evidence suggesting that early mathematics skills may be important to children’s later academic outcomes and the understanding that math instruction has tended to be underemphasized in preschool, Making Pre-K Count focused on math as a potential pathway to improve preschool instruction and to bolster children’s compe-tencies in preschool and in the long term.
The study was designed as part of the Robin Hood Early Childhood Research Initiative, which was established to identify and rigorously test promising early childhood interventions. The initiative is a partnership between Robin Hood, one of New York City’s leading anti-poverty organizations, and MDRC, a nonprofit, nonpartisan education and social policy research organization. Making Pre-K Count, conducted in collaboration with Bank Street College of Education and RTI International, is also supported with lead funding from the Heising-Simons Foundation, the Overdeck Family Foundation, and the Richard W. Goldman Family Foundation.
As the initiative’s first study, Making Pre-K Count tested whether an evidence-based math curriculum (Building Blocks), along with teacher training and in-classroom coaching, would improve children’s short- and long-term learning compared with prekindergarten (pre-K) as usual in New York City. The study took place at 69 sites serving predominantly low-income children of color in New York City. The pre-K experience in New York City was in flux during the study period, with greater attention to children’s learning in math and language and literacy and an expansive move to universal pre-K for 4-year-olds. As a result, Making Pre-K Count compares an innovative approach to teaching pre-K math with an evolving “business as usual” pre-K program model. This report presents initial findings about implementation, teacher practices, and child outcomes. Future reports will focus on the longer-term impact of this math curriculum and professional development on children’s outcomes in elementary school.
Why Math? The impetus behind Making Pre-K Count derived from nonexperimental research demonstrat-ing that math may be a “linchpin” skill that can improve a broad set of outcomes for children, including language and a set of cognitive skills known as executive function that support
ES-2
children’s self-regulation.1 In fact, preschoolers with strong early math skills have higher achievement in both math and reading in elementary school than their peers with lower math skills, adjusting for other differences between these children.2 Likewise, children with strong math skills throughout elementary school have higher rates of high school graduation and college attendance, which are critical milestones on the path out of poverty.3 Yet despite these links between early math and later learning, young children historically have received little math instruction in preschools, suggesting a math intervention as a promising way to substan-tially change children’s preschool experience. Emerging evidence from smaller tests by design-ers of play-based math curricula, appropriate for preschoolers’ developmental level, demon-strate that it is possible to increase the quantity of math instruction in preschools, leading to moderate to large effects on children’s math skills.4 The combination of these factors — children’s limited exposure to formal math instruction in preschool, the availability of promis-ing curricula to fill that instructional gap, and the prospect that preschool math skills may promote a host of other outcomes for children in the longer term — make math a compelling target.
Making Pre-K Count Study Design Making Pre-K Count tested the Building Blocks preschool math curriculum, combined with ongoing training and in-classroom coaching to support teachers’ delivery of it. Building Blocks, developed by Douglas H. Clements and Julie Sarama, was chosen for a number of reasons: (a) It has a detailed and scripted manual to support widespread dissemination across many classrooms; (b) it has a well-developed training component; (c) it addresses a broad set of math content areas; (d) it is uniquely based on a developmental progression that should support learning for children at all skill levels; and (e) it shows strong evidence of effects for children
1Executive function, also known as cognitive regulation, in early childhood is made up of working
memory (or the ability to keep a number of pieces of information in the mind at once), cognitive flexibility (or the ability to flexibly shift between pieces of information), and inhibition (or the ability to stop or repress an immediate response).
2Greg J. Duncan, Chantelle J. Dowsett, Amy Claessens, Katherine Magnuson, Aletha C. Huston, Pamela Klebanov, Linda S. Pagani, Leon Feinstein, Mimi Engel, and Jeanne Brooks-Gunn, “School Readiness and Later Achievement,” Developmental Psychology 43, 6 (2007): 1428-1446.
3Greg J. Duncan and Katherine J. Magnuson, “The Nature and Impact of Early Skills, Attention, and Be-havior” (paper presented at the Russell Sage Foundation Social Inequality and Educational Outcomes Confer-ence, New York City, 2009).
4Examples of curricula are Douglas H. Clements and Julie Sarama’s Building Blocks, Herbert Ginsburg’s Big Math for Little Kids, and Prentice Starkey and Alice Klein’s Pre-K Math.

ES-3
across a number of preschool samples and sites.5 The curriculum includes 30 weekly lesson plans consisting of four main activities: (1) Whole Group; (2) Small Group instruction led by a teacher with three to four children in the class; (3) Hands On Math Centers; and (4) Computer activities. Box ES.1 provides a brief, illustrative description of a Building Blocks Whole Group activity.
Sixty-nine pre-K sites housed in public schools and community-based organizations were selected throughout Brooklyn, the Bronx, Manhattan, and Queens to participate in Making
5Karen Anthony, Dale C. Farran, and Kerry G. Hofer, “Improving Young Children’s Math Learning
Through Technology,” unpublished paper (2013); Douglas H. Clements, Julie Sarama, Mary Elaine Spitler, Alissa A. Lange, and Christopher B. Wolfe, “Mathematics Learned by Young Children in an Intervention Based on Learning Trajectories: A Large-Scale Cluster Randomized Trial,” Journal for Research in Mathe-matics Education 42, 2 (2011): 127-166; Kerry G. Hofer, Mark W. Lipsey, Nianbo Dong, and Dale C. Farran, “Results of the Early Math Project — Scale‐Up Cross‐Site Results,” working paper (Nashville: Peabody Research Institute, Vanderbilt University, 2013).
Box ES.1
Brief Illustration of a Building Blocks Whole Group Activity
Ms. Rosario has both hands behind her back as she sits down on the rug with the children and asks, “Boys and girls, do you know who’s visiting today? It’s Mr. Mixup!” She pulls out a plush hand-puppet moose, and the children cheer. Ms. Rosario tells the class that Mr. Mixup has been confusing the names and parts of shapes, so they have to correct him and explain why. Mr. Mixup comes to life, saying “Hello-o-o, boys and girls!” They wave at him. “I’m so excited to teach you everything I know about shapes because I know a WHOLE lot.” Some children giggle.
Mr. Mixup gestures with one hoof to an easel displaying a drawing of a rectangle and says: “This is a square.” Voices call out, “No-o-o!” Mr. Mixup harrumphs loudly, asking what they mean. Several children raise their hands and Ms. Rosario calls on Jenni: “It’s a rectangle!” Mr. Mixup responds, “But a square has four sides, and this has four sides so this is a square.” Jenni corrects him: “It doesn’t have four equal sides. A square has four equal sides.” Mr. Mixup says, “I get it! A square has four equal sides! A square is not a rectangle.”
Ms. Rosario asks the class, “Is a square a rectangle? What did we learn about squares?” Cristiano recites, “A square is a special kind of rectangle.” Mr. Mixup interrupts, “Are you kidding me?!” The children burst into laughter. “A square is a special rectangle? I don’t get it.” Cristiano explains that a rectangle has opposite sides that are the same length and a square also has opposite sides that are the same length — they just are all the same length. Mr. Mixup claps and says, “Very good. So you said a square is a special kind of rectangle. It’s special because it has four equal sides. I got it!”

ES-4
Pre-K Count (MPC). Of these, 35 were randomly assigned to receive two years of Building Blocks (BB) and extensive professional development (the “BB-MPC” or program group), while the remaining 34 were assigned to continue their typical pre-K programming (the “pre-K-as-usual” or control group). Professional development provided to lead and assistant teachers in the BB-MPC group consisted of 11 days of training led by Building Blocks program developers and ongoing, in-classroom coaching delivered by Bank Street College of Education over two years (2013-2014 and 2014-2015) to support teachers’ implementation of the curriculum. Impacts were assessed with the cohort of children who entered pre-K in Year 2, when most teachers would have already taught a full year of the curriculum. This report presents initial findings about implementation, teacher practices, and child outcomes from the second year of implementation. Future reports will focus on the longer-term impact of this math curriculum and professional development on children’s outcomes in kindergarten.
The New York City Pre-K Environment Making Pre-K Count provides a test of an enhanced pre-K experience (BB-MPC) compared with the typical pre-K experience in New York City, which may have been different from the typical preschool experience in other Building Blocks trials. During the second year of Making Pre-K Count, the city’s recently elected mayor, Bill de Blasio, expanded full-day pre-K services to all 4-year-olds, leading to the sudden opening of tens of thousands of new pre-K slots and programs. Along with this major expansion, an emphasis on New York State Prekindergarten Foundation for the Common Core standards for math and literacy led to a heightened focus on formal instruction in pre-K classrooms. These initiatives meant more scrutiny of pre-K pro-grams and a large (and possibly growing) amount of math instruction being delivered in New York City pre-K classrooms during the time of the study.
Another difference from prior Building Blocks studies was the New York City-based sample of children, which was more heavily Hispanic (56 percent of children) and Spanish-language dominant (20 percent) than the child sample in previously published Building Blocks studies, where Hispanic children made up less than 22 percent of the samples.6 Children in the study sample also entered pre-K with slightly higher scores on executive function measures than low-income children in some other studies.7 Thus, Making Pre-K Count provides a test of
6Clements et al. (2011). 7Emily Moiduddin, Nikki Aikens, Louisa Tarullo, Jerry West, and Yange Xue, Child Outcomes and
Classroom Quality in FACES 2009 (Washington, DC: Administration for Children and Families, 2012); Ellen S. Peisner-Feinberg, Jennifer M. Schaaf, Lisa M. Hildebrandt, and Yi Pan, Children’s Outcomes and Program Quality in the North Carolina Pre‐Kindergarten Program: 2012-2013 Statewide Evaluation (Chapel Hill: Frank Porter Graham Child Development Institute, University of North Carolina, 2014).
ES-5
Building Blocks with a more diverse sample of children in an environment where more math was occurring.
Making Pre-K Count Findings to Date Teacher training and coaching were delivered with high quality and as intended. Training sessions were well attended and covered 95 percent of the training content. The amount of coaching was high, with teachers receiving around 149 minutes (out of a planned 180) of coaching weekly in Year 1 and 99 minutes (out of an expected 120) of coaching twice a month in Year 2.
Teachers were able to implement three out of the four main curricular compo-nents successfully at levels prespecified by the research team. Most of the components of Building Blocks were implemented as intended across both years, with implementation of Computer Activities slightly lower than the other three components. Teachers were able to conduct Whole Group and Hands On Math Centers on over 90 percent of the days that children were in attendance. Small Group implementation was not as strong, but still good. The Com-puter component was implemented with less consistency than intended, perhaps due to difficul-ties with technology and the challenge of supporting every child’s computer use.
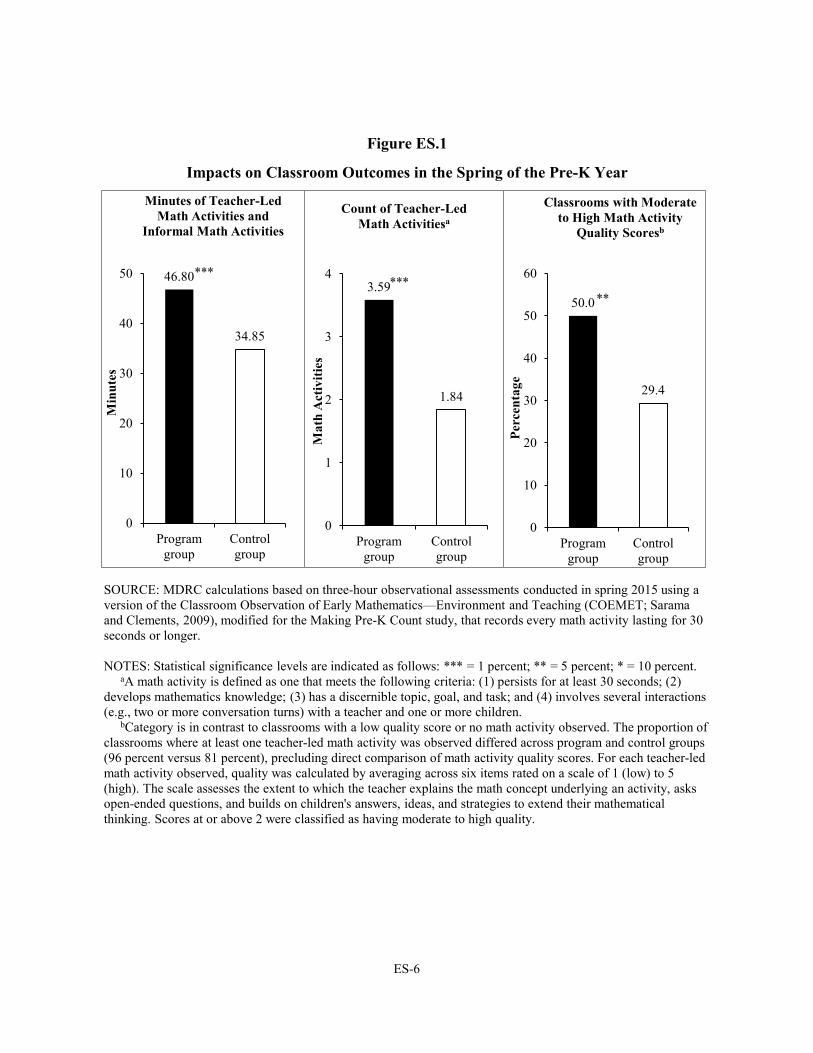
Teachers in BB-MPC classrooms spent more time on math — an additional 12 minutes of math instruction, offering an average of nearly two more math activities in a three-hour observation period. In the spring of the pre-K year, trained observers, blind to whether they were in a program group or control group classroom, recorded every observed formal or informal math activity. In comparison with control group teachers, BB-MPC teachers led nearly two more math activities per observation across a range of math content, which translated into nearly 12 more minutes of teacher-led math during this three-hour period (see Figure ES.1). These impacts were on top of what were unexpectedly high levels of math teaching in pre-K-as-usual control group classrooms, where teachers taught nearly 35 minutes of math.
The impacts of the curriculum and professional development on instructional quality were mixed. BB-MPC led to slightly higher-quality math instruction but did not affect the quality of other instruction. Observers also rated the quality of each math activity, based on the extent to which teachers extended children’s math learning or explained the math concept underlying an activity. As shown in Figure ES.1, BB-MPC teachers were 21 percentage points more likely to deliver moderate-to-high quality math than control group teachers. However, the overall quality of math instruction across both groups was low — below a rating of 2 (on a scale of 1 to 5), meaning that teachers were inconsistent in using instructional
ES-6
Figure ES.1
Impacts on Classroom Outcomes in the Spring of the Pre-K Year
46.80
34.85
0
10
20
30
40
50
Programgroup
Controlgroup
Min
utes
Minutes of Teacher-Led Math Activities and
Informal Math Activities
3.59
1.84
0
1
2
3
4
Programgroup
Controlgroup
Mat
h A
ctiv
ities
Count of Teacher-Led Math Activitiesa
50.0
29.4
0
10
20
30
40
50
60
Programgroup
Controlgroup
Perc
enta
ge
Classrooms with Moderate to High Math Activity
Quality Scoresb
SOURCE: MDRC calculations based on three-hour observational assessments conducted in spring 2015 using a version of the Classroom Observation of Early Mathematics—Environment and Teaching (COEMET; Sarama and Clements, 2009), modified for the Making Pre-K Count study, that records every math activity lasting for 30 seconds or longer.
NOTES: Statistical significance levels are indicated as follows: *** = 1 percent; ** = 5 percent; * = 10 percent.aA math activity is defined as one that meets the following criteria: (1) persists for at least 30 seconds; (2)
develops mathematics knowledge; (3) has a discernible topic, goal, and task; and (4) involves several interactions (e.g., two or more conversation turns) with a teacher and one or more children.
bCategory is in contrast to classrooms with a low quality score or no math activity observed. The proportion of classrooms where at least one teacher-led math activity was observed differed across program and control groups (96 percent versus 81 percent), precluding direct comparison of math activity quality scores. For each teacher-led math activity observed, quality was calculated by averaging across six items rated on a scale of 1 (low) to 5 (high). The scale assesses the extent to which the teacher explains the math concept underlying an activity, asks open-ended questions, and builds on children's answers, ideas, and strategies to extend their mathematical thinking. Scores at or above 2 were classified as having moderate to high quality.
******
**
ES-7
practices aimed at extending children’s mathematical thinking. Thus, BB-MPC did not lead to higher quality instruction more generally (that is, teachers extending children’s thinking by asking more open-ended questions) across all activities (math and nonmath).8
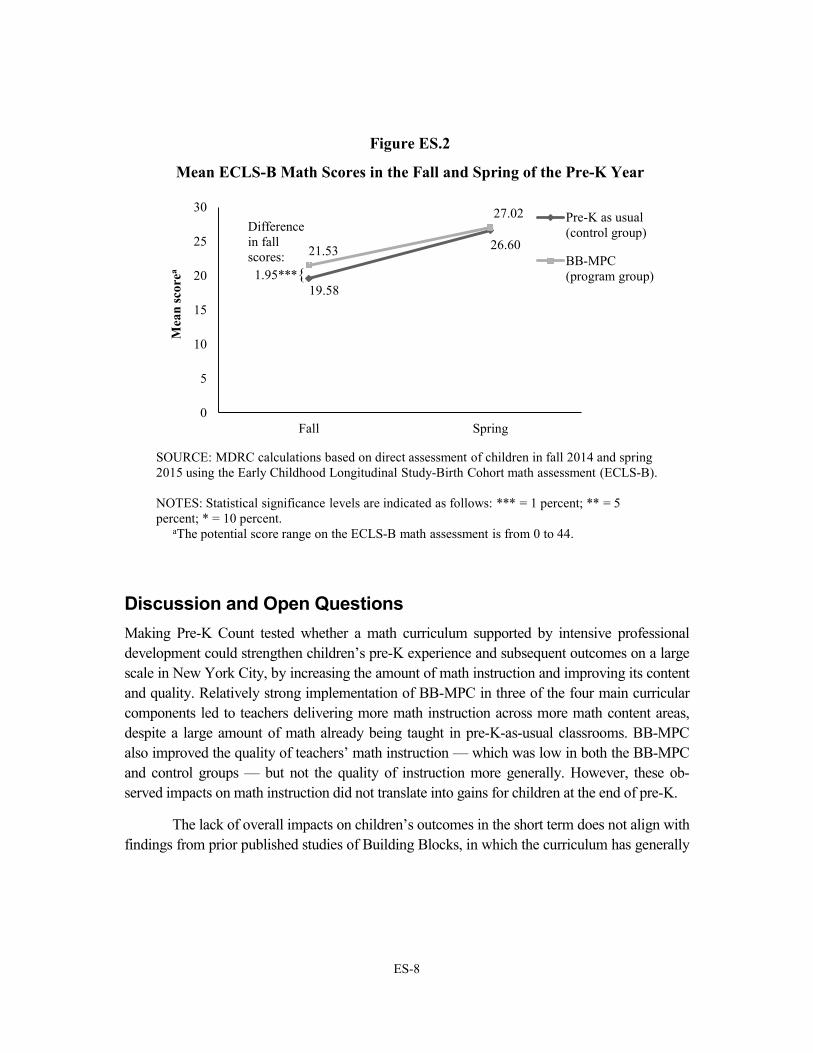
Contrary to expectations, the observed impacts on teachers’ math instruction did not lead to stronger math, language, or executive function competencies for children at the end of the pre-K year. There were no effects of BB-MPC on either of the two measures assessing children’s pre-K math competencies (the ECLS-B and Woodcock-Johnson Applied Problems subscale, both validated measures largely assessing numeracy skills), one of which is shown in Figure ES.2. Children in BB-MPC classrooms did score higher on a math assessment in the late fall than children in pre-K-as-usual classrooms, possibly because children were quickly exposed to the program as teachers in BB-MPC classrooms got off to a fast start in teaching math.9 However, these early impacts observed at the start of the school year faded by the spring as both groups learned more math, closing the gap between the two groups. There was also no evidence of consistent positive impacts on children’s skills in other areas. Children in BB-MPC classrooms did score higher on one measure of executive function (Pencil Tap), but the effect was small and was not found in the two other measures of executive function or on the measure of children’s language skills.
Some evidence suggests that children with stronger language skills at pre-K entry benefited from BB-MPC, but there was no evidence of gains for other subgroups of children. BB-MPC led to small, positive impacts on two measures of children’s math skills for children entering pre-K with higher receptive language skills — that is, the ability to understand words — but not for children entering with lower levels of such language skills.10
8Instructional quality was rated using the Classroom Assessment Scoring System (CLASS), a widely
known observational instrument. 9Early gains for children were plausible (rather than an unlucky draw in the randomization process result-
ing in unequal groups) for two reasons: Teachers were trained the previous year and could start using the Building Blocks curriculum from the first day of school, and the fall testing process extended from September into early November. Extensive analyses conducted and described in this report’s appendixes lead to the conclusion that these early differences are in fact impacts of the program. At the time of randomization, the pre-K-as-usual and BB-MPC classrooms were similar on all measured teacher math practices and classroom climate. There are no differences in test scores between the BB-MPC and pre-K-as-usual children assessed early in the fall, but there are statistically significant differences between the two groups for children assessed slightly later in the fall. Thus, the impacts on children’s fall test scores emerged and grew larger as the number of days from the start of the school year increased.
10Effect sizes for the subgroup with stronger language skills ranged from 0.16 to 0.19. Effect size is ex-pressed in terms of standard deviations and calculated as the difference between the mean values for the program group and the control group, divided by the standard deviation of the control group.
ES-8
Discussion and Open Questions Making Pre-K Count tested whether a math curriculum supported by intensive professional development could strengthen children’s pre-K experience and subsequent outcomes on a large scale in New York City, by increasing the amount of math instruction and improving its content and quality. Relatively strong implementation of BB-MPC in three of the four main curricular components led to teachers delivering more math instruction across more math content areas, despite a large amount of math already being taught in pre-K-as-usual classrooms. BB-MPC also improved the quality of teachers’ math instruction — which was low in both the BB-MPC and control groups — but not the quality of instruction more generally. However, these ob-served impacts on math instruction did not translate into gains for children at the end of pre-K.
The lack of overall impacts on children’s outcomes in the short term does not align with findings from prior published studies of Building Blocks, in which the curriculum has generally
Figure ES.2
Mean ECLS-B Math Scores in the Fall and Spring of the Pre-K Year
19.58
26.6021.53
27.02
0
5
10
15
20
25
30
Fall Spring
Mea
n sc
orea
Pre-K as usual(control group)
BB-MPC(program group)
Difference in fall scores: |
1.95***{
SOURCE: MDRC calculations based on direct assessment of children in fall 2014 and spring2015 using the Early Childhood Longitudinal Study-Birth Cohort math assessment (ECLS-B).
NOTES: Statistical significance levels are indicated as follows: *** = 1 percent; ** = 5 percent; * = 10 percent.
aThe potential score range on the ECLS-B math assessment is from 0 to 44.
ES-9
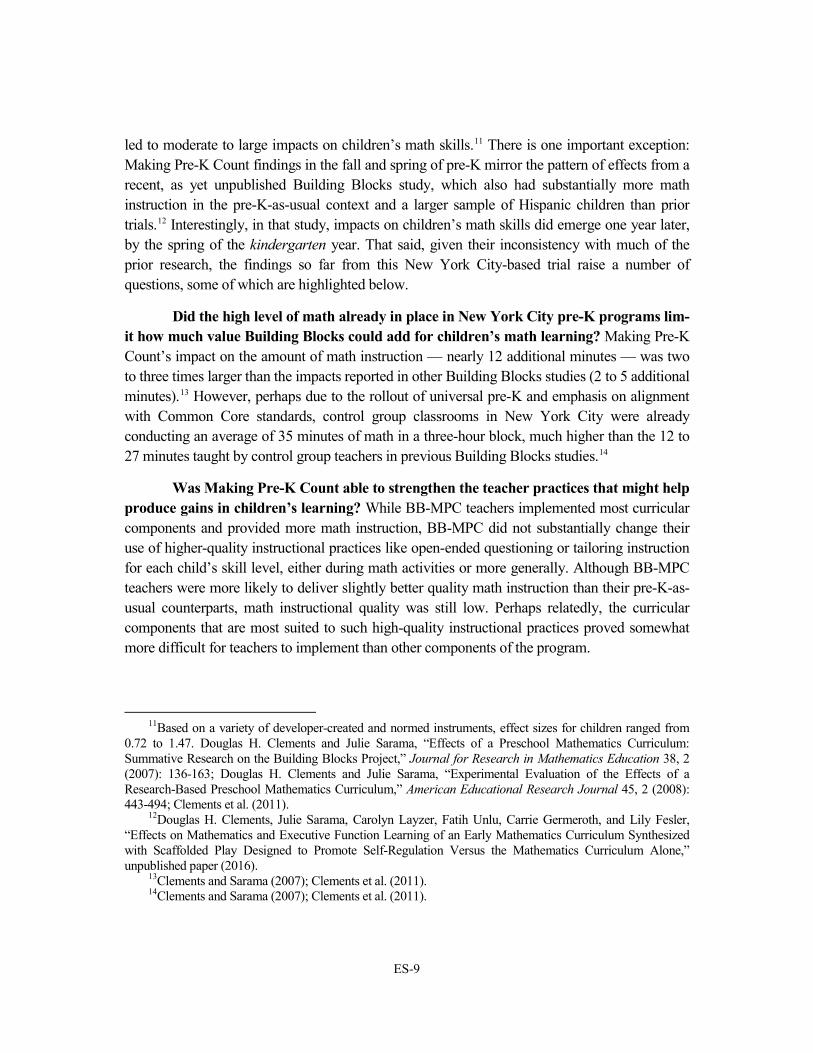
led to moderate to large impacts on children’s math skills.11 There is one important exception: Making Pre-K Count findings in the fall and spring of pre-K mirror the pattern of effects from a recent, as yet unpublished Building Blocks study, which also had substantially more math instruction in the pre-K-as-usual context and a larger sample of Hispanic children than prior trials.12 Interestingly, in that study, impacts on children’s math skills did emerge one year later, by the spring of the kindergarten year. That said, given their inconsistency with much of the prior research, the findings so far from this New York City-based trial raise a number of questions, some of which are highlighted below.
Did the high level of math already in place in New York City pre-K programs lim-it how much value Building Blocks could add for children’s math learning? Making Pre-K Count’s impact on the amount of math instruction — nearly 12 additional minutes — was two to three times larger than the impacts reported in other Building Blocks studies (2 to 5 additional minutes).13 However, perhaps due to the rollout of universal pre-K and emphasis on alignment with Common Core standards, control group classrooms in New York City were already conducting an average of 35 minutes of math in a three-hour block, much higher than the 12 to 27 minutes taught by control group teachers in previous Building Blocks studies.14
Was Making Pre-K Count able to strengthen the teacher practices that might help produce gains in children’s learning? While BB-MPC teachers implemented most curricular components and provided more math instruction, BB-MPC did not substantially change their use of higher-quality instructional practices like open-ended questioning or tailoring instruction for each child’s skill level, either during math activities or more generally. Although BB-MPC teachers were more likely to deliver slightly better quality math instruction than their pre-K-as-usual counterparts, math instructional quality was still low. Perhaps relatedly, the curricular components that are most suited to such high-quality instructional practices proved somewhat more difficult for teachers to implement than other components of the program.
11Based on a variety of developer-created and normed instruments, effect sizes for children ranged from
0.72 to 1.47. Douglas H. Clements and Julie Sarama, “Effects of a Preschool Mathematics Curriculum: Summative Research on the Building Blocks Project,” Journal for Research in Mathematics Education 38, 2 (2007): 136-163; Douglas H. Clements and Julie Sarama, “Experimental Evaluation of the Effects of a Research-Based Preschool Mathematics Curriculum,” American Educational Research Journal 45, 2 (2008): 443-494; Clements et al. (2011).
12Douglas H. Clements, Julie Sarama, Carolyn Layzer, Fatih Unlu, Carrie Germeroth, and Lily Fesler, “Effects on Mathematics and Executive Function Learning of an Early Mathematics Curriculum Synthesized with Scaffolded Play Designed to Promote Self-Regulation Versus the Mathematics Curriculum Alone,” unpublished paper (2016).
13Clements and Sarama (2007); Clements et al. (2011). 14Clements and Sarama (2007); Clements et al. (2011).

ES-10
How might the particular nature of the pre-K population in New York City have influenced these findings? Making Pre-K Count tested the effects of Building Blocks on a diverse sample of children that may have differed from samples in previous Building Blocks studies. The study included more children of Hispanic origin (56 percent) and more children who entered pre-K speaking mostly Spanish (20 percent) than prior published studies of Building Blocks. Children in the Making Pre-K Count study also appeared, on average, to have entered pre-K with higher executive function scores than low-income children in some other studies.15 It is unclear what role these sample characteristics played in the observed pattern of findings.
Does this study fully assess, with the math measures collected in pre-K, children’s deep math learning? Building Blocks targets children’s math learning across a number of content areas, from numeracy and operations to geometry and spatial skills. The math measures used in Making Pre-K Count (the ECLS-B and Woodcock-Johnson Applied Problems) are validated measures focused mostly on children’s numeracy; a measure assessing more geometry may have captured differences in math learning between BB-MPC and pre-K-as-usual children. Additionally, the Building Blocks curriculum is designed to change the ways children think about and understand math, which may help children navigate more complex math tasks in kindergarten with facility (consistent with the data discussed above from a more recent Building Blocks trial).16 Making Pre-K Count data from the kindergarten year, including a more compre-hensive assessment of children’s math competencies, will help inform this question about the longer-term impact of Building Blocks.
What’s Next Future reports will detail further analyses designed to address these open questions and present findings on the impact of Building Blocks on children’s math, language, and executive function skills in kindergarten, as well as the impact of an add-on math initiative called High 5s, which randomly assigned children in the Making Pre-K Count program group to receive small-group math club instruction in kindergarten. While a number of questions remain from these initial pre-K findings, Making Pre-K Count provides important information to the field on the current preschool environment and how to scale up programs while retaining a high level of quality. Additional analysis and follow-up in kindergarten will provide further evidence on how preschool can best deliver on its promise of making a difference for low-income children’s school readiness and possibly beyond.
15Moiduddin et al. (2012); Peisner-Feinberg, Schaaf, Hildebrandt, and Pan (2014). 16Clements et al. (2016).

1
Chapter 1
Introduction
One of the pressing concerns facing the United States is the disparity in school outcomes between poorer children and their higher-income peers, leading to lower rates of high school completion and decreased lifetime earnings.1 To address such disparities, policymakers and researchers have increasingly focused on intervening during the early years of a child’s life. This focus is motivated by small-scale studies of “model programs” that demonstrated large and enduring impacts of preschool programming.2 However, existing preschool programs — implemented on a larger scale — do not always appear to deliver on the promise of these well-known highly controlled studies, sometimes producing substantially smaller effects.3 Moreover, often the effects from a year in a present-day preschool program have not been found to persist, as the gains accrued during preschool often dissipate once children enter elementary school. Therefore, questions remain about how to improve the quality of existing early childhood programs on a large scale as a critical early step to low-income children’s long-term success.
Making Pre-K Count is the first study of the Robin Hood Early Childhood Research Initiative, which was designed to identify and to rigorously test promising early childhood interventions. The initiative is a partnership between Robin Hood, one of New York City’s leading antipoverty organizations, and MDRC, a nonprofit, nonpartisan education and social policy research organization. Making Pre-K Count is also supported with lead funding from the Heising-Simons Foundation, the Overdeck Family Foundation, and the Richard W. Goldman Family Foundation.
Faced with the challenge of how to improve the quality of instruction in preschool, MDRC and the Robin Hood Foundation and its partners placed a bet on early math learning by launching two complementary initiatives: Making Pre-K Count and the companion High 5s study, designed to reinforce math skills in kindergarten. This effort, conducted in collaboration with Bank Street College of Education and RTI International, builds on research demonstrating that preschoolers with strong early math skills do better in both math and reading achievement in their elementary school years.4 Furthermore, when those math skills are sustained across the
1Heckman (2006); Hernandez (2011); Reardon (2011); Warren (2016). 2Berrueta-Clement (1984); Campbell et al. (2002); White House Council of Economic Advisers (2014). 3Duncan and Magnuson (2013). 4Duncan et al. (2007).
2
early elementary years, students are more likely to graduate from high school and to attend college, which are critical milestones on the path out of poverty.5
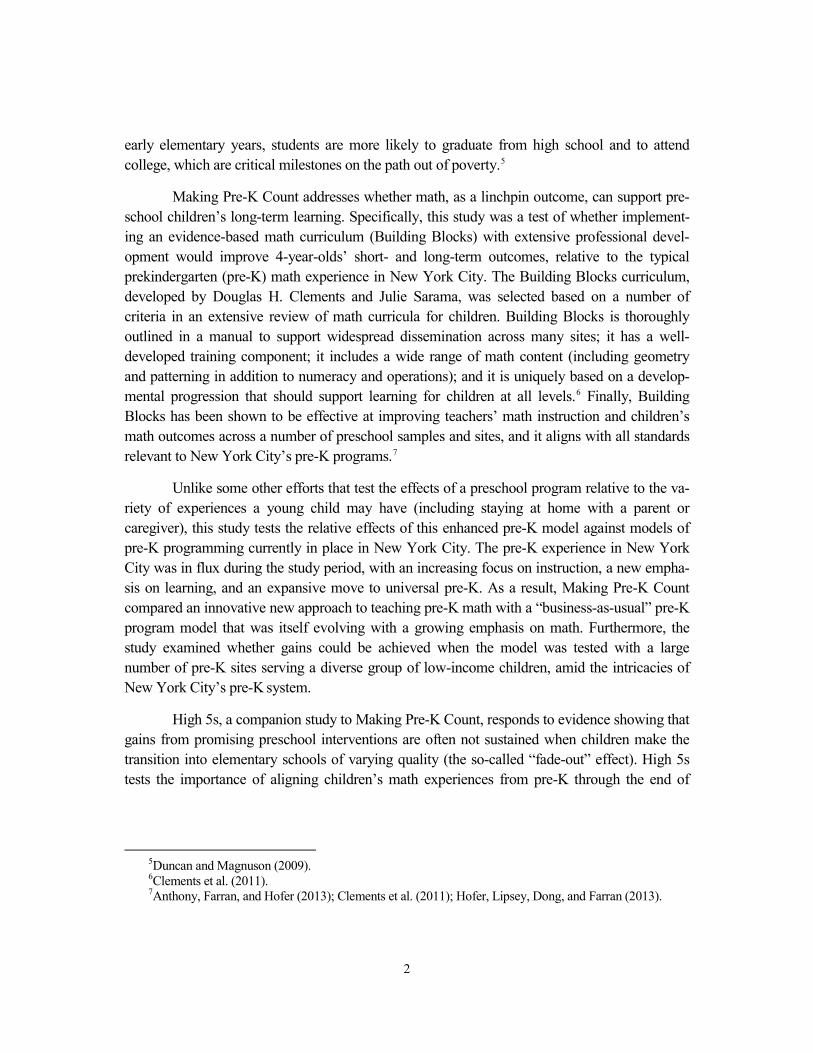
Making Pre-K Count addresses whether math, as a linchpin outcome, can support pre-school children’s long-term learning. Specifically, this study was a test of whether implement-ing an evidence-based math curriculum (Building Blocks) with extensive professional devel-opment would improve 4-year-olds’ short- and long-term outcomes, relative to the typical prekindergarten (pre-K) math experience in New York City. The Building Blocks curriculum, developed by Douglas H. Clements and Julie Sarama, was selected based on a number of criteria in an extensive review of math curricula for children. Building Blocks is thoroughly outlined in a manual to support widespread dissemination across many sites; it has a well-developed training component; it includes a wide range of math content (including geometry and patterning in addition to numeracy and operations); and it is uniquely based on a develop-mental progression that should support learning for children at all levels.6 Finally, Building Blocks has been shown to be effective at improving teachers’ math instruction and children’s math outcomes across a number of preschool samples and sites, and it aligns with all standards relevant to New York City’s pre-K programs.7
Unlike some other efforts that test the effects of a preschool program relative to the va-riety of experiences a young child may have (including staying at home with a parent or caregiver), this study tests the relative effects of this enhanced pre-K model against models of pre-K programming currently in place in New York City. The pre-K experience in New York City was in flux during the study period, with an increasing focus on instruction, a new empha-sis on learning, and an expansive move to universal pre-K. As a result, Making Pre-K Count compared an innovative new approach to teaching pre-K math with a “business-as-usual” pre-K program model that was itself evolving with a growing emphasis on math. Furthermore, the study examined whether gains could be achieved when the model was tested with a large number of pre-K sites serving a diverse group of low-income children, amid the intricacies of New York City’s pre-K system.
High 5s, a companion study to Making Pre-K Count, responds to evidence showing that gains from promising preschool interventions are often not sustained when children make the transition into elementary schools of varying quality (the so-called “fade-out” effect). High 5s tests the importance of aligning children’s math experiences from pre-K through the end of
5Duncan and Magnuson (2009). 6Clements et al. (2011). 7Anthony, Farran, and Hofer (2013); Clements et al. (2011); Hofer, Lipsey, Dong, and Farran (2013).
3
Box 1.1
High 5s Math Clubs
The High 5s program is designed to provide a continued emphasis on math skills for kinder-garten students who experienced the Making Pre-K Count math intervention in pre-K. In High 5s, groups of about four kindergarten students meet three times a week with a facilitator trained in the program by Bank Street College of Education. Most facilitators have a bache-lor’s degree and all have had previous experience working with small children, but the average amount of formal teaching experience was 1.5 years at the start of the program. Facilitators provide students with targeted instruction as they play fun, engaging math games.
High 5s was developed in collaboration with the University of Michigan, with input from the developers of the Building Blocks math curriculum used in Making Pre-K Count. Activities focus on four key mathematical areas — counting, composition of numbers (understanding that numbers are composed of smaller numbers), early addition and subtraction, and geometry. The program is designed to provide enrichment, not remediation, and to provide students with continued exposure to high-quality math instruction during the kindergarten year. Students attending a public school participating in the Making Pre-K Count project who received the intervention during pre-K were eligible to participate in the High 5s program. Once parental permission was obtained, eligible students were randomly assigned within schools either to receive the High 5s program or to a “business as usual” control group.
kindergarten. Math-focused small-group “clubs” were offered thrice weekly to some of the kindergartners who had received the Making Pre-K Count math curriculum the year before. (See Box 1.1 for more detail about High 5s.)
Together, Making Pre-K Count and High 5s address the question of how to improve the quality of existing pre-K programs on a large scale to improve long-term outcomes for children growing up in poverty. The question of scale is particularly salient for Making Pre-K Count, which took place in more than 170 classrooms in one of the nation’s largest pre-K programs, and during a period of substantial pre-K redesign and massive expansion that more than doubled the number of full-day pre-K seats.
This first report presents initial implementation findings and impacts from the pre-K year of Making Pre-K Count. In short, findings show that the Building Blocks math curriculum and associated professional development were successfully delivered as intended in classrooms, with strong training and coaching of teachers and good implementation of most of the math program’s core components. Pre-K teachers in the program delivered more math instruction across more math content areas (that is, in numbers, operations, and geometry) than the typical pre-K teacher in New York City. These gains were on top of a surprisingly high amount of math — almost 35 minutes of instruction in a three-hour observation period — in New York City’s

4
pre-K-as-usual classrooms. However, the impact of this program on the quality of teachers’ instruction was mixed. While all teachers’ math instruction levels were on average somewhat low, teachers in the program group delivered slightly higher-quality math instruction, although the quality of instruction offered throughout the day did not improve overall. Moreover, there were no statistically significant overall impacts on children’s math learning, language, or self-regulation, relative to children in control group classrooms that did not receive Building Blocks and professional development. Instead, both groups of children made progress in math knowledge, possibly because of the substantial emphasis placed on math in both groups of classrooms.
These initial findings, in which there are no observed impacts of the curriculum in pre-K, stand in contrast to previous research and raise a number of questions about the New York City context, measurement, and the sample. Future reports will examine these open questions in greater detail and will investigate whether effects might differ in kindergarten and as a result of enrollment in the supplemental High 5s kindergarten program.
A Focus on Math as a Route to Long-Term Child Gains A key feature of the Making Pre-K Count approach is a focus on preschool children’s math competencies as a foundational outcome that may be a pathway to improving a broader set of outcomes for children into elementary school. Children’s early math competencies are a compelling target for three key reasons.
First, math is viewed as a way to improve a broad set of children’s competencies in ad-dition to math, including language, early reading, and a set of skills known as executive func-tion that supports children’s self-regulation.8 There is a growing conviction among experts that math may build language skills because math learning expands and enriches children’s vocabu-lary; for example, when children learn about comparisons such as “more” and “less.” Strong math instruction requires children to use language to express and to justify mathematical thinking.9 In addition, the computational demands of math may build children’s working memory and problem-solving skills, both components of children’s executive function.10 This view is supported by carefully conducted though nonexperimental research showing that preschoolers with strong early math skills continue to do well later on, not only in math but also
8Executive function, also known as cognitive regulation, in early childhood is made up of working
memory (or the ability to keep a number of pieces of information in the mind at once), cognitive flexibility (or the ability to flexibly shift between pieces of information), and inhibition (or the ability to stop or repress an immediate response). See Diamond (2013).
9Ginsburg, Lee, and Boyd (2008). 10Diamond (2013); Duncan et al. (2007).

5
in reading; indeed, early math skills appear to equal early reading skills in predicting later reading ability.11 Of all preschool competencies examined in that research, which include math, reading, attentional skills, and social behavior, math has been found to be the most important in predicting how children perform later on standardized tests of reading and math achievement.12 Furthermore, math competencies predict outcomes not just in later childhood but also into adulthood, with strong and sustained math skills in elementary school predicting higher rates of high school completion and college enrollment.13 Thus, math may be a pathway to bolstering numerous child outcomes across time.
Second, young children’s math competencies can be improved by training preschool teachers. A number of preschool curricula have been developed that involve engaging and playful hands-on math learning activities. These curricula were created to allow teachers to implement them while simultaneously managing a classroom of up to 20 children. In fact, studies of these preschool math curricula, which have mostly been conducted by the researchers who developed them and with relatively modest numbers of teachers, have found moderate to large effects on teachers’ math instruction and children’s math outcomes.14 These effects have been found across a number of different studies (with varying samples of children), all of which used rigorous designs to measure program impacts.15 The studies provide strong evidence that it is possible to consistently improve teachers’ math instruction and children’s math skills in smaller, more controlled tests, where little math instruction was in place before the intervention was implemented.16
Math is a compelling mark for one final reason: Math instruction has often been under-emphasized in preschool. Prior work suggests that preschool teachers place the lowest priority on math instruction for young children, compared with addressing children’s social and emo-tional development and preliteracy skills.17 In other words, preschool teachers are typically focused on ensuring that young children get along with others, engage in the group context of preschool without disrupting classroom activities, and, in some cases, learn the basics of how to read. For example, in a 2005 study that convened focus groups with preschool teachers and
11Duncan et al. (2007). 12Duncan et al. (2007). 13Duncan and Magnuson (2009). 14Based on a variety of developer-created and normed instruments, effect sizes for children ranged from
0.40 to 1.47, and effect sizes for classrooms ranged from 1.02 to 1.25. See Clements and Sarama (2007, 2008); Clements et al. (2011); Lewis Presser, Clements, Ginsburg, and Ertle (2012). See Box 2.2 in Chapter 2 for more information on effect sizes.
15Clements and Sarama (2007, 2008); Clements et al. (2011); Hofer, Lipsey, Dong, and Farran (2013); Lewis Presser, Clements, Ginsburg, and Ertle (2012).
16Clements and Sarama (2007, 2008); Clements et al. (2011); Farran and Bilbrey (2014); Hofer, Lipsey, Dong, and Farran (2013); Klein et al. (2008).
17Lobman, Ryan, and McLaughlin (2005).
6
professional development providers, researchers found that they had “no substantive ideas about how teachers could be prepared to teach [math].”18 In another review of math instruction observed in preschool classrooms, researchers found that teachers focused on simple aspects of math, such as the names of shapes and numbers from 1 to 20, without incorporating the richness of mathematical reasoning, inferences, and complex vocabulary that characterize many of the most successful math curricula.19 Additionally, in previous studies of preschool interventions that took place in a variety of contexts, the amount of math found in typical preschool class-rooms ranged from less than 10 minutes to 27 minutes during the course of a morning observa-tion.20 Thus, providing teachers with training in delivering more math instruction might repre-sent a substantial shift in children’s preschool experiences compared with what the typical preschool has provided.
Making Pre-K Count The Making Pre-K Count study was designed to rigorously test the importance of early math competencies by implementing the Building Blocks-Making Pre-K Count (BB-MPC) interven-tion, which included the Building Blocks math curriculum along with extensive training and in-classroom coaching (provided by Bank Street College of Education), in New York City pre-K classrooms. As stated above, the Building Blocks curriculum was selected based on a thorough review of prior evidence that showed it to be effective across a range of teacher and child populations. At the outset of the study, MDRC worked closely with the Division of Early Childhood Education at the New York City Department of Education (DOE), the Administra-tion for Children’s Services’ Division of Child Care and Head Start, and other early childhood professionals to understand the feasibility of implementing Building Blocks in New York City. In a preliminary needs assessment, MDRC researchers observed limited instances of math instruction at many of the pre-K sites they visited and determined that Building Blocks could provide additional value above New York City’s math instruction at many of its pre-K pro-grams.
The typical New York City pre-K math experience changed as the study rolled out. In the 2011-2012 school year, DOE implemented the Prekindergarten Foundation for the Common Core in pre-K programs citywide, in order to promote pre-K through twelfth-grade alignment, leading to a new focus on the Common Core math and literacy standards. In 2014, the introduc-tion of universal pre-K by the recently elected Mayor Bill de Blasio led to the sudden opening
18Lobman, Ryan, and McLaughlin (2005), p. 5. 19Ginsburg, Lee, and Boyd (2008). 20Clements and Sarama (2008); Clements et al. (2011); Farran and Bilbrey (2014); Klein et al. (2008).

7
of many new pre-K seats and increased attention to pre-K in New York City. The role of these contextual shifts in the findings is discussed in later chapters of this report.
Implementation of BB-MPC took place over two school years (2013-2014 and 2014-2015); a yearlong pilot study in eight pre-K sites was also conducted in the academic year preceding the study. To provide the strongest possible evidence about the effects of BB-MPC, the study used a randomized controlled trial, considered the “gold standard” in program evalua-tion. Pre-K centers were offered the BB-MPC program or assigned to a control group using a lottery-like process. A sample of 69 pre-K sites housed in public schools and community-based organizations (including Head Start centers) were selected from low-income community school districts throughout Brooklyn, the Bronx, Manhattan, and Queens. Thirty-five of the 69 pre-K sites were assigned to receive the math curriculum, training, and coaching (the BB-MPC group) over two years, while the other 34 were assigned to continue their typical programming (the “pre-K-as-usual” control group). The study therefore is a differential test in that it assesses the impact of BB-MPC versus pre-K as usual in early childhood settings in New York City, and not against a “no preschool” control group. Although teachers in the BB-MPC group implemented the curriculum over two years, impacts on child outcomes were intentionally assessed on children served in the second year, due to the expectation that teachers would need a year to become familiar with the program before it could be implemented well. Outcomes for children were to be assessed during the pre-K year and again during the kindergarten year, one year after children experienced the Building Blocks curriculum in their pre-K classrooms.
This report provides early results about teachers and children at the end of pre-K from data collected during the second year of Making Pre-K Count implementation. Longer-term follow-up through kindergarten on this sample of children and sites, as well as the extension of math into kindergarten through High 5s, will provide more complete data about the effects of Making Pre-K Count.
Organization of This Report This report is organized as follows:
● Chapter 2 provides background on the study, including details on the con-text in which this study took place in New York City, the Building Blocks program and the professional development support provided under Making Pre-K Count, the theory of change underlying the study, and the sites and sample of children as well as the random assignment process for assessing impact.
● Chapter 3 describes findings on the implementation of BB-MPC.

8
● Chapter 4 presents the short-term impacts of BB-MPC on teachers’ practic-es and children’s outcomes in pre-K.
● Chapter 5 concludes with a summary of the findings and the open questions that the findings raise.

9
Chapter 2
The New York City Context, Building Blocks Curriculum and Professional
Development Model, and Study Design
This chapter presents background information about the Making Pre-K Count program and study. Given that Making Pre-K Count estimates the impacts of a new program relative to what was already occurring in prekindergarten (pre-K) programs in New York City, understanding the New York City context during the time of this study is critical. Making Pre-K Count operated during a time of renewed focus on preacademic standards and a rapid expansion of pre-K slots in the New York City system. That unique context may have had implications for the math instruction being provided in “pre-K-as-usual” classrooms and the ability to detect program impacts.
The program tested in Making Pre-K Count comprises the Building Blocks math cur-riculum along with intensive professional development (the program is referred to as BB-MPC). As described further below, the Building Blocks curriculum was selected given its evidence of effectiveness on teacher and child outcomes, and it was supported — as had been done in prior trials of Building Blocks — with strong teacher training and coaching. It was posited that the curriculum and professional development would lead to changes in teacher practice and, subsequently, improvement in children’s math, language, and executive function outcomes. The curriculum and professional development were rigorously tested through a randomized con-trolled trial across a large, diverse sample of pre-K programs serving low-income children in New York City.
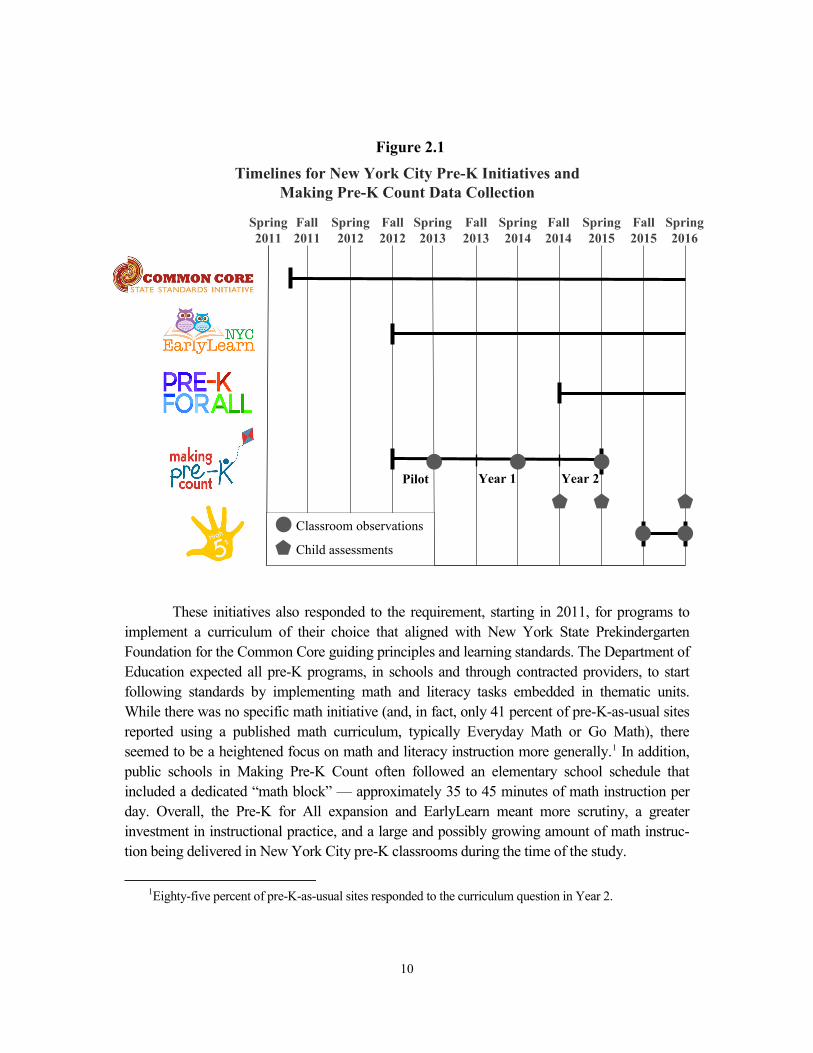
The New York City Pre-K Environment The two years of BB-MPC implementation (along with a yearlong pilot preceding the study) took place during a time of major change for New York City pre-K, with a particular focus on math and reading standards. (Figure 2.1 shows the timelines of three city initiatives as well as the present study.) Beginning in 2012, New York City consolidated funding streams for its pre-K sites via the EarlyLearn initiative, which in effect established consistent program quality requirements across all sites. And in January 2014, a new mayor took office, having cam-paigned on the promise of full-day pre-K for all 4-year-old children. In the second year of BB-MPC implementation (2014-2015 — which was also the year that impacts on children were assessed), Mayor Bill de Blasio’s Pre-K for All initiative expanded full-day pre-K from a system serving 19,000 children in 2013 to one serving 53,000 children in 2014.
10
These initiatives also responded to the requirement, starting in 2011, for programs to implement a curriculum of their choice that aligned with New York State Prekindergarten Foundation for the Common Core guiding principles and learning standards. The Department of Education expected all pre-K programs, in schools and through contracted providers, to start following standards by implementing math and literacy tasks embedded in thematic units. While there was no specific math initiative (and, in fact, only 41 percent of pre-K-as-usual sites reported using a published math curriculum, typically Everyday Math or Go Math), there seemed to be a heightened focus on math and literacy instruction more generally.1 In addition, public schools in Making Pre-K Count often followed an elementary school schedule that included a dedicated “math block” — approximately 35 to 45 minutes of math instruction per day. Overall, the Pre-K for All expansion and EarlyLearn meant more scrutiny, a greater investment in instructional practice, and a large and possibly growing amount of math instruc-tion being delivered in New York City pre-K classrooms during the time of the study.
1Eighty-five percent of pre-K-as-usual sites responded to the curriculum question in Year 2.
Fall 2011
Year 2
Timelines for New York City Pre-K Initiatives and Making Pre-K Count Data Collection
Spring 2012
Spring 2011
Fall 2012
Spring 2013
Fall 2013
Spring 2014
Fall 2014
Spring 2015
Spring 2016
Fall 2015
Classroom observations
Child assessments
Year 1Pilot
Figure 2.1

11
As explained in more detail later in the report, this strong focus on math is borne out in findings from observational data collected for the Making Pre-K Count study. On average, by the springs of 2014 and 2015, the classrooms in the Making Pre-K Count study that did not receive the intervention were observed delivering over half an hour of teacher-led math instruc-tion and nearly two teacher-led math activities in a three-hour observation period. This high-lights the ways that the environment in which BB-MPC was implemented was much different from that in prior trials of the Building Blocks curriculum, where teachers had been teaching as little as 12 minutes of math in a three-hour observation period.2 This difference is striking considering the research described earlier, which found that preschool teachers tend to place the lowest priority on teaching early math skills to children (compared with social-emotional or literacy skills), and considering that observations in study classrooms in spring 2013 (before sites received the intervention) suggested that much less math instruction was occurring.3 It also means that this study provides a unique addition to the compilation of studies about the Build-ing Blocks program — one in which the pre-K environment was focusing increasingly on math instruction.
Building Blocks Math Curriculum The Building Blocks pre-K math curriculum, developed by Douglas H. Clements and Julie Sarama, is a multifaceted sequence of learning activities targeting numeric or quantitative and geometric or spatial topics laid out across 30 weeks in an easy-to-read, scripted manual. Curricular activities are organized based on the natural progressions by which children learn and develop math competencies over time, or their learning trajectories.4 Children generally follow the same pathway and gain skills in the same order, albeit at different rates. For example, children learn to count up from the number one (“1, 2, 3, … 10”) before they learn to “count on” (count up to a number from a starting value other than one, such as “5, 6, 7, ... 10”).
There is also an implicit focus on language in Building Blocks. The curriculum encour-ages children to articulate their thinking by directing teachers to ask such questions as, “How do you know?” (See Box 2.1 for an illustrative example of a Building Blocks Whole Group activity focused on questioning and eliciting children’s reasoning.) This allows teachers to
2Sarama et al. (2008). 3A future report will delve further into the trends in math instruction over time. 4“Learning trajectories are the observable, natural developmental progressions in learning. . . . [They] have
three parts: a mathematical goal, a developmental path along which children develop to reach that goal, and a set of activities matched to each of the levels of thinking in that path that help children develop the next higher level of thinking” (Clements and Sarama, 2013, p. T17). For more information, see Clements and Sarama (2004).

12
Box 2.1
Illustration of a Building Blocks Whole Group Activity Focused on Questioning and Eliciting Children’s Reasoning
Ms. Rosario has both hands behind her back as she sits down on the rug with the children and asks, “Boys and girls, do you know who’s visiting today? It’s Mr. Mixup!” She pulls out a plush hand-puppet moose, and the children cheer. Ms. Rosario tells the class that Mr. Mixup has been confusing the names and parts of shapes, so they have to correct him and explain why. Mr. Mixup comes to life, saying “Hello-o-o, boys and girls!” They wave at him. “I’m so excited to teach you everything I know about shapes because I know a WHOLE lot.” Some children giggle.
Mr. Mixup gestures with one hoof to an easel displaying a drawing of a rectangle and says: “This is a square.” Voices call out, “No-o-o!” Mr. Mixup harrumphs loudly, asking what they mean. Several children raise their hands and Ms. Rosario calls on Jenni: “It’s a rectangle!” Mr. Mixup responds, “A square has four sides, and this has four sides so this is a square.” Jenni corrects him: “It doesn’t have four equal sides. A square has four equal sides.” Mr. Mixup says, “Hmm, I’m pretty sure it has four equal sides. Look they’re all equal!” as he points to each corner. Vincent shakes his head calling out, “Those aren’t the sides! Those are the corners!” His neighbor agrees, “Yeah the square corners!”
Mr. Mixup puts his hoofs on his face. “What? Corners? Square corners? I’m a moose con-fused! Can you help me?” Ms. Rosario asks Gabby to identify the sides. Mr. Mixup says, “Oh I’m such a silly moose. Those are the sides. Thank you, Gabby.” Mr. Mixup asks, “Now who, where, when, what were you talking about with square corners? You said this isn’t a square!” Henry calls out: “No! Square corners just mean corners that look like this!” and he puts up both pointer fingers and thumbs to create two Ls. Other children mimic his movement. Mr. Mixup looks down at his hoofs and shrugs, “No wonder I didn’t know what a square corner is! I don’t have fingers!” Children laugh. Ms. Rosario asks, “What else do we call square cor-ners?” Cristiano raises his hand: “Right angles!”
Ms. Rosario asks Jenni to repeat what she said earlier about the sides: “A square has equal sides. But look, those sides are longer than those sides. It’s a rectangle.” Mr. Mixup says, “Eureka! I get it. A square has four equal sides and four corners! A square is not a rectangle.” Ms. Rosario asks the class, “Is a square a rectangle? What did we learn about squares?” Cristiano recites, “A square is a special kind of rectangle.” Mr. Mixup interrupts, “Are you kidding me?!” The children burst into laughter. “A square is a special rectangle? I don’t get it.” Cristiano explains that a rectangle has opposite sides that are the same length and a square also has opposite sides that are the same length — they just are all the same length. Mr. Mixup claps and says, “Very good. So you said a square is a special kind of rectangle. It’s special because it has four equal sides. I got it!”

13
better understand children’s individual levels of math knowledge and understanding. Moreover, teachers are charged with being keen observers of how children respond during math activities to determine each child’s current competency level. Teachers can then use that information to differentiate instruction for individual children by choosing alternative curriculum activities or by adapting them for each child’s skill level and need.
The curriculum is structured around weekly lesson plans consisting of four main in-structional components: Whole Group, Small Group, Hands On Math Centers, and Computer. (Table 2.1 provides definitions of these components, as well as the implementation benchmarks used in the study to identify programs in need of additional support and technical assistance, discussed further below.) The curriculum specifies that Whole Group and Hands On Math Centers should be conducted daily, and all children should participate in Small Group and Computer activities weekly. Each week during Small Group, teachers are expected to record their observations of children’s work on the Small Group Record Sheet. Small Group Record Sheets are a form of formative assessment, which is a type of assessment that teachers can perform during day-to-day activities to aid them in planning upcoming lessons and differentiat-ing instruction. Computer activities are designed to adjust the content of math games automati-cally based on children’s performance within each activity and to allow teachers to monitor and to assess children’s progress. Exploratory analyses in previous studies of Building Blocks suggest that the number of computers “on and working” predicts children’s math gains.5 Teachers are expected to access the management system for the Computer component, Con-nectED, as well as to send home a Family Letter on a weekly basis.
All the components are well documented in the teacher’s manual, which lays out in a direct manner weekly schedules and activities for teachers, as well as suggestions for narrowing the scope of or extending mathematical concepts to make the same activities easier or harder, respectively, depending on the mathematic skill level of a child. The computer activities and some math vocabulary for the lessons in the manual are available in both English and Spanish to help support the dual-language needs of New York City preschoolers.
Building Blocks was selected largely because several experimental tests consistently found positive impacts, with large effects (ranging from 0.59 to 1.07) on children’s math outcomes, across multiple samples.6 (See Box 2.2 for a definition of effect size.) These prior studies tested Building Blocks in the context of ongoing professional development over two years, including training workshops, in‐classroom mentoring by coaches, and continued support
5Clements et al. (2011). 6Clements and Sarama (2007, 2008); Clements et al. (2011); Hofer et al. (2011). As described in Box 2.2,
these effect sizes for child outcomes are considered to be large.
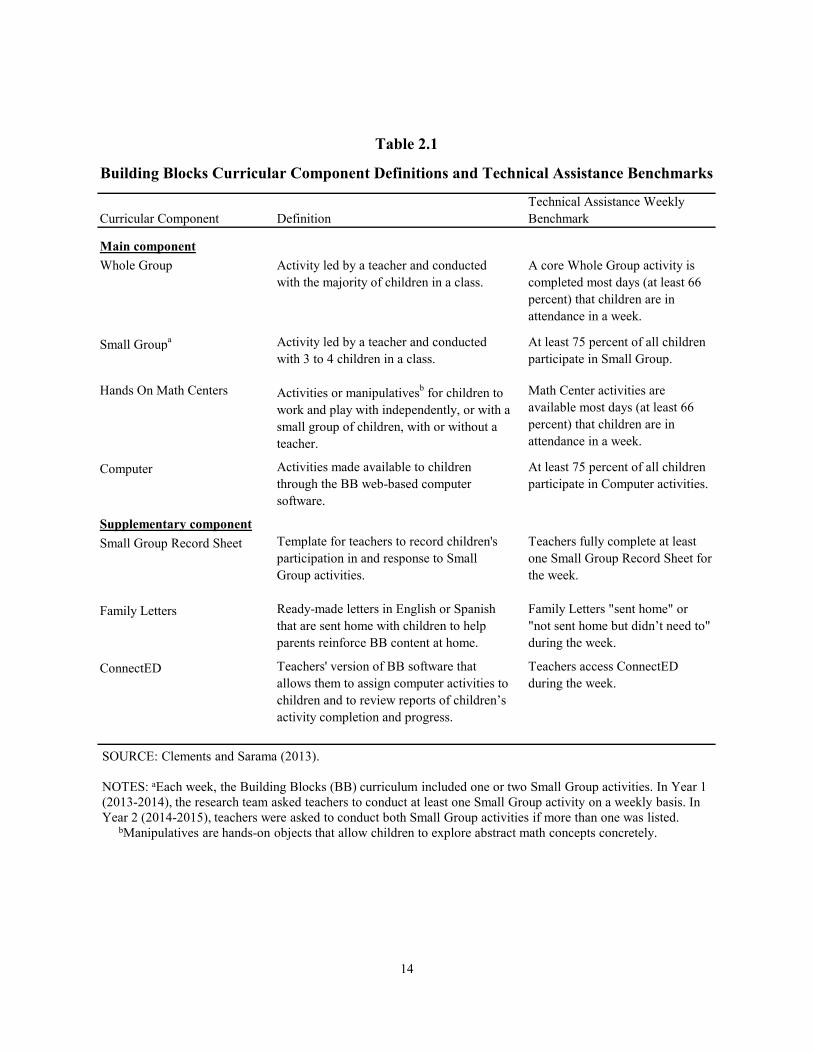
14
Curricular Component DefinitionTechnical Assistance Weekly Benchmark
Main componentWhole Group
Small Groupa
Computer
Supplementary componentSmall Group Record Sheet
Family Letters
ConnectED
Table 2.1
Building Blocks Curricular Component Definitions and Technical Assistance Benchmarks
Activity led by a teacher and conducted with the majority of children in a class.
Activity led by a teacher and conducted with 3 to 4 children in a class.
A core Whole Group activity is completed most days (at least 66 percent) that children are in attendance in a week.
At least 75 percent of all children participate in Small Group.
Hands On Math Centers
Activities made available to children through the BB web-based computer software.
At least 75 percent of all children participate in Computer activities.
Activities or manipulativesb for children to work and play with independently, or with a small group of children, with or without a teacher.
Math Center activities are available most days (at least 66 percent) that children are in attendance in a week.
Template for teachers to record children's participation in and response to Small Group activities.
Ready-made letters in English or Spanish that are sent home with children to help parents reinforce BB content at home.
Teachers access ConnectED during the week.
Family Letters "sent home" or "not sent home but didn’t need to" during the week.
Teachers fully complete at least one Small Group Record Sheet for the week.
Teachers' version of BB software that allows them to assign computer activities to children and to review reports of children’s activity completion and progress.
SOURCE: Clements and Sarama (2013).
NOTES: aEach week, the Building Blocks (BB) curriculum included one or two Small Group activities. In Year 1 (2013-2014), the research team asked teachers to conduct at least one Small Group activity on a weekly basis. In Year 2 (2014-2015), teachers were asked to conduct both Small Group activities if more than one was listed.
bManipulatives are hands-on objects that allow children to explore abstract math concepts concretely.
15
through an online resource that included videos of teachers implementing various curricular activities. Making Pre-K Count tests Building Blocks with similar forms of support, but it differs from the previous studies in terms of scale, level of involvement of the curriculum developers, and, as noted above, historical and policy context. There were also some design features of the study that differed from prior trials, including the population served and the measures used to assess program effects.
Prior studies tended to have a much smaller proportion of Hispanic children than in this study. As a result, the measurement plan needed to be adapted to accommodate Spanish-speaking children, resulting in a different primary math outcome measure from what had been used in previous trials. But perhaps more important, Making Pre-K Count was designed to be a test of Building Blocks operating on a considerable scale (but nevertheless smaller than full districtwide implementation) and with lower levels of developer involvement. As discussed in detail below, Making Pre-K Count included 69 sites in districts primarily serving low-income children, with over 2,700 children. The five prior Building Blocks studies had high levels of curriculum developer involvement and tended to be on either a much smaller or a somewhat smaller scale (ranging from 2 to 42 sites, 4 to 106 classrooms, and 68 to 1,305 children),7 both factors that would be expected to amplify results. In Making Pre-K Count, although the curricu-
7Clements and Sarama (2007, 2008); Clements et al. (2011); Hofer, Lipsey, Dong, and Farran (2013). Only one study included over 1,000 children. See Clements et al. (2011).
Box 2.2
What Is an Effect Size?
An effect size is a statistical measure of the magnitude of an impact that is standardized (that is, it has the same meaning no matter what unit is used to measure the impact). Statistically, effect size is calculated as the difference between the mean value for the program group and the mean value for the control group, divided by the standard deviation of the control group. Bloom and colleagues suggest that the magnitude of effects in educational interventions can be understood by comparing the size of the effects in similar policy-relevant contexts.* In the current study, effect sizes for teachers were considered moderate at around 0.50 and large at around 0.80. Given that any effects on children must occur as a result of changes in teachers’ practices, effects were expected to be smaller on child outcomes than on teachers’ practices. As such, effects on child outcomes below 0.20 were considered small, those between 0.20 and 0.40 were considered moderate, and those above 0.40 were considered large in the Making Pre-K Count study.
______________________ *Bloom, Hill, Black, and Lipsey (2008).

16
lum developers led the teacher training sessions and were an invaluable resource for the study team and coaches, they did not provide direct oversight on any of the other study components. Thus, Making Pre-K Count tests a fully developed intervention, previously shown to be effec-tive in controlled settings, in the context of real-world conditions and independent of the developers. While the technical assistance and logistical support provided by the MDRC and Bank Street College of Education teams to ensure high-quality implementation might be more than a typical school district would provide on an ongoing basis, they are similar to what would be provided during an initial implementation of the program.8
Professional Development: Training, Coaching, and Technical Assistance Prior research has shown the importance of targeted, high-quality professional development for improving teachers’ practice and, ultimately, for child outcomes. Conducting multiple teacher training sessions, in combination with continual coaching, is considered best practice for supporting teachers’ transfer of what they have learned in training to their work with children in the classroom.9 Building on this research, previous tests of Building Blocks all included professional development support as part of a model called Technology‐enhanced Research‐based Instruction, Assessment, and professional Development (TRIAD).10 TRIAD includes ongoing professional development, typically over two years, involving teacher training, coach-ing, and online resources.
In order to support implementation of the Building Blocks curriculum, ongoing training and coaching were provided to all teachers (lead and assistant) assigned to the BB-MPC group. Developer-led training across two years focused on teachers’ math knowledge and curricular components, as well as classroom management strategies to promote implementation of the curriculum. Over 170 lead and assistant teachers in program group classrooms were offered six days of Beginner Training in Year 1. A five-day program of Advanced Training was offered to lead teachers in Year 2,11 focusing on showing teachers how to differentiate math activities for children at different levels of knowledge and skill. Beginner Training was also offered to accommodate a smaller group of lead teachers joining the study only for the second year due to
8For example, the amount of training and coaching in Making Pre-K Count mirrors that in place during a
districtwide rollout of Building Blocks conducted by Boston Public Schools (Weiland and Yoshikawa, 2013). 9Joyce and Showers (2002); Sheridan, Edwards, Marvin, and Knoche (2009). 10Sarama and Clements (2006). 11Returning assistant teachers were invited with their lead teacher to the first daylong training session at
the beginning of the year.
17
turnover in classroom staff.12 Beginner Training included assistant teachers if both the lead and assistant were new to Building Blocks (six classrooms). Note that these were substantially higher levels of training in math than the 5.6 hours that administrators reported were offered to lead teachers in the pre-K-as-usual sites.
Regular in-classroom coaching was also provided to support implementation and to help transfer learning from the training program to the classroom. Classroom coaches were hired by, housed at, and supervised by Bank Street College of Education and trained by the Building Blocks developers on the Building Blocks curriculum and by MDRC on the BB-MPC coaching model. (Box 2.3 presents more information on the coaching and training infrastruc-ture.) A weekly three-hour, in-classroom coaching session was offered in Year 1. This was reduced to a two-hour session every other week in Year 2 with the expectation that teachers would have gained greater facility with the curriculum. In contrast, two-thirds of pre-K-as-usual sites reported that their pre-K teachers received no coaching in math instruction, and for those who did receive coaching, sessions typically lasted for less time than in BB-MPC sites. Each BB-MPC coaching session included time for the coach to observe instruction in the classroom and to offer curriculum guidance, as well as time for a meeting during which the coach, lead teacher, and assistant teacher debriefed the coach’s observations, reflected on implementation, set goals, and planned for upcoming lessons.
To continually track the amount (dosage), content, and quality of implementation, the research team created a set of online logs through a management information system (MIS). Coaches completed the logs on an ongoing basis, reporting the extent to which Building Blocks activities were implemented, the quality of implementation, the amount of time spent with each classroom, and the content covered during coaching sessions. In discussion with the curriculum developers, the research team developed a set of prespecified benchmarks to determine whether Building Blocks was implemented in a way consistent with developers’ expectations and whether coaching was delivered at a sufficient level. A technical assistance team at MDRC monitored implementation data from the MIS logs and met with coaches and their supervisor on a weekly basis to troubleshoot and to dispatch additional support to persistently low-implementing classrooms. It is important to note that the MDRC team provided intensive technical assistance and logistical support to ensure high-quality implementation of BB-MPC (for example, securing adequate space with the required technology for training, providing computers and technical support for classrooms, negotiating with school leaders for time and space needed for coaching, providing ongoing support for teachers and coaches in implementa-tion of the curriculum, and attending training sessions).
12Twenty lead teachers (out of 87 classrooms) in the BB-MPC group left the study between the spring of
Year 1 and the fall of Year 2.

18
Hypothesized Effects of BB-MPC on Teachers, Classrooms, and Children As shown in the top part of Figure 2.2, it was hypothesized that the implementation of BB-MPC, including the package of materials, training, and coaching described above, would have a direct effect on teachers’ classroom math instruction, increasing both its quantity and quality. Previous studies demonstrated that implementation of Building Blocks led to between two and five more minutes spent on math (during a three-hour observation) in program group class-rooms than in control group classrooms.13 While two to five minutes may seem like a small amount, it was often on top of a low base of math instruction.
In addition, implementation of Building Blocks may affect other classroom outcomes. Because the curriculum focuses not only on teaching math competencies but also on encourag-ing children to think through and explain their math thinking (directing teachers, for example, to
13Clements and Sarama (2008); Sarama et al. (2008); Clements et al. (2011).
Box 2.3
Building a Coaching and Training Infrastructure in New York City
Part of MDRC and the Robin Hood Foundation’s plan for the Making Pre-K Count math initiative was to invest in an infrastructure that could help expand the program if it proved to be effective. Accordingly, an infrastructure for teachers’ professional development was built in collaboration with Bank Street College of Education. Bank Street College of Education was central to this effort. Bank Street hired, trained, and supervised the Making Pre-K Count coaches, with support from MDRC. Relying on an MDRC-developed coaching model, coach-es were trained during the summer before the program began by Bank Street, MDRC, and the curriculum developers on the Building Blocks curriculum, classroom management to support its implementation, and data collection to guide and track implementation.
The curriculum developers and their staff led teacher training, with support from MDRC and Bank Street College. In addition, the developers trained a cadre of New York-based trainers to help cover the sessions needed to train so many teachers. These trainers also provided individ-ual makeup sessions for teachers when indicated by the coaches and MDRC technical assis-tance team. The New York City Administration for Children’s Services and Department of Education’s Office of Early Childhood Education worked with the study team to enable teachers to attend training sessions.
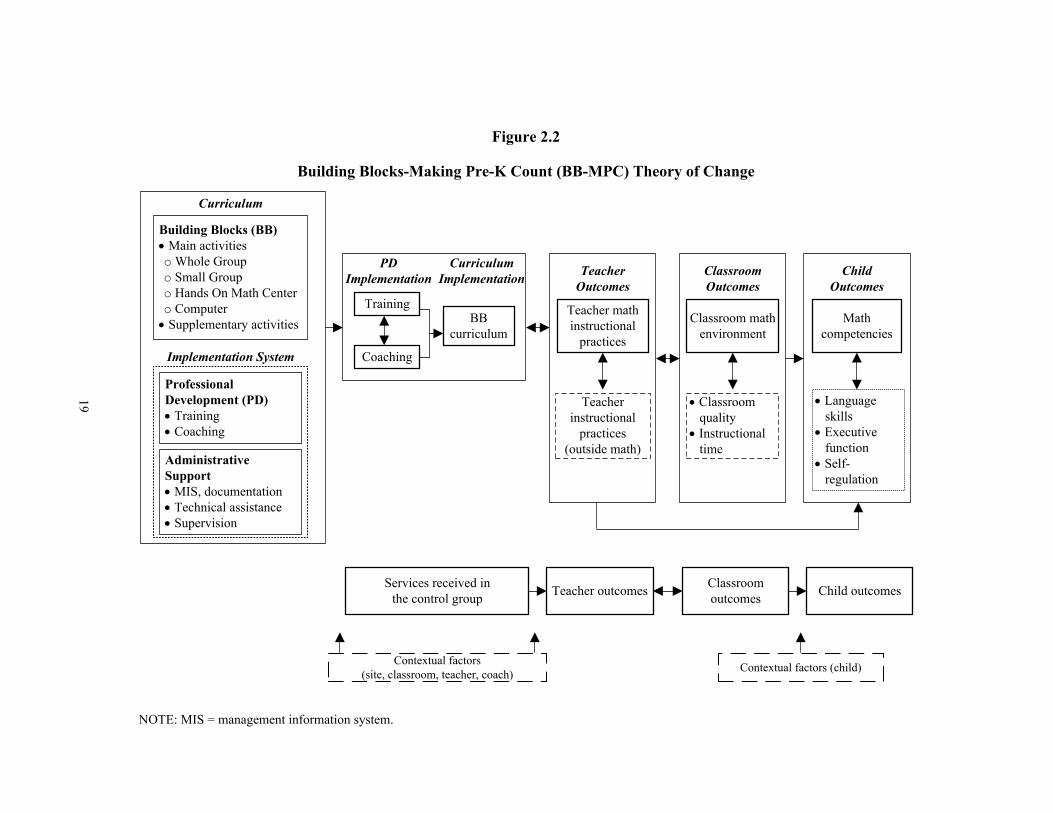
19
Figure 2.2
Building Blocks-Making Pre-K Count (BB-MPC) Theory of Change
Building Blocks (BB)• Main activitieso Whole Groupo Small Groupo Hands On Math Centero Computer
• Supplementary activitiesTraining
Professional Development (PD)• Training• Coaching
Administrative Support• MIS, documentation• Technical assistance • Supervision
Coaching
BB curriculum
PD Implementation
Curriculum
Curriculum Implementation Teacher
OutcomesClassroom Outcomes
Child Outcomes
Teacher math instructional
practices
Teacher instructional
practices (outside math)
Classroom math environment
• Language skills• Executive function• Self- regulation
Math competencies
Contextual factors (child)Contextual factors (site, classroom, teacher, coach)
• Classroom quality• Instructional time
Teacher outcomes Classroom outcomes Child outcomesServices received in
the control group
Implementation System
NOTE: MIS = management information system.
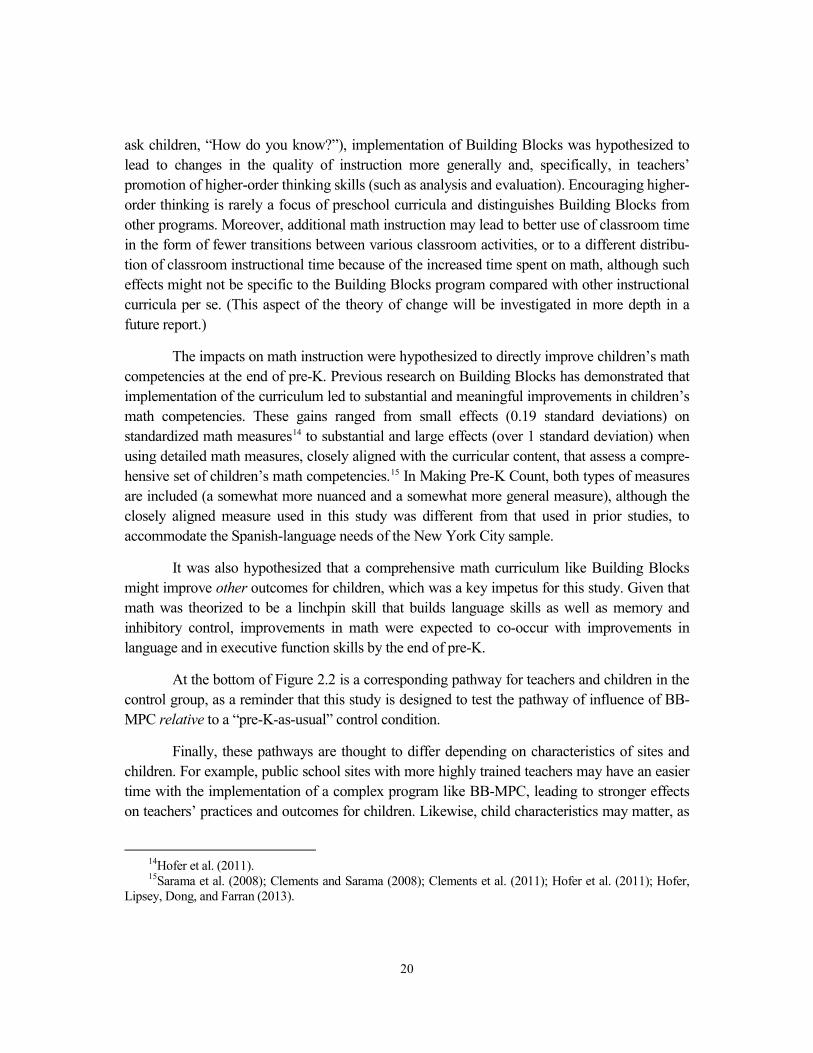
20
ask children, “How do you know?”), implementation of Building Blocks was hypothesized to lead to changes in the quality of instruction more generally and, specifically, in teachers’ promotion of higher-order thinking skills (such as analysis and evaluation). Encouraging higher-order thinking is rarely a focus of preschool curricula and distinguishes Building Blocks from other programs. Moreover, additional math instruction may lead to better use of classroom time in the form of fewer transitions between various classroom activities, or to a different distribu-tion of classroom instructional time because of the increased time spent on math, although such effects might not be specific to the Building Blocks program compared with other instructional curricula per se. (This aspect of the theory of change will be investigated in more depth in a future report.)
The impacts on math instruction were hypothesized to directly improve children’s math competencies at the end of pre-K. Previous research on Building Blocks has demonstrated that implementation of the curriculum led to substantial and meaningful improvements in children’s math competencies. These gains ranged from small effects (0.19 standard deviations) on standardized math measures14 to substantial and large effects (over 1 standard deviation) when using detailed math measures, closely aligned with the curricular content, that assess a compre-hensive set of children’s math competencies.15 In Making Pre-K Count, both types of measures are included (a somewhat more nuanced and a somewhat more general measure), although the closely aligned measure used in this study was different from that used in prior studies, to accommodate the Spanish-language needs of the New York City sample.
It was also hypothesized that a comprehensive math curriculum like Building Blocks might improve other outcomes for children, which was a key impetus for this study. Given that math was theorized to be a linchpin skill that builds language skills as well as memory and inhibitory control, improvements in math were expected to co-occur with improvements in language and in executive function skills by the end of pre-K.
At the bottom of Figure 2.2 is a corresponding pathway for teachers and children in the control group, as a reminder that this study is designed to test the pathway of influence of BB-MPC relative to a “pre-K-as-usual” control condition.
Finally, these pathways are thought to differ depending on characteristics of sites and children. For example, public school sites with more highly trained teachers may have an easier time with the implementation of a complex program like BB-MPC, leading to stronger effects on teachers’ practices and outcomes for children. Likewise, child characteristics may matter, as
14Hofer et al. (2011). 15Sarama et al. (2008); Clements and Sarama (2008); Clements et al. (2011); Hofer et al. (2011); Hofer,
Lipsey, Dong, and Farran (2013).
21
children with stronger self-regulation or math skills when they enter pre-K may be able to benefit more from this language-rich math program. These differences are explored as part of the examination of subgroup differences in teacher and child outcomes, presented at the end of Chapter 4.
Study Design Sixty-nine pre-K sites receiving funding from the New York City Department of Education or Administration for Children’s Services were selected to reflect the geographical, racial, and ethnic diversity of New York City’s low-income population, although the sample was not designed to be a statistically representative sample. Sites had to serve a low-income population of 4-year-old children and offer full-day programs.16 Programs in which directors or principals reported that they were delivering intensive math curricula were excluded. The final sample included pre-K programs in community-based organizations (including Head Start centers) and public schools across low-income neighborhoods in four of New York City’s five boroughs. The final sample of children included even proportions of boys and girls with an average age just above 4 years old at the start of pre-K. Over half the parents reported that they were Hispanic, while another one-third were black. (See Tables 2.2 and 2.3 for more information about the teacher and child samples in the fall of 2014.) Nearly 20 percent of the children spoke Spanish as their primary language (and were therefore assessed in Spanish) in the fall of the pre-K year. Somewhat surprisingly, children entered pre-K with language skills (as measured by a well-validated, nationally normed measure) that were similar to their middle-income peers nationally; children’s scores in the study averaged a 95 on a measure that has an average score of 100 and was normed on a nationally representative sample. It is not clear whether these norms sufficiently reflect historical trends and the skills of children in New York City, or whether the gap in school achievement is smaller than expected between low- and middle-income children in New York City.
Lead teachers in the second year were mostly female (94.5 percent) and relatively even-ly distributed by racial/ethnic group (with approximately 32 percent Hispanic, 26 percent non-Hispanic black, and 34 percent non-Hispanic white). Similarly to a prior Building Blocks study, a majority of teachers had a master’s degree (85.9 percent) and, on average, teachers had over a decade of teaching experience (15.2 years).17
16A “low-income population” was defined as at least 70 percent of children being eligible for free or re-
duced-price lunch. 17Clements et al. (2011).

22
Pre-K sites were randomized either to the BB-MPC group, where they would receive two years of the Building Blocks math curriculum plus coaching and training, or to the pre-K-as-usual control group.18 A total of 35 pre-K programs were in the BB-MPC group
18Sites were “blocked” into groups of four to five before randomization based on their borough, venue
(community-based organizations versus school-based sites), and the racial/ethnic composition of the children (whether the sites served primarily Hispanic children or not). Blocking achieves two goals: First, it reduces the risk of a poor match between program and control groups by accident given the small number of units at the level of randomization; second, blocking in groups rather than pairs protects against the loss of sample sites between randomization and the study of program impact by allowing for the retention of all remaining sites if a single site drops out of the study.
Characteristic Full Sample Mean Standard Deviation
Female (%) 94.5 —Race and ethnicity (%)
Hispanic 32.1 —Non-Hispanic white 34.2 —Non-Hispanic black 26.1 —Other/Multiraciala 8.1 —
Master's degree or higher (%) 85.9 —Years teaching 15.23 8.87Fluent in Spanish (%) 22.7 —
Sample sizeb
Blocks 16Sites 69Teachers 173
Table 2.2
Selected Baseline Characteristicsof Year 2 (2014-2015) Lead Teachers
SOURCE: MDRC calculations from the baseline Teacher Self-Survey administered when teachers entered the study (between spring 2013 and fall 2014).
NOTES: Rounding may cause slight discrepancies in sums and differences.a"Other" includes Asian, Native Hawaiian/Pacific Islander, and American Indian/Alaska
Native, as well as teachers who identified as the option "other" in the survey.bFor all variables in the table, data are available for at least 90 percent of the sample.

23
Full Consented Standard Fall Assessed StandardCharacteristic Samplea Mean Deviation Sampleb Mean Deviation
Parent demographicsRace and ethnicity (%)
Hispanic 55.6 — 57.5 —Non-Hispanic white 3.9 — 3.0 —Non-Hispanic black 36.1 — 36.7 —Other/Multiracialc 4.4 — 2.9 —
Highest level of educationAt least high school/GED (%) 73.6 — 74.2 —
Child characteristicsDemographics
Age (years) 4.17 0.29 4.17 0.29Female (%) 51.5 — 52.5 —
Fall assessmentAssessed in Spanish (%) — — 19.7 —ROWPVT standard scored — — 94.54 16.62Arrows incongruent: proportion correcte (0-1) — — 0.58 0.26Corsi Blocks forward: number correctf — — 2.52 1.18
Sample sizeg
Blocks 16 16Sites 69 69Children 2,715 859
Table 2.3
Selected Baseline Characteristics of Parents and Children,Full Consented and Fall Assessed Samples
SOURCE: MDRC calculations from parents' reports on demographics on the informed consent form collected in fall 2014, and from direct child assessments administered in fall 2014.
NOTES: GED = General Educational Development certificate. Rounding may cause slight discrepancies in sums and differences.aThe full consented sample includes all children for whom consent to participate was obtained in fall 2014.bThe fall assessed sample consists of children who were assessed in the fall of the pre-K year (2014). c"Other" includes Asian, Native Hawaiian/Pacific Islander, and American Indian/Alaska Native, as well as
parents who identified as the option "other" on the consent form.dReceptive One-Word Picture Vocabulary Test (Martin and Brownell, 2011). The scores are age normalized to
100, with a standard deviation of 15.eSpatial Conflict Arrows task (Willoughby, Wirth, Blair, and Family Life Project Investigators, 2012). This
score is calculated by dividing the number of correct responses for trials where arrows were depicted contralaterally (with left-pointing arrows appearing on the right side of the tablet screen and right-pointing arrows appearing on the left side) by the total number of contralateral (incongruent) trials.
fCorsi Blocks (Corsi, 1972; Lezak, 1983). The score reports the highest number of blocks the child was able to tap in correct order in two attempts.
gFor all variables in the table, data are available for at least 92 percent of each sample.
24
(87 classrooms) and 34 (86 classrooms) were in the pre-K-as-usual group.19 This approach, wherein entire sites are randomized rather than classrooms within sites, minimizes possible spillover from one group of teachers to another and accommodates a current best practice that recommends “whole school reform” as the best way to achieve large impacts.20 As with previous studies of Building Blocks and based on the developers’ recommendation, the math curriculum, coaching, and training were implemented across two years to allow time in the first year for teachers to learn and to immerse themselves in the curriculum, before the research team assessed impacts on children who entered pre-K in the second year of the program’s opera-tion.21
Observations conducted to measure teacher practices and classroom climate were col-lected at baseline before sites received the program (spring 2013) and in the spring of each implementation year (spring 2014 and spring 2015). Survey data on teachers were collected at entry to the study and at the end of Year 2. Data on children were collected in the fall and spring of the second year of implementation (2014-2015). This study followed previous Building Blocks studies and was intentionally designed to assess the impact of BB-MPC on the cohort of children who entered pre-K in Year 2, when most teachers would have already taught a full year of the curriculum.
19Initially, there were 70 pre-K sites in the study sample. After random assignment but before Year 1 chil-
dren entered the classroom and before teachers were trained and coached, one site assigned to the Pre-K-as-usual group dropped out of the study.
20Borman, Hewes, Overman, and Brown (2003); Greenberg et al. (2003). 21Although impacts were assessed for only the second cohort, children entering BB-MPC classrooms in
the first year also received the intervention. Classrooms included in the Making Pre-K Count sample served mostly 4-year-olds (inclusion criteria specified that sites serve no more than 10 percent to 20 percent 3-year-old children). Therefore, the majority of children in the study entered their pre-K classroom for the first time that year and received only one year of Building Blocks.
25
Chapter 3
Implementation of the Professional Development and Curriculum Models
This chapter presents the findings on the implementation of the Building Blocks-Making Pre-K Count (BB-MPC) program in classrooms. In short, the training and coaching provided to teachers were aligned with the intended professional development model, and teachers partici-pated in these activities at very high rates. For the most part, teachers implemented the multiple components of the Building Blocks curriculum on a weekly basis, at a level of quality that met prespecified benchmarks set by the research team; both quantity and quality were at a level that could be reasonably expected at this scale.
Two types of fidelity of implementation of the BB-MPC program were examined on an ongoing basis in this study and guide the presentation of the findings in this chapter:1 (1) fidelity to the professional development model, or the degree to which training and coaching are consistent with what was planned by MDRC, and (2) fidelity to the curriculum, the degree to which teachers implemented the Building Blocks curriculum in their classrooms as it was intended by developers. The research team and coaches assessed these two key aspects of fidelity. To do so, the researchers, in collaboration with program developers, developed a set of prespecified technical assistance benchmarks to monitor curriculum, coaching, and training implementation. The Making Pre-K Count technical assistance team at MDRC played a key role in this study, providing ongoing monitoring of management information system (MIS) data and real-time support to coaches or to classrooms that were falling below the benchmarks.
Fidelity to the Professional Development Model ● Training and coaching were delivered with high quality and as intended.
Box 3.1 shows key dimensions along which fidelity to the professional development model was assessed, as well as the sources of data for the analysis.
In the first year, teachers assigned to BB-MPC (both lead and assistant teachers) were offered six days of Beginner Training provided by the developers along with weekly in-classroom coaching focused on teacher math knowledge, curricular components, and classroom
1Fidelity of implementation to the curricula was not examined in pre-K-as-usual sites.

26
management strategies that promote curriculum implementation. Overall, Year 1 teacher training and coaching were delivered as intended and were well received. Teacher attendance at training sessions was high (87 percent, on average), and the training covered nearly all the content planned in the training agendas (91 percent).
In the second year, lead teachers assigned to BB-MPC were offered five days of Ad-vanced Training that focused on how to provide different math activities for children at different levels of knowledge and skill — a strategy known as differentiated instruction. Beginner Training was also offered to accommodate a smaller group of lead teachers joining the study in the second year due to turnover in classroom staff. Again, training was well attended, well received, and covered the majority of intended content. The average attendance rate was 86 percent for Advanced Training and 78 percent for the second round of Beginner Training.2 Training sessions covered most of the scheduled content (95 percent and 97 percent of Beginner and Advanced Training content, respectively). Teachers reported being highly satisfied with
2Calculations consist of the average percentage of teachers who attended a training session among those
expected to attend (that is, teachers who were assigned to go to that training), across all training sessions.
Box 3.1
Assessing Fidelity to the Professional Development Model
Training dosage: Teacher attendance was tracked at every teacher training by coaches and MDRC staff members via the Training Attendance Spreadsheet.
Training quality: Program teachers’ satisfaction with training was assessed by four items from a survey using a scale from 1 (strongly disagree) to 10 (strongly agree). This survey was collected at the first and last teacher training sessions each year.
Training content: The extent to which training sessions were conducted as intended was assessed via the Teacher Training Observation Form, an observational survey completed during teacher training by MDRC staff members.
Coaching dosage: Frequency and duration of coaching sessions were assessed on a weekly basis in Year 1 via the Coach Weekly Log and every other week in Year 2 via the Coach Biweekly Log in the management information system.
Coaching quality: The coach supervisor rated each coach’s performance and behavior across all teachers and classrooms with which the coach worked via the Coach Quality Scale. Items assessed the extent to which a coach ably demonstrated understanding of the curriculum, provided constructive feedback, and promoted high-quality implementation across all class-rooms.

27
both types of training, averaging around 9.0 on a 10-point scale (with 10 indicating the highest level of satisfaction), on a survey collected at the first and last training sessions.
The amount of coaching (dosage) was also high, with teachers receiving 149 minutes of coaching weekly (out of a planned 180 minutes) in the first year as they learned the program.3 About one-third of that time was spent in a coach-teacher meeting (conducted during lunch or other times when teacher coverage was already taken care of, or immediately before or after school), and coaches observed teachers’ instruction in the classroom and offered curriculum guidance for the rest of the time. Although almost all coaching sessions that were expected to occur were completed (96 percent), a few were missed, typically because of holidays (61 percent of missed sessions) or professional development days (18 percent).4
In the second year, teachers received on average 99 minutes of coaching twice a month (out of a planned 120 minutes every other week), which is extremely close to the prespecified technical assistance benchmark of 100 minutes.5 About 41 minutes of that time was spent in a coach-teacher meeting, and coaches observed teachers’ instruction for the rest. Lead and assistant teachers attended coaching sessions at high rates (96 percent and 91 percent, respec-tively), and almost all expected coaching sessions were completed (98 percent). Finally, coaching quality was moderately high. Coach supervisors’ overall impressions of coach performance and behavior in the second year — including to what degree the coach demon-strated an understanding of Building Blocks, supported implementation, and was a positive presence in the classroom — averaged 3.6 (ranging from 3.5 to 3.9) on a scale of 1 (low quality) to 5 (consistently high quality).
It is important to note that math-related professional development and the use of math curricula in the classrooms assigned to BB-MPC were indeed higher than in pre-K-as-usual classrooms. Information collected at the end of the second year of implementation from school administrators on math-related services shows that teachers in pre-K-as-usual sites received less coaching in math, with 66 percent of control group sites reporting that their pre-K teachers received no coaching in math, and the remainder receiving far less coaching than in BB-MPC. Lead teachers in pre-K-as-usual sites were offered about 5.6 total hours of training on math, far less than the 30 total hours of training on math that lead teachers in BB-MPC sites were offered in the same year. Notably, many pre-K-as-usual sites appeared to be implementing some
3On average, BB-MPC teachers received a total of 78.9 hours (standard deviation of 9.9 hours) of coach-
ing in Year 1. 4Coaching sessions in Year 1 were also missed because of teacher absence (6 percent); coach absence (5
percent); the building being closed for a reason other than a holiday, such as inclement weather (3 percent); special events (1 percent); and other reasons (5 percent).
5On average, BB-MPC teachers received a total of 27.5 hours (standard deviation of 2.2 hours) of coach-ing in Year 2.

28
aspects of math curricula: 42 percent of pre-K-as-usual sites reported using a published math curriculum compared with 100 percent using Building Blocks in BB-MPC sites, and about half the pre-K-as-usual sites reported having computer software with math activities compared with 100 percent of BB-MPC classrooms having Building Blocks math computer software.6
Fidelity to the Curriculum Three dimensions of fidelity to the curriculum were assessed: dosage (an index of quantity of delivery), quality (a measure of qualitative aspects of delivery, or the skill with which teachers deliver material and interact with children), and content (the extent to which specified curricu-lum content was delivered as prescribed in program materials and manuals). The primary source of data on dosage and quality, as Box 3.2 indicates, was a set of logs regularly completed by Making Pre-K Count coaches via an online MIS; these logs recorded the extent to which teachers reported implementing Building Blocks curricular components (dosage) and the quality of that implementation.7
● Teachers were able to implement most (three out of four) of the main curricular components successfully at levels prespecified by the research team. Computer implementation lagged behind the other components.
Most of the components of Building Blocks were implemented as intended in both years.8 As seen in Table 3.1, in Year 2 Whole Group activities were conducted on 92 percent of days children were in attendance, and Hands On Math Centers on 93 percent of days. On a weekly basis, at least one Small Group activity and Computer activities were expected to be conducted with each child. Teachers were able to cycle most children through a Small Group during 85 percent of the weeks that the curriculum was implemented. Computer implementation lagged, but teachers were able to get most children to the computer to play the games for 65 percent of the weeks, and implementation of the Computer component improved over the course of the year. In September and October, teachers were able to get most of the children in their classroom to play the computer games only about half the time (48 percent of weeks), but
6Eighty-five percent of control group sites reported on the math curriculum that they used in Year 2. 7The logs also covered the amount of coaching each classroom received and the content covered during
coaching sessions. 8Implementation in Year 2 was examined from September 15, 2014, through May 29, 2015. Calculations
do not include any implementation that may have been conducted during (a) holiday weeks, when most buildings were closed, or (b) “review weeks,” when public schools were closed and community-based organization classrooms were expected to review the prior Building Blocks week or catch up to the current one. Thus Year 2 excludes the weeks of November 24, December 15, December 22, and December 29, 2014, and February 16, March 30, and April 6, 2015.
29
by March and April, teachers were getting most children on the computer an average of 71 percent of weeks. These implementation levels were similar to but improved from those observed in Year 1.9
Fidelity to most Building Blocks supplementary components, such as weekly comple-tion of Small Group Record Sheets, weekly delivery of Family Letters, and weekly accessing of
9In Year 1, Whole Group activities were conducted on 90 percent of days and Hands On Math Centers on 86 percent of days. Teachers were able to cycle most children through a Small Group during 80 percent of the weeks that the curriculum was implemented. For 54 percent of the weeks that the curriculum was implement-ed, teachers were able to get most children on the computer to play the Computer games.
Box 3.2
Assessing Fidelity to the Curriculum
Building Blocks curriculum implementation dosage: The frequency with which teachers implemented the main and supplementary Building Blocks components, and the number of children who received the program. This was assessed on a weekly basis using the Coach Weekly Log in the management information system (MIS), based on coaching meetings with teachers.
Building Blocks curriculum implementation quality: The quality of curriculum implemen-tation was assessed in the MIS through multiple dimensions. The classroom coach’s perspec-tive is recorded in the Coach Monthly/Bimonthly Log, and a trainer certified in Building Blocks completes the Trainer Fidelity Log. Coaches completed their log for each program classroom on a monthly basis in Year 1 and every other month in Year 2. Trainer logs were completed for a subset of program classrooms during an observation of math instruction that took place between late January and early March 2015. Quality items are rated on a scale of 1 (low quality) to 5 (high quality), in the following dimensions:
• Component quality: 12 items assessing the degree to which the four main Building Blocks components were conducted as written and in alignment with how teachers were trained.
• General implementation quality: 7 items assessing how well the lead teacher implements Building Blocks, including the degree to which the teacher differentiates instruction (that is, provides instruction sensitive to each child’s skill level), helps children extend their math knowledge, and explains the activity’s underlying math objectives.
• Teacher internalization: 3 items assessing the lead teacher’s understanding of math content, learning trajectories, and curricular goals.
• Clear BB classroom: A single item rated on a 1 to 5 scale: “It is clear when you enter this classroom and look around it is a Building Blocks classroom.”

30
Component Mean Standard Deviation
Main componentsDays conducteda (%)
Whole Group 92.0 6.3Hands On Math Centers 93.0 8.0
Weeks classrooms met benchmark (%)Small Groupb 84.8 14.9Computerc 64.6 24.8
Supplementary componentsWeeks classrooms met benchmark (%)
Additional Small Groupd 32.3 27.0Small Group Record Sheete 91.6 12.0Family Letterf 94.3 10.1ConnectEDg 93.5 8.4
Sample sizeBlocks 16Sites 35Classrooms 87
Implementation of Building Blocks
Table 3.1
Curricular Components, Year 2 (2014-2015)
SOURCE: MDRC calculations based on coaches' biweekly logs.
NOTES: Rounding may cause slight discrepancies in sums and differences.aThis refers to the percentage of days when children were in attendance that a
particular activity was conducted across all implementation weeks.bSmall Group weekly benchmark: At least 75 percent of all children participate in
Small Group.cComputer weekly benchmark: At least 75 percent of all children participate in
Computer activities.dAdditional Small Group weekly benchmark: At least 75 percent of all children
participate in the additional Small Group. eSmall Group Record Sheet weekly benchmark: Teachers fully complete at least
one Small Group Record Sheet.fFamily Letter weekly benchmark: Family Letters are either "sent home" or "not
sent home but didn't need to."gConnectED weekly benchmark: Teachers access ConnectED during the week.
31
the ConnectED data system, was also high (see Table 3.1).10 Finally, by the end of the study year, all classrooms had reached the final lesson of the curriculum (Week 30), meeting the curriculum developers’ definition for one dimension of fidelity (that is, classrooms should be within two weeks of implementing the final week of Building Blocks by the end of the school year).
● Coach reports on the quality with which the curriculum was imple-mented (rated on a 5-point scale) met the prespecified benchmark of a 3.
With regard to the quality (and not just quantity) of curriculum implementation, coach-reported implementation quality ratings, on average, met all prespecified technical assistance benchmarks of “satisfactory” for classrooms and lead teachers. These ratings also improved slightly over the course of Year 2 (see Table 3.2). Coach and Building Blocks trainer ratings generally corroborated one another.
● Implementation barriers may have contributed to the inconsistent im-plementation of the Computer activities, and to a lesser degree, Small Group.
Overall, most aspects of Building Blocks were implemented in the classroom by teach-ers successfully and with fidelity to the original model — at a level that could be reasonably expected in a study at this scale. It is notable that Computer activities (and to a lesser degree, Small Group activities) were implemented less consistently than the other curricular compo-nents. These two components, which focus much more on individualized instruction, are arguably more challenging for teachers to implement. Both rely on strong classroom manage-ment skills, as teachers must manage a process that calls for up to 18 children to be cycled through these math activities each week while the rest of the classroom remains independent and productive in learning centers, focused on various topics such as pretend play or writing.
Additional implementation barriers may have influenced computer use. The research team ensured that each program-assigned classroom had one working computer that could run Building Blocks computer games, but it is likely that this was the only working computer in most classrooms. Two or more working computers could provide more opportunities for children to use a computer at any given time. In addition, computer activities come with a unique set of ongoing challenges that classrooms may struggle with, including Internet connec-tivity issues, children’s difficulty manipulating a mouse, lack of in-house technology staff, and insufficient computer literacy on the part of teachers.
10The exception is an additional Small Group activity (an expectation added in Year 2 after the curriculum
had become more familiar), for which classrooms on average met the prespecified technical assistance benchmark in only 32 percent of weeks.

32
Small Group appeared to have its own set of implementation challenges. Coaches re-ported barriers such as teachers’ preference for conducting Small Group activities with two children at a time (or even just one) as opposed to the recommended three to four children, and spending more than the recommended time conducting these activities. Both of these practices could increase the total time needed to rotate through all children in any given week, especially because most weeks the curriculum called for two Small Group activities (an expectation added in Year 2). Finally, coaches reported that classrooms varied on the extent to which the assistant
Quality Dimensiona Average Ratingb Change from Fall to Springc
Component qualityd 3.66 0.31General implementation qualitye 3.40 0.22Teacher internalizationf 3.31 0.26Clear BB classroomg 3.42 0.52
Sample sizeBlocks 16Sites 35Teachers 87
Table 3.2
Coach-Reported Quality Ratings of Building Blocks CurriculumImplementation by Lead Teachers, Year 2 (2014-2015)
SOURCE: MDRC calculations based on coaches' bimonthly logs.
NOTES: Rounding may cause slight discrepancies in sums and differences.aThe scale for each quality rating is from 1 (low) to 5 (high). The midpoint of a 3 rating
was designed by the research team as a technical assistance benchmark to represent "satisfactory" implementation.
bThe average rating for each quality dimension is calculated by averaging across all bimonthly logs for the year.
cChange over time is calculated by taking the difference between the coaches' ratings from May-June (or if missing, March-April) and from September-October (or if missing, November-December).
dThe component quality dimension consists of 12 items assessing the quality by which classrooms are implementing the four main Building Blocks components.
eThe general implementation quality dimension consists of 7 items assessing how lead teachers are implementing Building Blocks and advancing children's mathematical skills and knowledge.
fThe teacher internalization dimension consists of 3 items assessing lead teachers' understanding of math content, learning trajectories, and curricular goals.
gThe clear BB classroom dimension consists of a single item: "It is clear when you enter this classroom and look around it is a Building Blocks classroom."
33
teacher was used to help implement Small Group; those that actively used the assistant teacher tended to be more successful at implementing these components.
Summary The findings presented here demonstrate that teachers participated in training and coaching at very high rates. For the most part, teachers implemented the various components of the curricu-lum weekly and at a level of quality that met prespecified benchmarks. Teachers struggled to consistently implement Computer component activities, and to a lesser degree Small Group activities, but there was marked improvement in Computer implementation over the course of the second year. The next chapter presents the impacts on teacher practice and child outcomes resulting from this implementation of Building Blocks in BB-MPC classrooms, relative to teacher practices and child outcomes in the pre-K-as-usual control group.

35
Chapter 4
Impacts of Making Pre-K Count on Pre-K Teachers, Classrooms, and Children
This chapter addresses whether the level of implementation achieved in program classrooms was sufficient to change teachers’ math practices and short-term outcomes for children. As described in Chapter 2, a substantial amount of math instruction — half an hour a day — was already being conducted in business-as-usual prekindergarten (pre-K) programs during the study, which coincided with several initiatives meant to improve the academic quality of pre-K instruction in New York City. That high level of math in typical New York City pre-K pro-grams may have made it harder to detect the effects of Building Blocks-Making Pre-K Count (BB-MPC).
The strong training and coaching that supported implementation of BB-MPC did lead teachers to succeed in delivering more math instruction across a variety of learning areas. Turning to instructional quality, the impacts of BB-MPC were mixed; the program improved the quality of teachers’ instruction during math but not more generally throughout instruction. Yet despite these positive effects on the quantity, and to a lesser extent the quality, of math instruction, the program did not lead to improvements in children’s math, language, or execu-tive function at the end of the pre-K year. Children who entered pre-K with a strong vocabulary may have benefited from the program, but these findings need to be replicated.
Impacts on Teacher and Classroom Outcomes One of the key questions addressed by this study was whether the implementation of BB-MPC would change teachers’ instructional practices. First, the study examined whether the program would increase the amount and quality of math instruction being delivered to pre-K children. To address this, trained observers, blind to whether they were in a program group classroom or a control group classroom, observed each classroom for three hours in the spring before imple-mentation (2013), the spring of Year 1 (2014), and the spring of Year 2 (2015). Morning was chosen because it typically coincided with the “instructional” portion of the day. Teachers were told that observers were there to see “preschool as usual” and to go about their day as they would normally. Observers recorded every math activity — both formal and informal math activities led by a teacher or experienced by children — over the course of three hours using a
36
data collection instrument known as the Adapted-COEMET.1 From these observations, several aspects of the amount and quality of math instruction were assessed. (See Box 4.1 for more information on what was observed.) This study also explored whether implementation of BB-MPC would improve the overall quality of instruction (not just during math activities) and teachers’ promotion of deeper thinking skills. To assess these aspects of quality, classrooms were also observed in Year 2 (Spring 2015) using the Classroom Assessment Scoring System (CLASS), a widely known observational instrument.
● The curriculum and professional development led to an additional 12 minutes of math instruction and nearly two more teacher-led math les-sons (in a three-hour block) across a number of math content areas.
Based on these classroom observations, BB-MPC teachers were observed to deliver an average of nearly two more math activities, resulting in almost 12 more minutes of teacher-led math instruction than teachers in pre-K-as-usual classrooms. (See Table 4.1.) This impact on the number of minutes of math was substantially larger than that seen in previous studies of Building Blocks, where program group classrooms typically spent 2 to 5 more minutes on math instruction (in a three-hour observation) than control group classrooms, but on a lower base amount of math in control group classrooms than was observed in this study.2 Further, when the number of minutes children in the classroom experienced math was calculated (see Box 4.1 for a more detailed definition), the average child in a BB-MPC classroom received about 6 more minutes of math (in a three-hour observation) than the average child in a pre-K-as-usual classroom. While these numbers may seem small, when extended across the week and year, they add up to a substantial amount of math instruction; children’s exposure to 12 more minutes in a day could mean about an hour more of math instruction in a week and about 40 hours in a 10-month school year.
These consistent impacts on the quantity of math instruction were on top of relatively high control group levels of math instruction. In the pre-K-as-usual classrooms, almost 35 minutes of teacher-led math instruction and nearly two teacher-led math activities were ob-served, on average, during the three-hour observation. These control group levels in Making Pre-K Count are higher than those observed in prior studies of Building Blocks, in which time
1A three-hour observation is recommended by the developers of Classroom Observation of Early Mathe-
matics — Environment and Teaching (COEMET) and is a typical observation period for many early childhood classroom observation protocols. The COEMET was developed by Julie Sarama and Doug Clements and has been used in previous studies of Building Blocks to assess the amount and quality of math instruction in the classroom. See Sarama and Clements (2009). The COEMET was adapted for the Making Pre-K Count study by MDRC.
2Clements and Sarama (2008); Clements et al. (2011).

37
Box 4.1
Assessing the Amount and Quality of Math Instruction
The Adapted Classroom Observation of Early Mathematics — Environment and Teach-ing (Adapted-COEMET) is an instrument used in a three-hour observation conducted in all program group and control group classrooms by trained observers blind to program status. This measure is based on the COEMET* and records every math activity lasting at least 30 seconds. Amount of math instruction in the classroom is captured in the following ways:
• Teacher-led math activities captures the total number of activities led by a teacher that lasted at least 30 seconds; developed math knowledge; had a discernible topic, goal, and task; and involved multiple conversational turns between a teacher and a child.
• Teacher-led math activities and informal math activities captures the total number of activities that met the criteria above, plus the total number of simple or “routine” math ac-tivities† that were led by a teacher.
• Minutes of teacher-led math activities and informal math activities captures the total amount of time during the observation that a teacher delivered math instruction, whether in a math activity or in a simple or “routine” math activity.
• Minutes of math per child captures the number of minutes that the average child in the classroom experienced math, including participation in math activities led by the teacher and activities that children participated in on their own.
Additionally, for each teacher-led math activity that is recorded, observers rate the quality of that instruction:
• Quality captures the extent to which teachers used high-quality instructional strategies throughout a teacher-led math activity via six items rated on a scale from 1 (low) to 5 (high), with a 3 generally meaning that the high-quality instructional strategy was ob-served “sometimes” during the math activity. Items included the extent to which teachers explained the math concept underlying an activity, asked open-ended questions, and used math to build on children’s answers, ideas, and strategies.
_______________________
*Clements and Sarama (2008). †An informal math activity is defined as a “simple” or “routine” math activity led by a teacher that
does not include extensive conversation about math content. An example of an informal math activity is a teacher leading children in singing a math song without explicit discussion of the math concepts.
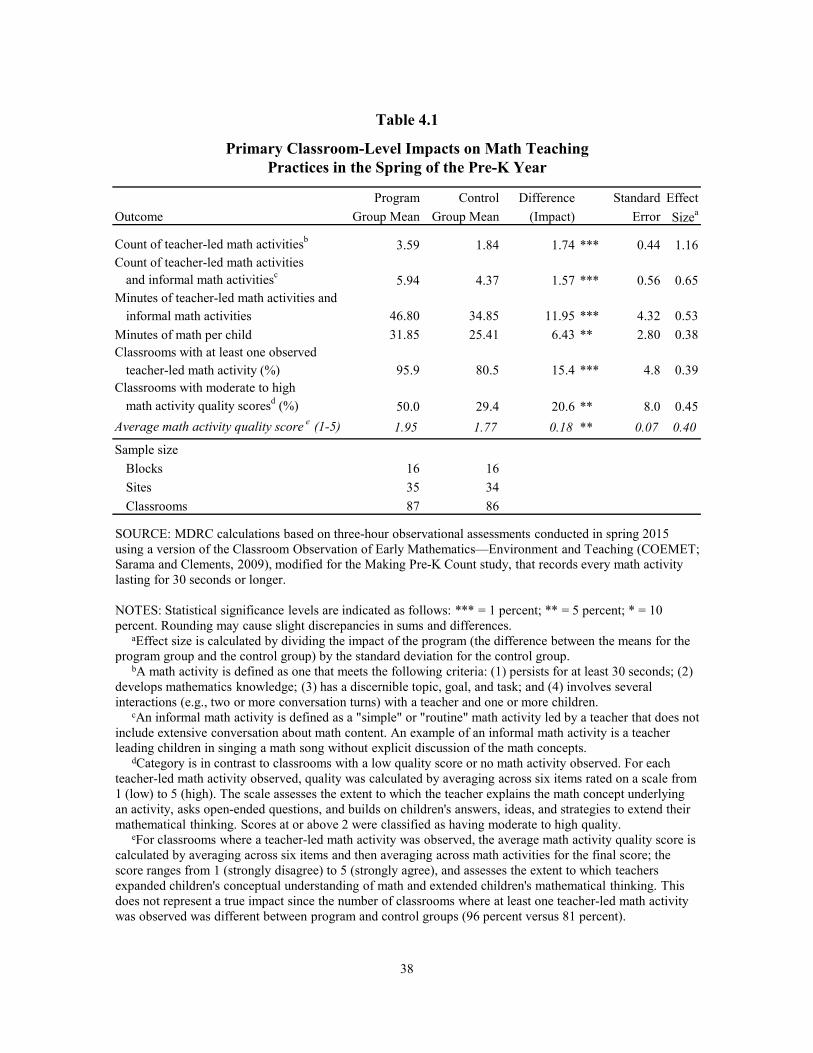
38
Program Control Difference Stars Standard EffectOutcome Group Mean Group Mean (Impact) Error Sizea
Count of teacher-led math activitiesb 3.59 1.84 1.74 *** 0.44 1.16Count of teacher-led math activities
and informal math activitiesc 5.94 4.37 1.57 *** 0.56 0.65Minutes of teacher-led math activities and
informal math activities 46.80 34.85 11.95 *** 4.32 0.53Minutes of math per child 31.85 25.41 6.43 ** 2.80 0.38Classrooms with at least one observed
teacher-led math activity (%) 95.9 80.5 15.4 *** 4.8 0.39Classrooms with moderate to high
math activity quality scoresd (%) 50.0 29.4 20.6 ** 8.0 0.45Average math activity quality score e (1-5) 1.95 1.77 0.18 ** 0.07 0.40
Sample sizeBlocks 16 16Sites 35 34Classrooms 87 86
Table 4.1
Primary Classroom-Level Impacts on Math TeachingPractices in the Spring of the Pre-K Year
SOURCE: MDRC calculations based on three-hour observational assessments conducted in spring 2015 using a version of the Classroom Observation of Early Mathematics—Environment and Teaching (COEMET; Sarama and Clements, 2009), modified for the Making Pre-K Count study, that records every math activity lasting for 30 seconds or longer.
NOTES: Statistical significance levels are indicated as follows: *** = 1 percent; ** = 5 percent; * = 10 percent. Rounding may cause slight discrepancies in sums and differences.
aEffect size is calculated by dividing the impact of the program (the difference between the means for the program group and the control group) by the standard deviation for the control group.
bA math activity is defined as one that meets the following criteria: (1) persists for at least 30 seconds; (2) develops mathematics knowledge; (3) has a discernible topic, goal, and task; and (4) involves several interactions (e.g., two or more conversation turns) with a teacher and one or more children.
cAn informal math activity is defined as a "simple" or "routine" math activity led by a teacher that does not include extensive conversation about math content. An example of an informal math activity is a teacher leading children in singing a math song without explicit discussion of the math concepts.
dCategory is in contrast to classrooms with a low quality score or no math activity observed. For each teacher-led math activity observed, quality was calculated by averaging across six items rated on a scale from 1 (low) to 5 (high). The scale assesses the extent to which the teacher explains the math concept underlying an activity, asks open-ended questions, and builds on children's answers, ideas, and strategies to extend their mathematical thinking. Scores at or above 2 were classified as having moderate to high quality.
eFor classrooms where a teacher-led math activity was observed, the average math activity quality score is calculated by averaging across six items and then averaging across math activities for the final score; the score ranges from 1 (strongly disagree) to 5 (strongly agree), and assesses the extent to which teachers expanded children's conceptual understanding of math and extended children's mathematical thinking. This does not represent a true impact since the number of classrooms where at least one teacher-led math activity was observed was different between program and control groups (96 percent versus 81 percent).

39
spent on math in control group classrooms ranged from 12.2 minutes to 27.2 minutes.3 This does not imply that the control group teachers delivered one uninterrupted 35-minute block of math to children. In both program and control group classrooms, the observers recorded all math activity that lasted for at least 30 seconds over the three hours, and the focus for these analyses was on teacher-led math activities and informal math activities. Sometimes a math activity might occur during whole group instruction, but they could also occur when teachers were in small groups with children, as children interacted with their teachers or peers as they played in small centers such as dress-up or building with blocks, or even during transition times (for example, having the children count as they got into line to go outside).
As Table 4.2 shows, the additional math instruction in BB-MPC classrooms occurred across several math content areas. BB-MPC teachers were observed to deliver more activities about number, operations, and geometry concepts (but not on spatial skills or patterning) than pre-K-as-usual teachers. On average, there were 3.05 teacher-led math activities focused on number concepts observed in BB-MPC classrooms, whereas pre-K-as-usual classrooms averaged 2.39. Teaching of operations and geometry was at much lower levels in pre-K-as-usual classrooms — about half an activity, on average — whereas BB-MPC classrooms were observed to deliver, on average, one activity focusing on each of these math areas. The lowest levels of instruction were observed in spatial skills and patterning, and the program had no impacts for these two domains of instruction.
● The impact of BB-MPC on the quality of instruction was mixed. While BB-MPC teachers provided slightly higher quality math instruction than teachers in pre-K-as-usual classrooms, they did not use better instruc-tional strategies more generally.
Whenever a teacher-led math activity was observed, teachers were also rated (on a 5-point scale from “rarely/never” to “often”) on the quality of their math instructional practices. This included the extent to which teachers supported children’s deeper conceptual understand-ing of math and whether they extended children’s mathematical thinking by asking them questions designed to help them explain their thinking more deeply or more clearly.4 Teachers in the BB-MPC classrooms were 15 percentage points more likely to have delivered a math activity; consequently, ratings on the quality of that instruction are more likely to be available for BB-MPC classrooms. Indeed, 96 percent of BB-MPC teachers delivered at least one math
3Sarama et al. (2008). 4It is important to note that this measure of quality does not assess whether teachers deliver the Building
Blocks activities in a manner consistent with the curriculum script — instead it assesses the degree to which teachers use such instructional strategies as (a) asking open-ended questions, (b) formally extending children’s math learning, and (c) explaining the math concept during activities.

40
activity in the three-hour observation compared with close to 81 percent of control group teachers (Table 4.1). This difference makes it challenging to compare quality across the two groups of classrooms because, by definition, quality is assessed for more BB-MPC teachers than control group teachers.
Given this difficulty, differences in the quality of math instruction across BB-MPC and pre-K-as-usual classrooms were assessed in two ways, as shown in the third set of rows in Table 4.1. First, all classrooms, whether or not they were observed conducting math activities, were taken into consideration in determining what percentage had at least moderate-quality math instruction, as defined by quality at or above a rating of 2 on a scale of 1 (“rarely/never” exhibiting instructional practices aimed at extending children’s mathematical thinking and learning) to 5 (“often” exhibiting such practices). The remaining percentage either had low-quality math instruction (a rating below 2) or no quality rating, because no teacher-led math activity was observed in the three-hour observation period. It is important to note that a score of
Program Control Difference Stars Standard EffectMath Content Area Group Mean Group Mean (Impact) Error Sizea
Numbers 3.05 2.39 0.66 * 0.34 0.36Operations 0.96 0.59 0.38 ** 0.18 0.51Geometry 0.99 0.44 0.55 *** 0.18 0.75Spatial skills 0.38 0.38 0.00 0.11 0.00Patterning 0.40 0.49 -0.10 0.13 -0.13
Sample sizeBlocks 16 16Sites 35 34Classrooms 87 86
Table 4.2
Classroom-Level Impacts on the Number of Teacher-Led Math Activities and Informal Math Activities in Different Math Content Areas in the Spring of the Pre-K Year
SOURCE: MDRC calculations based on three-hour observational assessments conducted in spring 2015 using a version of the Classroom Observation of Early Mathematics—Environment and Teaching (COEMET; Sarama and Clements, 2009), modified for the Making Pre-K Count study, that records every math activity lasting for 30 seconds or longer.
NOTES: Statistical significance levels are indicated as follows: *** = 1 percent; ** = 5 percent; * = 10 percent.Rounding may cause slight discrepancies in sums and differences.aEffect size is calculated by dividing the impact of the program (the difference between the means for the
program group and the control group) by the standard deviation for the control group.

41
a 2 on this scale is indicative of teachers exhibiting high-quality instructional practices only sometimes and inconsistently. Half the BB-MPC teachers were found to deliver at least moder-ate quality math instruction compared with 29 percent of pre-K-as-usual classrooms, which amounts to a 21 percentage point difference. The quality of math instruction was also compared only among those classrooms where a teacher-led math activity was observed. Pre-K-as-usual teachers who received a quality score were rated an average of 1.77 (on the 5-point scale outlined above), while BB-MPC teachers who received a quality score were rated an average of 1.95.
Taken together, these findings suggest that the difference in observed quality is driven by the BB-MPC intervention rather than solely by the difference in the presence of math instruction across the two groups of classrooms. However, in both groups, the degree to which teachers consistently used high-quality instructional strategies during math activities was relatively low overall — below a rating of a 2 — meaning that teachers employed these strate-gies only some of the time.
In addition to classroom observations assessing the quantity and quality of math instruc-tion, observations were conducted in each classroom to capture instructional quality across the whole morning (not just during math activities) using the CLASS. (See Box 4.2 for more information on this measure.) As explained in Chapter 2, it was expected that Building Blocks’ focus on open-ended questions that are intended to encourage deeper and more complex thinking might result in changes in the quality of instruction more broadly. That is, if teachers used Building Blocks questions and strategies, children would in general receive higher-quality instruction, not only in math but also in other content areas. Contrary to expectations, teachers in classrooms assigned to BB-MPC did not provide higher-quality instruction more generally, in comparison with teachers in pre-K-as-usual classrooms.5 As shown in Table 4.3, there were no statistically significant impacts on either the overall quality of instruction (determined by the instructional support domain from the widely used CLASS, which measures teachers’ encour-agement of students’ use of language and response to children’s ideas), or specifically on teachers’ promotion of more complex thinking and analytic skills (as measured by the concept development dimension within the CLASS instructional support domain). It is important to note
5In terms of other aspects of the classroom instruction, there were no statistically significant impacts on
time spent in transition between activities, which might have been reduced as a result of a greater amount of math instruction. However, there was a decline of 8 minutes in teachers’ delivery of literacy instruction. Therefore, teachers’ delivery of math instruction may have come at a cost to the delivery of other forms of instruction, but as shown later, this reduced literacy instruction did not result in reductions in children’s language skills.
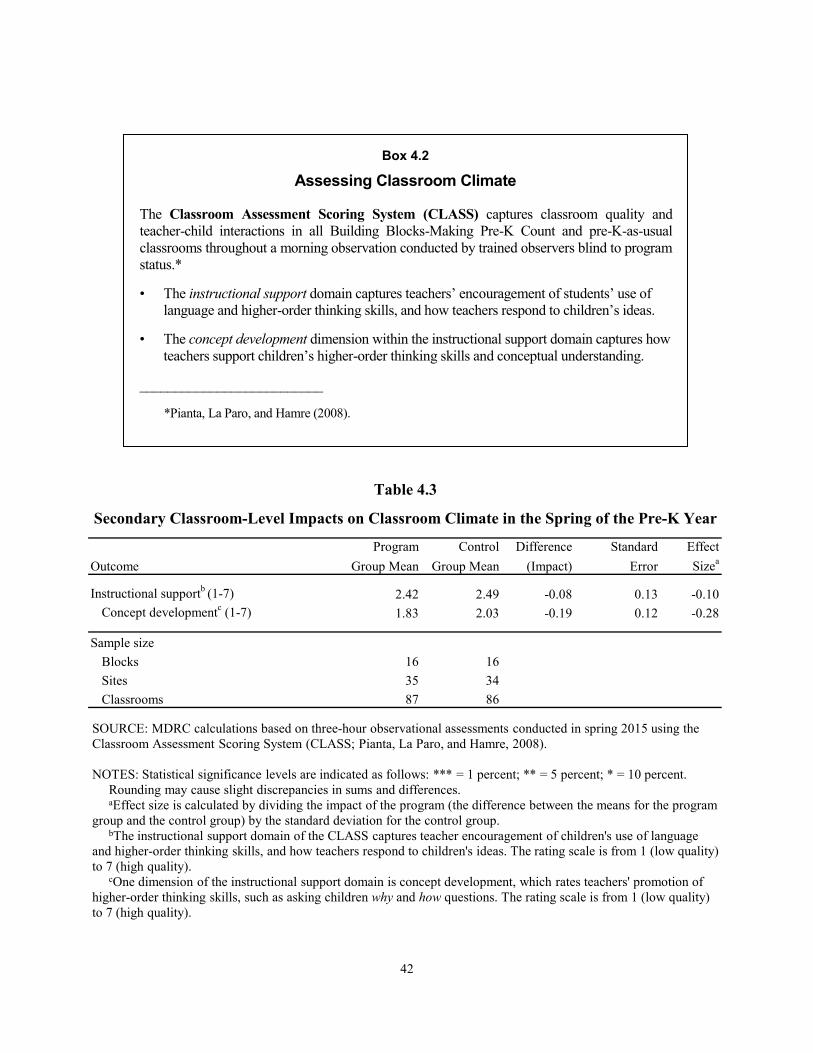
42
Box 4.2
Assessing Classroom Climate
The Classroom Assessment Scoring System (CLASS) captures classroom quality and teacher-child interactions in all Building Blocks-Making Pre-K Count and pre-K-as-usual classrooms throughout a morning observation conducted by trained observers blind to program status.*
• The instructional support domain captures teachers’ encouragement of students’ use of language and higher-order thinking skills, and how teachers respond to children’s ideas.
• The concept development dimension within the instructional support domain captures how teachers support children’s higher-order thinking skills and conceptual understanding.
__________________________
*Pianta, La Paro, and Hamre (2008).
Program Control Difference Stars Standard EffectOutcome Group Mean Group Mean (Impact) Error Sizea
Instructional supportb (1-7) 2.42 2.49 -0.08 0.13 -0.10Concept developmentc (1-7) 1.83 2.03 -0.19 0.12 -0.28
Sample sizeBlocks 16 16Sites 35 34Classrooms 87 86
Table 4.3
Secondary Classroom-Level Impacts on Classroom Climate in the Spring of the Pre-K Year
SOURCE: MDRC calculations based on three-hour observational assessments conducted in spring 2015 using the Classroom Assessment Scoring System (CLASS; Pianta, La Paro, and Hamre, 2008).
NOTES: Statistical significance levels are indicated as follows: *** = 1 percent; ** = 5 percent; * = 10 percent.Rounding may cause slight discrepancies in sums and differences.aEffect size is calculated by dividing the impact of the program (the difference between the means for the program
group and the control group) by the standard deviation for the control group.bThe instructional support domain of the CLASS captures teacher encouragement of children's use of language
and higher-order thinking skills, and how teachers respond to children's ideas. The rating scale is from 1 (low quality) to 7 (high quality).
cOne dimension of the instructional support domain is concept development, which rates teachers' promotion of higher-order thinking skills, such as asking children why and how questions. The rating scale is from 1 (low quality) to 7 (high quality).
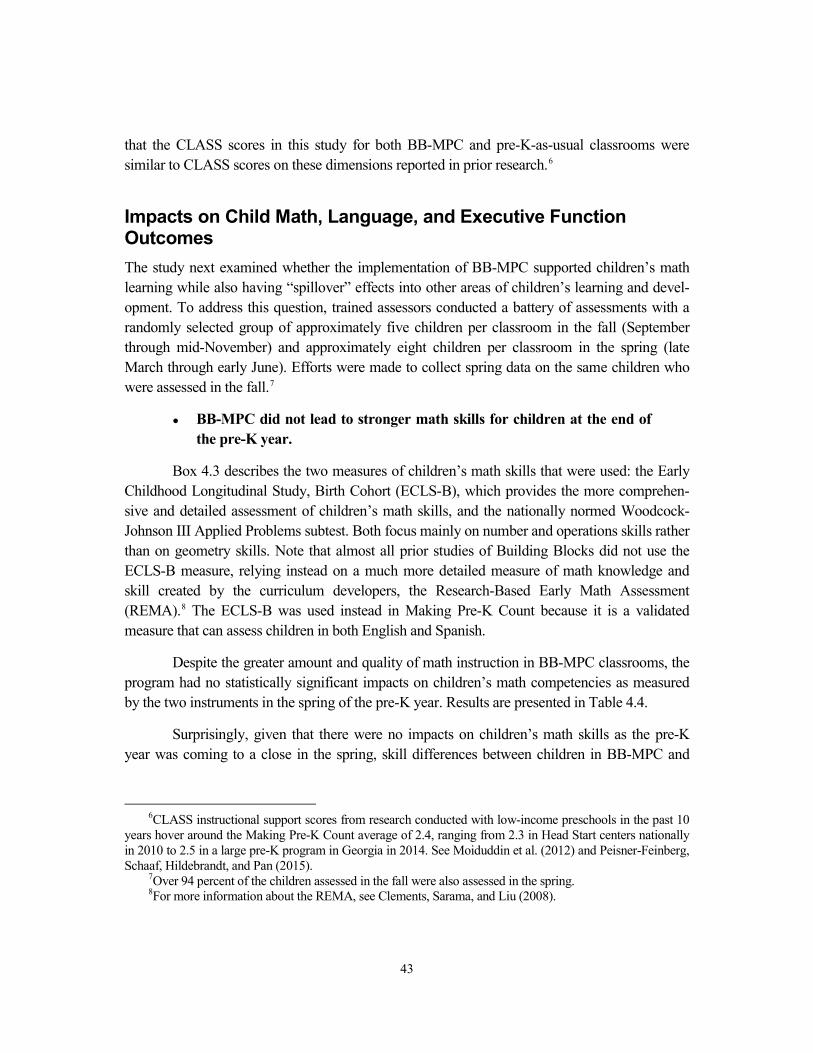
43
that the CLASS scores in this study for both BB-MPC and pre-K-as-usual classrooms were similar to CLASS scores on these dimensions reported in prior research.6
Impacts on Child Math, Language, and Executive Function Outcomes The study next examined whether the implementation of BB-MPC supported children’s math learning while also having “spillover” effects into other areas of children’s learning and devel-opment. To address this question, trained assessors conducted a battery of assessments with a randomly selected group of approximately five children per classroom in the fall (September through mid-November) and approximately eight children per classroom in the spring (late March through early June). Efforts were made to collect spring data on the same children who were assessed in the fall.7
● BB-MPC did not lead to stronger math skills for children at the end of the pre-K year.
Box 4.3 describes the two measures of children’s math skills that were used: the Early Childhood Longitudinal Study, Birth Cohort (ECLS-B), which provides the more comprehen-sive and detailed assessment of children’s math skills, and the nationally normed Woodcock-Johnson III Applied Problems subtest. Both focus mainly on number and operations skills rather than on geometry skills. Note that almost all prior studies of Building Blocks did not use the ECLS-B measure, relying instead on a much more detailed measure of math knowledge and skill created by the curriculum developers, the Research-Based Early Math Assessment (REMA).8 The ECLS-B was used instead in Making Pre-K Count because it is a validated measure that can assess children in both English and Spanish.
Despite the greater amount and quality of math instruction in BB-MPC classrooms, the program had no statistically significant impacts on children’s math competencies as measured by the two instruments in the spring of the pre-K year. Results are presented in Table 4.4.
Surprisingly, given that there were no impacts on children’s math skills as the pre-K year was coming to a close in the spring, skill differences between children in BB-MPC and
6CLASS instructional support scores from research conducted with low-income preschools in the past 10
years hover around the Making Pre-K Count average of 2.4, ranging from 2.3 in Head Start centers nationally in 2010 to 2.5 in a large pre-K program in Georgia in 2014. See Moiduddin et al. (2012) and Peisner-Feinberg, Schaaf, Hildebrandt, and Pan (2015).
7Over 94 percent of the children assessed in the fall were also assessed in the spring. 8For more information about the REMA, see Clements, Sarama, and Liu (2008).
44
Box 4.3
Assessing Children’s Math Competencies
The Early Childhood Longitudinal Study-Birth Cohort (ECLS-B) math assessment directly assesses children’s math competencies, including number sense, operations, measure-ment, geometry, spatial sense, and patterns by asking children to answer a series of math questions using an easel and manipulatives (such as blocks).*
Woodcock-Johnson III Tests of Achievement (WJ-III ACH): Applied Problems is a valid standardized assessment of mathematical thinking for ages 2 through 90; early items are suitable for assessing simple math functions relevant at young ages (such as identifying the number when more objects are added to a picture).†
__________________________
*Najarian, Snow, Lennon, and Kinsey (2010). †Woodcock, McGrew, and Mather (2001).
Program Control Difference Star Standard EffectOutcome Group Mean Group Mean (Impact) Error Sizea
ECLS-B math scoreb (0-44) 26.94 26.63 0.31 0.42 0.05Woodcock-Johnson Applied
Problems standard scorec 102.02 101.19 0.83 0.82 0.06
Sample sizeBlocks 16 16Sites 35 34Children 698 691
Table 4.4
Child-Level Impacts on Math Competencies in the Spring of the Pre-K Year
SOURCE: MDRC calculations based on the direct child assessments administered in spring 2015.
NOTES: Statistical significance levels are indicated as follows: *** = 1 percent; ** = 5 percent; * = 10 percent.Rounding may cause slight discrepancies in sums and differences.aEffect size is calculated by dividing the impact of the program (the difference between the means for the
program group and the control group) by the standard deviation for the control group.bEarly Childhood Longitudinal Study-Birth Cohort math assessment (Najarian, Snow, Lennon, and Kinsey,
2010). The potential score range is from 0 to 44.cWoodcock-Johnson Applied Problems is a child math assessment included in the battery of tests in the
Woodcock-Johnson III Tests of Achievement (Woodcock, McGrew, and Mather, 2001). The score is age normalized to 100, with a standard deviation of 15.
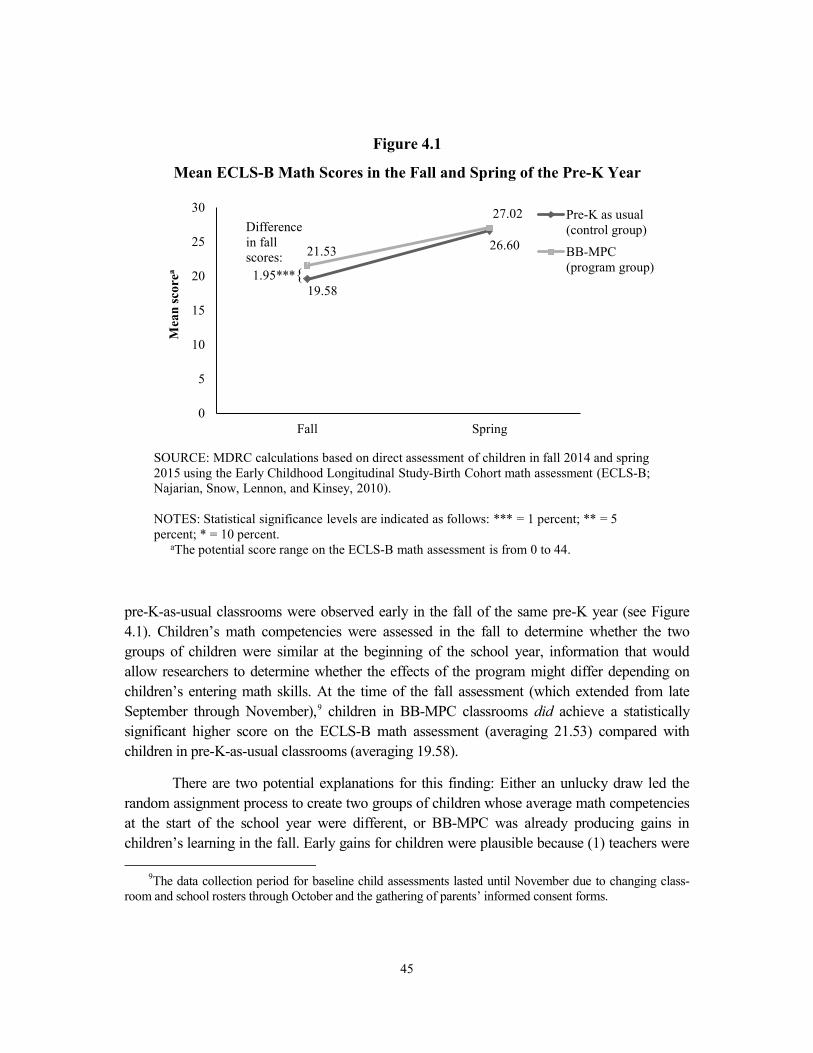
45
pre-K-as-usual classrooms were observed early in the fall of the same pre-K year (see Figure 4.1). Children’s math competencies were assessed in the fall to determine whether the two groups of children were similar at the beginning of the school year, information that would allow researchers to determine whether the effects of the program might differ depending on children’s entering math skills. At the time of the fall assessment (which extended from late September through November),9 children in BB-MPC classrooms did achieve a statistically significant higher score on the ECLS-B math assessment (averaging 21.53) compared with children in pre-K-as-usual classrooms (averaging 19.58).
There are two potential explanations for this finding: Either an unlucky draw led the random assignment process to create two groups of children whose average math competencies at the start of the school year were different, or BB-MPC was already producing gains in children’s learning in the fall. Early gains for children were plausible because (1) teachers were
9The data collection period for baseline child assessments lasted until November due to changing class-room and school rosters through October and the gathering of parents’ informed consent forms.
Figure 4.1
Mean ECLS-B Math Scores in the Fall and Spring of the Pre-K Year
19.58
26.6021.53
27.02
0
5
10
15
20
25
30
Fall Spring
Mea
n sc
orea
Pre-K as usual(control group)
BB-MPC(program group)
Difference in fall scores: |
1.95***{
SOURCE: MDRC calculations based on direct assessment of children in fall 2014 and spring2015 using the Early Childhood Longitudinal Study-Birth Cohort math assessment (ECLS-B; Najarian, Snow, Lennon, and Kinsey, 2010).
NOTES: Statistical significance levels are indicated as follows: *** = 1 percent; ** = 5 percent; * = 10 percent.
aThe potential score range on the ECLS-B math assessment is from 0 to 44.

46
trained in the previous year and could start using the Building Blocks curriculum from the first day of school, and (2) the fall testing process extended from September, when school actually started, into early November for some children. Extensive analyses conducted and described in Appendix A lead to the conclusion that these “early” differences are, in fact, impacts of the BB-MPC program. The impacts on children’s fall test scores emerge and grow larger as the number of days from the start of the school year increases. There are no differences between the BB-MPC and pre-K-as-usual children assessed early in the fall, but there are statistically significant differences between the two groups for children assessed slightly later in the fall. In other words, children who had been exposed to several weeks of the curriculum had similar math skills to those of their peers in pre-K-as-usual classrooms, but children who had received a few months of the curriculum had higher math scores than pre-K-as-usual children. It is important to note that these impacts do not appear to be due to other differences in classrooms at the time of random assignment. The pre-K-as-usual and BB-MPC classrooms were similar on all measures of teacher practices and classroom climate at the time of randomization (in the spring before the first implementation year began). (See Appendix A for more details on baseline equivalence.)
As previously mentioned, these early impacts observed at the start of the school year appear to have faded over time as pre-K-as-usual children “caught up” to BB-MPC children in math. By the spring assessment, children in the control group scored an average of 26.60 while children in the program group scored an average of 27.02; the difference between the two groups’ scores is not statistically significant. Children in both groups showed gains in learning from the start of the school year to the spring of the school year, but the pre-K-as-usual group appeared to gain a bit more, closing the early gap. This rate of learning among children in the pre-K-as-usual group may be in part due to the relatively high amount of math instruction in control group classrooms described earlier.
● BB-MPC did not improve children’s language or executive function skills by the end of pre-K.
Table 4.5 shows that there was little evidence of the impact of BB-MPC on other child outcomes. (Box 4.4 explains how these outcomes were assessed.) With regard to children’s language ability (that is, the range of vocabulary words they know), BB-MPC had no statistical-ly significant impact. Also of considerable interest was whether BB-MPC might improve children’s regulation of their thinking and behavior, or executive function, which comprises working memory (the ability to keep a number of pieces of information in the mind at once), cognitive flexibility (the ability to flexibly shift between pieces of information), and inhibition (the ability to stop or repress an immediate response). Three measures of children’s executive function were collected, each assessing a slightly different set of these skills. Of the three
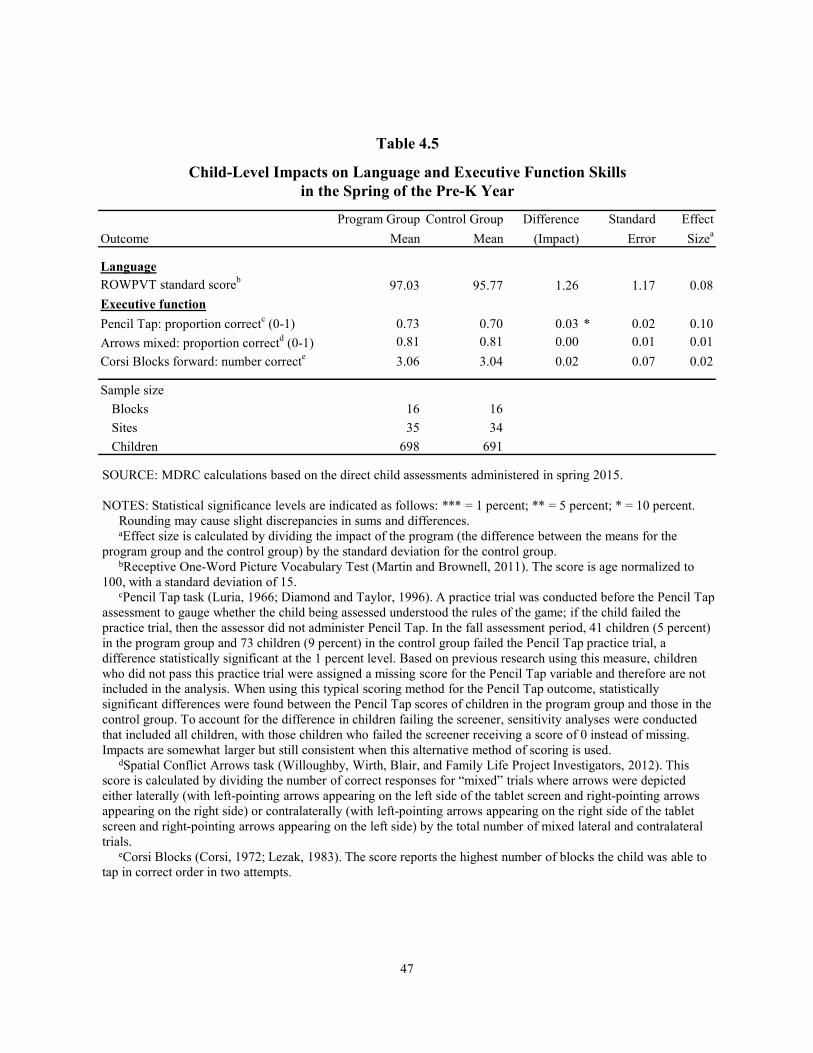
47
Program Group Control Group Difference Standard EffectOutcome Mean Mean (Impact) Error Sizea
LanguageROWPVT standard scoreb 97.03 95.77 1.26 1.17 0.08Executive functionPencil Tap: proportion correctc (0-1) 0.73 0.70 0.03 * 0.02 0.10Arrows mixed: proportion correctd (0-1) 0.81 0.81 0.00 0.01 0.01Corsi Blocks forward: number correcte 3.06 3.04 0.02 0.07 0.02
Sample sizeBlocks 16 16Sites 35 34Children 698 691
Table 4.5
Child-Level Impacts on Language and Executive Function Skillsin the Spring of the Pre-K Year
Stars
SOURCE: MDRC calculations based on the direct child assessments administered in spring 2015.
NOTES: Statistical significance levels are indicated as follows: *** = 1 percent; ** = 5 percent; * = 10 percent.Rounding may cause slight discrepancies in sums and differences.aEffect size is calculated by dividing the impact of the program (the difference between the means for the
program group and the control group) by the standard deviation for the control group.bReceptive One-Word Picture Vocabulary Test (Martin and Brownell, 2011). The score is age normalized to
100, with a standard deviation of 15.cPencil Tap task (Luria, 1966; Diamond and Taylor, 1996). A practice trial was conducted before the Pencil Tap
assessment to gauge whether the child being assessed understood the rules of the game; if the child failed the practice trial, then the assessor did not administer Pencil Tap. In the fall assessment period, 41 children (5 percent) in the program group and 73 children (9 percent) in the control group failed the Pencil Tap practice trial, a difference statistically significant at the 1 percent level. Based on previous research using this measure, children who did not pass this practice trial were assigned a missing score for the Pencil Tap variable and therefore are not included in the analysis. When using this typical scoring method for the Pencil Tap outcome, statistically significant differences were found between the Pencil Tap scores of children in the program group and those in the control group. To account for the difference in children failing the screener, sensitivity analyses were conducted that included all children, with those children who failed the screener receiving a score of 0 instead of missing. Impacts are somewhat larger but still consistent when this alternative method of scoring is used.
dSpatial Conflict Arrows task (Willoughby, Wirth, Blair, and Family Life Project Investigators, 2012). This score is calculated by dividing the number of correct responses for “mixed” trials where arrows were depicted either laterally (with left-pointing arrows appearing on the left side of the tablet screen and right-pointing arrows appearing on the right side) or contralaterally (with left-pointing arrows appearing on the right side of the tablet screen and right-pointing arrows appearing on the left side) by the total number of mixed lateral and contralateral trials.
eCorsi Blocks (Corsi, 1972; Lezak, 1983). The score reports the highest number of blocks the child was able to tap in correct order in two attempts.
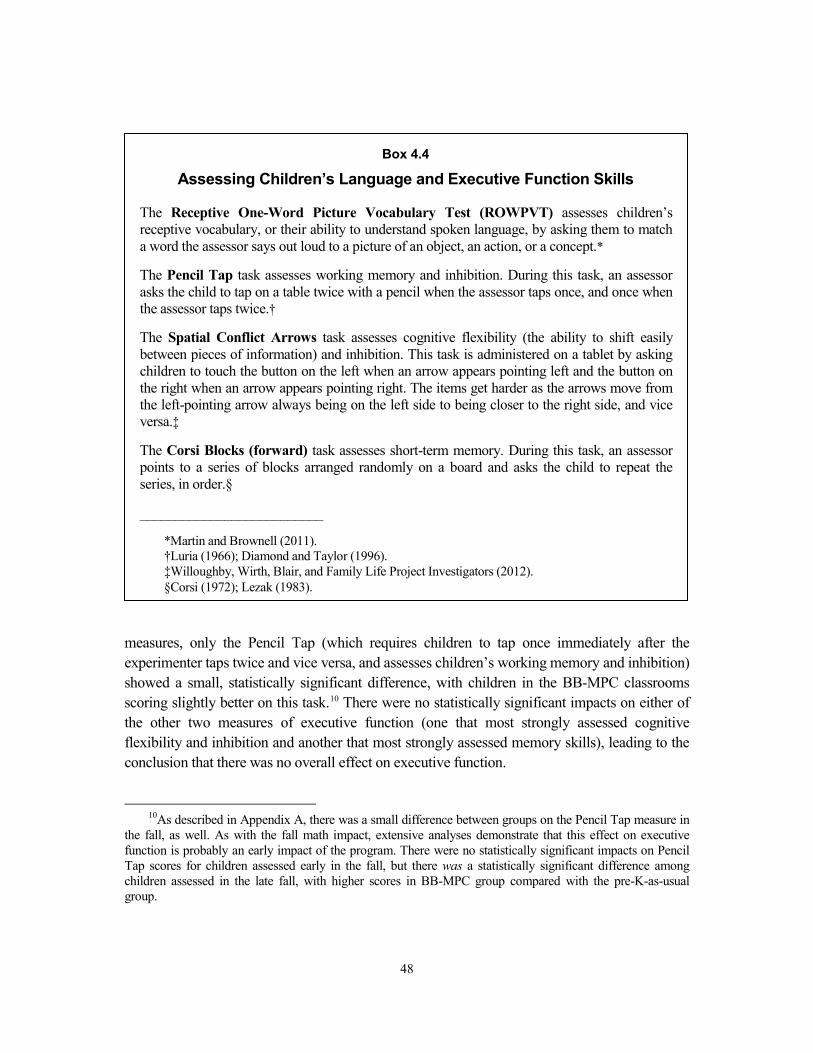
48
measures, only the Pencil Tap (which requires children to tap once immediately after the experimenter taps twice and vice versa, and assesses children’s working memory and inhibition) showed a small, statistically significant difference, with children in the BB-MPC classrooms scoring slightly better on this task.10 There were no statistically significant impacts on either of the other two measures of executive function (one that most strongly assessed cognitive flexibility and inhibition and another that most strongly assessed memory skills), leading to the conclusion that there was no overall effect on executive function.
10As described in Appendix A, there was a small difference between groups on the Pencil Tap measure in
the fall, as well. As with the fall math impact, extensive analyses demonstrate that this effect on executive function is probably an early impact of the program. There were no statistically significant impacts on Pencil Tap scores for children assessed early in the fall, but there was a statistically significant difference among children assessed in the late fall, with higher scores in BB-MPC group compared with the pre-K-as-usual group.
Box 4.4
Assessing Children’s Language and Executive Function Skills
The Receptive One-Word Picture Vocabulary Test (ROWPVT) assesses children’s receptive vocabulary, or their ability to understand spoken language, by asking them to match a word the assessor says out loud to a picture of an object, an action, or a concept.*
The Pencil Tap task assesses working memory and inhibition. During this task, an assessor asks the child to tap on a table twice with a pencil when the assessor taps once, and once when the assessor taps twice.†
The Spatial Conflict Arrows task assesses cognitive flexibility (the ability to shift easily between pieces of information) and inhibition. This task is administered on a tablet by asking children to touch the button on the left when an arrow appears pointing left and the button on the right when an arrow appears pointing right. The items get harder as the arrows move from the left-pointing arrow always being on the left side to being closer to the right side, and vice versa.‡
The Corsi Blocks (forward) task assesses short-term memory. During this task, an assessor points to a series of blocks arranged randomly on a board and asks the child to repeat the series, in order.§
__________________________
*Martin and Brownell (2011). †Luria (1966); Diamond and Taylor (1996). ‡Willoughby, Wirth, Blair, and Family Life Project Investigators (2012). §Corsi (1972); Lezak (1983).
49
Where and for Whom Did Effects of BB-MPC Vary? To further understand where BB-MPC may have had an effect and for whom, a small set of subgroup analyses were conducted, focusing on differences in the impact of the program by venue (public school compared with community-based settings) and by select child characteris-tics. These analyses were prespecified to limit the number of analyses conducted. However, for several reasons these analyses are considered exploratory. First, prior work on Building Blocks has generally not identified subgroups for which effects differ, so there was little previous work to base strong predictions of differences across groups. Second, because the outcomes included several measures of math, language, and executive function, subgroup analyses entail examin-ing multiple comparisons, which increases the likelihood of finding a statistically significant program impact simply by chance. Third, these analyses may lack the power to detect meaning-ful or true program impacts because some subgroups make up only a small part of the sample, making it harder to detect statistically significant differences between the groups.11 For all these reasons, the findings below are only suggestive until they can be replicated in other studies of Building Blocks.
● Children with higher receptive language skills at pre-K entry, with greater ability to understand language that is heard, appear to have in-creased math proficiency as a result of participating in BB-MPC. In contrast, there were no differences in impacts on children’s math skills for subgroups defined by pre-K venue (community-based organizations versus public schools) or by other child characteristics (for example, self-regulation skills at pre-K entry).
Given that Making Pre-K Count’s sample of pre-K programs included a wide variety of pre-K classrooms in both public schools and in community-based organizations (CBOs), there was interest in understanding whether impacts might differ by venue. It was hypothesized that impacts on teachers’ math instruction would be stronger in public schools than in community-based sites. Nationally, public school teachers are generally required to hold a bachelor’s degree and tend to have somewhat higher educational attainment or credentials; it was hypothesized that they may therefore be better equipped to take on the challenging demands of BB-MPC.12 Findings shown in Table 4.6 largely contradict this hypothesis. The impact on the amount of math instruction was larger in CBOs, with 17 additional minutes of teacher-led math in the BB-MPC CBOs compared with the pre-K-as-usual CBOs, while the impact was less than 10 additional teacher-led math minutes in BB-MPC public schools compared with pre-K-as-usual public schools.
11This is especially true in the case of analyses by site characteristics. 12Saluja, Early, and Clifford (2002).
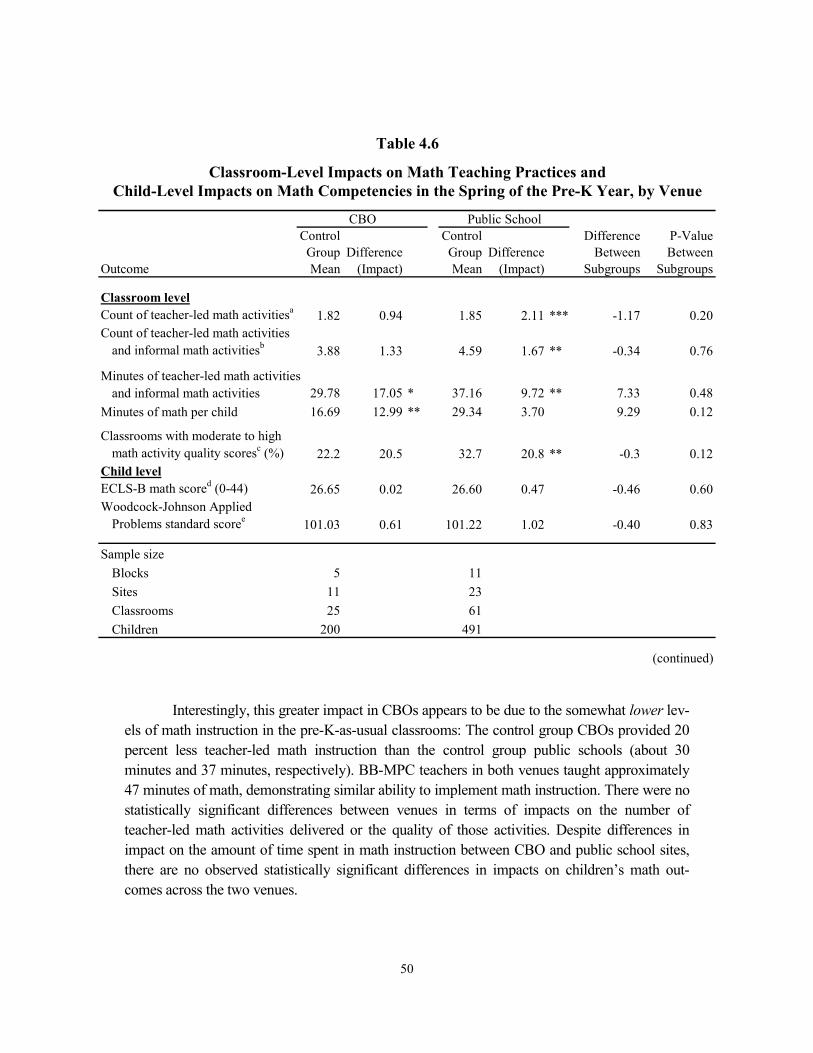
50
Interestingly, this greater impact in CBOs appears to be due to the somewhat lower lev-els of math instruction in the pre-K-as-usual classrooms: The control group CBOs provided 20 percent less teacher-led math instruction than the control group public schools (about 30 minutes and 37 minutes, respectively). BB-MPC teachers in both venues taught approximately 47 minutes of math, demonstrating similar ability to implement math instruction. There were no statistically significant differences between venues in terms of impacts on the number of teacher-led math activities delivered or the quality of those activities. Despite differences in impact on the amount of time spent in math instruction between CBO and public school sites, there are no observed statistically significant differences in impacts on children’s math out-comes across the two venues.
Control Stars Control Stars Differencears P-ValueGroup Difference Group Difference Between Between
Outcome Mean (Impact) Mean (Impact) Subgroups Subgroups
Classroom levelCount of teacher-led math activitiesa 1.82 0.94 1.85 2.11 *** -1.17 0.20Count of teacher-led math activities
and informal math activitiesb 3.88 1.33 4.59 1.67 ** -0.34 0.76
Minutes of teacher-led math activitiesand informal math activities 29.78 17.05 * 37.16 9.72 ** 7.33 0.48
Minutes of math per child 16.69 12.99 ** 29.34 3.70 9.29 0.12
Classrooms with moderate to highmath activity quality scoresc (%) 22.2 20.5 32.7 20.8 ** -0.3 0.12
Child levelECLS-B math scored (0-44) 26.65 0.02 26.60 0.47 -0.46 0.60Woodcock-Johnson Applied
Problems standard scoree 101.03 0.61 101.22 1.02 -0.40 0.83
Sample sizeBlocks 5 11Sites 11 23Classrooms 25 61Children 200 491
(continued)
Table 4.6
Classroom-Level Impacts on Math Teaching Practices andChild-Level Impacts on Math Competencies in the Spring of the Pre-K Year, by Venue
CBO Public School
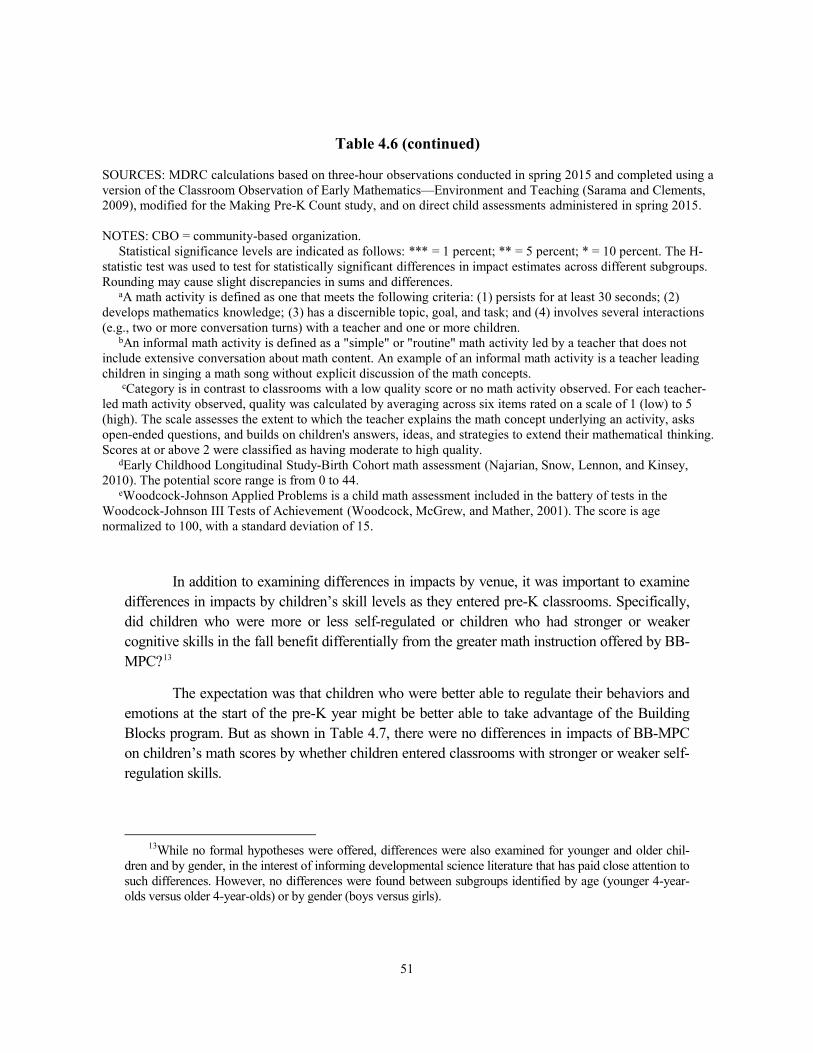
51
In addition to examining differences in impacts by venue, it was important to examine differences in impacts by children’s skill levels as they entered pre-K classrooms. Specifically, did children who were more or less self-regulated or children who had stronger or weaker cognitive skills in the fall benefit differentially from the greater math instruction offered by BB-MPC?13
The expectation was that children who were better able to regulate their behaviors and emotions at the start of the pre-K year might be better able to take advantage of the Building Blocks program. But as shown in Table 4.7, there were no differences in impacts of BB-MPC on children’s math scores by whether children entered classrooms with stronger or weaker self-regulation skills.
13While no formal hypotheses were offered, differences were also examined for younger and older chil-
dren and by gender, in the interest of informing developmental science literature that has paid close attention to such differences. However, no differences were found between subgroups identified by age (younger 4-year-olds versus older 4-year-olds) or by gender (boys versus girls).
Table 4.6 (continued)
SOURCES: MDRC calculations based on three-hour observations conducted in spring 2015 and completed using a version of the Classroom Observation of Early Mathematics—Environment and Teaching (Sarama and Clements, 2009), modified for the Making Pre-K Count study, and on direct child assessments administered in spring 2015.
NOTES: CBO = community-based organization. Statistical significance levels are indicated as follows: *** = 1 percent; ** = 5 percent; * = 10 percent. The H-
statistic test was used to test for statistically significant differences in impact estimates across different subgroups. Rounding may cause slight discrepancies in sums and differences.
aA math activity is defined as one that meets the following criteria: (1) persists for at least 30 seconds; (2) develops mathematics knowledge; (3) has a discernible topic, goal, and task; and (4) involves several interactions (e.g., two or more conversation turns) with a teacher and one or more children.
bAn informal math activity is defined as a "simple" or "routine" math activity led by a teacher that does not include extensive conversation about math content. An example of an informal math activity is a teacher leading children in singing a math song without explicit discussion of the math concepts.
cCategory is in contrast to classrooms with a low quality score or no math activity observed. For each teacher-led math activity observed, quality was calculated by averaging across six items rated on a scale of 1 (low) to 5 (high). The scale assesses the extent to which the teacher explains the math concept underlying an activity, asks open-ended questions, and builds on children's answers, ideas, and strategies to extend their mathematical thinking. Scores at or above 2 were classified as having moderate to high quality.
dEarly Childhood Longitudinal Study-Birth Cohort math assessment (Najarian, Snow, Lennon, and Kinsey, 2010). The potential score range is from 0 to 44.
eWoodcock-Johnson Applied Problems is a child math assessment included in the battery of tests in the Woodcock-Johnson III Tests of Achievement (Woodcock, McGrew, and Mather, 2001). The score is age normalized to 100, with a standard deviation of 15.
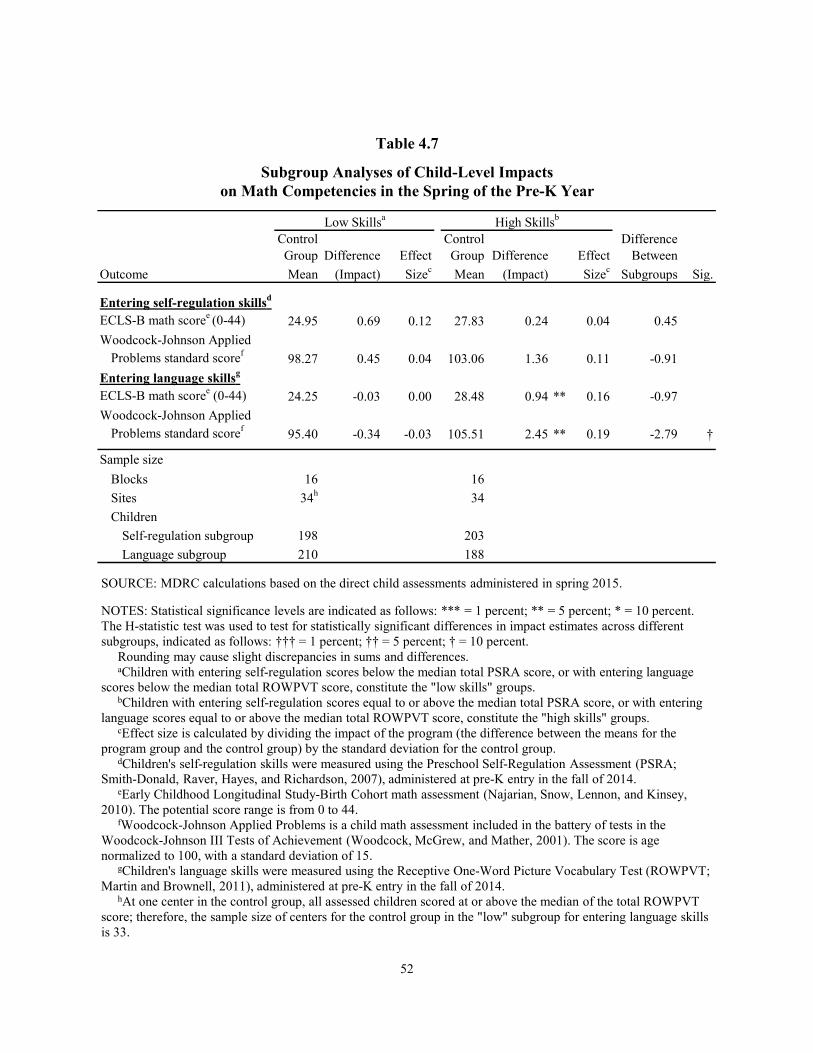
52
Path:P:\PROJECTS - Active\Making Pre-K Count 2016\2. Tables and Figures\3. Edited_FINAL\[mpc-short-report_t
Control Control DifferenceGroup Difference Effect Group Difference Effect Between
Outcome Mean (Impact) rs Sizec Mean (Impact) Star Sizec Subgroups Sig.
Entering self-regulation skillsd
ECLS-B math scoree (0-44) 24.95 0.69 0.12 27.83 0.24 0.04 0.45Woodcock-Johnson Applied
Problems standard scoref 98.27 0.45 0.04 103.06 1.36 0.11 -0.91Entering language skillsg
ECLS-B math scoree (0-44) 24.25 -0.03 0.00 28.48 0.94 ** 0.16 -0.97Woodcock-Johnson Applied
Problems standard scoref 95.40 -0.34 -0.03 105.51 2.45 ** 0.19 -2.79 †
Sample sizeBlocks 16 16Sites 34h 34Children
Self-regulation subgroup 198 203Language subgroup 210 188
Table 4.7
Subgroup Analyses of Child-Level Impactson Math Competencies in the Spring of the Pre-K Year
Low Skillsa High Skillsb
SOURCE: MDRC calculations based on the direct child assessments administered in spring 2015.
NOTES: Statistical significance levels are indicated as follows: *** = 1 percent; ** = 5 percent; * = 10 percent. The H-statistic test was used to test for statistically significant differences in impact estimates across different subgroups, indicated as follows: ††† = 1 percent; †† = 5 percent; † = 10 percent.
Rounding may cause slight discrepancies in sums and differences.aChildren with entering self-regulation scores below the median total PSRA score, or with entering language
scores below the median total ROWPVT score, constitute the "low skills" groups.bChildren with entering self-regulation scores equal to or above the median total PSRA score, or with entering
language scores equal to or above the median total ROWPVT score, constitute the "high skills" groups.cEffect size is calculated by dividing the impact of the program (the difference between the means for the
program group and the control group) by the standard deviation for the control group.dChildren's self-regulation skills were measured using the Preschool Self-Regulation Assessment (PSRA;
Smith-Donald, Raver, Hayes, and Richardson, 2007), administered at pre-K entry in the fall of 2014.eEarly Childhood Longitudinal Study-Birth Cohort math assessment (Najarian, Snow, Lennon, and Kinsey,
2010). The potential score range is from 0 to 44. fWoodcock-Johnson Applied Problems is a child math assessment included in the battery of tests in the
Woodcock-Johnson III Tests of Achievement (Woodcock, McGrew, and Mather, 2001). The score is age normalized to 100, with a standard deviation of 15.
gChildren's language skills were measured using the Receptive One-Word Picture Vocabulary Test (ROWPVT; Martin and Brownell, 2011), administered at pre-K entry in the fall of 2014.
hAt one center in the control group, all assessed children scored at or above the median of the total ROWPVT score; therefore, the sample size of centers for the control group in the "low" subgroup for entering language skills is 33.
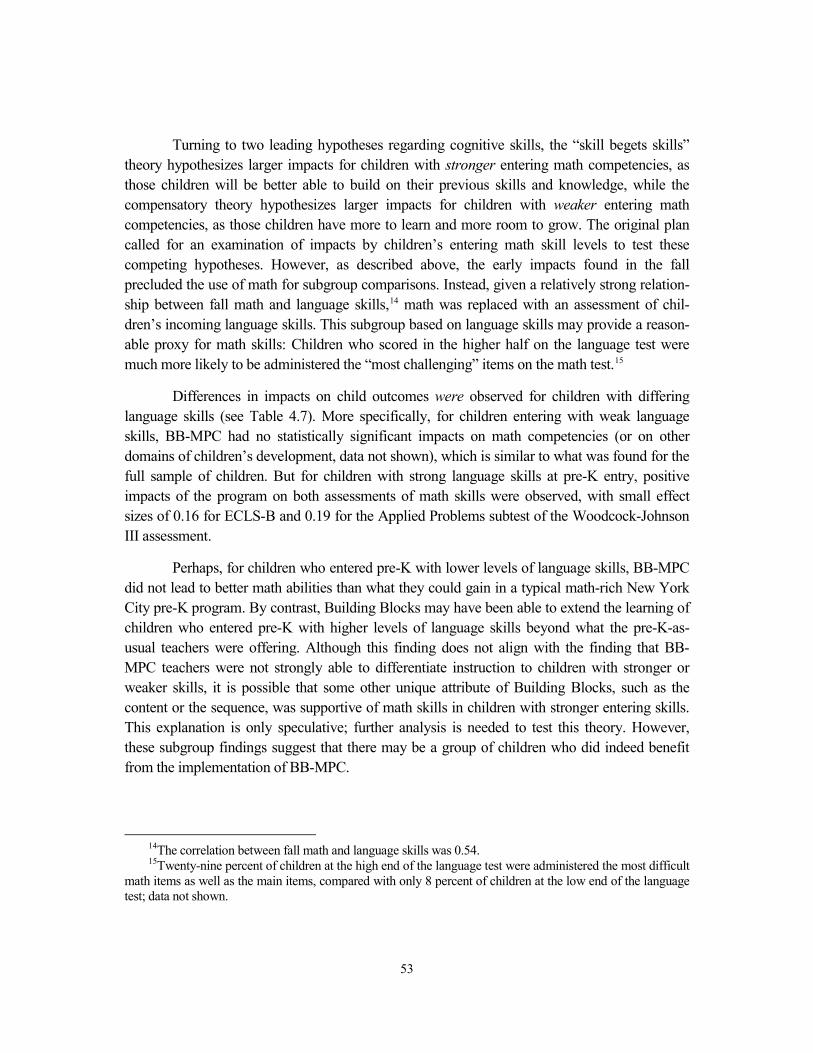
53
Turning to two leading hypotheses regarding cognitive skills, the “skill begets skills” theory hypothesizes larger impacts for children with stronger entering math competencies, as those children will be better able to build on their previous skills and knowledge, while the compensatory theory hypothesizes larger impacts for children with weaker entering math competencies, as those children have more to learn and more room to grow. The original plan called for an examination of impacts by children’s entering math skill levels to test these competing hypotheses. However, as described above, the early impacts found in the fall precluded the use of math for subgroup comparisons. Instead, given a relatively strong relation-ship between fall math and language skills,14 math was replaced with an assessment of chil-dren’s incoming language skills. This subgroup based on language skills may provide a reason-able proxy for math skills: Children who scored in the higher half on the language test were much more likely to be administered the “most challenging” items on the math test.15
Differences in impacts on child outcomes were observed for children with differing language skills (see Table 4.7). More specifically, for children entering with weak language skills, BB-MPC had no statistically significant impacts on math competencies (or on other domains of children’s development, data not shown), which is similar to what was found for the full sample of children. But for children with strong language skills at pre-K entry, positive impacts of the program on both assessments of math skills were observed, with small effect sizes of 0.16 for ECLS-B and 0.19 for the Applied Problems subtest of the Woodcock-Johnson III assessment.
Perhaps, for children who entered pre-K with lower levels of language skills, BB-MPC did not lead to better math abilities than what they could gain in a typical math-rich New York City pre-K program. By contrast, Building Blocks may have been able to extend the learning of children who entered pre-K with higher levels of language skills beyond what the pre-K-as-usual teachers were offering. Although this finding does not align with the finding that BB-MPC teachers were not strongly able to differentiate instruction to children with stronger or weaker skills, it is possible that some other unique attribute of Building Blocks, such as the content or the sequence, was supportive of math skills in children with stronger entering skills. This explanation is only speculative; further analysis is needed to test this theory. However, these subgroup findings suggest that there may be a group of children who did indeed benefit from the implementation of BB-MPC.
14The correlation between fall math and language skills was 0.54. 15Twenty-nine percent of children at the high end of the language test were administered the most difficult
math items as well as the main items, compared with only 8 percent of children at the low end of the language test; data not shown.
54
Summary Findings presented in this chapter demonstrate that BB-MPC did lead to teachers delivering more math instruction in their classrooms and providing more math activities to children across a variety of math learning areas. However, impacts on the quality of instruction were mixed. Although BB-MPC teachers were more likely to be observed delivering at least moderate-quality math instruction than pre-K-as-usual teachers, in other general aspects of instructional quality, the two groups did not differ. Further, BB-MPC teachers’ math instruction did not result in improvements to children’s learning. While children in BB-MPC classrooms initially learned more math (likely as a result of more math instruction at the start of the school year), those findings dissipated as both pre-K-as-usual and BB-MPC group children gained in their math learning over the course of the year, resulting in no differences between groups of children by the spring of the pre-K year. Last, there were no impacts on other areas of children’s devel-opment. At this point, why the greater math instruction observed among teachers did not lead to gains in children’s math learning at the end of pre-K is unclear. In the next chapter, a number of potential explanations for this unexpected pattern of findings are presented.
55
Chapter 5
Discussion and Open Questions
Making Pre-K Count was designed to address the persistent achievement lag of low-income children by providing them with enhanced instruction in math during preschool. At the outset, the hope was that a focus on math instruction would improve the quality of preschool instruc-tion and lead to children’s long-term academic success. Unfortunately, whether because of the particular New York City context or in the design of the study, the promise of this approach had not emerged by the spring of the prekindergarten (pre-K) year. This chapter briefly summarizes the early results of this study and then presents a number of possible explanations for the findings that have emerged so far. These explanations will be the focus of further inquiry, which will be presented in future reports.
Findings presented in this report point to both successes and challenges in supporting preschool quality and the long-term outcomes of poor children through the implementation of the Building Blocks program in New York City. (The term preschool is used here to refer to programs that may or may not be primarily for 4-year-olds.) Overall, Building Blocks-Making Pre-K Count (BB-MPC) was delivered at an acceptable level of implementation, with high levels of training and coaching for teachers, and satisfactory program delivery in most — although not all — of the core curricular components. Implementation was strongest for the classroom-wide components: Whole Group, in which teachers conducted activities with all children in the classroom, and Hands On Math Centers, where math materials were provided for children to explore. Implementation was somewhat less strong for the individualized compo-nents, in particular for activities in the Computer component that were designed to provide instruction aimed specifically to a child’s individual level of math knowledge. Moreover, BB-MPC did lead to increases in the amount of teachers’ math instruction — despite substantially higher levels of math instruction than expected in pre-K-as-usual classrooms — with nearly 12 additional minutes of math and two more math activities delivered by BB-MPC teachers across a range of math content areas (numbers, operations, and geometry) in a three-hour observation period. Effects on instructional quality varied more. BB-MPC led to small improvements in the quality of math instruction, but not in the quality of teachers’ instruction more generally — quality of instruction being an area where pre-K teachers often struggle. While children saw some early gains in math skills in the fall from BB-MPC compared with the scores of children in the pre-K-as-usual classrooms, these math impacts were not sustained into the spring of pre-K. Nor were there the hoped-for cascading effects into other areas of children’s learning and development, namely language and executive function skills.

56
Findings from Making Pre-K Count are consistent with neither prior published work on Building Blocks nor studies of the effects of preschool math programs more generally, with one important exception. These findings do align with as-yet-unpublished data from a recent Building Blocks study in San Diego, which, like Making Pre-K Count, had substantially more math instruction in the control group context and a larger sample of Hispanic children than prior trials. In San Diego, there were no effects on children’s math learning by the end of preschool, although math gains were observed earlier in the fall of the preschool year and also when the children were reassessed at the end of the kindergarten year. As discussed in Chapter 2, these findings stand in stark contrast to a number of other studies that consistently show the benefits of Building Blocks for preschool children’s math outcomes.
Further analytic work, which will be the subject of future reports from the Making Pre-K Count study, will be conducted to investigate the short-term findings from pre-K in depth and to report on longer-term impacts in kindergarten. The kindergarten data will also address whether there was an added effect of another year of math intervention for children who received the High 5s math clubs described in Chapter 1 (see Box 1.1), which were aimed at aligning children’s math experiences in pre-K and kindergarten.
Open Questions Given their inconsistency with prior research, these findings raise a number of questions for consideration and exploration. Below are four open questions that the kindergarten data and further analysis of the pre-K data may address.
● Did the high level of math already in place in New York City pre-K pro-grams limit how much value Building Blocks could add for children’s math learning?
Previous research had suggested a dearth of math instruction in preschool. Thus, the goal of Making Pre-K Count was to increase the amount of math instruction to which young children were exposed during this period. And the program achieved that goal. In fact, Making Pre-K Count’s impact on math instruction — approximately 12 additional minutes — was substantially larger than that seen in two previous Building Blocks studies, where program group classrooms typically spent just 2 to 5 more minutes on math instruction than control group classrooms, a non-statistically significant increase.1 However, it may be that increasing the amount of instruction cannot further contribute to children’s math learning when it is on top of the already large amount of math observed in New York City’s business-as-usual pre-K
1Clements and Sarama (2008); Clements et al. (2011).

57
programs. In short, perhaps this is a situation of diminishing returns to math instruction beyond a certain level.
Control group pre-K sites in the study offered about 35 minutes of teacher-led math within a three-hour period — levels substantially and surprisingly higher than those reported in other Building Blocks studies, where less time was typically spent on math in control group classrooms.2 These higher levels may be due to a historical shift in attention to early math; a review of Building Blocks studies shows a steadily rising trend in the amount of math instruc-tion in control group sites from the earliest studies in 2008 to the most recent ones in 2011, with 10 minutes more of math in recent studies than in earlier ones. But the higher control group levels may also be due to a unique aspect of pre-K in New York City. Pre-K programs in New York City public schools, which make up the majority of sites in the Making Pre-K Count sample, often set aside a dedicated “math block” of 35 minutes a day. The 35 minutes of math in a morning may be partially ascribed, therefore, to teachers responding to these schedules by delivering math instruction during this time. As the BB-MPC pilot program was ramping up, New York City was rolling out the Common Core learning standards in kindergarten through twelfth grade as well as in pre-K, providing teachers with a framework for math and literacy instruction that may have guided their delivery of math instruction during the “set aside” time. During the following years, when BB-MPC was moving to full implementation, pre-K in New York City suddenly found itself under extreme scrutiny due to the de Blasio mayoral admin-istration’s highly publicized rollout of universal pre-K. As such, the New York City context, where a substantial amount of math instruction was already occurring for the various reasons described, stands out as unique in this study of Building Blocks and may have played a large role in the absence of early effects on children observed in the spring of the pre-K year.
● Was Making Pre-K Count able to strengthen the teacher practices that might help produce gains in children’s learning in general?
It was expected that BB-MPC would not only increase the amount of math instruction but also have cascading effects on teachers’ instruction by encouraging teachers to ask children open-ended questions to explain their mathematical thinking (for example, “How do you know?”). Building Blocks was thus seen as a route to high-quality instruction — as much a program focused on language and metacognition (that is, having children articulate their thinking) as a “math” program. In fact, changing the manner in which preschool teachers speak to and with children has been a long-sought goal in high-quality preschool programs, making Building Blocks an especially promising route for improving the quality of instruction. But while BB-MPC teachers delivered all the curriculum content — by and large providing children with the requisite Building Blocks components and completing all or nearly all the planned
2Clements and Sarama (2008); Clements et al. (2011).
58
lessons for the year — they were not able to use high-quality instructional strategies to extend children’s math learning nearly as much as expected. Even as the BB-MPC teachers were more likely to deliver slightly better-quality math instruction than their pre-K-as-usual counterparts, math instructional quality averaged less than a 2 on a 5-point scale. Additionally, BB-MPC teachers were not observed to use higher-quality instructional strategies more generally than teachers in pre-K-as-usual classrooms, with general instructional quality scores in Making Pre-K Count similar to scores in other preschool studies (2.4 on a scale of 1 to 7).3
Building Blocks’ focus on learning trajectories was also expected to help teachers better adapt instruction for each child; that is, to individually tailor instruction to each child’s current level of math understanding. The complexity of the multicomponent curriculum, however, might have presented challenges for doing so. The two components of Building Blocks with the greatest opportunity for individualizing instruction were Small Group and Computer activities. Both of these components, and especially Computer, had slightly lower implementation levels on average than either Whole Group or Hands On Math Centers. A reason for those lower implementation levels may have been the difficulty teachers have in maintaining engagement and managing behavior in the classroom while simultaneously helping two to four children learn in a small group or monitoring and cycling children on and off the computer. Further investigation may shed light on the importance of these two components for improving the quality of teachers’ instruction and children’s math learning.
● How might the particular nature of the pre-K population in New York City have influenced these findings?
There are a number of ways that the sample for this study differed from prior studies of Building Blocks. First, the sample in New York included more children of Hispanic origin and children who were English-language learners. Just over half (56 percent) of the Making Pre-K Count sample was of Hispanic origin, and 20 percent of children who were assessed spoke mostly Spanish in the fall of the pre-K year, whereas Hispanic children make up less than 22 percent of the samples in previously published studies of Building Blocks.4 While Building Blocks provides resources for each week’s lesson to support English learners, language barriers may have prevented Spanish-speaking children from benefiting as strongly as their English-speaking counterparts from the program. In fact, newly released findings show that the impacts
3The instructional support domain of the Classroom Assessment Scoring System (CLASS) has consistent-
ly found substantially lower quality levels in preschool than in the elementary years, and much lower levels than for other measured aspects of classroom climate (Hamre, Pianta, Mashburn, and Downer, 2007).
4Clements et al. (2011).
59
of Building Blocks in previous studies were largest for black and white non-Hispanic children and were smallest and faded most quickly for Hispanic children.5
In addition, the children in both BB-MPC and control group classrooms may have scored higher on measures of cognitive skills than might have been expected for a low-income sample. For instance, children in both groups in the Making Pre-K Count study scored approx-imately 95 on the normed language assessment, close to the average of 100 for the normed sample, though low-income samples have historically scored closer to one standard deviation (15 points) lower on such standardized language assessments.6 Children in the control group in the present study also scored slightly higher in the fall (50 percent correct) on the Pencil Tap, a measure of executive function, than a nationally representative sample of Head Start children (43 percent correct) or a sample of low-income preschoolers across eight states (46 percent).7 Yet Making Pre-K Count participants were overwhelmingly low-income children of color, from some of the poorest communities in New York City. These higher scores could be due to outdated norms, or norms that do not reflect the urban sample of New York City, where children are exposed to group care environments from an early age. It is unclear what, if any, effect these higher scores might have on the likelihood that a pre-K program would improve children’s skills.
Finally, given the diversity of New York City, it is possible that there may have been a wider range of children’s skill levels within classrooms than in prior Building Blocks studies. Wide variability in children’s skills could play a role in teachers’ ability to individualize instruction, making it more difficult to fully support children’s learning in the context of Building Blocks, a possibility to be explored in future work on this project.
● Does this study fully assess, at this early follow-up point and with these measures, children’s deep math learning?
Previous studies of Building Blocks have generally used a very detailed and specific measure of math knowledge and skill, the Research-Based Early Math Assessment (REMA),8 which assesses children in detail across the many content areas covered in Building Blocks, including geometry. The ECLS-B, the measure employed in the current study, provides a validated measure of children’s math skills in both English and Spanish, but it focuses largely on number knowledge and operations, with few geometry questions. The Woodcock-Johnson III measure was chosen as a more general assessment of math, one that is nationally normed and has been linked to future outcomes in other research. Given the emphasis Building Blocks
5Clements et al. (2016). 6Moiduddin et al. (2012); Reardon and Portilla (2016). 7Moiduddin et al. (2012); Williford et al. (2013). 8Clements, Sarama, and Liu (2008).

60
places on geometry, it is indeed possible that a more comprehensive measure of children’s math learning would have found an impact in favor of BB-MPC relative to the control group.
Moreover, it remains an open question whether the short- and longer-term effects of this program could differ. It could be that children have learned math better in BB-MPC classrooms but that learning will not become apparent until they are challenged with more complex math concepts as they move into elementary school. It could matter in the longer term that children were exposed to more and somewhat better math instruction for longer periods of time in preschool, a time when they are forming a foundation of learning for the seminal math concepts that they will encounter in elementary school. Indeed, the new findings from San Diego described above seem to support this hypothesis, with early fall impacts fading by the end of preschool but reemerging in kindergarten.
What’s Next? Many open questions remain about the initial implementation and impact findings of BB-MPC in pre-K. In the coming year, the Making Pre-K Count team’s continuing analyses will use the existing pre-K data to make headway on these questions where possible.
Meanwhile, the Making Pre-K Count child cohort has moved on to kindergarten. Data collection from the spring of 2016 will help address some of the open questions presented above. Notably, the kindergarten data collection includes an expanded math measure that assesses children’s geometry skills in addition to other math competencies. This will help reveal the role of measurement in the pre-K findings, as well as help answer whether BB-MPC has any longer-term effects that extend beyond the pre-K year.
As discussed in Chapter 1, a companion study extends Making Pre-K Count’s focus on math with a second year of math intervention. Specifically, the High 5s math clubs provide an additional 75 minutes weekly of math instruction to a random sample of kindergartners who received BB-MPC in pre-K. This intervention was designed to provide children with an extra boost of math outside the classroom as they enter kindergartens that may vary in both instruc-tional quality and the amount of math instruction (even as all are attempting to meet Common Core standards). Because children in the BB-MPC group were randomized either to receive High 5s or not, the kindergarten data collection will provide an opportunity to assess the impact of two years of math intervention (Building Blocks in pre-K plus the High 5s math clubs) compared with one year of math intervention (Building Blocks in pre-K).
Future reports will detail these further analyses and present findings on the impact of both Building Blocks and High 5s on children’s math, language, and executive function skills in kindergarten. As preschool programming for low-income children continues to expand across

61
the country, information about how best to scale up these programs while retaining quality is critical. The initial Making Pre-K Count findings point to some of the potential challenges with providing programming on a large scale in new contexts. Longer-term follow-up in kindergar-ten, findings from the High 5s intervention, and additional analysis of the Making Pre-K Count data will further investigate how best to ensure the effectiveness and quality of pre-K for specific populations.


Appendix A
Baseline Equivalence of Teachers, Parents, and Children Across Program and Control Groups


65
In a random assignment study, the expectation is that random assignment will result in program and control groups with similar characteristics at the beginning of the study. Appendix A explores the extent to which random assignment in Making Pre-K Count yielded comparable research groups by comparing the baseline characteristics of the teachers, classrooms, and children across Building Blocks-Making Pre-K Count (BB-MPC) and pre-K-as-usual groups. Even if the two research groups were similar, it is possible that some statistically significant differences in baseline characteristics might be found.
Differences between teachers, classrooms, and children in the control group and the program group are examined in a hierarchical model. This model accounts for the nested structure of the data (students within classrooms, teachers and/or classrooms within sites). As in the impact analyses, random assignment block is included as a school-level covariate. (See Appendix B for more information about the general analytic model.)
Comparison of Baseline Characteristics for Teachers and Classrooms The Making Pre-K Count teacher and classroom sample includes three subsets. The baseline sample of teachers and classrooms includes only teachers and classrooms (n = 172) that were present in the spring of 2013, before random assignment, the implementation of the program, or training on the program in Year 1. Baseline data on teacher demographic and psychosocial characteristics, as well as observations of teacher math practices, are collected from all of these teachers and classrooms. For budgetary reasons, baseline observations of classroom climate were conducted for a smaller subset of these classrooms, with one classroom randomly selected per site (baseline subsample of classrooms).
The analytic sample of teachers and classrooms includes only teachers and classrooms that were present in the spring of 2015, during the second year of BB-MPC implementation (n = 173). Not all classrooms and teachers remained in the study through the two years of implemen-tation of BB-MPC. A small number of classrooms were dropped from (n = 8) or added to (n = 9) the study because pre-K sites received or lost funding or enrollment. Some classrooms (n = 61) received new teachers before data collection occurred in the spring of 2015 (Year 2). Replacement teachers were asked to complete a survey on their demographic and psychosocial characteristics upon joining the study.1 Therefore, baseline data are available about the demo-graphic and psychosocial characteristics of most teachers (n = 163) in the analytic sample. However, because replacement teachers were not observed in spring 2013, only teachers who
1A baseline survey was collected if teachers joined the study before January 2015.

66
were present in spring 2013 and in spring 2015 (n = 102) have information about their baseline math practices available.
Baseline sample. Table A.1 shows the results of the comparisons between teachers in BB-MPC and control group classrooms in the baseline sample, who were present in the study’s classrooms in spring 2013, before random assignment occurred. Teachers were compared on demographic and psychosocial characteristics, as well as math practices. As shown in the top panel of the table, BB-MPC teachers were statistically significantly more likely to be non-Hispanic white, less likely to be non-Hispanic black, and more likely to have a master’s degree or higher. While it is sometimes possible to identify a few statistically significant differences by chance when the research groups are comparable, the magnitude of these demographic differ-ences is surprising.
One concern is that these observed differences in the racial composition of baseline teachers might result in other differences in the baseline sample of teachers and classrooms. Fortunately, differences in demographic characteristics did not translate to observed differences in measures of attitudes, beliefs, burnout, and psychological distress at baseline (shown in the second panel of Table A.1). Perhaps more important given the target of this intervention, teachers in BB-MPC classrooms did not differ from teachers in pre-K-as-usual classrooms at baseline in terms of the amount of math instruction observed. In both BB-MPC classrooms and pre-K-as-usual classrooms, about 18 minutes of teacher-led math and a little over one math activity, on average, was observed in the spring of 2013.2
Classroom climate was assessed by trained observers only for the baseline subsample of classrooms — one classroom per site. As shown in the right-hand columns of Table A.1, teachers in this subsample of classrooms generally mirrored the characteristics and math practices of the larger baseline sample. Based on these observations, BB-MPC and pre-K-as-usual classrooms did not appear to differ in their classroom climate as assessed by the well-known Classroom Assessment Scoring System (CLASS) instrument.
Analytic sample. As noted earlier, not all classrooms and teachers remained in the study through the two years of implementation of BB-MPC. Therefore, it was important to explore whether the same pattern of racial differences existed in the analytic sample of teachers and classrooms. Table A.2 shows the results of the comparisons of baseline data between BB-MPC and pre-K-as-usual teachers in the analytic sample. It is important to remember that replacement teachers who joined the study before the spring of Year 2 completed a “baseline”
2These variables are calculated differently at baseline than in the spring of Year 1 or Year 2. Therefore,
these baseline levels cannot be directly compared with levels at the end of Year 1 or Year 2.
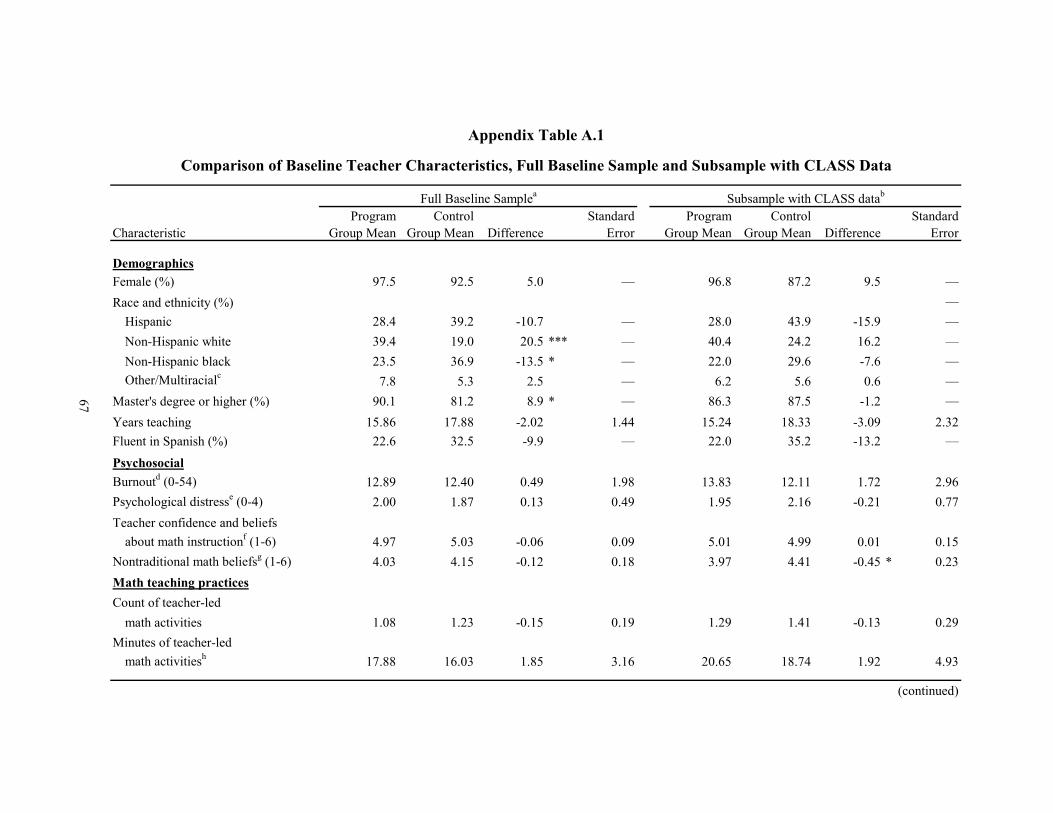
Program Control Stars Standard Program Control Stars StandardCharacteristic Group Mean Group Mean DifferenceStars Error Group Mean Group Mean Differencears Error
DemographicsFemale (%) 97.5 92.5 5.0 — 96.8 87.2 9.5 —Race and ethnicity (%) —
Hispanic 28.4 39.2 -10.7 — 28.0 43.9 -15.9 —Non-Hispanic white 39.4 19.0 20.5 *** — 40.4 24.2 16.2 —Non-Hispanic black 23.5 36.9 -13.5 * — 22.0 29.6 -7.6 —Other/Multiracialc 7.8 5.3 2.5 — 6.2 5.6 0.6 —
Master's degree or higher (%) 90.1 81.2 8.9 * — 86.3 87.5 -1.2 —Years teaching 15.86 17.88 -2.02 1.44 15.24 18.33 -3.09 2.32Fluent in Spanish (%) 22.6 32.5 -9.9 — 22.0 35.2 -13.2 —
PsychosocialBurnoutd (0-54) 12.89 12.40 0.49 1.98 13.83 12.11 1.72 2.96Psychological distresse (0-4) 2.00 1.87 0.13 0.49 1.95 2.16 -0.21 0.77Teacher confidence and beliefs
about math instructionf (1-6) 4.97 5.03 -0.06 0.09 5.01 4.99 0.01 0.15Nontraditional math beliefsg (1-6) 4.03 4.15 -0.12 0.18 3.97 4.41 -0.45 * 0.23Math teaching practicesCount of teacher-led
math activities 1.08 1.23 -0.15 0.19 1.29 1.41 -0.13 0.29Minutes of teacher-led
math activitiesh 17.88 16.03 1.85 3.16 20.65 18.74 1.92 4.93
(continued)
Appendix Table A.1
Comparison of Baseline Teacher Characteristics, Full Baseline Sample and Subsample with CLASS Data
Full Baseline Samplea Subsample with CLASS datab
67

Program Control Stars Standard Program Control Stars StandardCharacteristic Group Mean Group Mean DifferenceStars Error Group Mean Group Mean Differencears Error
Classroom climatei (1-7)Emotional support j — — — — 5.59 5.55 0.04 0.22Classroom organizationk — — — — 5.06 5.06 -0.01 0.21Instructional supportl — — — — 2.87 2.65 0.21 0.22
Concept developmentm — — — — 2.56 2.40 0.16 0.22
Sample sizen
Blocks 16 16 16 16Sites 35 35 35 35Teachers 86 86 35 35
Full Baseline Samplea Subsample with CLASS datab
Appendix Table A.1 (continued)
(continued)
SOURCES: MDRC calculations based on the baseline Teacher Self-Survey administered in spring 2013, and on three-hour observational assessments conducted in spring 2013 using the Classroom Observation of Early Mathematics—Environment and Teaching (COEMET; Sarama and Clements, 2009) and the Classroom Assessment Scoring System (CLASS; Pianta, La Paro, and Hamre, 2008).
NOTES: Rounding may cause slight discrepancies in sums and differences.aThe baseline Teacher Self-Survey was administered to all teachers and the COEMET was conducted in all classrooms in the spring of 2013. Data for two
classrooms were excluded due to concerns about the accuracy of the ratings supplied by the observer. bOne classroom per program group site and one per control group site were observed using the CLASS in the spring of 2013.c"Other" includes Asian, Native Hawaiian/Pacific Islander, and American Indian/Alaska Native, as well as teachers who identified as the option "other" in
the survey.dTeacher burnout was measured by the Maslach Burnout Inventory (Maslach, Jackson, and Leiter, 1996). Teachers responded to eight survey items that
were collected on a scale from 1 to 7 and rescaled to a range from 0 to 6. One item from the original scale was not included in the survey; therefore, the mean of all the other items was imputed for this item. This score comprises the eight survey items and the imputed item.
eThe Kessler Psychological Distress Scale (Kessler et al., 2003) includes six questions that ask teachers about their emotional states. The survey responses were collected on a scale from 1 to 5 and rescaled to a range from 0 (none of the time) to 4 (all of the time).
fThe teacher confidence and beliefs about math instruction score includes eight items, such as (a) I feel confident that I understand the math I teach, (b) Children’s reasoning in their mathematical problem solving is more important to assess than whether they solve problems correctly, and (c) Good instruction relates math to things children are interested in outside of school. The survey responses were collected on a scale from 1 (strongly disagree) to 6 (strongly agree).
68
69
survey of demographic and psychosocial characteristics; as a result, these data are available for almost all teachers in the analytic sample.3 The baseline demographic differences observed in the sample before random assignment were also found in the analytic sample of teachers. That is, in the analytic sample, BB-MPC teachers were 23 percentage points more likely to be non-Hispanic white and 25 percentage points less likely to be non-Hispanic black than their pre-K-as-usual counterparts. When they entered the study, BB-MPC teachers in the analytic sample reported similar levels of burnout and similar math beliefs, but more psychological distress, than pre-K-as-usual teachers in the analytic sample. Yet, as with the prior set of analyses, none of these differences were accompanied by differences in teachers’ observed math practices at baseline.
3Baseline data are available for 94 percent of teachers in the analytic sample.
Appendix Table A.1 (continued)gThe nontraditional math beliefs score includes five items rated on a scale of 1 (strongly disagree) to 6 (strongly
agree). All items were reverse-coded such that a low score indicates traditional beliefs about math, whereas a high score indicates inquiry-oriented beliefs about math. It includes items such as (a) Math involves mostly facts and procedures that have to be learned and (b) Compared to other subjects, math is difficult to make fun for children.
hA math activity is defined as one that meets the following criteria: (1) persists for at least 30 seconds; (2) develops mathematics knowledge; (3) has a discernible topic, goal, and task; and (4) involves several interactions (e.g., two or more conversation turns) with a teacher and one or more children. This baseline spring 2013 variable does not include time spent in informal simple or "routine" math activities and is therefore not directly comparable to the follow-up spring 2015 variable, "Minutes of teacher-led math activities and informal math activities," in Tables 4.1 and 4.6.
iThe rating scale for the CLASS ranges from 1 (low quality) to 7 (high quality). jThe emotional support domain of the CLASS captures the emotional tone of the classroom, focusing on
teachers' enjoyment of the children, their expressions of anger or sarcasm, and their responsiveness to the children's needs and views.
kThe classroom organization domain of the CLASS captures teachers' ways of structuring the classroom so that the children know what is expected of them and teachers' use of appropriate redirection for children when needed.
lThe instructional support domain of the CLASS captures teachers' encouragement of children's use of language and higher-order thinking skills and how teachers respond to children's ideas.
mOne dimension of the instructional support domain is concept development, which rates teachers' promotion of higher-order thinking skills, such as asking children why and how questions.
nData for all variables are available for at least 90 percent of the full baseline sample, and for at least 88 percent of the subsample with CLASS data.
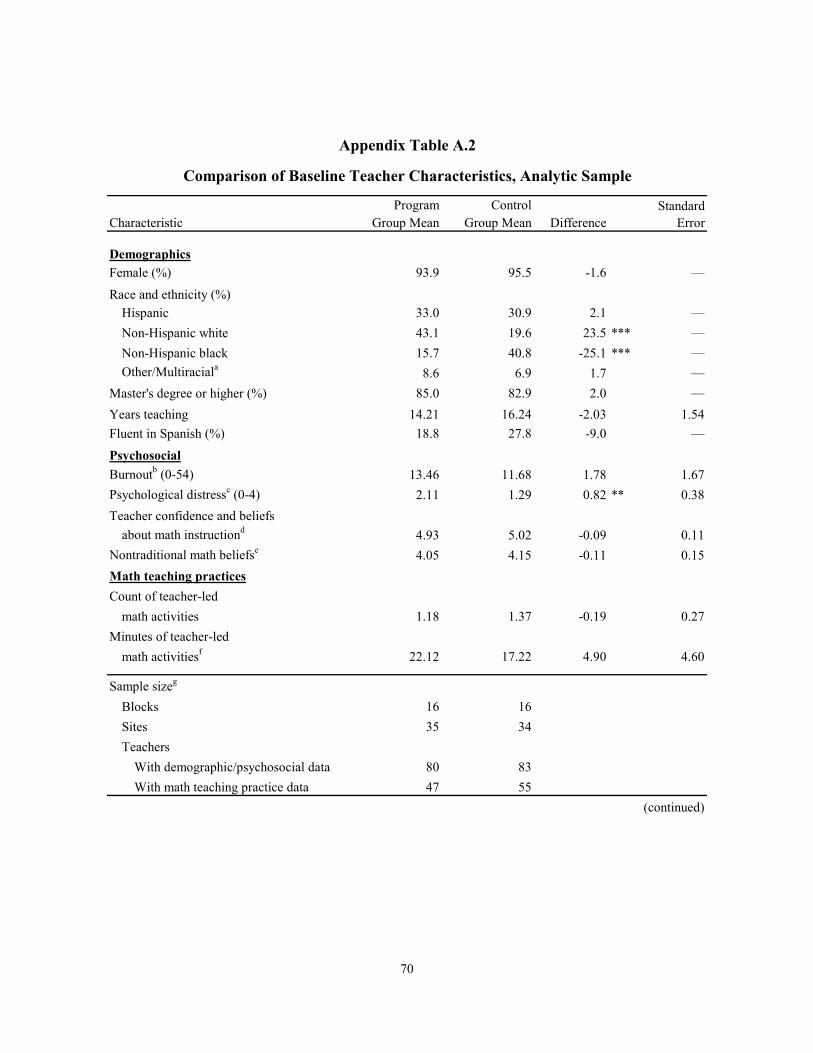
70
Program Control StarsCharacteristic Group Mean Group Mean Difference Stars
DemographicsFemale (%) 93.9 95.5 -1.6 —
Race and ethnicity (%)Hispanic 33.0 30.9 2.1 —Non-Hispanic white 43.1 19.6 23.5 *** —Non-Hispanic black 15.7 40.8 -25.1 *** —Other/Multiraciala 8.6 6.9 1.7 —
Master's degree or higher (%) 85.0 82.9 2.0 —Years teaching 14.21 16.24 -2.03 1.54Fluent in Spanish (%) 18.8 27.8 -9.0 —
PsychosocialBurnoutb (0-54) 13.46 11.68 1.78 1.67Psychological distressc (0-4) 2.11 1.29 0.82 ** 0.38Teacher confidence and beliefs
about math instructiond 4.93 5.02 -0.09 0.11Nontraditional math beliefse 4.05 4.15 -0.11 0.15Math teaching practicesCount of teacher-led
math activities 1.18 1.37 -0.19 0.27Minutes of teacher-led
math activitiesf 22.12 17.22 4.90 4.60
Sample sizeg
Blocks 16 16Sites 35 34Teachers
With demographic/psychosocial data 80 83With math teaching practice data 47 55
Appendix Table A.2
Comparison of Baseline Teacher Characteristics, Analytic Sample
Standard Error
(continued)

71
Further Exploration of Differences in Teachers’ Baseline Demographic Characteristics That there are notable differences in the demographic composition of teachers in BB-MPC and pre-K-as-usual classrooms raises the potential concern that any observed differences in teach-ers’ practices (presented in Chapter 4) might be a reflection of these earlier differences and not the implementation of BB-MPC. This concern is lessened by the fact that these demographic differences were not mirrored by observed differences in teacher practice or classroom climate
Appendix Table A.2 (continued)
SOURCES: MDRC calculations based on the baseline Teacher Self-Survey administered when teachers joined the study (from spring 2013 to fall 2014), and on three-hour observational assessments conducted in spring 2013 using the Classroom Observation of Early Mathematics—Environment and Teaching (COEMET; Sarama and Clements, 2009).
NOTES: Rounding may cause slight discrepancies in sums and differences.a"Other" includes Asian, Native Hawaiian/Pacific Islander, and American Indian/Alaska Native, as well as
teachers who identified as the option "other" in the survey.bTeacher burnout was measured by the Maslach Burnout Inventory (Maslach, Jackson, and Leiter, 1996).
Teachers responded to eight survey items that were collected on a scale from 1 to 7 and rescaled to a range from 0 to 6. One item from the original scale was not included in the survey; therefore, the mean of all of the other items was imputed for this item. This score comprises the eight survey items and the imputed item.
cThe Kessler Psychological Distress Scale (Kessler et al., 2003) includes six questions that ask teachers about their emotional states. The survey responses were collected on a scale from 1 to 5 and rescaled to a range from 0 (none of the time) to 4 (all of the time).
dThe teacher confidence and beliefs about math instruction score includes eight items, such as (a) I feel confident that I understand the math I teach, (b) Children's reasoning in their mathematical problem-solving is more important to assess than whether they solve problems correctly, and (c) Good instruction relates math to things children are interested in outside of school. The survey responses were collected on a scale from 1 (strongly disagree) to 6 (strongly agree).
eThe nontraditional math beliefs score includes five items rated on a scale of 1 (strongly disagree) to 6 (strongly agree). All items were reverse-coded such that a low score indicates traditional beliefs about math, whereas a high score indicates inquiry-oriented beliefs about math. The score includes items such as (a) Math involves mostly facts and procedures that have to be learned and (b) Compared to other subjects, math is difficult to make fun for children.
fA math activity is defined as one that (1) persists for at least 30 seconds; (2) develops mathematics knowledge; (3) has a discernible topic, goal, and task; and (4) involves several interactions (e.g., two or more conversation turns) with a teacher and one or more children. This baseline spring 2013 variable does not include time spent in informal simple or "routine" math activities and is therefore not directly comparable to the follow-up spring 2015 variable, "Minutes of teacher-led math activities and informal math activities," in Tables 4.1 and 4.6.
gFor all demographic and psychosocial variables, data are available for at least 90 percent of the sample. For math teaching practice variables, data are available for at least 58 percent of the analytic sample; the lower percentage is due to teacher turnover between the first and second years of the study. Teachers who joined the study after spring 2013 did not receive a baseline COEMET observation.
72
at baseline, suggesting that the research groups were probably balanced in terms of their initial math instruction and classroom climate.
However, to build further confidence in the interpretation of the impact results, two ad-ditional sets of sensitivity analyses were conducted. First, impacts on teacher practices were examined again adjusting for baseline demographic characteristics in racial composition, education, Spanish language fluency, and psychosocial characteristics. These impacts are shown in the middle set of columns in Table A.3 and show that the pattern, magnitude, and statistical significance of the impacts on teachers’ math practices and classroom climate remain roughly the same, whether or not the analyses adjust for additional baseline covariates.
A second set of analyses made use of the block structure of the study to assess the ex-tent to which differences in teacher demographics might drive estimated impacts on teacher practice. As mentioned briefly in Chapter 2, sites were “blocked” into groups of 4 to 5 before randomization based on their borough, venue (community-based organization or school-based site), and the racial/ethnic composition of the children (whether the site served primarily Hispanic children), resulting in 16 blocks. Randomization was conducted by block, such that each block included BB-MPC and pre-K-as-usual sites — and each thus represents a sort of “mini experiment.” For the purposes of this analysis, 5 blocks identified as having large imbalances in the racial/ethnic composition of teachers (50 percentage points or greater) were removed from the impact analysis. As shown in Table A.4, removing those blocks yielded a sample of BB-MPC and pre-K-as-usual sites that are matched on observed teachers’ de-mographics (as well as other measures of psychosocial functioning, math practices, and class-room climate). Impacts on teacher practices were then reestimated using this smaller analytic sample. The results of this analysis are presented in the last column of Table A.3 and appear to mirror the impact estimates presented in the main body of the report. That is, the findings on this smaller sample show estimated positive impacts of BB-MPC on the number of minutes of math instruction, the number of math activities conducted by teachers, and the proportion of activities of moderate to high quality. And as with the findings on the full sample, no statistical-ly significant impacts were found on measures of general instructional quality.
Together, the results of these sensitivity analyses build further confidence that any ob-served baseline nonequivalence in demographic composition of BB-MPC and pre-K-as-usual teachers is unlikely to be biasing the estimated impacts of BB-MPC on teacher math practices as reported in the main body of the report. Not only were there no differences in teacher math practices or classroom climate at baseline (despite these differences in racial composition), but adjusting for these differences and subsampling the set of teachers to those for whom there are no such baseline differences has no appreciable effect on the pattern, magnitude, or significance of the findings that were observed.
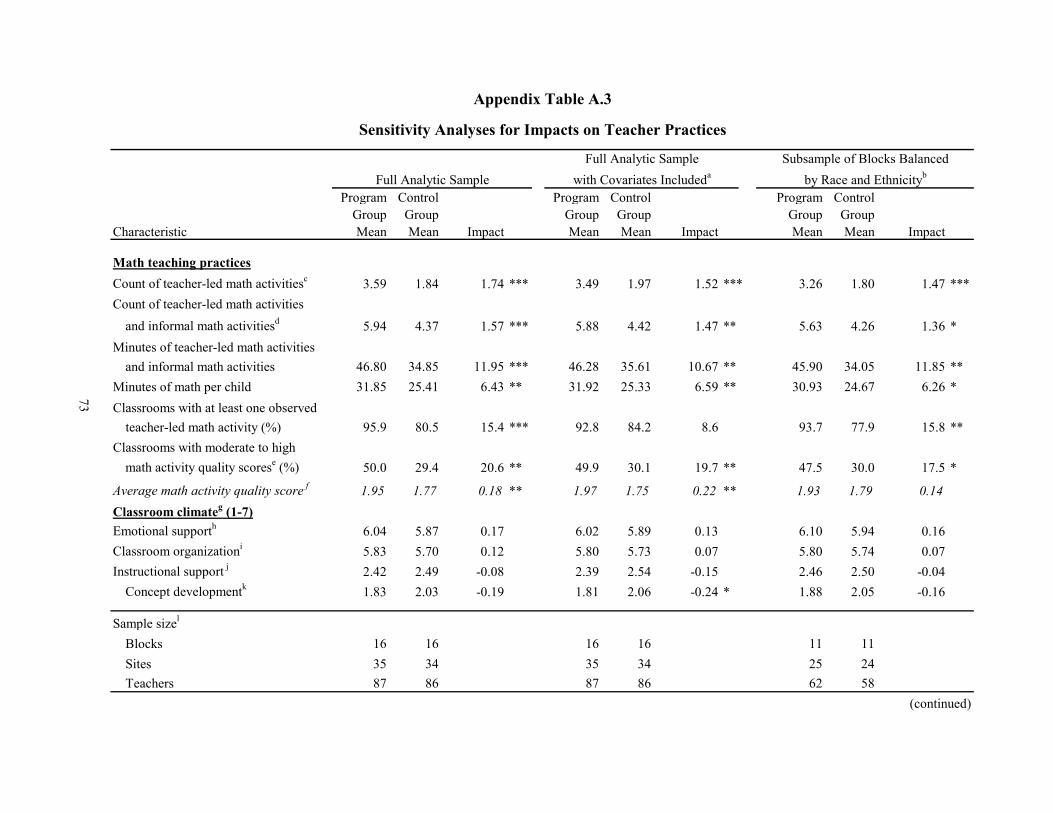
Program Control Stars Program Control Program ControlGroup Group Group Group Group Group
Characteristic Mean Mean ImpactStars Mean Mean Impact ars Mean Mean ImpactStars
Math teaching practicesCount of teacher-led math activitiesc 3.59 1.84 1.74 *** 3.49 1.97 1.52 *** 3.26 1.80 1.47 ***Count of teacher-led math activities
and informal math activitiesd 5.94 4.37 1.57 *** 5.88 4.42 1.47 ** 5.63 4.26 1.36 *Minutes of teacher-led math activities
and informal math activities 46.80 34.85 11.95 *** 46.28 35.61 10.67 ** 45.90 34.05 11.85 **Minutes of math per child 31.85 25.41 6.43 ** 31.92 25.33 6.59 ** 30.93 24.67 6.26 *Classrooms with at least one observed
teacher-led math activity (%) 95.9 80.5 15.4 *** 92.8 84.2 8.6 93.7 77.9 15.8 **Classrooms with moderate to high
math activity quality scorese (%) 50.0 29.4 20.6 ** 49.9 30.1 19.7 ** 47.5 30.0 17.5 *
Average math activity quality score f 1.95 1.77 0.18 ** 1.97 1.75 0.22 ** 1.93 1.79 0.14Classroom climateg (1-7)Emotional supporth 6.04 5.87 0.17 6.02 5.89 0.13 6.10 5.94 0.16Classroom organizationi 5.83 5.70 0.12 5.80 5.73 0.07 5.80 5.74 0.07Instructional support j 2.42 2.49 -0.08 2.39 2.54 -0.15 2.46 2.50 -0.04
Concept developmentk 1.83 2.03 -0.19 1.81 2.06 -0.24 * 1.88 2.05 -0.16
Sample sizel
Blocks 16 16 16 16 11 11Sites 35 34 35 34 25 24Teachers 87 86 87 86 62 58
Appendix Table A.3
Sensitivity Analyses for Impacts on Teacher Practices
by Race and Ethnicityb
Subsample of Blocks Balanced
(continued)
Full Analytic SampleFull Analytic Sample with Covariates Includeda
73

Appendix Table A.3 (continued)
SOURCES: MDRC calculations based on the baseline Teacher Self-Survey when teachers joined the study (from spring 2013 to fall 2014), and on three-hour observational assessments conducted in spring 2015 using a version of the Classroom Observation of Early Mathematics—Environment and Teaching (COEMET; Sarama and Clements, 2009), modified for the Making Pre-K Count study, that records every math activity lasting for 30 seconds or longer, and the Classroom Assessment Scoring System (CLASS; Pianta, La Paro, and Hamre, 2008).
NOTES: Rounding may cause slight discrepancies in sums and differences.aIn order to account for variance in classroom outcomes, seven covariates were included: four relating to teachers' race and ethnicity (Hispanic, non-
Hispanic white, non-Hispanic black, and other), the others indicating whether they had a master's degree or higher, their Spanish fluency, and their psychological distress score, all of which were created from the baseline Teacher Self-Survey.
bFive blocks where the racial/ethnic composition of teachers in the program and control groups differed by 50 or more percentage points were dropped.cA math activity is defined as one that meets the following criteria: (1) persists for at least 30 seconds; (2) develops mathematics knowledge; (3) has a
discernible topic, goal, and task; and (4) involves several interactions (e.g., two or more conversation turns) with a teacher and one or more children.dAn informal math activity is defined as a "simple" or "routine" math activity led by a teacher. An example of an informal math activity is a teacher leading
children in singing a math song without explicit discussion of the math concepts. eCategory is in contrast to classrooms with a low quality score or no math activity observed. For each teacher-led math activity observed, quality was
calculated by averaging across six items rated on a scale of 1 (low) to 5 (high). The scale assesses the extent to which teachers explain the math concept underlying an activity, ask open-ended questions, and build on children's answers, ideas, and strategies to extend their mathematical thinking. Scores at or above 2 were classified as having moderate to high quality.
fFor classrooms where a teacher-led math activity was observed, the average math activity quality score is calculated by averaging across six items and then averaging across math activities for the final score; the score ranges from 1 (strongly disagree) to 5 (strongly agree) and assesses the extent to which teachers expanded children's conceptual understanding of math and extended children's mathematical thinking. This does not represent a true impact since the number of classrooms where at least one teacher-led math activity was observed was different between program and control groups (96 percent versus 81 percent for the full sample, and 94 percent versus 76 percent for the subsample of blocks balanced by race and ethnicity).
gThe rating scale for the CLASS ranges from 1 (low quality) to 7 (high quality). hThe emotional support domain of the CLASS captures the emotional tone of the classroom, focusing on teachers' enjoyment of the children, their
expressions of anger or sarcasm, and their responsiveness to the children's needs and views. iThe classroom organization domain of the CLASS captures teachers' ways of structuring the classroom so that the children know what is expected of them
and teachers' use of appropriate redirection for children when needed.jThe instructional support domain of the CLASS captures teachers' encouragement of children's use of language and higher-order thinking skills, and how
teachers respond to children's ideas.kOne dimension of the instructional support domain is concept development, which rates teachers' promotion of higher-order thinking skills, such as asking
children why and how questions.lData for all variables except average math activity quality score are available for 100 percent of the samples. For the average math activity quality score
variable, data are available for at least 86 percent of the samples.
74
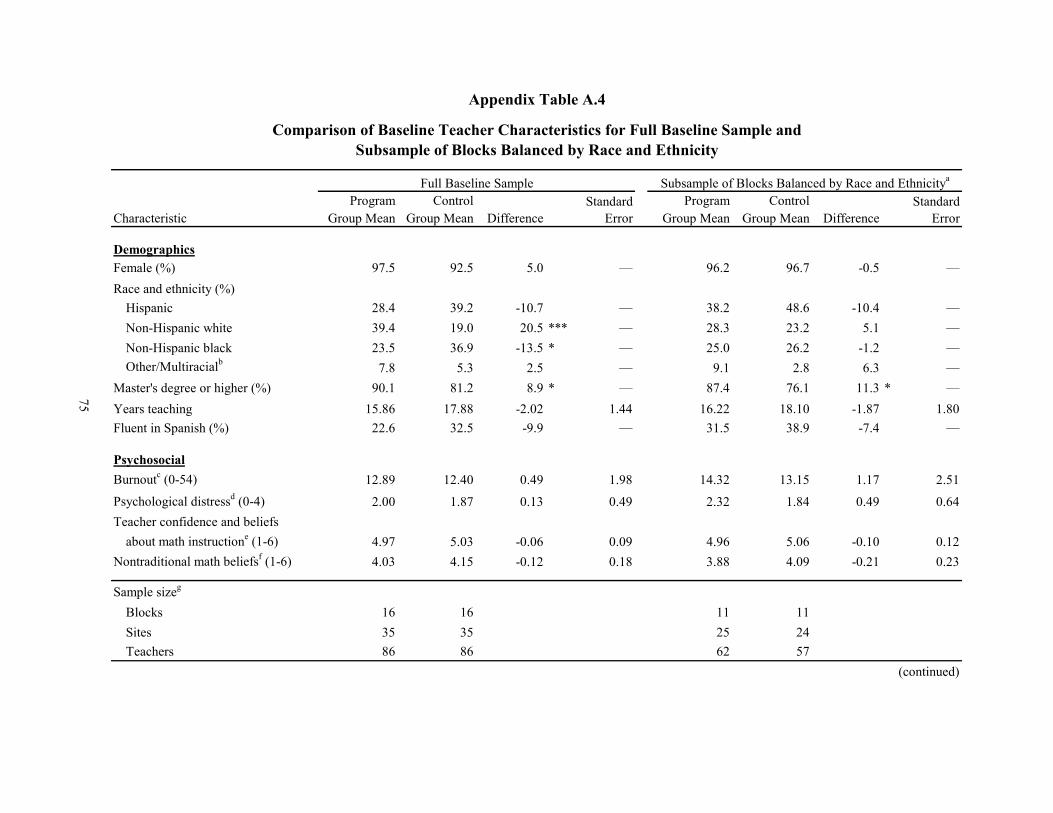
Program Control Stars Program Control StarsCharacteristic Group Mean Group Mean DifferenceStars Group Mean Group Mean Difference ars
DemographicsFemale (%) 97.5 92.5 5.0 — 96.2 96.7 -0.5 —Race and ethnicity (%)
Hispanic 28.4 39.2 -10.7 — 38.2 48.6 -10.4 —Non-Hispanic white 39.4 19.0 20.5 *** — 28.3 23.2 5.1 —Non-Hispanic black 23.5 36.9 -13.5 * — 25.0 26.2 -1.2 —Other/Multiracialb 7.8 5.3 2.5 — 9.1 2.8 6.3 —
Master's degree or higher (%) 90.1 81.2 8.9 * — 87.4 76.1 11.3 * —Years teaching 15.86 17.88 -2.02 1.44 16.22 18.10 -1.87 1.80Fluent in Spanish (%) 22.6 32.5 -9.9 — 31.5 38.9 -7.4 —
PsychosocialBurnoutc (0-54) 12.89 12.40 0.49 1.98 14.32 13.15 1.17 2.51Psychological distressd (0-4) 2.00 1.87 0.13 0.49 2.32 1.84 0.49 0.64Teacher confidence and beliefs
about math instructione (1-6) 4.97 5.03 -0.06 0.09 4.96 5.06 -0.10 0.12Nontraditional math beliefsf (1-6) 4.03 4.15 -0.12 0.18 3.88 4.09 -0.21 0.23
Sample sizeg
Blocks 16 16 11 11Sites 35 35 25 24Teachers 86 86 62 57
(continued)
Appendix Table A.4
Comparison of Baseline Teacher Characteristics for Full Baseline Sample andSubsample of Blocks Balanced by Race and Ethnicity
Full Baseline Sample Subsample of Blocks Balanced by Race and Ethnicitya
Standard Error
Standard Error
75

76
Comparison of Baseline Characteristics for Children
The Making Pre-K Count child sample includes three subsamples. Consent to partici-pate was obtained for all children (n = 2,717) included in the study (consented sample). As part of the consent process, parents completed a basic demographic form for each child. Baseline assessments were conducted in the fall of 2014 (Year 2), after child registration was complete and children had an opportunity to acclimate to the pre-K context. For budgetary reasons, a smaller group of children (n = 859) were randomly selected for assessments of cognitive and executive function skills in the fall. This baseline assessed sample of children has baseline data available about both their demographic characteristics and their entering cognitive and execu-tive function skills. Most but not all (n = 814) of these children with baseline assessment data available are in the analytic sample (analytic sample with baseline data).
Consented sample. Table A.5 compares the demographic characteristics across parents and children who were present in BB-MPC and pre-K-as-usual group sites and who consented
Appendix Table A.4 (continued)
SOURCE: MDRC calculations based on the baseline Teacher Self-Survey administered in spring 2013.
NOTES: Rounding may cause slight discrepancies in sums and differences.aFive blocks where the racial/ethnic composition of teachers in the program and control groups differed
by 50 or more percentage points were dropped.b"Other" includes Asian, Native Hawaiian/Pacific Islander, and American Indian/Alaska Native, as well
as teachers who identified as the option "other" in the survey.cTeacher burnout was measured by the Maslach Burnout Inventory (Maslach, Jackson, and Leiter, 1996).
Teachers responded to eight survey items that were collected on a scale from 1 to 7 and rescaled to a range from 0 to 6. One item from the original scale was not included in the survey; therefore, the mean of all the other items was imputed for this item. This score comprises the eight survey items and the imputed item.
dThe Kessler Psychological Distress Scale (Kessler et al., 2003) includes six questions that ask teachers about their emotional states. The survey responses were collected on a scale from 1 to 5 and rescaled to a range from 0 (none of the time) to 4 (all of the time).
eThe teacher confidence and beliefs about math instruction score includes eight items, such as (a) I feel confident that I understand the math I teach, (b) Children's reasoning in their mathematical problem solving is more important to assess than whether they solve problems correctly, and (c) Good instruction relates math to things children are interested in outside of school. The survey responses were collected on a scale of 1 (strongly disagree) to 6 (strongly agree).
fThe nontraditional math beliefs score includes five items rated on a scale of 1 (strongly disagree) to 6 (strongly agree). All items were reverse-coded such that a low score indicates traditional beliefs about math, whereas a high score indicates inquiry-oriented beliefs about math. It includes items such as (a) Math involves mostly facts and procedures that have to be learned and (b) Compared to other subjects, math is difficult to make fun for children.
gData for all variables are available for at least 90 percent of the full sample and at least 91 percent of the subsample.
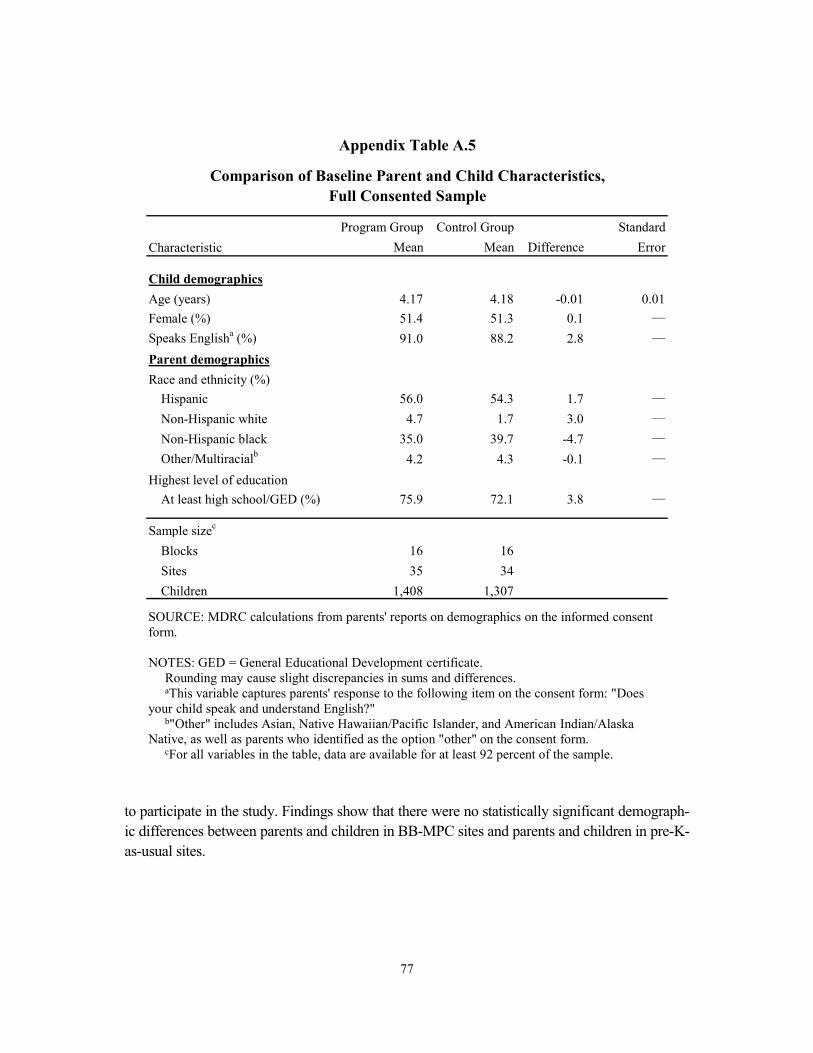
77
to participate in the study. Findings show that there were no statistically significant demograph-ic differences between parents and children in BB-MPC sites and parents and children in pre-K-as-usual sites.
Program Group Control Group StandardCharacteristic Mean Mean Difference Error
Child demographicsAge (years) 4.17 4.18 -0.01 0.01Female (%) 51.4 51.3 0.1 —Speaks Englisha (%) 91.0 88.2 2.8 —
Parent demographicsRace and ethnicity (%)
Hispanic 56.0 54.3 1.7 —Non-Hispanic white 4.7 1.7 3.0 —Non-Hispanic black 35.0 39.7 -4.7 —Other/Multiracialb 4.2 4.3 -0.1 —
Highest level of educationAt least high school/GED (%) 75.9 72.1 3.8 —
Sample sizec
Blocks 16 16Sites 35 34Children 1,408 1,307
Appendix Table A.5
Comparison of Baseline Parent and Child Characteristics,Full Consented Sample
Stars
SOURCE: MDRC calculations from parents' reports on demographics on the informed consent form.
NOTES: GED = General Educational Development certificate. Rounding may cause slight discrepancies in sums and differences.aThis variable captures parents' response to the following item on the consent form: "Does
your child speak and understand English?"b"Other" includes Asian, Native Hawaiian/Pacific Islander, and American Indian/Alaska
Native, as well as parents who identified as the option "other" on the consent form.cFor all variables in the table, data are available for at least 92 percent of the sample.

78
Baseline assessed sample. As mentioned above, a subsample of children were selected to participate in the fall baseline assessments. Table A.6 examines the demographic characteris-tics across BB-MPC and pre-K-as-usual groups for this smaller subsample of baseline-assessed children. No differences in children’s demographic characteristics were observed between BB-MPC and pre-K-as-usual classrooms for this subsample. Parents of children in BB-MPC classrooms were slightly more likely to be non-Hispanic white and had higher levels of educa-tion.
The baseline assessments, described in greater detail in Chapter 4, include measures of children’s math skills (ECLS-B), understanding of spoken language (ROWPVT), and executive function (Pencil Tap, Spatial Conflict Arrows, and Corsi Blocks).4 Perhaps most important for this study of a math program, children in BB-MPC classrooms tended to score higher, on average, than those in the pre-K-as-usual classrooms on the ECLS-B math assessment and on one of the three measures of executive function (Pencil Tap). There were no measured differ-ences between children in the two groups on understanding of spoken language or on the other two measures of executive function (Spatial Conflict Arrows and Corsi Blocks).
Further Exploration of Differences in Children’s Baseline Math and Executive Function Skills There are two possible explanations for children’s stronger math and executive function skills in the BB-MPC group relative to the control group at baseline. On the one hand, it is possible that an unlucky draw led the random assignment process to create two groups of children whose average math competencies at the start of the school year were somewhat different. This would make it difficult to examine BB-MPC impacts at the end of the pre-K year by relying on random assignment, because the expectation of random assignment is that any differences observed at follow-up are due to the program under study and not any observed differences between children. On the other hand, it is possible that BB-MPC had already led to children’s math gains when they were assessed in the fall. The data collection period for baseline child assessments lasted from September until November due to changing classroom and school rosters through October and the gathering of parents’ informed consent forms, meaning that some children had received nearly two months of BB-MPC by the time they were assessed.
4Early Childhood Longitudinal Study-Birth Cohort (ECLS-B; Najarian, Snow, Lennon, and Kinsey,
2010); Receptive One-Word Picture Vocabulary Test (ROWPVT; Martin and Brownell, 2011); Pencil Tap (Diamond and Taylor, 1996); Spatial Conflict Arrows (Willoughby, Wirth, Blair, and Family Life Project Investigators, 2012); Corsi Blocks (Corsi, 1972).

79
Program Control StandardCharacteristic Group Mean Group Mean Difference Error
Child demographicsAge (years) 4.16 4.17 -0.01 0.02Female (%) 53.7 51.7 2.0 —Parent demographicsRace and ethnicity (%)
Hispanic 57.3 60.5 -3.2 —Non-Hispanic white 4.3 0.7 3.7 * —Non-Hispanic black 37.1 39.1 -2.0 —Other/Multiraciala 3.1 2.8 0.2 —
Highest level of educationAt least high school/GED (%) 77.9 70.9 7.0 * —
Child outcomesAssessed in Spanish (%) 16.9 21.3 -4.4 —Math
ECLS-B math scoreb (0-44) 21.50 19.49 2.01 *** 0.52Language
ROWPVT standard scorec 95.52 94.01 1.51 1.51Executive function
Pencil Tap: proportion correctd (0-1) 0.57 0.51 0.06 ** 0.03Arrows incongruent: proportion correcte (0-1) 0.58 0.58 0.00 0.02Corsi Blocks forward: number correctf 2.57 2.47 0.10 0.09
Sample sizeg
Blocks 16 16Sites 35 34Children 433 426
(continued)
Appendix Table A.6
Comparison of Baseline Parent and Child Characteristics,Baseline Assessed Sample
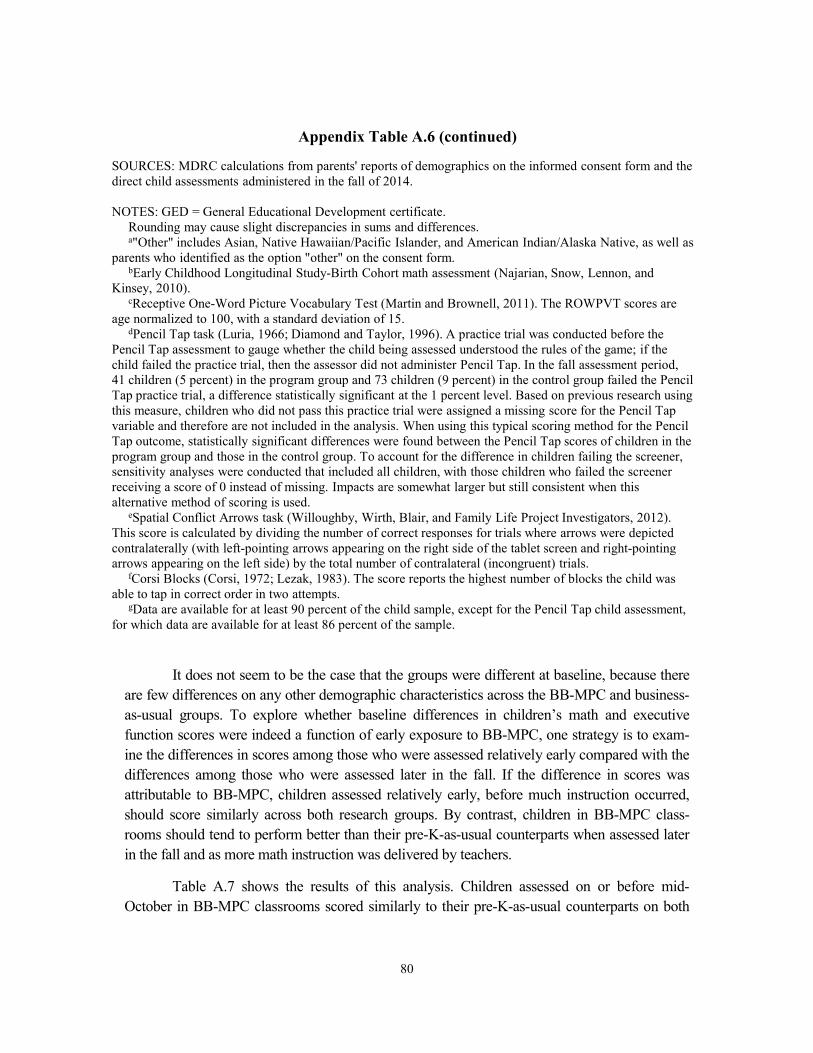
80
It does not seem to be the case that the groups were different at baseline, because there are few differences on any other demographic characteristics across the BB-MPC and business-as-usual groups. To explore whether baseline differences in children’s math and executive function scores were indeed a function of early exposure to BB-MPC, one strategy is to exam-ine the differences in scores among those who were assessed relatively early compared with the differences among those who were assessed later in the fall. If the difference in scores was attributable to BB-MPC, children assessed relatively early, before much instruction occurred, should score similarly across both research groups. By contrast, children in BB-MPC class-rooms should tend to perform better than their pre-K-as-usual counterparts when assessed later in the fall and as more math instruction was delivered by teachers.
Table A.7 shows the results of this analysis. Children assessed on or before mid-October in BB-MPC classrooms scored similarly to their pre-K-as-usual counterparts on both
Appendix Table A.6 (continued)
SOURCES: MDRC calculations from parents' reports of demographics on the informed consent form and the direct child assessments administered in the fall of 2014.
NOTES: GED = General Educational Development certificate. Rounding may cause slight discrepancies in sums and differences.a"Other" includes Asian, Native Hawaiian/Pacific Islander, and American Indian/Alaska Native, as well as
parents who identified as the option "other" on the consent form.bEarly Childhood Longitudinal Study-Birth Cohort math assessment (Najarian, Snow, Lennon, and
Kinsey, 2010). cReceptive One-Word Picture Vocabulary Test (Martin and Brownell, 2011). The ROWPVT scores are
age normalized to 100, with a standard deviation of 15.dPencil Tap task (Luria, 1966; Diamond and Taylor, 1996). A practice trial was conducted before the
Pencil Tap assessment to gauge whether the child being assessed understood the rules of the game; if the child failed the practice trial, then the assessor did not administer Pencil Tap. In the fall assessment period, 41 children (5 percent) in the program group and 73 children (9 percent) in the control group failed the Pencil Tap practice trial, a difference statistically significant at the 1 percent level. Based on previous research using this measure, children who did not pass this practice trial were assigned a missing score for the Pencil Tap variable and therefore are not included in the analysis. When using this typical scoring method for the Pencil Tap outcome, statistically significant differences were found between the Pencil Tap scores of children in the program group and those in the control group. To account for the difference in children failing the screener, sensitivity analyses were conducted that included all children, with those children who failed the screener receiving a score of 0 instead of missing. Impacts are somewhat larger but still consistent when this alternative method of scoring is used.
eSpatial Conflict Arrows task (Willoughby, Wirth, Blair, and Family Life Project Investigators, 2012). This score is calculated by dividing the number of correct responses for trials where arrows were depicted contralaterally (with left-pointing arrows appearing on the right side of the tablet screen and right-pointing arrows appearing on the left side) by the total number of contralateral (incongruent) trials.
fCorsi Blocks (Corsi, 1972; Lezak, 1983). The score reports the highest number of blocks the child was able to tap in correct order in two attempts.
gData are available for at least 90 percent of the child sample, except for the Pencil Tap child assessment, for which data are available for at least 86 percent of the sample.

81
ECLS-B math scores as well as Pencil Tap scores, demonstrating that there are no apparent
Program Control Difference Star Standard EffectOutcomea Group Mean Group Mean (Impact) Error Sizeb
Children assessed on or before Oct. 15ECLS-B math scorec (0-44) 20.68 19.29 1.39 0.98 0.21Pencil Tap: proportion correctd (0-1) 0.51 0.49 0.01 0.05 0.04Children assessed after Oct. 15ECLS-B math scorec (0-44) 22.39 19.60 2.79 *** 0.82 0.42Pencil Tap: proportion correctd (0-1) 0.60 0.52 0.08 ** 0.04 0.23
Sample sizee
Assessed before Oct. 15Blocks 14 13Sites 24 16Children 209 158
Assessed after Oct. 15Blocks 15 16Sites 23 23Children 220 256
Appendix Table A.7
Child-Level Baseline Math and Executive FunctionAssessment Scores, by Time of Assessment
SOURCE: MDRC calculations based on the direct child assessments administered in the fall of 2014.
NOTES: Statistical significance levels are indicated as follows: *** = 1 percent; ** = 5 percent; * = 10 percent.Rounding may cause slight discrepancies in sums and differences.aThe potential score range for each assessment is shown in parentheses.bEffect size is calculated by dividing the impact of the program (the difference between the means for the
program group and the control group) by the standard deviation for the control group.cEarly Childhood Longitudinal Study-Birth Cohort math assessment (Najarian, Snow, Lennon, and Kinsey,
2010). dPencil Tap task (Luria, 1966; Diamond and Taylor, 1996). A practice trial was conducted before the Pencil
Tap assessment to gauge whether the child being assessed understood the rules of the game; if the child failed the practice trial, then the assessor did not administer Pencil Tap. In the fall assessment period, 41 children (5 percent) in the program group and 73 children (9 percent) in the control group failed the Pencil Tap practice trial, a difference statistically significant at the 1 percent level. Based on previous research using this measure, children who did not pass this practice trial were assigned a missing score for the Pencil Tap variable and therefore are not included in the analysis. When using this typical scoring method for the Pencil Tap outcome, statistically significant differences were found between the Pencil Tap scores of children in the program group and those in the control group. To account for the difference in children failing the screener, sensitivity analyses were conducted that included all children, with those children who failed the screener receiving a score of 0 instead of missing. Impacts are somewhat larger but still consistent when this alternative method of scoring is used.
eData are available for 100 percent of the sample assessed on the ECLS-B, both early and late; for 88 percent of the sample assessed early on the Pencil Tap measure; and for 85 percent of the sample assessed late on the Pencil Tap measure. Missing data in Pencil Tap are primarily due to children failing the practice trial or refusing to continue the assessment.
82
ECLS-B math scores as well as Pencil Tap scores, demonstrating that there were no apparent differences for children assessed early. On the other hand, among children assessed after this date, children in BB-MPC classrooms were found to score significantly higher on the math and executive functioning assessments than their pre-K-as-usual peers. Thus, the most likely explanation for this difference in children’s math scores at baseline is their early exposure to BB-MPC.
Appendix B
Analysis Model


85
The primary impact analysis for Making Pre-K Count (MPC) focuses on the net impacts of Building Blocks (BB) plus professional development on classrooms, teachers, and children. Program impacts were estimated by comparing mean outcomes for the group assigned to BB-MPC with corresponding means for the pre-K-as-usual control group, with an adjustment for selected background characteristics and dummy variables for the random assignment blocks. (See below for more information on the dummy block variables.)
A subset of background characteristics were selected as covariates based on their degree of correlation with the outcome of interest and theoretical importance. Missing covariates, but not outcome data, were imputed at the classroom level using multiple imputation based on other available covariates and baseline assessments. For teacher and classroom outcomes, the models did not include any covariates. For child outcomes, models included a baseline measure (collected in fall 2014) of the outcome, where available and appropriate,1 as well as the follow-ing covariates:
• Whether the parent had a high school diploma/GED or a higher degree
• The child’s age at the time of spring assessment
• A measure of the child’s level of English proficiency at baseline (assessed by the pre-LAS)2
• A measure of baseline executive function assessing inhibition and cognitive flexibility (as measured by the proportion of incongruent trials correct on Spatial Conflict Arrows)3
• An evaluation by the examiner of the child’s attention and inhibition during assessment administration at baseline (PSRA: Attention-Inhibition)4
In addition to the covariates listed above, for the two math outcomes, models also were adjusted for baseline levels of receptive language (ROWPVT) and a measure of the child’s
1Models examining impacts on math outcomes did not include a baseline measure of the outcome because
(a) differences were found in math scores at baseline on the Early Childhood Longitudinal Study-Birth Cohort (ECLS-B) math assessment between children in BB-MPC classrooms and pre-K-as-usual classrooms, due to their early exposure to the BB-MPC program (see Appendix A for more information); and (b) the Woodcock-Johnson Applied Problems assessment was collected in the spring only. The model examining impacts on Pencil Tap did not include a baseline measure because, similar to the results of the ECLS-B math assessment, there were differences in children’s Pencil Tap scores at baseline.
2Pre-Language Assessment Scales (Duncan and De Avila, 1998). 3Willoughby, Wirth, Blair, and Family Life Project Investigators (2012). 4Preschool Self-Regulation Assessment (Smith-Donald, Raver, Hayes, and Richardson, 2007).
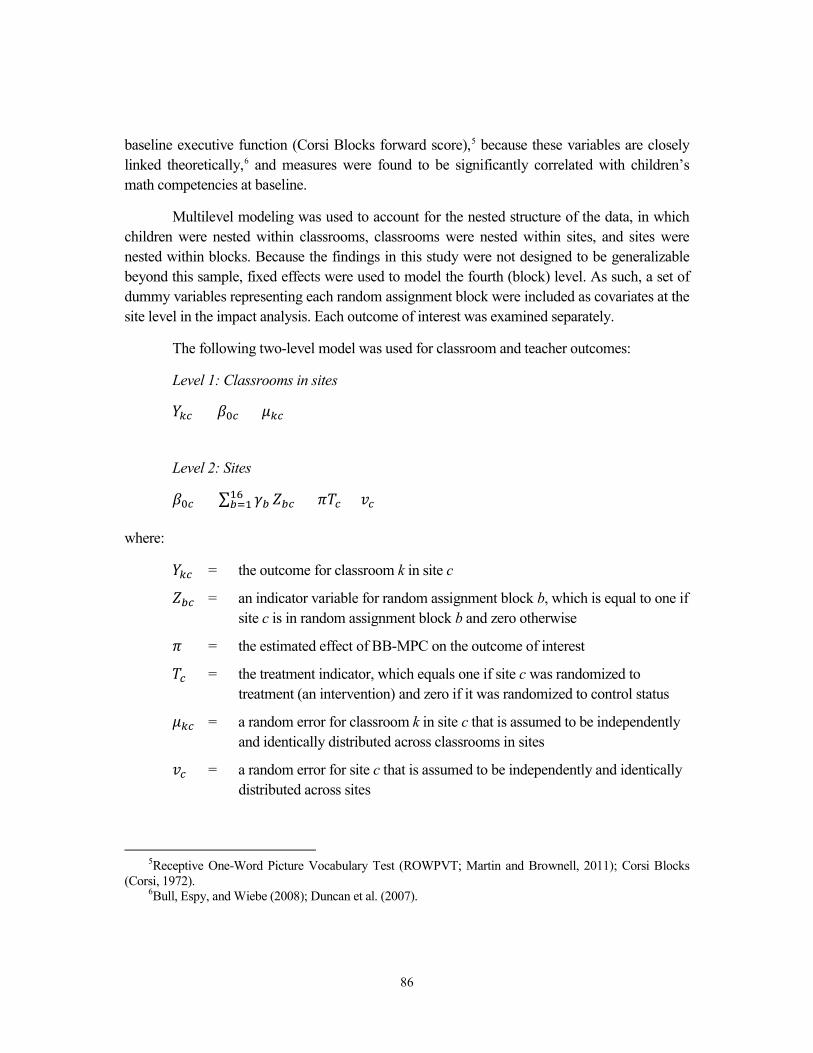
86
baseline executive function (Corsi Blocks forward score),5 because these variables are closely linked theoretically,6 and measures were found to be significantly correlated with children’s math competencies at baseline.
Multilevel modeling was used to account for the nested structure of the data, in which children were nested within classrooms, classrooms were nested within sites, and sites were nested within blocks. Because the findings in this study were not designed to be generalizable beyond this sample, fixed effects were used to model the fourth (block) level. As such, a set of dummy variables representing each random assignment block were included as covariates at the site level in the impact analysis. Each outcome of interest was examined separately.
The following two-level model was used for classroom and teacher outcomes:
Level 1: Classrooms in sites
𝑌𝑌𝑘𝑘𝑘𝑘 = 𝛽𝛽0𝑘𝑘 + 𝜇𝜇𝑘𝑘𝑘𝑘
Level 2: Sites
𝛽𝛽0𝑘𝑘 = ∑ 𝛾𝛾𝑏𝑏16𝑏𝑏=1 𝛧𝛧𝑏𝑏𝑘𝑘 + 𝜋𝜋𝑇𝑇𝑘𝑘 + 𝑣𝑣𝑘𝑘
where:
𝑌𝑌𝑘𝑘𝑘𝑘 = the outcome for classroom k in site c
𝛧𝛧𝑏𝑏𝑘𝑘 = an indicator variable for random assignment block b, which is equal to one if site c is in random assignment block b and zero otherwise
𝜋𝜋 = the estimated effect of BB-MPC on the outcome of interest
𝑇𝑇𝑘𝑘 = the treatment indicator, which equals one if site c was randomized to treatment (an intervention) and zero if it was randomized to control status
𝜇𝜇𝑘𝑘𝑘𝑘 = a random error for classroom k in site c that is assumed to be independently and identically distributed across classrooms in sites
𝑣𝑣𝑘𝑘 = a random error for site c that is assumed to be independently and identically distributed across sites
5Receptive One-Word Picture Vocabulary Test (ROWPVT; Martin and Brownell, 2011); Corsi Blocks
(Corsi, 1972). 6Bull, Espy, and Wiebe (2008); Duncan et al. (2007).
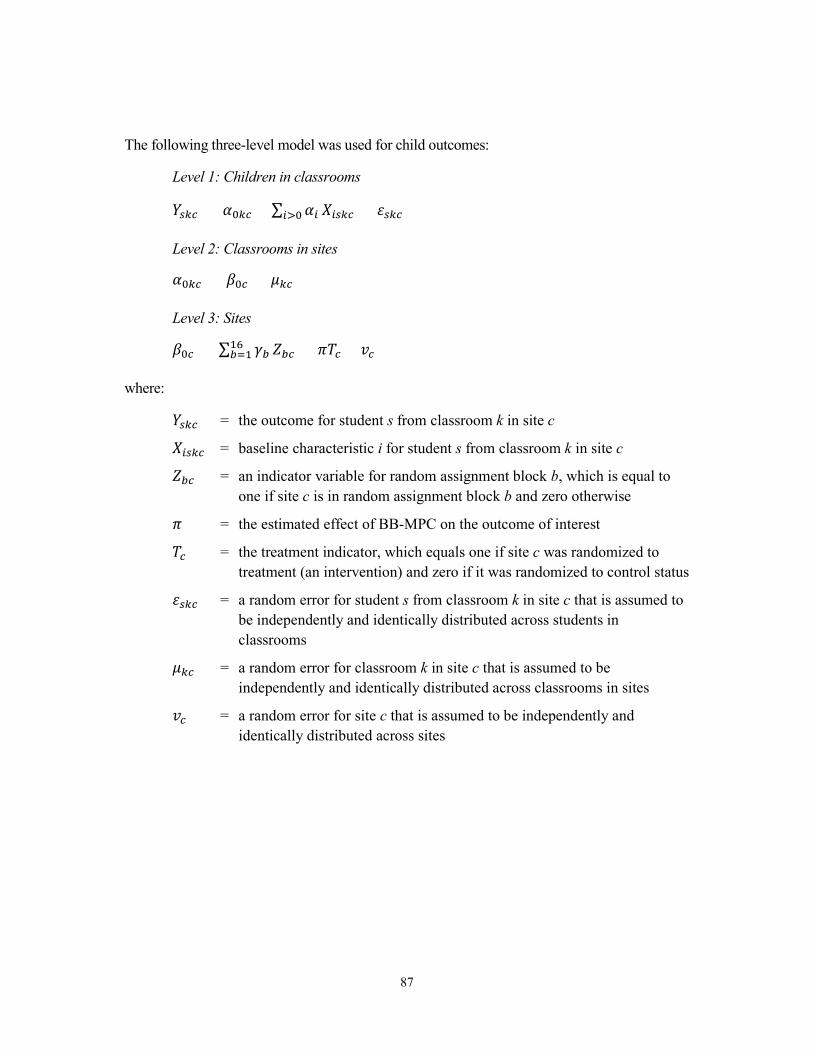
87
The following three-level model was used for child outcomes:
Level 1: Children in classrooms
𝑌𝑌𝑠𝑠𝑘𝑘𝑘𝑘 = 𝛼𝛼0𝑘𝑘𝑘𝑘 + ∑ 𝛼𝛼𝑖𝑖𝑖𝑖>0 𝑋𝑋𝑖𝑖𝑠𝑠𝑘𝑘𝑘𝑘 + 𝜀𝜀𝑠𝑠𝑘𝑘𝑘𝑘
Level 2: Classrooms in sites
𝛼𝛼0𝑘𝑘𝑘𝑘 = 𝛽𝛽0𝑘𝑘 + 𝜇𝜇𝑘𝑘𝑘𝑘
Level 3: Sites
𝛽𝛽0𝑘𝑘 = ∑ 𝛾𝛾𝑏𝑏16𝑏𝑏=1 𝛧𝛧𝑏𝑏𝑘𝑘 + 𝜋𝜋𝑇𝑇𝑘𝑘 + 𝑣𝑣𝑘𝑘
where:
𝑌𝑌𝑠𝑠𝑘𝑘𝑘𝑘 = the outcome for student s from classroom k in site c
𝑋𝑋𝑖𝑖𝑠𝑠𝑘𝑘𝑘𝑘 = baseline characteristic i for student s from classroom k in site c
𝛧𝛧𝑏𝑏𝑘𝑘 = an indicator variable for random assignment block b, which is equal to one if site c is in random assignment block b and zero otherwise
𝜋𝜋 = the estimated effect of BB-MPC on the outcome of interest
𝑇𝑇𝑘𝑘 = the treatment indicator, which equals one if site c was randomized to treatment (an intervention) and zero if it was randomized to control status
𝜀𝜀𝑠𝑠𝑘𝑘𝑘𝑘 = a random error for student s from classroom k in site c that is assumed to be independently and identically distributed across students in classrooms
𝜇𝜇𝑘𝑘𝑘𝑘 = a random error for classroom k in site c that is assumed to be independently and identically distributed across classrooms in sites
𝑣𝑣𝑘𝑘 = a random error for site c that is assumed to be independently and identically distributed across sites


89
References
Anthony, Karen, Dale C. Farran, and Kerry G. Hofer. 2013. “Improving Young Children’s Math Learning Through Technology.” Unpublished paper, PDF.
Berrueta-Clement, John R. 1984. Changed Lives: The Effects of the Perry Preschool Program on Youths through Age 19. Ypsilanti, MI: High/Scope Foundation.
Bloom, Howard, Carolyn Hill, Alison Rebeck Black, and Mark W. Lipsey. 2008. Performance Trajectories and Performance Gaps as Achievement Effect-Size Benchmarks for Educational Interventions. New York: MDRC.
Borman, Geoffrey D., Gina M. Hewes, Laura T. Overman, and Shelly Brown. 2003. “Comprehensive School Reform and Achievement: A Meta-Analysis.” Review of Educational Research 73, 2: 125-230.
Bull, Rebecca, Kimberly Andrews Espy, and Sandra A. Wiebe. 2008. “Short-Term Memory, Working Memory, and Executive Functioning in Preschoolers: Longitudinal Predictors of Mathematical Achievement at Age 7 Years.” Developmental Neuropsychology 33, 3: 205-228.
Campbell, Frances A., Craig T. Ramey, Elizabeth Pungello, Joseph Sparling, and Shari Miller-Johnson. 2002. “Early Childhood Education: Young Adult Outcomes from the Abecedarian Project.” Applied Developmental Science 6, 1: 42-57.
Clements, Douglas H., and Julie Sarama. 2004. “Learning Trajectories in Mathematics Education.” Mathematical Thinking and Learning 6, 2: 81-89.
Clements, Douglas H., and Julie Sarama. 2007. “Effects of a Preschool Mathematics Curriculum: Summative Research on the Building Blocks Project.” Journal for Research in Mathematics Education 38, 2: 136-163.
Clements, Douglas H., and Julie Sarama. 2008. “Experimental Evaluation of the Effects of a Research-Based Preschool Mathematics Curriculum.” American Educational Research Journal 45, 2: 443-493.
Clements, Douglas H., and Julie Sarama. 2013. Building Blocks: Teacher’s Edition. Columbus, OH: McGraw-Hill Companies, Inc.
Clements, Douglas H., Julie Sarama, Carolyn Layzer, Fatih Unlu, Carrie Germeroth, and Lily Fesler. 2016. “Effects on Mathematics and Executive Function Learning of an Early Mathematics Curriculum Synthesized with Scaffolded Play Designed to Promote Self-Regulation Versus the Mathematics Curriculum Alone.” Unpublished paper.
Clements, Douglas H., Julie H. Sarama, and Xiufeng H. Liu. 2008. “Development of a Measure of Early Mathematics Achievement Using the Rasch Model: The Research‐Based Early Maths Assessment.” Educational Psychology 28, 4: 457-482.

90
Clements, Douglas H., Julie Sarama, Mary Elaine Spitler, Alissa A. Lange, and Christopher B. Wolfe. 2011. “Mathematics Learned by Young Children in an Intervention Based on Learning Trajectories: A Large-Scale Cluster Randomized Trial.” Journal for Research in Mathematics Education 42, 2: 127-166.
Corsi, Philip Michael. 1972. “Human Memory and the Medial Temporal Region of the Brain.” Ph.D. dissertation. Montreal: McGill University.
Diamond, Adele. 2013. “Executive Functions.” Annual Review of Psychology 64: 135-168.
Diamond, Adele, and Colleen Taylor. 1996. “Development of an Aspect of Executive Control: Development of the Abilities to Remember What I Said and to ‘Do as I Say, Not as I Do.’” Developmental Psychobiology 29, 4: 315-334.
Duncan, Greg J., Chantelle J. Dowsett, Amy Claessens, Katherine Magnuson, Aletha C. Huston, Pamela Klebanov, Linda S. Pagani, Leon Feinstein, Mimi Engel, and Jeanne Brooks-Gunn. 2007. “School Readiness and Later Achievement.” Developmental Psychology 43, 6: 1428-1446.
Duncan, Greg J., and Katherine Magnuson. 2009. “The Nature and Impact of Early Skills, Attention, and Behavior.” Paper presented at the Russell Sage Foundation Conference on Social Inequality and Educational Outcomes, New York City.
Duncan, Greg J., and Katherine Magnuson. 2013. “Investing in Preschool Programs.” Journal of Economic Perspectives 27, 2: 109-132.
Duncan, Sharon E., and Edward A. De Avila. 1998. preLAS 2000. Monterey, CA: CTB/ McGraw-Hill.
Farran, Dale C., and Carol Bilbrey. 2014. “Variation in Observed Program Characteristics Across Classrooms in the Tennessee Voluntary Pre-Kindergarten Program.” Paper presented at the Society for Research on Educational Effectiveness spring conference, Washington, DC.
Ginsburg, Herbert P., Joon Sun Lee, and Judi Stevenson Boyd. 2008. “Mathematics Education for Young Children: What It Is and How to Promote It.” Social Policy Report 22, 1. Ann Arbor, MI: Society for Research in Child Development.
Greenberg, Mark T., Roger P. Weissberg, Mary Utne O’Brien, Joseph E. Zins, Linda Fredericks, Hank Resnik, and Maurice J. Elias. 2003. “Enhancing School-Based Prevention and Youth Development Through Coordinated Social, Emotional, and Academic Learning.” American Psychologist 58, 6-7: 466-474.
Hamre, Bridget K., Robert C. Pianta, Andrew J. Mashburn, and Jason T. Downer. 2007. Building a Science of Classrooms: Application of the CLASS Framework in Over 4,000 U.S. Early Childhood and Elementary Classrooms. New York: Foundation for Child Development.
Heckman, James. 2006. “Skill Formation and the Economics of Investing in Disadvantaged Children.” Science 312, 5782: 1900-1902.

91
Hernandez, Donald J. 2011. Double Jeopardy: How Third-Grade Reading Skills and Poverty Influence High School Graduation. Baltimore: Annie E. Casey Foundation.
Hofer, Kerry G., Dale C. Farran, Mark W. Lipsey, Carol Bilbrey, Elizabeth Vorhaus. 2011. “The Mechanisms Behind the Results: Exploring the Sources of Building Blocks Curricular Effects.” Paper presented at Society for Research on Educational Effectiveness Spring Conference, Washington, DC, March 3-5.
Hofer, Kerry G., Mark W. Lipsey, Nianbo Dong, and Dale C. Farran. 2013. “Results of the Early Math Project — Scale‐Up Cross‐Site Results.” Working paper. Nashville: Peabody Research Institute, Vanderbilt University.
Joyce, Bruce, and Beverly Showers. 2002. Student Achievement Through Staff Development. Alexandria, VA: Association for Supervision and Curriculum Development.
Kessler, Ronald C., Peggy R. Barker, Lisa J. Colpe, Joan F. Epstein, Joseph C. Gfroerer, Eva Hiripi, Mary J. Howes, Sharon-Lise T. Normand, Ronald W. Manderscheid, and Ellen E. Walters. 2003. “Screening for Serious Mental Illness in the General Population.” Archives of General Psychiatry 60, 2: 184-189.
Klein, Alice, Prentice Starkey, Douglas Clements, Julie Sarama, and Roopa Iyer. 2008. “Effects of a Pre-Kindergarten Mathematics Intervention: A Randomized Experiment.” Journal of Research on Educational Effectiveness 1, 3: 155-178.
Lewis Presser, Ashley, Margaret Clements, Herbert Ginsburg, and Barbrina Ertle. 2012. Effects of a Preschool and Kindergarten Mathematics Curriculum: Big Math For Little Kids. Washington, DC: Institute for Education Sciences.
Lezak, Muriel Deutsch. 1983. Neuropsychological Assessment. New York: Oxford University Press.
Lobman, Carrie, Sharon Ryan, and Jill McLaughlin. 2005. “Toward a Unified System of Early Childhood Teacher Education and Professional Development: Conversations with Stakeholders.” Paper presented at the Annual Meeting of the American Educational Research Association, Montreal.
Luria, Aleksandr Romanovich. 1966. Higher Cortical Functions in Man. New York: Basic Books.
Martin, Nancy A., and Rick Brownell. 2011. Receptive One-Word Picture Vocabulary Test — Fourth Edition. Novato, CA: Academic Therapy Publications.
Maslach, Christina, Susan E. Jackson, and Michael P. Leiter. 1996. Maslach Burnout Inventory Manual. Mountain View, CA: Consulting Psychologists Press.
Moiduddin, Emily, Nikki Aikens, Louisa Tarullo, Jerry West, and Yange Xue. 2012. Child Outcomes and Classroom Quality in FACES 2009. Washington, DC: Administration for Children and Families.
92
Najarian, Michelle, Kyle Snow, Jean Lennon, and Susan Kinsey. 2010. Early Childhood Longitudinal Study, Birth Cohort (ECLS-B) Preschool–Kindergarten 2007 Psychometric Report (NCES 2010-009). Washington, DC: National Center for Education Statistics, Institute of Education Sciences, U.S. Department of Education.
Peisner-Feinberg, Ellen S., Jennifer M. Schaaf, Lisa M. Hildebrandt, and Yi Pan. 2014. Children’s Outcomes and Program Quality in the North Carolina Pre‐Kindergarten Program: 2012-2013 Statewide Evaluation. Chapel Hill: Frank Porter Graham Child Development Institute, University of North Carolina.
Peisner-Feinberg, Ellen S., Jennifer M. Schaaf, Lisa M. Hildebrandt, and Yi Pan. 2015. Children’s Pre-K Outcomes and Classroom Quality in Georgia’s Pre-K Program: Findings from the 2013-2014 Evaluation Study. Chapel Hill: Frank Porter Graham Child Development Institute, University of North Carolina.
Pianta, Robert C., Karen M. La Paro, and Bridget K. Hamre. 2008. Classroom Assessment Scoring System Manual: Pre-K. Baltimore: Paul H. Brookes Publishing Company.
Reardon, Sean F. 2011. “The Widening Academic Achievement Gap Between the Rich and the Poor: New Evidence and Possible Explanations.” Pages 91-116 in Richard J. Murnane and Greg J. Duncan (eds.), Whither Opportunity? Rising Inequality, Schools, and Children’s Life Chances. New York: Russell Sage Foundation.
Reardon, Sean F., and Ximena A. Portilla. 2016. “Recent Trends in Income, Racial, and Ethnic School Readiness Gaps at Kindergarten Entry.” AERA Open 2, 3.
Saluja, Gitanjali, Diane M. Early, and Richard M. Clifford. 2002. “Demographic Characteristics of Early Childhood Teachers and Structural Elements of Early Care and Education in the United States.” Early Childhood Research & Practice 4, 1.
Sarama, Julie, and Douglas H. Clements. 2006. “Mathematics, Young Students, and Computers: Software, Teaching Strategies and Professional Development.” The Mathematics Educator 9, 2: 112-134.
Sarama, Julie, and Douglas H. Clements. 2009. “Manual for Classroom Observation of Early Mathematics: Environment and teaching (COEMET) V. 3.” Unpublished paper.
Sarama, Julie, Douglas H. Clements, Prentice Starkey, Alice Klein, and Ann Wakeley. 2008. “Scaling Up the Implementation of a Pre-Kindergarten Mathematics Curriculum: Teaching for Understanding with Trajectories and Technologies.” Journal of Research on Educational Effectiveness 1, 2: 89-119.
Sheridan, Susan M., Carolyn Pope Edwards, Christine A. Marvin, and Lisa L. Knoche. 2009. “Professional Development in Early Childhood Programs: Process Issues and Research Needs.” Early Education and Development 20, 3: 377-401.
Smith-Donald, Radiah, Cybele Raver, Tiffany Hayes, and Breeze Richardson. 2007. “Preliminary Construct and Concurrent Validity of the Preschool Self-Regulation

93
Assessment (PSRA) for Field-Based Research.” Early Childhood Research Quarterly 22, 2: 173-187.
Warren, John Robert. 2016. “Does Growing Childhood Socioeconomic Inequality Mean Future Inequality in Adult Health?” Annals of the American Academy of Political and Social Science 663, 1: 292-330.
Weiland, Christina, and Hirokazu Yoshikawa. 2013. “Impacts of a Prekindergarten Program on Children’s Mathematics, Language, Literacy, Executive Function, and Emotional Skills.” Child Development 84, 6: 2112-2130.
White House Council of Economic Advisers. 2014. The Economics of Early Childhood Investments. Washington, DC: Executive Office of the President of the United States.
Williford, Amanda P., Michelle F. Maier, Jason T. Downer, Robert C. Pianta, and Carolee Howes. 2013. “Understanding How Children’s Engagement and Teachers’ Interactions Combine to Predict School Readiness.” Journal of Applied Developmental Psychology 34, 6: 299-309.
Willoughby, Michael T., R. J. Wirth, Clancy B. Blair, and Family Life Project Investigators. 2012. “Executive Function in Early Childhood: Longitudinal Measurement Invariance and Developmental Change.” Psychological Assessment 24, 2: 418.
Woodcock, Richard W., Kevin S. McGrew, and Nancy Mather. 2001. Woodcock-Johnson III Tests of Achievement. Itasca, IL: Riverside Publishing.
About MDRC
MDRC is a nonprofit, nonpartisan social and education policy research organization dedicated to learning what works to improve the well-being of low-income people. Through its research and the active communication of its findings, MDRC seeks to enhance the effectiveness of so-cial and education policies and programs.
Founded in 1974 and located in New York City and Oakland, California, MDRC is best known for mounting rigorous, large-scale, real-world tests of new and existing policies and programs. Its projects are a mix of demonstrations (field tests of promising new program approaches) and evaluations of ongoing government and community initiatives. MDRC’s staff bring an unusual combination of research and organizational experience to their work, providing expertise on the latest in qualitative and quantitative methods and on program design, development, implementa-tion, and management. MDRC seeks to learn not just whether a program is effective but also how and why the program’s effects occur. In addition, it tries to place each project’s findings in the broader context of related research — in order to build knowledge about what works across the social and education policy fields. MDRC’s findings, lessons, and best practices are proac-tively shared with a broad audience in the policy and practitioner community as well as with the general public and the media.
Over the years, MDRC has brought its unique approach to an ever-growing range of policy are-as and target populations. Once known primarily for evaluations of state welfare-to-work pro-grams, today MDRC is also studying public school reforms, employment programs for ex-offenders and people with disabilities, and programs to help low-income students succeed in college. MDRC’s projects are organized into five areas:
• Promoting Family Well-Being and Children’s Development
• Improving Public Education
• Raising Academic Achievement and Persistence in College
• Supporting Low-Wage Workers and Communities
• Overcoming Barriers to Employment
Working in almost every state, all of the nation’s largest cities, and Canada and the United Kingdom, MDRC conducts its projects in partnership with national, state, and local govern-ments, public school systems, community organizations, and numerous private philanthropies.


