1 Making Reliable and Stable Progress Decisions: Slope or Pathways of Progress™? 1 Roland H. Good III Dynamic Measurement Group, Inc. University of Oregon Kelly A. Powell-Smith Dynamic Measurement Group, Inc. Elizabeth N. Dewey Dynamic Measurement Group, Inc. Introduction Accurate decisions about student progress are essential for Response-to- Intervention models. In addition, student outcomes are enhanced when meaningful, ambitious, and attainable goals are established (effect size +0.56); when feedback is provided to students and teachers on progress relative to goals (effect size +0.73); and when progress monitoring and formative evaluation with goals, graphing, and decision rules are employed (effect size +0.90) (Fuchs & Fuchs, 1986; Hattie, 2009). To make defensible decisions about individual student progress, we need (a) accurate measurement at the individual student level, and (b) an interpretive framework within which to determine if the individual measure represents adequate progress or not. Ideally the progress monitoring system and resulting decisions should demonstrate (a) reliability (including decision stability), (b) evidence of validity (including decision accuracy), (c) appropriate normative comparisons, and (d) decision utility (i.e., result in improved student outcomes). Ordinary Least Squares Slope Slope of student progress derived from an ordinary least squares (OLS) regression line predicting student skill level from weeks of instruction is one approach frequently used to estimate individual student rate of progress (Ardoin, Christ, Morena, Cormier, & Klingbeil, 2013). Attractive features of slope are: (a) it can visually show an improving skill, (b) it can be compared to expectations, and (c) it can be used to predict an outcome (where the student will get to at a future time). Figure 1 (left panel) illustrates a regression line fit to a third-grade student's DIBELS ® Oral Reading Fluency- Words Correct (DORF-WC) scores over time. The individual measure of slope of progress for this student was +0.60. One interpretive framework for evaluating this student’s slope is to compare to rate of improvement (ROI) norms. A slope of +.60 1 Good, R. H., Powell-Smith, K. A., & Dewey, E. (2015, February). Making Reliable and Stable Progress Decisions: Slope or Pathways of Progress? Poster presented at the Annual Pacific Coast Research Conference, Coronado, CA. DIBELS ® , DIBELS Next ® , DIBELSnet ® and Pathways of Progress™ are trademarks of Dynamic Measurement Group, Inc. mCLASS ® is a trademark of Amplify, Inc. AIMSweb ® is a trademark of Pearson, Inc.
Transcript
1
Making Reliable and Stable Progress Decisions: Slope or Pathways of Progress™?1
Roland H. Good III
Dynamic Measurement Group, Inc. University of Oregon
Kelly A. Powell-Smith
Dynamic Measurement Group, Inc.
Elizabeth N. Dewey Dynamic Measurement Group, Inc.
Introduction
Accurate decisions about student progress are essential for Response-to-Intervention models. In addition, student outcomes are enhanced when meaningful, ambitious, and attainable goals are established (effect size +0.56); when feedback is provided to students and teachers on progress relative to goals (effect size +0.73); and when progress monitoring and formative evaluation with goals, graphing, and decision rules are employed (effect size +0.90) (Fuchs & Fuchs, 1986; Hattie, 2009). To make defensible decisions about individual student progress, we need (a) accurate measurement at the individual student level, and (b) an interpretive framework within which to determine if the individual measure represents adequate progress or not. Ideally the progress monitoring system and resulting decisions should demonstrate (a) reliability (including decision stability), (b) evidence of validity (including decision accuracy), (c) appropriate normative comparisons, and (d) decision utility (i.e., result in improved student outcomes). Ordinary Least Squares Slope
Slope of student progress derived from an ordinary least squares (OLS) regression line predicting student skill level from weeks of instruction is one approach frequently used to estimate individual student rate of progress (Ardoin, Christ, Morena, Cormier, & Klingbeil, 2013). Attractive features of slope are: (a) it can visually show an improving skill, (b) it can be compared to expectations, and (c) it can be used to predict an outcome (where the student will get to at a future time). Figure 1 (left panel) illustrates a regression line fit to a third-grade student's DIBELS® Oral Reading Fluency-Words Correct (DORF-WC) scores over time. The individual measure of slope of progress for this student was +0.60. One interpretive framework for evaluating this student’s slope is to compare to rate of improvement (ROI) norms. A slope of +.60 1 Good, R. H., Powell-Smith, K. A., & Dewey, E. (2015, February). Making Reliable and Stable Progress
Decisions: Slope or Pathways of Progress? Poster presented at the Annual Pacific Coast Research Conference, Coronado, CA.
DIBELS®, DIBELS Next®, DIBELSnet® and Pathways of Progress™ are trademarks of Dynamic Measurement Group, Inc. mCLASS® is a trademark of Amplify, Inc. AIMSweb® is a trademark of Pearson, Inc.
2
would be between the 20th percentile of ROI and the 40th percentile of ROI, representing a below typical ROI. Slope of progress might also be compared to CBM Reading norms (e.g., Hasbrouck & Tindal, 2006) and to cut points for inadequate slope (e.g., Fuchs & Fuchs, undated). For example, according to Fuchs and Fuchs (undated), a slope of progress in reading below 0.75 would be characterized as inadequate.
Figure 1. Example student with 21 progress monitoring assessments within 22 weeks after the beginning-of-year benchmark assessment. The OLS slope of progress compared to rate of improvement bands (left panel) and the moving median of three most current assessments compared to Pathways of Progress (right panel) are illustrated.
All is not well in the land of slope. Concerns with the OLS slope metric most used to summarize student progress have been discussed extensively in the research literature. A first concern is the reliability of slope estimates, and a second, related concern is the length of time and number of data points needed to even approach a reliable measure and stable decision. We examined estimates of individual slope of progress and estimates of a normative context for evaluating slope with DIBELS 6th Edition progress monitoring materials in presentations at the DIBELS Summit (Good, 2009). First we examined the reliability of the slope estimate based on two benchmark assessments (beginning-of-year and middle-of-year) plus 14 progress monitoring data (16 assessments over a five month period). Based on 886 students, the reliability of the estimate of individual slope of progress was .64. The variability in scores around the fitted line is quantified with the root mean square error (RMSE). Next we examined whether we could specify
3
conditions where a sufficiently stable estimate of individual slope of progress could be obtained. However, even when we were extremely restrictive and selected only those students whose progress monitoring was extremely well behaved (i.e., low variability, with RMSE below the 50th percentile), the reliability of the slope only increased to .78. Similarly, a recent field-based study obtained slope reliability of .61 after six weeks of daily monitoring (i.e., 30 data points) (Thornblad & Christ, 2014). This result, associated with the longest progress monitoring period they examined, was the highest reliability found in their study. The reliability of slope for shorter periods of time ranged from .21 to .41, with reliability increasing as the number of weeks of assessment increased. Overall, these data do not fill us with confidence in the reliability of slope. In addition, daily progress monitoring may not be realistic in practice. For example, in our progress monitoring data set there were 151,138 students with some amount of progress monitoring. No student was assessed 30 times within six weeks of the BOY benchmark assessment. In general, the reliability of slope estimates increases with (a) more data points, (b) over a longer period of time, and (c) lower student variability in performance. Some have argued for a ten data point minimum for reliable slope estimates (e.g., Gall & Gall, 2007; Good, 1990; Parker & Tindal; Shinn, 2002). Christ (2006) suggested a minimum of two data points per week for ten weeks is needed for low-stakes decisions, and more data is needed for higher-stakes decisions. More recently, Jenkins and Terjeson (2011) suggested that slope reliability comparable to that achieved with more frequent progress monitoring can be obtained from fewer progress monitoring sessions with more passages administered per session. A second, related concern with using individual estimates of slope to evaluate progress is the length of time and number of assessments necessary to achieve even a minimal level of reliability. In practice, if even minimally stable decisions about progress can only be made after three or more months of data collection, progress decisions may be too infrequent to be of practical benefit.
Upon concluding their comprehensive review of the literature, Ardoin, Christ, Morena, Cormier, & Klingbeil (2013) state that schools should be cautious about using curriculum based measurement-reading (CBM-R) data to evaluate individual student progress, and that school personnel should not be trained in current CBM-R decision rules. They called "for research to develop, evaluate, and establish evidence-based guidelines for use and interpretation of CBM-R short-term progress monitoring data" (p. 14). Pathways of Progress™
An alternative approach is Pathways of Progress using a moving mean or moving median of the three most recent progress monitoring data points as illustrated by the dotted line in Figure 1 (right panel). The Pathways of Progress are derived from the quantiles of the distribution of DORF-WC outcomes for students with the same level
4
of initial outcomes as the individual student. For example, the student illustrated in Figure 1 had a DIBELS Composite Score (DCS) of 85 on the beginning-of-year benchmark assessment. Compared other students with the same level of initial skills, the student’s moving median at week 22 of 61 words correct would be between the 60th percentile (i.e., 58 words correct) and the 80th percentile (i.e., 64 words correct) representing Above Typical progress at that time. Good, Powell-Smith, Gushta, and Dewey (2015) contrasted the reliability of slope of progress with the reliability of the moving mean in Pathways of Progress for n = 843 third-grade students who had at least 14 assessments. Using estimates of reliability based on the same students, the same data, and using the same estimation procedure (HLM parameter reliability estimates), slope estimates displayed reliability of r = .55, while the moving mean with Pathways of Progress estimates displayed reliability of r = .95. This appears to be a dramatic difference in reliability, but important questions remain.
Purpose and Research Questions This study examines two important issues:
1. To have practical value for educational decisions, timely information on student progress is important. Even if students are assessed weekly, 14 data points takes three and a half months to enable a decision about progress. If the student is assessed every two weeks, it would take seven months to make a decision, which is not particularly timely.
2. Although the fundamental metric for Pathways of Progress decisions (i.e., the
level of student skills as represented by the moving mean or moving median) may display greater reliability than slope of progress, the stability of educational decisions in practice may or may not differ. Parallel decisions about progress based on slope and Pathways of Progress can be made by determining the student’s quantile range of progress. For example, if the student’s slope of progress based on 22 weeks of data is between the 20th percentile and the 40th percentile of ROI, they would be in the below typical band of progress. A similar decision about progress using Pathways of Progress can be made based on the same data. One way to conceptualize the stability of educational decisions is the extent to which the progress decision would change based on a single additional data point.
This study addresses the following research questions:
1. Does the type of metric (slope or level of performance) and number of weeks of assessment (6, 10, 14, 18, or 22) affect the reliability of the individual student measure used to quantify progress for third-grade students?
2. Does the progress monitoring approach (moving median with Pathways of
5
Progress or slope with ROI band) and number of weeks of assessment (6, 10, 14, 18, or 22) affect the stability of individual progress decisions for third-grade students?
3. What is the minimum number of weeks needed to make an individual progress decision with adequate reliability and stability?
Methods
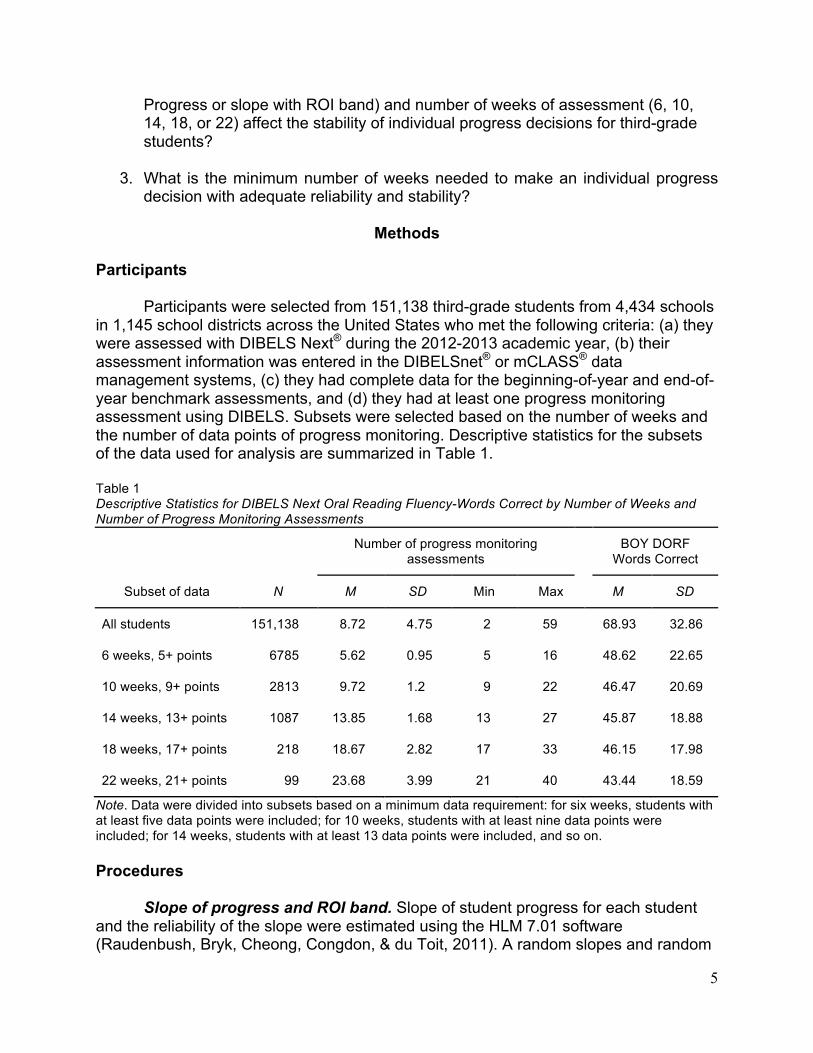
Participants Participants were selected from 151,138 third-grade students from 4,434 schools in 1,145 school districts across the United States who met the following criteria: (a) they were assessed with DIBELS Next® during the 2012-2013 academic year, (b) their assessment information was entered in the DIBELSnet® or mCLASS® data management systems, (c) they had complete data for the beginning-of-year and end-of-year benchmark assessments, and (d) they had at least one progress monitoring assessment using DIBELS. Subsets were selected based on the number of weeks and the number of data points of progress monitoring. Descriptive statistics for the subsets of the data used for analysis are summarized in Table 1. Table 1 Descriptive Statistics for DIBELS Next Oral Reading Fluency-Words Correct by Number of Weeks and Number of Progress Monitoring Assessments
Note. Data were divided into subsets based on a minimum data requirement: for six weeks, students with at least five data points were included; for 10 weeks, students with at least nine data points were included; for 14 weeks, students with at least 13 data points were included, and so on. Procedures Slope of progress and ROI band. Slope of student progress for each student and the reliability of the slope were estimated using the HLM 7.01 software (Raudenbush, Bryk, Cheong, Congdon, & du Toit, 2011). A random slopes and random
6
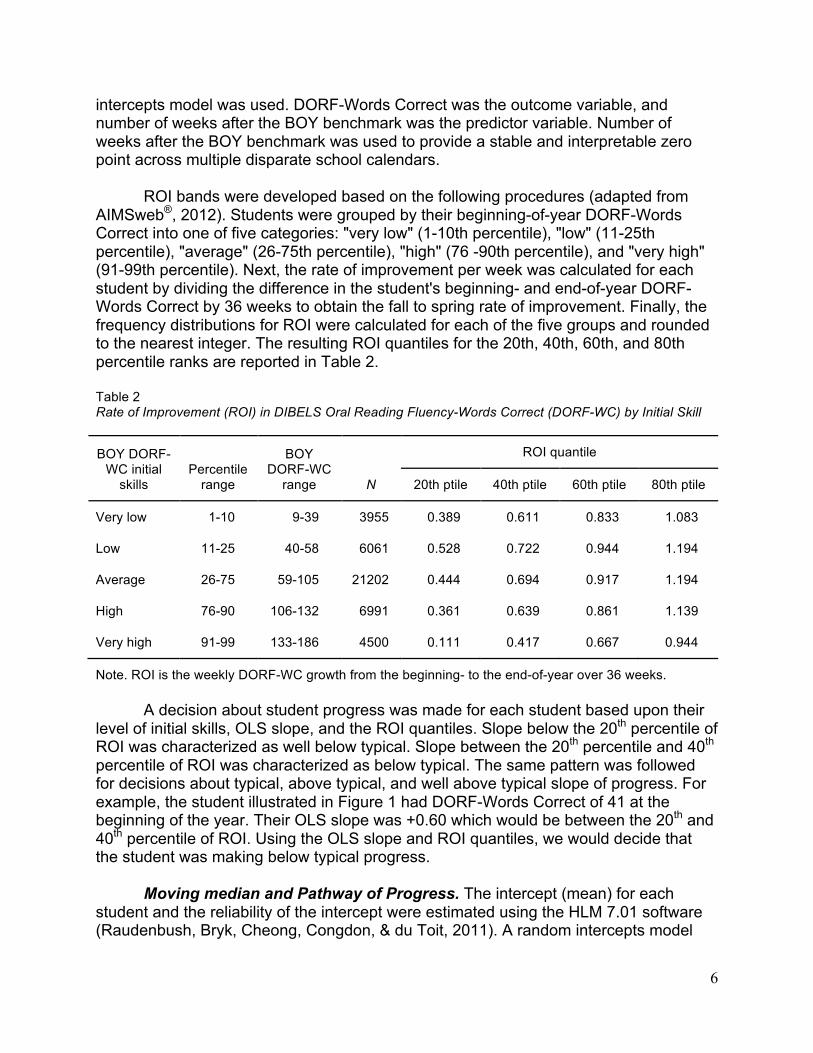
intercepts model was used. DORF-Words Correct was the outcome variable, and number of weeks after the BOY benchmark was the predictor variable. Number of weeks after the BOY benchmark was used to provide a stable and interpretable zero point across multiple disparate school calendars. ROI bands were developed based on the following procedures (adapted from AIMSweb®, 2012). Students were grouped by their beginning-of-year DORF-Words Correct into one of five categories: "very low" (1-10th percentile), "low" (11-25th percentile), "average" (26-75th percentile), "high" (76 -90th percentile), and "very high" (91-99th percentile). Next, the rate of improvement per week was calculated for each student by dividing the difference in the student's beginning- and end-of-year DORF-Words Correct by 36 weeks to obtain the fall to spring rate of improvement. Finally, the frequency distributions for ROI were calculated for each of the five groups and rounded to the nearest integer. The resulting ROI quantiles for the 20th, 40th, 60th, and 80th percentile ranks are reported in Table 2. Table 2 Rate of Improvement (ROI) in DIBELS Oral Reading Fluency-Words Correct (DORF-WC) by Initial Skill
BOY DORF-WC initial
skills Percentile
range
BOY DORF-WC
range
ROI quantile
N 20th ptile 40th ptile 60th ptile 80th ptile
Very low 1-10 9-39 3955 0.389 0.611 0.833 1.083
Low 11-25 40-58 6061 0.528 0.722 0.944 1.194
Average 26-75 59-105 21202 0.444 0.694 0.917 1.194
High 76-90 106-132 6991 0.361 0.639 0.861 1.139
Very high 91-99 133-186 4500 0.111 0.417 0.667 0.944
Note. ROI is the weekly DORF-WC growth from the beginning- to the end-of-year over 36 weeks. A decision about student progress was made for each student based upon their level of initial skills, OLS slope, and the ROI quantiles. Slope below the 20th percentile of ROI was characterized as well below typical. Slope between the 20th percentile and 40th percentile of ROI was characterized as below typical. The same pattern was followed for decisions about typical, above typical, and well above typical slope of progress. For example, the student illustrated in Figure 1 had DORF-Words Correct of 41 at the beginning of the year. Their OLS slope was +0.60 which would be between the 20th and 40th percentile of ROI. Using the OLS slope and ROI quantiles, we would decide that the student was making below typical progress. Moving median and Pathway of Progress. The intercept (mean) for each student and the reliability of the intercept were estimated using the HLM 7.01 software (Raudenbush, Bryk, Cheong, Congdon, & du Toit, 2011). A random intercepts model
7
was used to model the final three data points for each number of weeks. DORF-Words Correct was again the outcome variable. The Pathways of Progress are based on 43,094 third-grade students using the DIBELSnet data management service during the 2012-2013 academic year. Students were included who had both beginning- and end-of-year benchmark assessment data. The Pathways of Progress were constructed in the following steps:
1. Students were grouped together by their beginning-of-year DIBELS Next Composite score for the scoring range between a score of one and the 99.5th percentile rank (DCS = 550 for third grade). Next, for each unique beginning-of-year Composite score, the 20th, 40th, 60th, and 80th quantiles were calculated for DIBELS Oral Reading Fluency Words Correct.
2. A stiff, spline quantile regression model was fit to each quantile using beginning-
of-year DIBELS Next Composite score as the predictor (see Figure 2). There were four models per measure (i.e., one per quantile). Models were evaluated for goodness of fit via fit statistics and visual analytics.
3. The predicted quantile scores from the regression model corresponding to each
unique beginning-of-year DIBELS Next Composite score were rounded to the nearest one, and placed into a look-up table (e.g., see Table 3). These are the end-of-year pathway borders.
4. Pathway borders were linearly interpolated for each week after BOY benchmark
using the beginning-of-year DORF-WC at week zero and the end-of-year Pathways of Progress border at week 35 (the median end-of-year week). For the example student, the interpolated Pathways of Progress borders at week 22 were 46.70 (20th ptile), 53.01 (40th ptile), 57.62 (60th ptile), and 64.29 (80th ptile).
8
Figure 2. Spline quantile regression predicting end-of-year DORF-WC quantiles from beginning-of-year DIBELS Next Composite Score.
9
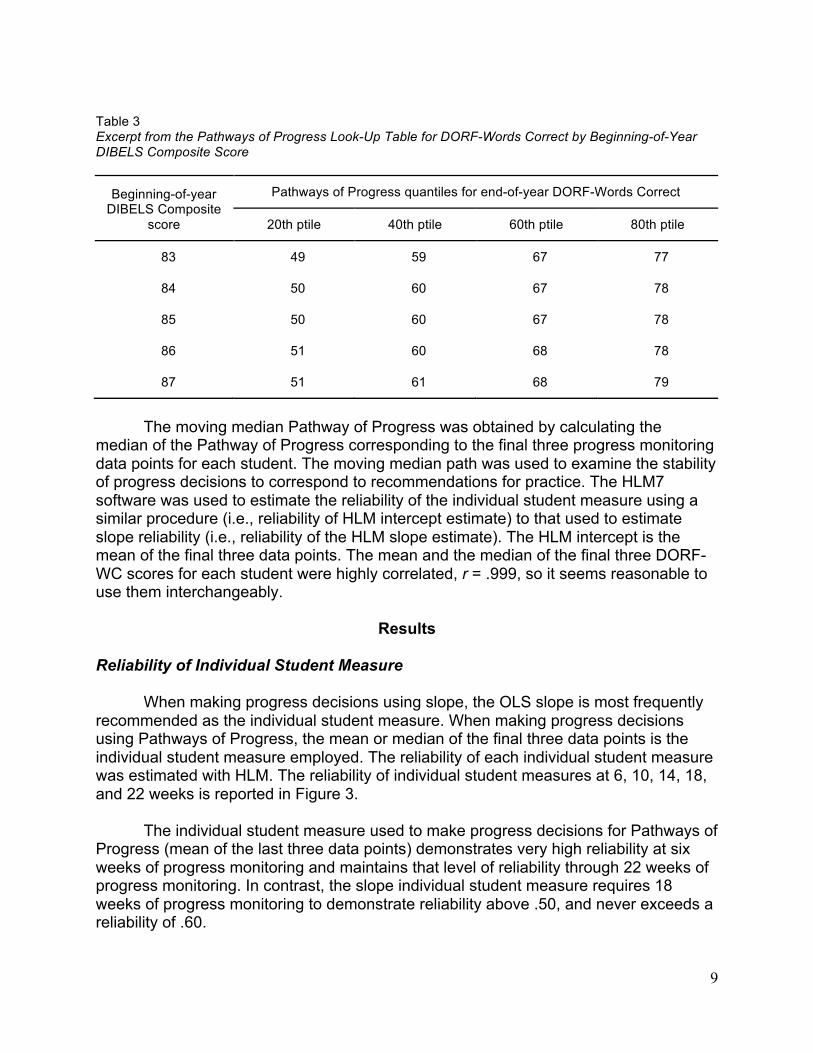
Table 3 Excerpt from the Pathways of Progress Look-Up Table for DORF-Words Correct by Beginning-of-Year DIBELS Composite Score
Beginning-of-year DIBELS Composite
score
Pathways of Progress quantiles for end-of-year DORF-Words Correct
20th ptile 40th ptile 60th ptile 80th ptile
83 49 59 67 77
84 50 60 67 78
85 50 60 67 78
86 51 60 68 78
87 51 61 68 79
The moving median Pathway of Progress was obtained by calculating the median of the Pathway of Progress corresponding to the final three progress monitoring data points for each student. The moving median path was used to examine the stability of progress decisions to correspond to recommendations for practice. The HLM7 software was used to estimate the reliability of the individual student measure using a similar procedure (i.e., reliability of HLM intercept estimate) to that used to estimate slope reliability (i.e., reliability of the HLM slope estimate). The HLM intercept is the mean of the final three data points. The mean and the median of the final three DORF-WC scores for each student were highly correlated, r = .999, so it seems reasonable to use them interchangeably.
Results Reliability of Individual Student Measure
When making progress decisions using slope, the OLS slope is most frequently recommended as the individual student measure. When making progress decisions using Pathways of Progress, the mean or median of the final three data points is the individual student measure employed. The reliability of each individual student measure was estimated with HLM. The reliability of individual student measures at 6, 10, 14, 18, and 22 weeks is reported in Figure 3. The individual student measure used to make progress decisions for Pathways of Progress (mean of the last three data points) demonstrates very high reliability at six weeks of progress monitoring and maintains that level of reliability through 22 weeks of progress monitoring. In contrast, the slope individual student measure requires 18 weeks of progress monitoring to demonstrate reliability above .50, and never exceeds a reliability of .60.
10
Figure 3. Reliability of the individual student measure. HLM estimates of the reliability of the individual student measure used to evaluate student progress at 6, 10, 14, 18, and 22 weeks. Stability of Progress Decisions
As a practitioner, I would be concerned about the impact measure reliability would have on the educational decisions about progress for individual students. One way to examine this issue is the extent to which one more assessment would change the progress decision. In Figure 4, we report the percent agreement between j weeks of progress monitoring and j weeks plus one additional assessment where j is 6, 10, 14, 18, and 22 weeks.
It is important to note that the jth week decision and the jth week plus one additional assessment decision are not independent decisions. For example, when examining slope, the 22 week decision and the 22 week plus one assessment decision generally share 22 of 23 data points (96% overlapping data). In turn, using Pathways of Progress, the 22 week decision and the 22 week plus one decision share two of three data points (67% overlapping data). If anything, this limitation advantages slope decisions. Overall, progress decisions for both slope and Pathways of Progress demonstrated stability above .60. By 22 weeks of progress monitoring, the stability of slope and Pathways of Progress decisions was comparable.
11
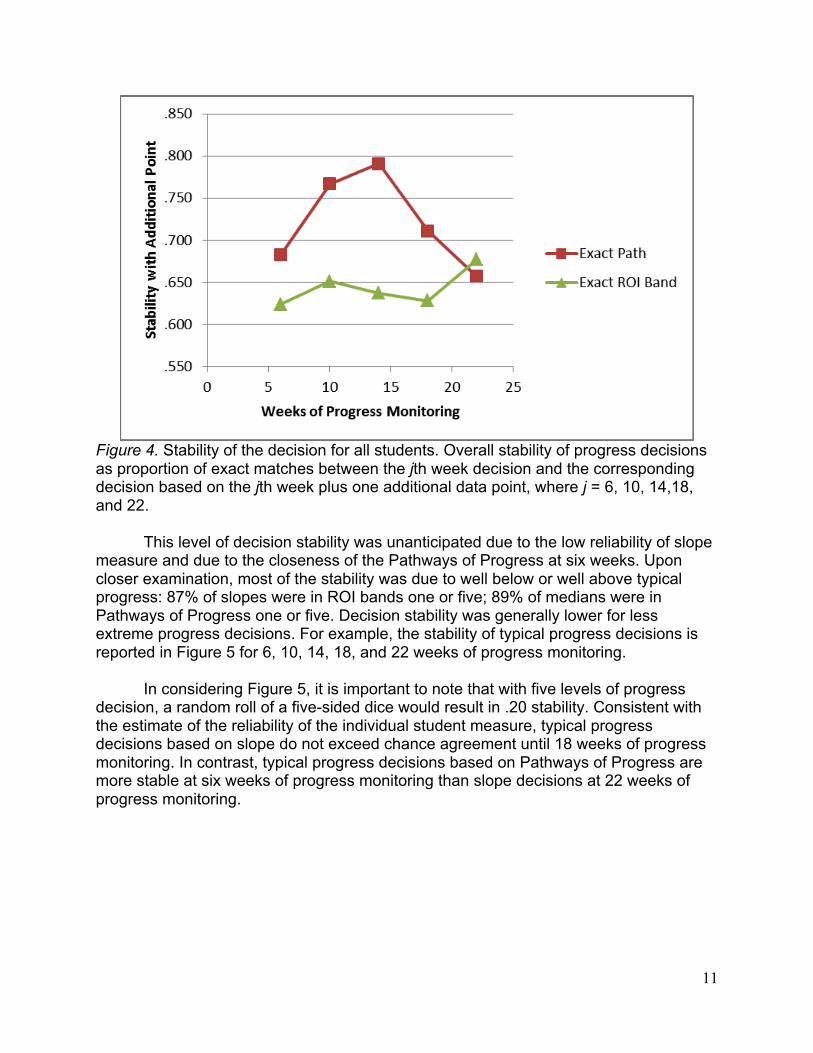
Figure 4. Stability of the decision for all students. Overall stability of progress decisions as proportion of exact matches between the jth week decision and the corresponding decision based on the jth week plus one additional data point, where j = 6, 10, 14,18, and 22. This level of decision stability was unanticipated due to the low reliability of slope measure and due to the closeness of the Pathways of Progress at six weeks. Upon closer examination, most of the stability was due to well below or well above typical progress: 87% of slopes were in ROI bands one or five; 89% of medians were in Pathways of Progress one or five. Decision stability was generally lower for less extreme progress decisions. For example, the stability of typical progress decisions is reported in Figure 5 for 6, 10, 14, 18, and 22 weeks of progress monitoring. In considering Figure 5, it is important to note that with five levels of progress decision, a random roll of a five-sided dice would result in .20 stability. Consistent with the estimate of the reliability of the individual student measure, typical progress decisions based on slope do not exceed chance agreement until 18 weeks of progress monitoring. In contrast, typical progress decisions based on Pathways of Progress are more stable at six weeks of progress monitoring than slope decisions at 22 weeks of progress monitoring.
12
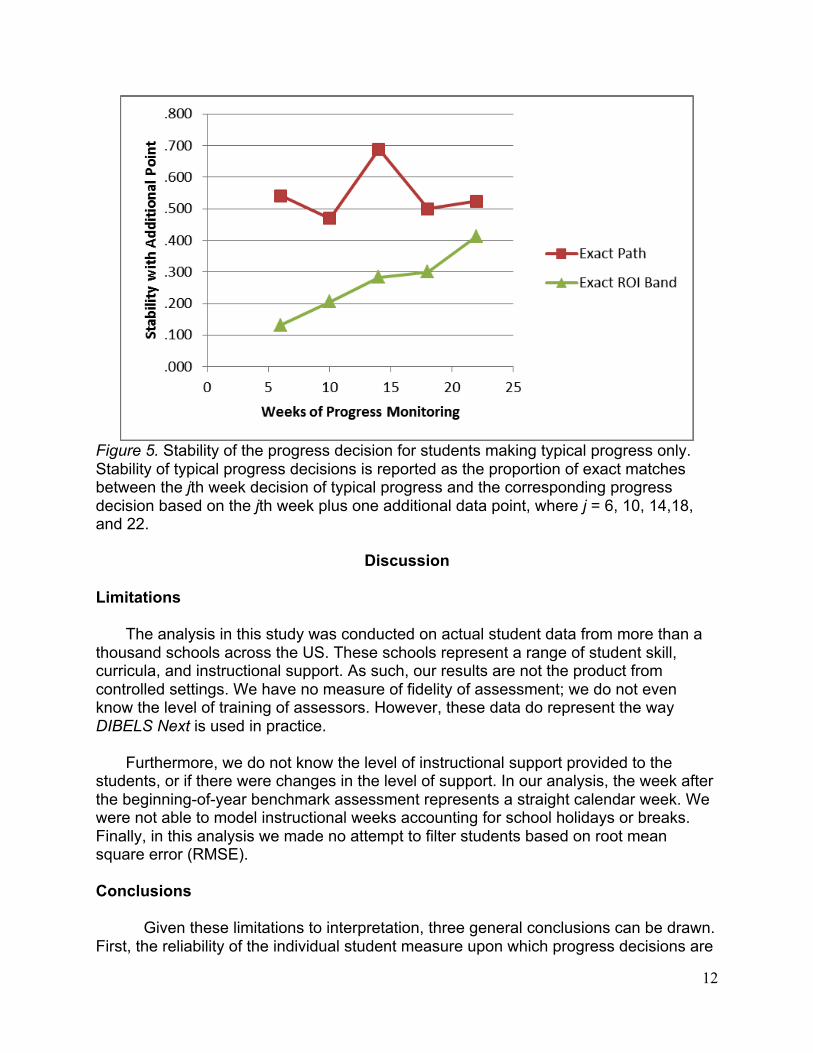
Figure 5. Stability of the progress decision for students making typical progress only. Stability of typical progress decisions is reported as the proportion of exact matches between the jth week decision of typical progress and the corresponding progress decision based on the jth week plus one additional data point, where j = 6, 10, 14,18, and 22.
Discussion
Limitations
The analysis in this study was conducted on actual student data from more than a thousand schools across the US. These schools represent a range of student skill, curricula, and instructional support. As such, our results are not the product from controlled settings. We have no measure of fidelity of assessment; we do not even know the level of training of assessors. However, these data do represent the way DIBELS Next is used in practice.
Furthermore, we do not know the level of instructional support provided to the
students, or if there were changes in the level of support. In our analysis, the week after the beginning-of-year benchmark assessment represents a straight calendar week. We were not able to model instructional weeks accounting for school holidays or breaks. Finally, in this analysis we made no attempt to filter students based on root mean square error (RMSE). Conclusions Given these limitations to interpretation, three general conclusions can be drawn. First, the reliability of the individual student measure upon which progress decisions are
13
based is much higher for Pathways of Progress than for OLS slope. Second, progress decisions based on Pathways of Progress are consistently more stable and require fewer weeks of progress monitoring than corresponding decisions based on OLS slope and ROI band. Third, decisions about extreme performance (well below typical or well above typical) are generally more stable than when progress is typical. Thus, it is likely we can have more confidence in a progress decision when it's obvious the student is either (a) in need of instructional change (no improvement or progress is well below typical) or (b) performing well above expectation (progress is well above typical). However, even when there is less certainty, progress decisions should be self-correcting (i.e., modify the progress decision as we collect more data, consider what other factors might be impacting performance). Implications for Practice
Several implications for practice are important. When making individual educational decisions, the fidelity of assessment procedures should be evaluated before interpreting progress. Steps to ensure the quality of the information used to make decisions are an important feature of best practice. These steps include (a) providing adequate training and periodic retraining, (b) checking fidelity to standardized assessment procedures, and (c) validating scores by retesting or obtaining additional information when there is concern about a score. Other steps to ensure accurate information include (a) checking the accuracy of scoring, (b) verifying the accuracy of data entry, and (c) ensuring the consistency and appropriateness of testing conditions.
When making progress decisions in practice, it is important to consider the
conditions at the time of assessment, including student attendance, level of support, and any other factors that would affect student performance. In addition, it is important to examine the amount of variability in student performance and investigate potential sources for such variability. Students with very high variability may be experiencing differences in motivation, engagement, effort, or other conditions at the time of assessment.
Finally, it is important to evaluate the reliability and stability of progress in the
context of the educational decision we are making. Ongoing instructional planning decisions need to be timely, efficient, and self-correcting with reasonable accuracy. High stakes decisions including eligibility need to be highly accurate though perhaps less timely and efficient. Decision-making efficiency can be increased by allocating resources to increased data collection only when the decision warrants it.
14
References
AIMSweb (2012.) ROI Growth Norms Guide. Accessed: September 1, 2014 from AIMSweb.com. Bloomington, MN: Pearson.
Ardoin, S. P., Christ, T. J., Morena, L. S., Cormier, D. C., & Klingbeil, D. A. (2013). A
systematic review and summarization of the recommendations and research surrounding curriculum-based measurement of oral reading fluency (CBM-R) decision rules. Journal of School Psychology, 51, 1–18. http://dx.doi.org/10.1016/j.jsp.2012.09.004.
Fuchs, L. S., & Fuchs, D. (1986). Effects of systematic formative evaluation: A meta-
analysis. Exceptional Children, 53(3), 199-208. Good, R. H. (2009, February). Evidentiary Requirements for Progress Monitoring
Measures When Used for Response to Intervention. Paper presented at the DIBELS Summit, Albuquerque, NM.
Good, R. H., Powell-Smith, K. A., Gushta, M., Dewey, E. (2015). Evaluating the R in
RTI: Slope or Student Growth Percentile? Paper presentation at the National Association of School Psychologists Annual Convention, Orlando, FL.
Hattie, J. (2009). Visible learning: A synthesis of over 800 meta-analyses relating to
achievement. New York, NY: Routledge. Raudenbush, S. W., Bryk, A. S., Cheong, Y. F., Congdon, R. T. & du Toit, M. (2011).
Scientific Software International, Inc: HLM 7 Hierarchical Linear and Nonlinear Modeling [Software]. Available from http://www.ssicentral.com.
Thornblad, S. C., & Christ, T. J. (2014). Curriculum-based measurement of reading: Is 6
weeks of daily progress monitoring enough? School Psychology Review, 43(1), 19 - 29.