13
Julia Plevin Eliz Ayaydin
| Date post: | 20-Aug-2015 |
| Category: |
Design |
| Upload: | julia-plevin |
| View: | 338 times |
| Download: | 0 times |

Julia Plevin Eliz Ayaydin

GDELT data, while interesting, has structural and misleading implications for making sense of conflict.
The challenge
Insight 1
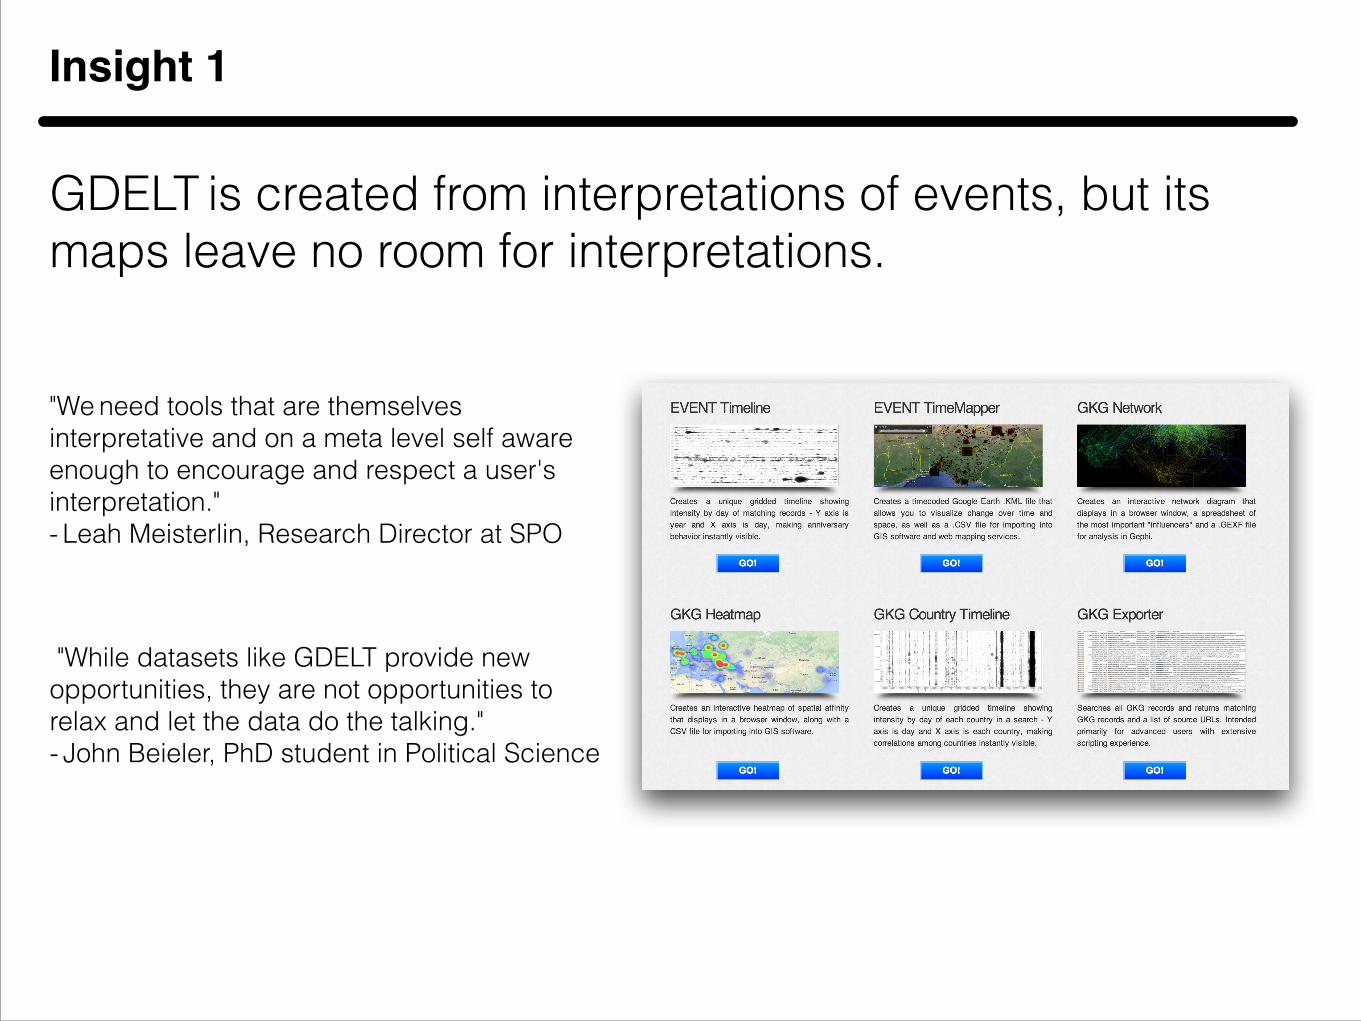
"While datasets like GDELT provide new opportunities, they are not opportunities to relax and let the data do the talking." - John Beieler, PhD student in Political Science
"We need tools that are themselves interpretative and on a meta level self aware enough to encourage and respect a user's interpretation." - Leah Meisterlin, Research Director at SPO
GDELT is created from interpretations of events, but its maps leave no room for interpretations.

Insight 2
Q3 2012Q3 2011 Q1 2013
syria.newscientistapps.com Analysis and graphic by Peter Aldhous; published 13 May 2013. Source: Kalev Leetaru and Philip Schrodt / GDELT
GDELT is composed of lots and lots qualitative data, but it is treated like quantitative information.
Opportunity
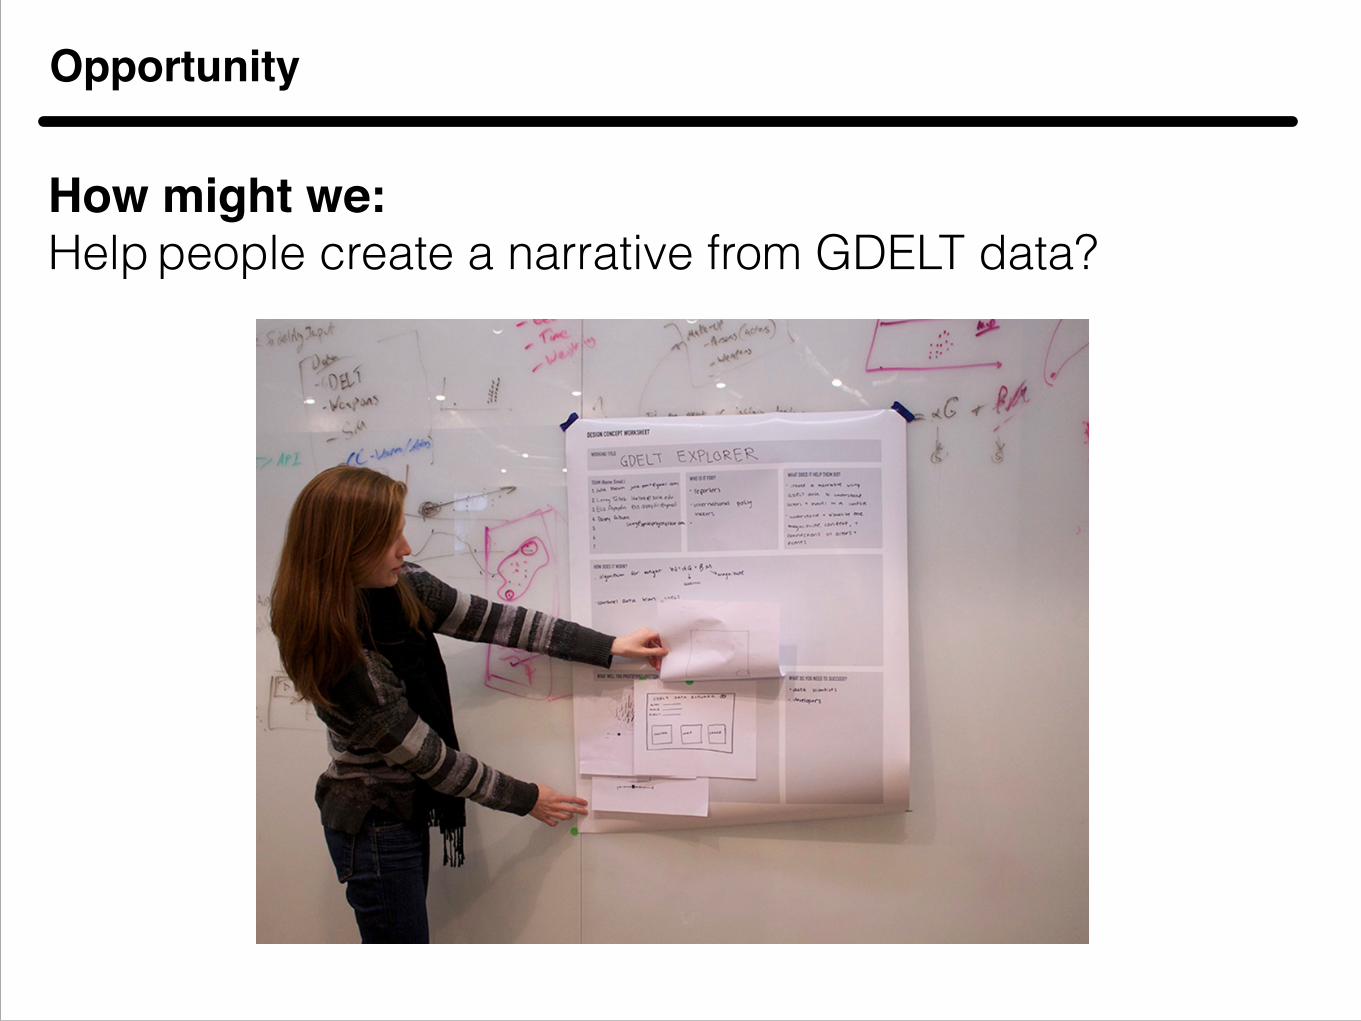
How might we:!Help people create a narrative from GDELT data?

Concept
Key Features:!Allows people to find new usage for data for new questions that arise. It's an accessible platform for user determined data analysis. !A set of possible visualizations that the user can choose from. !Includes social media data. !Provides questions to aid in analysis. !User Value Proposition:!The user can explore the data through relationships that the user determines instead of predetermined by the people putting out the data. !!
GDELT Explorer!A visualization tool that helps a user understand the actors and events in a conflict as well as the magnitude, context, and connections of actors and events.
Concept Development
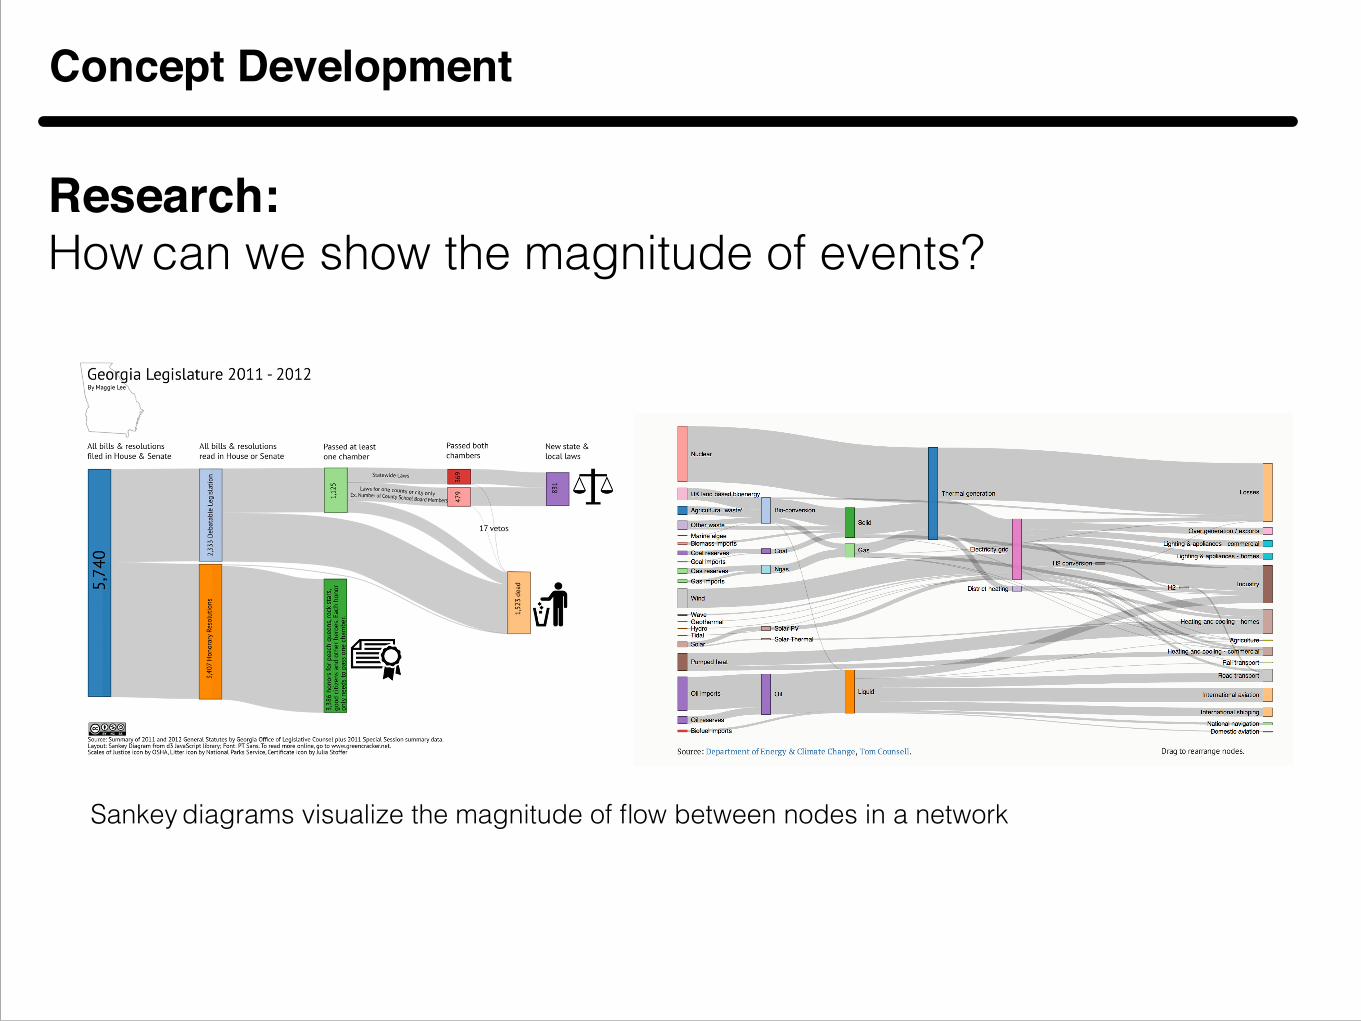
Sankey diagrams visualize the magnitude of flow between nodes in a network
Research:!How can we show the magnitude of events?

Concept Development
Cultural analytics: "Using numbers to describe cultural artifacts allows us to replace discrete categories (words) with continuous descriptions (curves)." - Lev Manovich
Frequency of tags in Obama's weekly address videos
Research:!How can we make sense of qualitative data?

Concept Development
Network visualization: Syria + corruption Greek debt via informationisbeautiful.com
Research:!How can we make networks easier to understand?

Concept Development
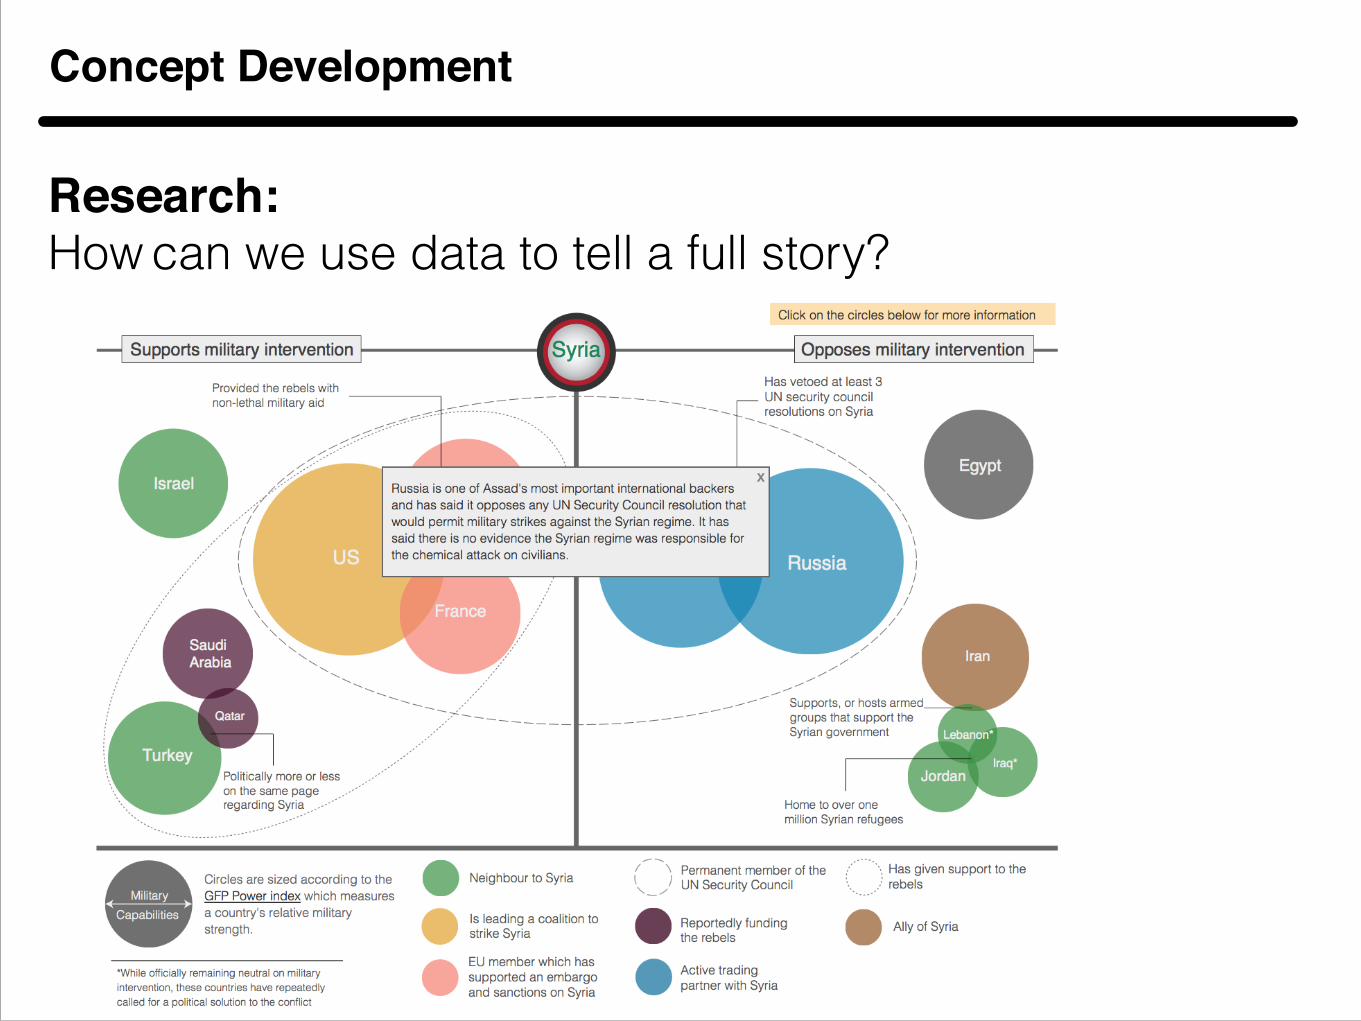
Research:!How can we use data to tell a full story?
Concept Development
Research:!How can we use data to tell a full story?

Concept Development
Research:!How can we use data to tell a full story?

Lessons & Takeaways
!Are the current tools for understanding GDELT clear? !The data needs to be able to communicate to multiple stakeholders who we believe can fundamentally be helpful and create value. !Should anyone be able to understand and interpret information from GDELT, or only professional data scientists and researchers? !Can design benefit the articulation of the situations and stakeholders in Syria? !
GDELT Explorer!
And this is how:!1. Telling better stories 2. Understand the important tropes and semiotics in video footage 3. Prototyping and making things
NO
WE THINK YES
YES


