22/01/2014 1 Making the Water Quality and Health Connection Learning Expectations By the end of this session, you will be able to: 1. Identify common drinking-water contaminants and diseases. 2. Discuss the connection between water quality and health. 3. Explain the difference between improved and safe drinking-water. 4. List the five steps in the multi-barrier approach for safe drinking-water. 2
Transcript
22/01/2014
1
Making the Water Quality and Health Connection
Learning Expectations
By the end of this session, you will be able to:
1. Identify common drinking-water
contaminants and diseases.
2. Discuss the connection between water
quality and health.
3. Explain the difference between improved
and safe drinking-water.
4. List the five steps in the multi-barrier
approach for safe drinking-water.2
22/01/2014
2
3
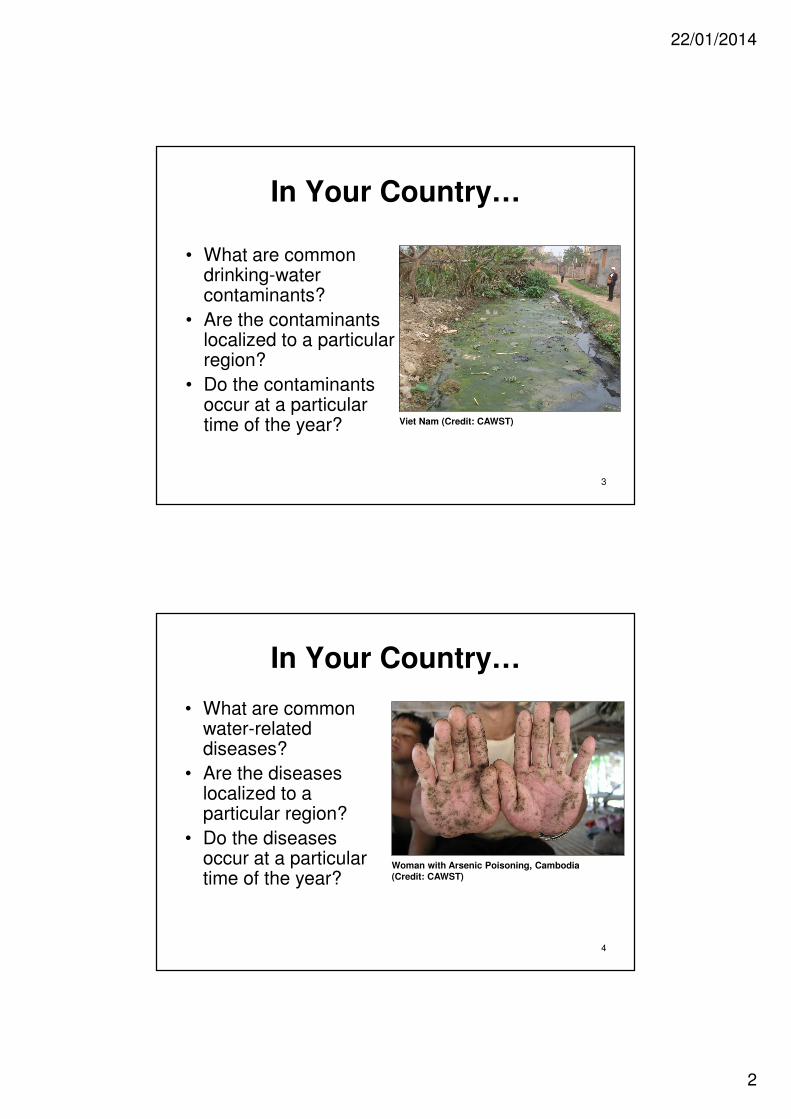
In Your Country…
• What are common drinking-water contaminants?
• Are the contaminants localized to a particular region?
• Do the contaminants occur at a particular time of the year? Viet Nam (Credit: CAWST)
4
In Your Country…
• What are common water-related diseases?
• Are the diseases localized to a particular region?
• Do the diseases occur at a particular time of the year?
Woman with Arsenic Poisoning, Cambodia
(Credit: CAWST)
22/01/2014
3
5
Water Quality
• Biological
– Viruses, bacteria, protozoa, helminths
• Chemical
– Arsenic, fluoride, iron, manganese
• Physical
– Turbidity, colour, taste, smell and temperature
6
Microbiology versus Epidemiology
• Microbiology
– Study of organisms that are too small to be seen with the naked eye
– Bacteria, viruses and protozoa
• Epidemiology
– Study of diseases in populations
– Focuses on groups rather than individuals
– Epidemiologists may use microbiology
22/01/2014
4
7
Biological Contaminants
1. Viruses. Smallest. Require a host cell to
replicate.
2. Bacteria. Most common microorganism.
3. Protozoa. May be able to form cysts that can stay alive without hosts and in harsh environments.
4. Helminths. Worms that derive sustenance at the host’s expense.
8
Size Comparison
Virus (0.02 to 0.2 micron)
Helminth
(40 to 100 microns)
Smallest
Largest
Virus
Bacteria
Protozoa
Helminth
Bacteria (0.2 to 5 microns)
Protozoa
(4 to 20 microns)
22/01/2014
5
9
Viruses
• Water-borne examples: hepatitis A and E• Depend on host cells to replicate
– When stimulated, new viruses are formed and burst out of the host cell, killing it and going on to infect other cells.
• Some viruses can remain viable outside of a host for long periods, also in dry conditions.
Hepatitis A
10
Bacteria
• Water-borne examples: cholera, typhoid
• Most common in the environment
• Abundant in faeces• 1 gram of faeces = billions of bacteria
• Able to form cysts that allow them stay alive without a host and survive in harsh environments.
Electron microscope image of a single Cryptosporidium oocyst
(Credit: Australian Flow Cytometry Group
and Macquarie University)
12
Helminths• Examples: guinea worm, schistosomiasis
(bilharzia)
• Can live for many years in the host
• Most do not multiply within the host
• Weaken the host by using its food supply
• Most helminths are passed in faeces
Electron microscope image of a pair of Schistosoma mansoni
(Credit: Davies Laboratory, Uniformed Services
University)
22/01/2014
7
13
Major Water-Borne Diseases Caused by Pathogens
• Diarrhoea
– Bacteria, virus or protozoa
• Cholera
– Bacteria
• Typhoid
– Bacteria
• Hepatitis
– Virus
Cambodia (Credit: Thanh)
14
Epidemiology of Diarrhoeal Disease
• Leading position among infectious
diseases as a cause of death and illness
in children under 5
– 4 billion global cases each year
– 1.8 million global deaths each year
– Over 600 000 deaths each year in South-East Asia
– Add country specific information
22/01/2014
8
3963
1566
611
1272
1798
2777
0
500
1000
1500
2000
2500
3000
3500
4000
4500
Respiratory
infection
HIV/AIDS Diarrhoeal
disease
Tuberculosis Malaria Measles
Death
s (
tho
usan
ds)
15
Leading Causes of Deaths from Infectious Diseases
(Credit: WHO, 2004)
16
Children Suffer the Most
• Majority of deaths are children under 5
• Chronic diarrhoea leads to malnutrition as nutrients cannot be absorbed
• Retards children’s growth and development
• Water-related illness causes the loss of 443 million school days each year (UNDP, 2006)
Laos (Credit: Lost Girls, 2007)
22/01/2014
9
Preventing Diarrhoea
• 94% of cases are preventable (WHO, 2007)
– Increase quantity, quality and access to safe water
– Improve hygiene and sanitation
• Review by Fewtrell et al. (2005) concluded that diarrhoeal cases can be reduced by
– 25% through improved water supply
– 39% through HWTS
• Review by Clasen et al. (2006) confirmed that HWT could reduce diarrhoeal cases by 47%
– Some studies showed 70% or greater reductions
17
18
Chemical Contaminants
• Arsenic
• Nitrates and nitrites
• Iron
• Manganese
• Total dissolved solids
22/01/2014
10
19
Arsenic
• Most toxic of the relatively common chemicals in found in drinking-water
“ The impact of arsenic in drinking-water on this large population is without precedent for environmental causes of human cancer, and it points to the public health priority of ensuring that arsenic concentrations in drinking-water are controlled worldwide.”
(Fifty-Year Study of Lung and Bladder Cancer Mortality in Chile Related to Arsenic in Drinking Water, Journal of the National Cancer Institute, 2007)
20
22/01/2014
11
21
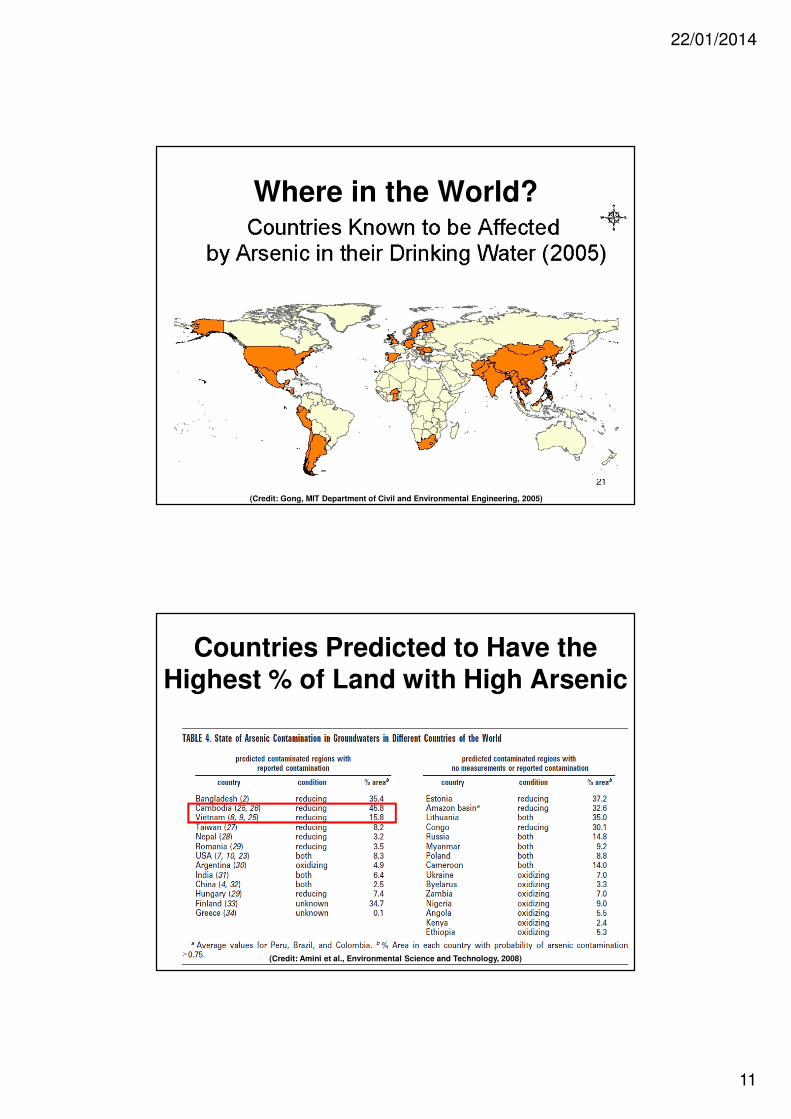
Where in the World?
(Credit: Gong, MIT Department of Civil and Environmental Engineering, 2005)
22
Countries Predicted to Have the Highest % of Land with High Arsenic
(Credit: Amini et al., Environmental Science and Technology, 2008)
22/01/2014
12
23
Characteristics in Ground Water
• Naturally occurring
• Odorless, tasteless, colourless
– There is only one way to tell if present – TESTING
– Levels can vary significantly from one well to another, even if close by
• Present in many different conditions: wet, dry
• WHO considers arsenic to be a high priority for testing in water sources Arsenic Contaminated Well
(Credit: World Bank, 2005)
24
Preventing Arsenicosis
• Currently no effective cure for arsenic poisoning– Health effects may be
reversed in the early stages by removing the exposure to arsenic
• Only prevention is to drink water that has safe levels of arsenic
• Some HWT options are able to remove arsenic from water to safe levels
Arsenic Poisoning, Cambodia
(Credit: CAWST)
22/01/2014
13
25
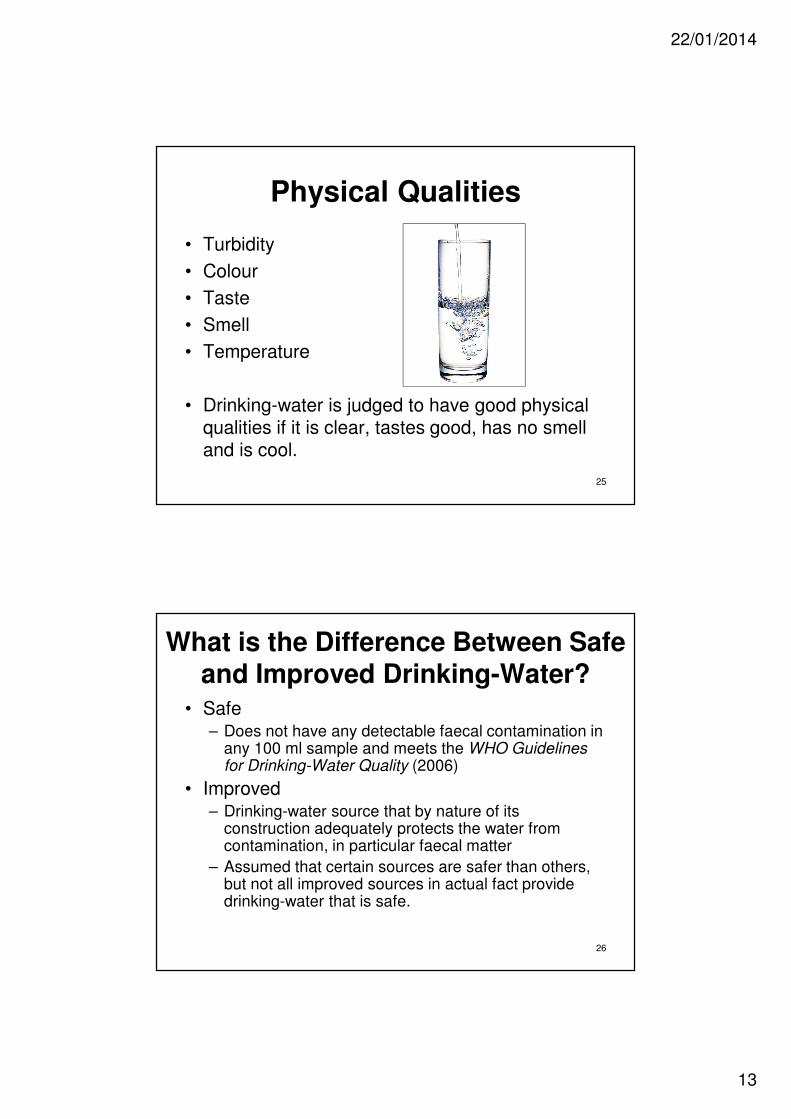
Physical Qualities
• Turbidity
• Colour
• Taste
• Smell
• Temperature
• Drinking-water is judged to have good physical qualities if it is clear, tastes good, has no smell and is cool.
26
What is the Difference Between Safe and Improved Drinking-Water?
• Safe– Does not have any detectable faecal contamination in
any 100 ml sample and meets the WHO Guidelines for Drinking-Water Quality (2006)
• Improved – Drinking-water source that by nature of its
construction adequately protects the water from contamination, in particular faecal matter
– Assumed that certain sources are safer than others, but not all improved sources in actual fact provide drinking-water that is safe.
• Is a practice or process– Specific technologies are generally directed to
one stage of the process
• Both community and household systems follow the same basic process– Sedimentation to remove larger particles and
often >50% of pathogens
– Filtration to remove smaller particles and often >90% of pathogens
– Disinfection to remove, deactivate or kill any remaining pathogens
30
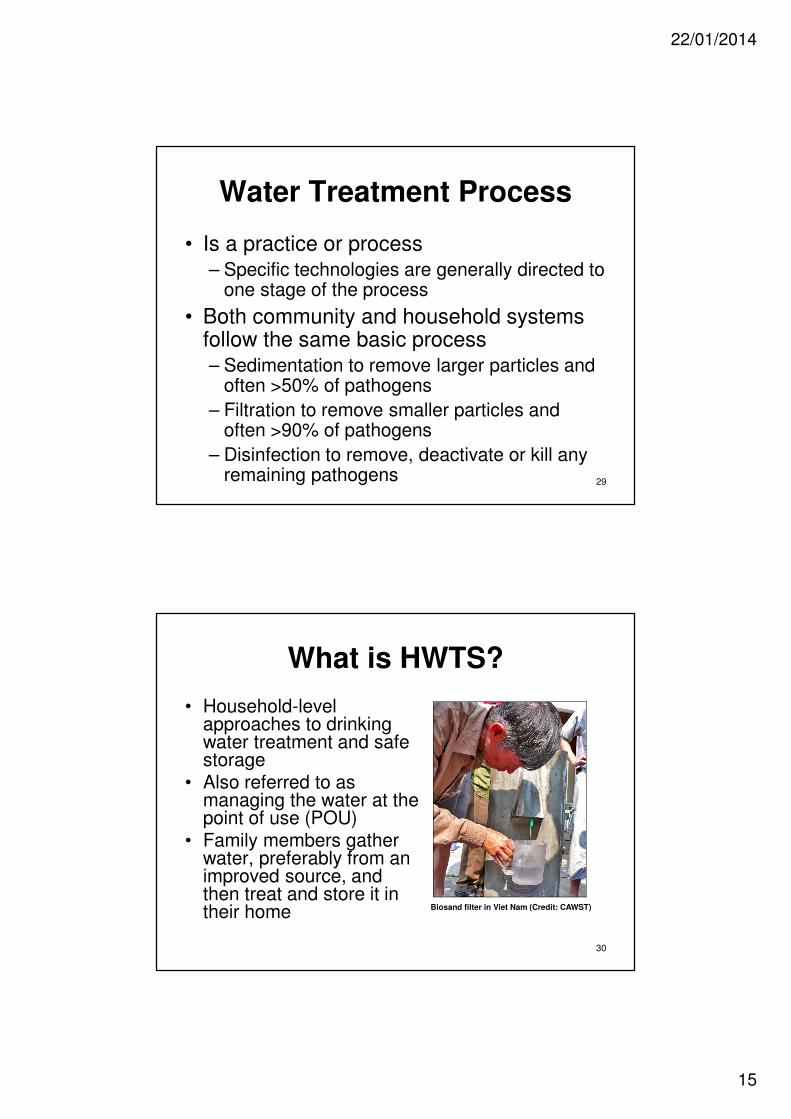
What is HWTS?
• Household-level approaches to drinking water treatment and safe storage
• Also referred to as managing the water at the point of use (POU)
• Family members gather water, preferably from an improved source, and then treat and store it in their home Biosand filter in Viet Nam (Credit: CAWST)