46
Port Weller Dry Docks Making Waves A PROFILE OF CAREER OPPORTUNITIES IN NIAGARA’S MARINE SECTOR

Port Weller Dry Docks
MakingWavesA PROFILE OFCAREEROPPORTUNITIESIN NIAGARA’SMARINESECTOR


MakingWavesA profile ofcareer opportunitiesin Niagara’smarine sector
In partnership with and funded by
Port WellerDry Docks
ii
Research conducted by:
Duncan MacDuff and Carole GarrettWorkplace Learning, Ventures DivisionGlendale Campus, 135 Taylor Road, R.R. #4Niagara-on-the-Lake, Ontario, L0S 1J0
Phone: (905) 641-2252Fax: (905) 988-4303Email: [email protected]
Industry Advisory Group Members:
Randy Chamberlain,Algoma Central Marine
Ross Serianni,Port Weller Dry Docks
Ian Fielding,Hamilton Marine
Mario Elrick,Canadian Marine Officers’ Union
Bill Ross,Seafarers’ International Union of Canada
David Brown,International Brotherhood of Boilermakers,Iron Ship Builders,Blacksmiths, Forgers, and Helpers
Resource Advisory Group Members:
John Marchio,HRDC
Bob Birrell,Niagara College
Marti Jurmain,Niagara College
We would like to recognize the gracious and candid participation of allthe employers and union members who ‘made’ the time and effort to sharetheir organizational and individual challenges with us. Clearly onlythrough their involvement can we begin to develop a more validunderstanding of Niagara’s evolving marine industry and its emergentjobs and training requirements. The assistance and guidance provided byHRDC and the CSA is also gratefully appreciated. And, finally we wouldalso like to express an appreciation for the leadership and projectinitiation work of Randy Chamberlain, Bob Birrell, and John Marchio.
July, 2000
Designed by Niagara College Marketing & Communications Department
Printed in Canada

iii
CCCCCONTENTSFOREWORD ....................................................................... v
REPORT OVERVIEW ........................................................ 1
Introduction ......................................................................... 2
Summary of Findings ........................................................... 3
Study Outcomes ................................................................... 7
Study Methodology .............................................................. 8
SECTOR PROFILE ........................................................... 11
Employer Sample Profile ...................................................11
Industry Structure .............................................................. 13
Occupational Certification ................................................14
National & International Context ....................................15
Industry Competitiveness Issues .......................................18
EMPLOYMENT & TRAINING NEEDS .......................... 19
Employment Demand ........................................................ 19
Upgrading Intentions .........................................................23
Upgrading Issues ...............................................................26
Labour Supply .................................................................... 29
Recruitment Challenges ....................................................32
REFLECTIONS & RECOMMENDATIONS ...................35
Implications & Caveats for Niagara ..................................35
Recommendations for Further Action ..............................36
APPENDICES
Appendix A – Occupational Profiles
Appendix B – Structured Employer Interview
Appendix C – Union Member Questionnaires
Appendix D – Training Institute Survey
Appendix E – List of Participating Employers,Unions, and Training Institutes
Appendix F – References
Appendix G – Communique

iv
CHARTS AND TCHARTS AND TCHARTS AND TCHARTS AND TCHARTS AND TABLESABLESABLESABLESABLES
CHART 1: Employer Sample by Number of Employees .... 3
CHART 2: Projected Jobs by Occupation ........................... 4
CHART 3: Wage by Occupation ......................................... 5
CHART 4: Employer Sample by Number of Employees ..11
CHART 5: Vessel Types ..................................................... 12
TABLE 1: Fleet Breakdown ............................................... 13
TABLE 2: Officer Classifications ....................................... 14
TABLE 3: Ten Year Profile, Fleet and Cargo Volumes .....15
CHART 6: Projected Jobs, 2000-2010 .............................. 19
CHART 7: Projected Jobs by Occupation .........................20
TABLE 4: Age Breakdown by Occupation ........................ 21
CHART 8: Wage by Occupation ....................................... 21
CHART 9: Recruitment Difficulty by Occupation ............ 22
CHART 10: Union Member Respondent Age Profile .......23
CHART 11: Work Profile .................................................. 25
CHART 12: Occupational Profile ...................................... 24
CHART 13: Education Attainment ................................... 25
CHART 14: Geographic Distribution ...............................25
TABLE 5: Potential Uprading Barriers .............................. 26
TABLE 6: New Certifications– 1998-1999 ....................... 29
TABLE 7: Graduate Forecast ............................................. 30
CHART 15: Engineering Grads –Supply vs. Demand ......31
CHART 16: Navigation Grads –Supply vs. Demand ........ 31

v
1Economic Impact of the Marine Industryon the Niagara Region, Dr. Lewis Sorokaand Indra Hardeen, Brock Centre for Socialand Economic Research on Niagara, 1998.
FOREWORDDuring my interviews with industry employers, one employer referred to the marineindustry as the silent mode of transport. It struck me then, as it does now, that he hadrevealed a tenet deeply entrenched in the mindset of many Niagara residents and in allprobability, Ontario residents in general. Working frequently out of sight and sound, 225-metre vessels sail through the Welland Canal, quietly transporting the equivalent load of1000 trucks, only to slip silently into the horizon of Lake Ontario or Lake Erie. The bulkersand self-unloaders, and the tankers and tugs lay low and largely out-of-sight January throughMarch, as seasoned trades’ hands ready them for their next shipping season. Sure, we knowthey’re out there when we’re inconvenienced by a raised bridge. We also know the nationalindustry has weathered two decades of decline. For the Great Lakes fleets this has meantshrinking cargoes, fewer ships, and smaller crews. For the builders and repairers, twodecades of declining work have taken their toll through closings, frequent layoffs, andprecarious futures. These have all been reported. These we are conscious of.
Less conscious publicly is Niagara’s 170-year history in the marine industry, an industrythat affords us the safest, most cost-efficient and environmentally- friendly mode of bulktransport. Niagara’s marine industry, home to Ontario’s biggest marine centre, employs over2,100 people at wages that are 60% higher than the Regional average, and annuallycontributes $158 million1 in direct spending to the Regional economy. The silence of theindustry is particularly salient for Niagara. It’s time to raise our collective consciousness.
Canadians in search of an industry and a career that promises a stable, meaningful, andrewarding future are constantly bombarded by the newer, sexier sectors, such as informationtechnology and microelectronics. In Niagara specifically, the ‘cleaner’ tourism and call centresectors have claimed more airtime of recent. The old industries are dead. Think again!
As with many of Niagara’s ‘grey’ industries, such as auto parts manufacturing, the marinesector is facing significant labour force challenges. Throughout the past decade investments innew technology have enhanced productivity and environmental performance. It’s now time forinvestments in people. Marine industry employers in Niagara and vicinity are facing acuteshortages of qualified labour. With over 1,300 jobs projected over the next ten years, and a$50,500 average salary across the top nine occupations, their challenge is Niagara’s opportunity.
Over the past six months I’ve had the chance to peek into this historic and distinctindustry, to reflect upon my assumptions and revise my beliefs, and assess its potential forNiagara. Through this report I will share our understanding of the needs and challengesfacing this industry, and present for your consideration its unique opportunities. It’s time tomake waves.
– Duncan MacDuffStudy Co-ordinator,Niagara College


Making Waves… a profile of career opportunities in Niagara’s Marine Sector REPORT OVERVIEW
1
This report is divided into four sections.
The first section, entitled Report Overview includes anintroduction to the report, a summary of the overall findingsand a discussion of its recommendations. Study outcomes andmethodology are also outlined here.
Following, in the section entitled Sector Profile, thesample is profiled. As well, background information aboutthe industry structure, occupational certificationrequirements, and the industry’s national and internationalcontexts are presented. A brief review of the competitivenessof the Great Lakes/St. Lawrence Seaway system, an importantcontextual backdrop to the industry’s employment andtraining needs, closes out this section.
Next is a presentation of the industry’s Employment& Training Needs, with a focus upon the projectedemployment demands, and upgrading intentions and issuesfor current mariners. In this section we also consider cadetsupply issues through the present training institutes, and therecruitment challenges facing industry employers andtraining institutions.
Finally, in the fourth and final section, entitled Reflections& Recommendations we try to synthesize the implicationsand caveats for Niagara, and propose specific strategies forfurther action. The Appendices (A through G) house sevensets of resource materials, including copies of the each of thefollowing elements:
A- Occupational Profiles;B- Structured Employer Interview;C- Union Member Questionnaires;D- Training Institute SurveyE- List of Participating Employers, Unions,
and Training Institutes;F- References;G- Communiqué.
Rep
ort
Ove
rvie
w

Making Waves… a profile of career opportunities in Niagara’s Marine SectorREPORT OVERVIEW
2
INTRODUCTIONMarine industry employers in the Niagara Region met withNiagara College on a number of occasions over a 10 monthperiod leading up to the summer of 1999, as individualcompanies and as a sector. They expressed concerns overemployment and training issues for their rapidly evolvingindustry. Employers from both the shipbuilding and repairindustry and the shipping industry called for an extensiveinvestigation of the key employment and training issues facingthe sector over the next five to ten years. They were concernedthat a major portion of their present workforce would retireover the next 5-10 years. However, their evidence wasprimarily individual employer-based, and anecdotal. Theyasked for a comprehensive sector-wide investigation.
Sector employers also cited their interest in partneringwith an educational institution that could provide practicaland marine specific skills training in a timely and cost-effective manner. They in addition, indicated their preferencefor a local partner to provide them with a marine specific,Canadian-based labour pool.
Niagara College was asked by industry representatives toco-ordinate a study of the employment and training needs ofthe Regional marine industry, albeit within the context of theGreat Lakes/St. Lawrence Seaway system. Human ResourcesDevelopment Canada, encouraged by a recent economicimpact study by Brock University, agreed to partner withindustry employers, the Canadian Shipowners Associationand Niagara College. Subsequent discussions with localrepresentatives from the Canadian Marine Officers’ Union(CMOU), Seafarers’ International Union of Canada (SIU), theCanadian Merchant Service Guild (CMSG), and InternationalBrotherhood of Boilermakers, Iron Ship Builders,Blacksmiths, Forgers and Helpers brought four of the mostpivotal industry unions in to the study. An Advisory Groupwas set up, in late November 1999, to guide the study, whichessentially ran January through to May, 2000.

Making Waves… a profile of career opportunities in Niagara’s Marine Sector REPORT OVERVIEW
3
SUMMARY OF FINDINGSMaking Waves presents the key forces, issues, andcorresponding employment and training opportunities,facing Niagara’s marine industry, to the year 2010.Employment totals for the employer sample are in excessof 4000 people2, and represent over 90% of the Region’smarine-related employment and 66% of the CSA3 fleet.
Twenty-three (23) employers, 267 mariners from fourunions, and representatives from 4 training institutionsparticipated in this study. Mariner and training instituteparticipants reside principally in eastern Canada. Theemployer sample includes a broad range of employers. Fortyper cent (40%) have a unionized workforce. Seven (7) SIC4
codes are represented, with the majority of employers fallinginto the shipbuilding and repair and freight & passenger watertransport sub-sectors. Their number of employees is alsovaried.
Chart 15 illustrates the employer sample by the number ofemployees.
2 Given the distinct mobility of the sector,projections from organizations thatemploy Niagara-based mariners but whosehead offices are located elsewhere inOntario/Canada are included in the study.
3 Canadian Shipowners Association (CSA).
4 Standard Industrial Classification (SIC).
5 A third employer was in the 101-150category, but is presently in receivership.Their data has been excluded from thefindings.
CHART 1:
Employer Sampleby Number of Employees

Making Waves… a profile of career opportunities in Niagara’s Marine SectorREPORT OVERVIEW
4
Participants cited four crucial and very interdependentlabour force issues. Briefly outlined below, they include thefollowing issues:
• an ageing workforce with significant replacement needs
• increasing cross-sector competition for skilled workers
• a lack of accessible training, and
• a lack of effective recruitment of new employees into themarine industry.
In excess of 1,300 jobs are projected to arise over the nextten years. Approximately 760 of these will occur before 2005.And fully 73% of these will arise through the need to replaceretiring personnel. Over 98% of the projected jobs are forfull-time work, with the majority tied to the shipping season.Nine (9) occupations account for ¾ of the projected jobs.Chart 2 illustrates the number of jobs projected by sampleparticipants within each of the 9 leading occupations.
CHART 2:
Projected Jobs by Occupation

Making Waves… a profile of career opportunities in Niagara’s Marine Sector REPORT OVERVIEW
5
The salary range across all of the projected occupations isfrom $30,000 to $95,800 with an average, across the top 9projected jobs, of $50,500, an astounding 100% above theRegional average. Chart 3 shows the average annual incomeby occupation.
The challenge to replace a sizeable chunk of the marineworkforce is exacerbated by the increasing cross-sectorcompetition for skilled workers. Many Regional employers6,including manufacturing and construction companies, havealready identified their need to replace significant numbers oftheir workforces over the next five years.
The capacity to replace senior officers is further compoundedby the lengthy and developmental learning process. A minimumof 8-10 years of combined sea service and applied education isneeded to become a qualified Master Mariner or a 1st ClassEngineer. Although an impressive 60% of the sample’s officerrespondents expressed an interest in upgrading theirclassifications, they also cited several training barriers toadvancing their careers. The three most cited barriers include alack of time to do the courses with limited ‘off-time’, expensivecourse fees, and high travel costs/time to training locations.
CHART 3:
Wage by Occupation
6 Work in Niagara 1999-2003 –A Profile of sectoral and occupationalopportunities, April 1999.

Making Waves… a profile of career opportunities in Niagara’s Marine SectorREPORT OVERVIEW
6
Additional ‘supply’ issues are exposed through therelatively small number of projected cadet graduates, and theindustry’s lack of employment equity. The significantinternational demand for officers while extending the rangeof jobs for junior and senior officers, simultaneouslycompounds the replacement challenges facing the GreatLakes fleets.
Industries operating in the Great Lakes – St. Lawrencewaterway contribute billions of dollars and thousands of jobsto the Canadian economy. They have played, and willcontinue to play, an essential role in the efficient and effectivetransportation of bulk goods. Working diligently withgovernments and other stakeholders, industry employers andassociations are developing partnerships to address anythreats to their competitiveness, including an ageing fleet,which will soon require significant investment ininfrastructure and shipbuilding.
In the more public domain the marine industry needs toalso flaunt its environmental leadership. Vessel transport onthe Great Lakes and St. Lawrence River is safer, uses less fuel,and produces less air and noise pollution than carriage byroad, rail or air7.
A skilled and ready labour force is critical to the success ofthe marine industry as it evolves over the next ten years. Thisstudy is intended to help the sector meet its workforce needsand sustain its significant contribution the Regional economyby illustrating the significant number of jobs available toindividuals willing to and capable of flowing with theindustry’s unique tide.
7 A Competitive Vision for the Great Lakes -St. Lawrence Waterway, CSA, 1997.

Making Waves… a profile of career opportunities in Niagara’s Marine Sector REPORT OVERVIEW
7
STUDY OUTCOMESThe marine sector employment and training needs study wasdesigned to assist in reducing future skill shortages and tocontribute to the long-term vitality of the marine industry in theNiagara Region. Two broad phases were carried out. Phase Oneinvolved an assessment of the challenges facing the Niagara andarea marine industry and its corresponding jobs / issues andtraining requirements. Phase Two focused upon a review ofexisting marine training programs, including an assessment oftheir capacity to meet the sector’s present and projected needs.
Deliverables specific to Phase One include the following items:
• A comprehensive understanding of the key issues affectingthe sector;
• Trends analysis of the utilization of technology withrespect to occupations in the marine sector and theirimplications in terms of future skill requirements;
• An employment profile of the number and types ofindividuals employed in the Regional sector, and anunderstanding of the issues affecting the immediate andfuture labour supply for the sector;
• An analysis of additional human resource issues facing theRegional marine sector;
• Occupational profiles of key jobs; and• The provision of both ‘hard’ and ‘disk’ copies of the
complete study to the Advisory Committee and HumanResources Development Canada.
Deliverables specific to Phase II include the following items:
• An inventory of current marine training programs;• A concise picture of the sector’s training / education
delivery requirements over the next ten years; and• An assessment of the capacity of existing marine training
programs to meet the sector’s present and projected needs.
To ensure that we had acquired a comprehensiveunderstanding of the industries’ employment and trainingneeds, over 90% of the Regional sector was consulted. TheAdvisory Group met on four occasions through the life of thestudy to clarify specific study parameters; assist with theimplementation of the study; to monitor its validity andutility; and ensure sustained progress. Human ResourcesDevelopment Canada (HRDC); the Canadian ShipownersAssociation (CSA); industry employers; and three union/association locals (CMOU, SIU, and the Boilermakers) haveall endorsed the recommendations of the study.

Making Waves… a profile of career opportunities in Niagara’s Marine SectorREPORT OVERVIEW
8
STUDY METHODOLOGYSix complementary research stages were conducted. The arebriefly outlined, essentially chronologically, below.
Stage 1 – Partnership and CollaborationA Marine Advisory Group worked with Niagara College andHuman Resources Development Canada to clarify and refinespecific study parameters and monitor the validity and utilityof the study. Ongoing collaboration through the entire life ofthe study ensured consistency of interpretation and sustainedprogress.
Stage 2 – Process DesignStage 2 included a review and confirmation of theinformation needs and priority issues; the verification andrefinement of study outcomes; and the design of the researchprocess. Preliminary research initiatives consisted of firsthand discussions with selected leaders from the industry,government, and trainers / educators; and a literature reviewof related studies, demographic profiles and trainingproviders / programs.
Stage 3 – DevelopmentThis stage encompassed the creation of research instruments,sampling strategies and procedures, and communicationstrategies and tools. Four complementary research methodswere used. They are listed below, sequentially, reflecting theorder in which they were implemented.
• Review and Content Analysis of an extensive set ofsecondary data sources and materials ranging from thelocal to the international scene; and from individualoccupations to the broad implications for change in thefuture design and structure of marine-related work. Thismethod helped to establish the dominant issues, trendsand opportunities, demographic and vessel profile data,and context for local needs.
• Interviews with Regional & Area Employers/UnionRepresentatives were designed to gather detailed, employer,union, and occupational-specific employment and trainingneeds and projections; and to widen and buildcommitment to the study and its recommendations.
• Questionnaires administered to Union Members and TrainingInstitutions were intended to do two crucial things: to helpclarify and localize issues, trends and opportunities; and tostimulate commitment to the study and its recommendations.

Making Waves… a profile of career opportunities in Niagara’s Marine Sector REPORT OVERVIEW
9
Stage 4 – Data CollectionThe Data Collection Stage involved the collection of both thesecondary and primary data, and the compilation andprocessing of the data. In total, over 25 studies/reports werereviewed, and 23 employers and 3 unions participated ininterviews. In addition, 4 training institutes and 267 unionmembers responded to questionnaires.
Stage 5 – Data AnalysisThis stage involved the analysis of the various data sourcesand a synthesis of all of the data sources. It also includes thepreparation of a complete report and appendices related toboth phases of the study.
Stage 6 – Dissemination and CommitmentDuring this stage the findings of the study will becommunicated to the community partners (e.g. industry,educators and government) with the aim of promotingmeaningful, community-wide commitment to act upon therecommendations. Short summary communiqués will also beshared with sample participants and community partners.

Making Waves… a profile of career opportunities in Niagara’s Marine SectorREPORT OVERVIEW
10
Making Waves… a profile of career opportunities in Niagara’s Marine Sector SECTOR PROFILE
11
This section focuses upon four sector-related matters. First, itincludes a profile of the employer sample. A profile of themariner respondents is provided in the section entitledUpgrading Intentions. Following the employer sample profileis a brief description of the industry structure, its nationaland international context, and other issues challenging thecompetitiveness of the Great Lakes – St. Lawrence Waterwaysystem.
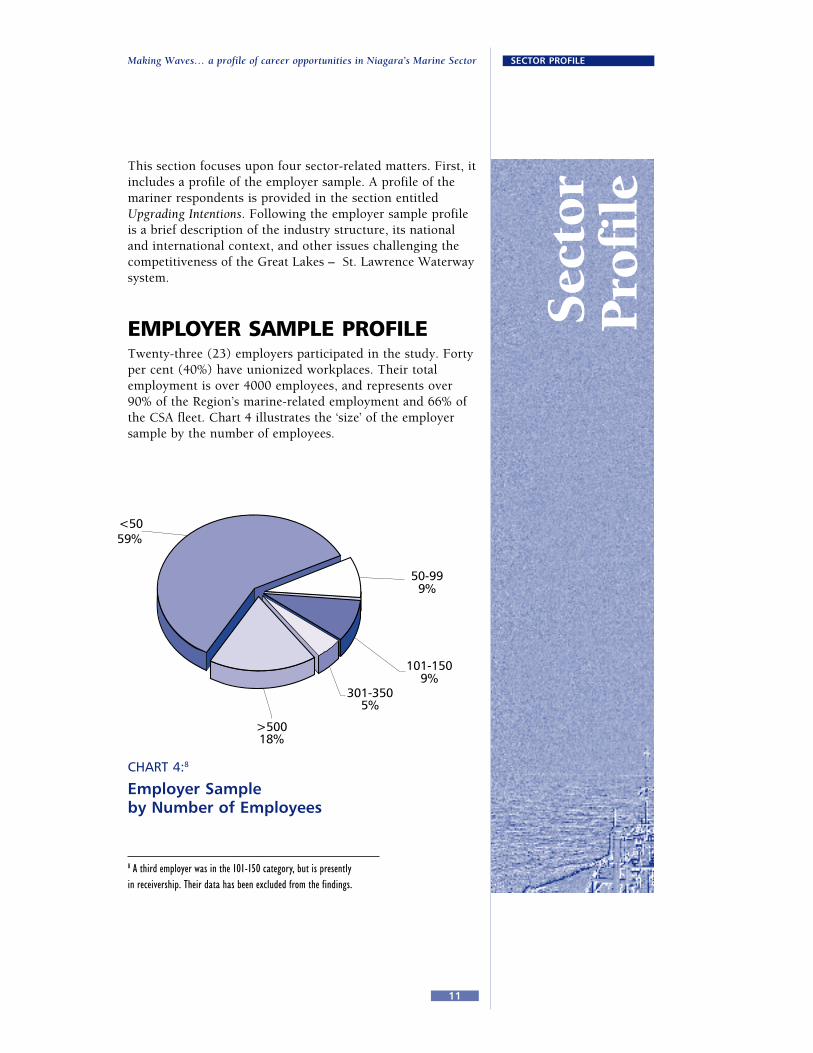
EMPLOYER SAMPLE PROFILETwenty-three (23) employers participated in the study. Fortyper cent (40%) have unionized workplaces. Their totalemployment is over 4000 employees, and represents over90% of the Region’s marine-related employment and 66% ofthe CSA fleet. Chart 4 illustrates the ‘size’ of the employersample by the number of employees.
Sec
tor
Pro
file
CHART 4:8
Employer Sampleby Number of Employees
8 A third employer was in the 101-150 category, but is presentlyin receivership. Their data has been excluded from the findings.

Making Waves… a profile of career opportunities in Niagara’s Marine SectorSECTOR PROFILE
12
The representation of the employer sample can also beconsidered by looking at the collective number of vesselsoperated by sample participants. Chart 5 shows the type andnumber of vessels operated by sample participants.
CHART 5:
Vessel Types

Making Waves… a profile of career opportunities in Niagara’s Marine Sector SECTOR PROFILE
13
INDUSTRY STRUCTUREIndustry structure typically refers to the nature of the workperformed by a business. We have chosen to use Canada’sStandard Industrial Classification codes as an initialreference, to divide the marine industry into the nature of theservice/manufacturing work performed by each business. Thisstudy includes employers from each of the followingclassifications:
• Shipbuilding and Repair – 11 participants• Freight and Passenger Water Transport – 4 participants• Marine Towing – 1 participant• Marine Cargo Handling – 2 participants• Harbour & Port Operation – 1 participant• Marine Salvage – 1 participant• Other Service Industries incidental to water transport – 3
participants.
The classifications most crucial to this study include shipbuild-ing and repair, freight transport, and marine towing. Thestructure and composition of each of these is outlined below.
Shipbuilding and RepairWithin the Great Lakes Region, Port Weller Dry Docks, inSt. Catharines, is the only Canadian shipyard capable ofbuilding ships; and they are recognized as a world leader inself-unloader technology. There are more than a dozensmaller companies involved in ship repair throughout theNiagara and Hamilton Regions, which represents one of thegreatest concentrations in the country9.
Freight Transport & Marine TowingFor the nature of this study it is crucial that we also considerthe type and size of the Canadian-domiciled Great Lakesfleet, as it is the foundation to Niagara’s marine interests.Fleet information also allows us to estimate the totalemployment across this segment of the sector. The Canadian-domiciled Great Lakes merchant fleet includes:• 34 – Bulkers
• 34 – Self-unloaders
• 12 – Tankers, and
• 15 – Tugs10.
The primary cargoes transported by the above vesselsinclude salt, petroleum, iron ore, coal, limestone, and grain.
9 Canadian Industry Statistics cite 39establishments involved in shipbuildingand repair across Canada.Source: Strategis, 1997
10 Greenwood’s Guide to Great LakesShipping, John O. Greenwood, 1999
Seven Canadian-flag ship companies
whose ships ply the waters of the Great
Lakes – St. Lawrence Waterway system
own the majority of the these 95 ships.
Over 60% of the bulkers, self-unloaders,
and tankers are concentrated within
two shipping companies. Table 1, below
shows the fleet breakdown by company.
TABLE 1
Algoma Central 9 14 5
AcromaritCanada-CSL 1 11
GroupeDesganes Inc. 3 2 3
N.M. Paterson& Sons Ltd. 7
McKeil MarineLimited 15
P & H Shipping 2
Upper LakesGroup Inc. 12 9
BULK
ERSU TA
NKER
TUGS
OTHE
R
Making Waves… a profile of career opportunities in Niagara’s Marine SectorSECTOR PROFILE
14
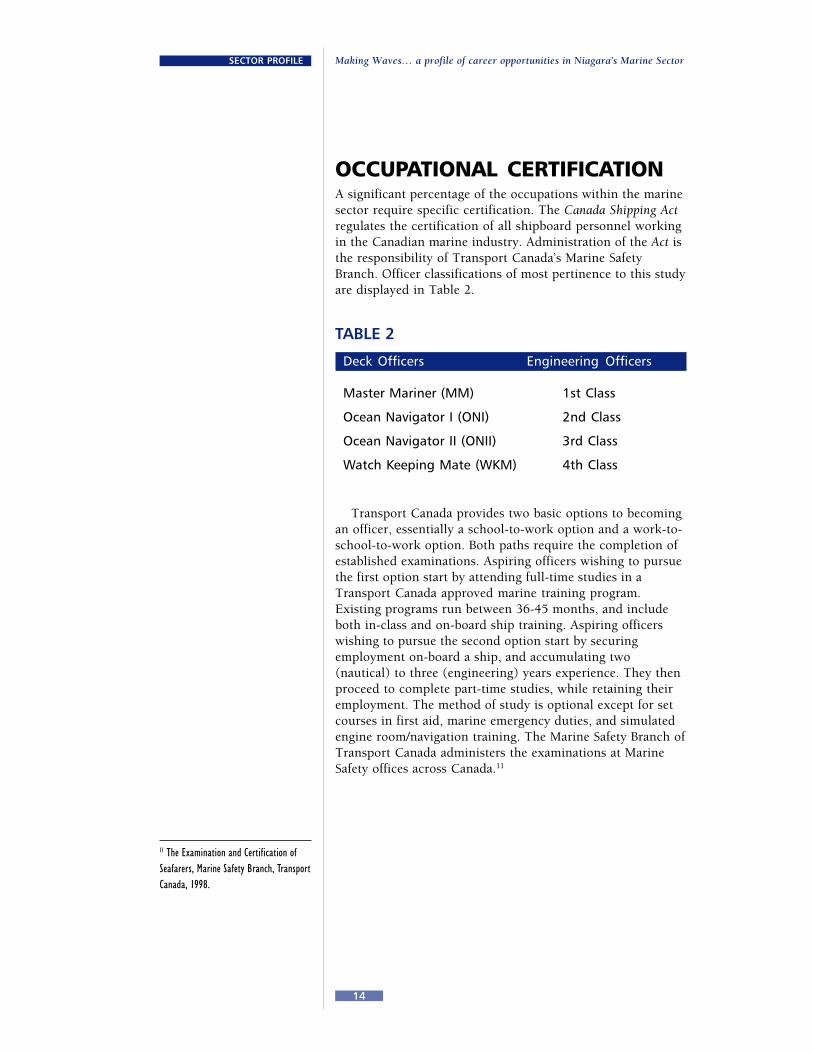
OCCUPATIONAL CERTIFICATIONA significant percentage of the occupations within the marinesector require specific certification. The Canada Shipping Actregulates the certification of all shipboard personnel workingin the Canadian marine industry. Administration of the Act isthe responsibility of Transport Canada’s Marine SafetyBranch. Officer classifications of most pertinence to this studyare displayed in Table 2.
TABLE 2
Deck Officers Engineering Officers
Master Mariner (MM) 1st Class
Ocean Navigator I (ONI) 2nd Class
Ocean Navigator II (ONII) 3rd Class
Watch Keeping Mate (WKM) 4th Class
Transport Canada provides two basic options to becomingan officer, essentially a school-to-work option and a work-to-school-to-work option. Both paths require the completion ofestablished examinations. Aspiring officers wishing to pursuethe first option start by attending full-time studies in aTransport Canada approved marine training program.Existing programs run between 36-45 months, and includeboth in-class and on-board ship training. Aspiring officerswishing to pursue the second option start by securingemployment on-board a ship, and accumulating two(nautical) to three (engineering) years experience. They thenproceed to complete part-time studies, while retaining theiremployment. The method of study is optional except for setcourses in first aid, marine emergency duties, and simulatedengine room/navigation training. The Marine Safety Branch ofTransport Canada administers the examinations at MarineSafety offices across Canada.11
11 The Examination and Certification ofSeafarers, Marine Safety Branch, TransportCanada, 1998.

Making Waves… a profile of career opportunities in Niagara’s Marine Sector SECTOR PROFILE
15
NATIONAL & INTERNATIONALCONTEXTSThe primary focus of this study considers the NiagaraRegion and its Welland Canal within the context of theGreat Lakes – St. Lawrence Waterway system. The globalnature of the industry necessitate that we also review andconsider the needs of Niagara’s marine industry within theirbroader national and international contexts. Each of thesecontextual rings is touched upon below.
The Welland CanalAt 170 years of age the Welland Canal has been significantlyexpanded since the schooner Annie and Jane first bypassedNiagara Falls on November 29, 182912. Trade via today’s 42-kilometre long Canal, the fourth to be constructed, grewmost dramatically with the 1959 opening of the St.Lawrence Seaway. It peaked at a high of 66 million tonnesof cargo in 1979, before leveling off to approximately 40million tonnes through each of the past two years. TheWelland Canal, a 12- hour transit, continues to be a vitalcomponent of the Great Lakes – St. Lawrence Waterwaysystem and contributes to the Regional marine industries’$222 million13 economic impact.
Great Lakes- St. Lawrence Waterway SystemThe Great Lakes – St. Lawrence Waterway extends from theAtlantic Ocean to Duluth, Minnesota, on Lake Superior, adistance of 3,780 kilometres, or 8.5 sailing days. Aninternational area comprising more than 90 million people,or nearly ¼ of North American’s population is served by thisvital trade route. It encompasses over 245,000 squarekilometres of navigable waters, and has seen over 2 billiontonnes of cargo move to and from Canada, the UnitedStates, and nearly 50 other nations over the last 40 years.14
The Canadian Shipowners Association (CSA) hasdocumented a ten-year profile of its members’ fleet. Between1988 – 1998, it shows a 27% reduction in its number ofships and a 9% reduction in the tonnage of cargotransported by its membership. The much smaller reductionin cargo volumes can be accredited primarily to increasedefficiencies (e.g. more self-unloaders). Table 315 illustratesthe trends in the number of vessels and cargo volumes.
12 Niagara’s Shipbuilding Heritage, From1828 to Port Weller Dry Docks, by SkipGillham, 1999.
13 Economic Impact of the Marine Industryon the Niagara Region, Dr. Lewis Sorokaand Indra Hardeen, Brock Centre forSocial and Economic Research on Niagara,1998.
14 The Great Lakes Seaway System- SeawayFacts, by the St. Lawrence SeawayManagement Corporation, 2000.
15 CSA Fleet - Ten Year Profile & CargoVolumes , 1988-1998, by the CanadianShipowners Association, 1999
TABLE 3
CSA – Ten Year Profile,Fleet & Cargo Volumes(in millions of tonnes)
No. TotalYEAR of Cargo
Ships Volumes
1988 121 80.5
1989 119 77.3
1990 124 77.3
1991 119 74.5
1992 115 69.5
1993 112 66.0
1994 108 67.9
1995 101 68.0
1996 89 67.3
1997 88 70.1
1998 89 72.7
The drop in the volume of graintransported by the CSA Fleetrepresents the single biggestdecline, dropping from 13.2million tonnes in 1988 to 8.4million tonnes in 1998. Please seethe CSA paper entitledA Competitive Vision for theGreat Lakes – St. LawrenceWaterway for a further discussionof the implications of this trend.

Making Waves… a profile of career opportunities in Niagara’s Marine SectorSECTOR PROFILE
16
Freight movement can also be considered in terms of thetype of trade. In 1998, 41% (29.8 million tonnes) of the CSAtotal was domestic trade. Imports represented 39.1% (28.4million tonnes) of the trade, and the balance, 19.9% (14.5million tonnes) were exported
National Marine IndustryCanada’s marine industry directly employs approximately18,000 people. Just over 2/3rds are employed in the transportsegment of the industry, while just under 1/3rd are employedby the shipbuilding and repair industry.16 Collectively theindustry handles over 224 million tons of cargo a year andcontributes $2 billion annually to Canada’s national revenue.
Although the transport side of the industry has facedcontinued decline (as illustrated in our discussion of thenumber of ships and cargo volumes in the previous section)the shipbuilding segment has faced the greater descent.Industry sales dropped by ½ through the 90s andemployment plummeted from 12,000 to 5,000.17 Four ofCanada’s large shipyards are located on the east coast, two areon the west coast, and Lake Ontario and Lake Superior eachhave one. 18 Their concentration on the east coast has beenparticularly devastating for the Maritimes. Although Niagaraand area employers have also noted how difficult it is toattract and retain skilled workers (e.g. fitters), which furtherundermines their ability to compete for the available work.
International Marine IndustryThe nature and complexity of the international marineindustry is well reflected by the following excerpt.
Imagine a modern supertanker that is owned by a Greekinvestor but is registered with a Liberian company. The vesselwas probably built in an Asian shipyard and financed through aNew York based banking group with additional financialassistance devised by the country in which the vessel was built.The ship is crewed by a mix of foreign nationals, perhapsGerman deck and engineering officers and Taiwanese crew. Thevessel is time-charted on a long-term contract to carry crude oilfrom the Middle East to a series of refineries in Eastern NorthAmerica, including Canada.19
As the interconnectedness of the international marineindustry increases so too has the volume of seaborne trade.World seaborne trade continued to grow through the 90s,reaching in excess of 5 billion tons for the first time, in 1998.Although the annual growth rate in world seaborne trade
16 These are estimates. They have beencalculated on the basis of 1990 StatisticsCanada data, and the 1992 study entitledHuman Resources Study of the CanadianMarine Transportation Industry.
17 A Shipbuilding Policy for Canada,Shipbuilding Association of Canada &Marine Workers Federation/CAW-TCACanada, 1999.
18 Ship Technology, Architecture, Buildingand New Technologies, by the MarineInstitute, 1999
19 An Overview of the Marine Transporta-tion Industry, Marine Institute, 1986,in Here The Tides Flow: Career Opportuni-ties in the Marine Transportation Industry,Marine Institute & Memorial University,1999.

Making Waves… a profile of career opportunities in Niagara’s Marine Sector SECTOR PROFILE
17
recorded its 13th consecutive annual increase in 1998, itrepresented a slow-down, to 2.2% in 1998, the lowestincrease since 1987. The Asian economic crisis continued torestrict the growth rate in 1999. A moderate increase isprojected for 2000, provided that dry bulk trade regains itsmomentum.20
In terms of the number of ships in the global commercialtrading fleets, the trend established over the past decade, of anaverage annual increase of 1%, is projected to continue overthe next five years21. This conservative growth estimate stilltranslates into over 1,300 additional vessels by the year 200522.
The Baltic and International Maritime Council (BIMCO)and the International Shipping Federation (ISF) recentlyreleased their third study of the global supply and demand formerchant seafarers. The study, conducted in co-operationwith the Institute for Employment Research, University ofWarwick, UK, entitled 2000 Manpower Update, builds onBIMCO/ ISF’s 1990 and 1995 findings. Their results estimatea 4% (16,000) shortfall of officers23 to staff the world fleet.The authors of the study predict that the global supplyscenario will worsen unless training is increased or measures aretaken to address the rate at which seafarers leave the industry.24
Based on a conservative 1% annual increase in the number ofships, and assuming recruitment and turnover levels remainconstant with the past five years, BIMCO/ISF project ashortfall of 46,000 officers (12% of the world’s total seafarerworkforce) by the year 201025.
The report also raises a number of key issues related to thepopulation mix, including the:
• changing nationality of the seafarer population, and
• reliance upon ageing OECD senior officers coupled withrelatively few Asian officers having progressed to seniorpositions.
The country origin of the international seafarer populationis continuing its shift away from the more traditionalmaritime centres in Europe, Japan and North America,towards countries in the Far East, the Indian sub-continentand Eastern Europe. Approximately 27% of the present globalmarine workforce, is from OECD countries, a 4% declinesince 1995.26 BIMCO/ ISF’s authors note that the continuedreliance upon large numbers of officers from OECD countriesis of concern, given that over 40% of these officers are over50 years old, and 18% are aged over 55.27
20 Review of Maritime Transport 1999,United Nations Conference on Trade andDevelopment, 2000.
21 BIMCO/ISF2000 Manpower Update, TheWorldwide Demand for and Supply ofSeafarers, Institute for EmploymentResearch, University of Warwick, 2000.
22 The rapidly growing cruise industry,albeit not our focus, will exacerbate theprojected labour shortages. New orders forthe global fleet will increase the worldfleet by about 20% (41) and the marketcapacity by 33%.
23 For ‘ratings’ (non-officer crew) theauthors suggest there continues to be anoverall surplus of 224,000; although theyraise some doubt whether many ratingswould meet international servicestandards.
24 BIMCO/ISF2000 Manpower Update, TheWorldwide Demand for and Supply ofSeafarers, Institute for EmploymentResearch, University of Warwick, 2000.
25 Ibid.
26 Ibid.
27 Ibid.

Making Waves… a profile of career opportunities in Niagara’s Marine SectorSECTOR PROFILE
18
INDUSTRYCOMPETITIVENESS ISSUESSeveral issues are briefly mentioned below. Their inclusionbroadens the context for our understanding of the industry’sworkforce needs, and reinforces that the job opportunitiesprojected through this study represent a conservativeestimate, for they are based upon the status quo.
The key threats to the competitiveness of the Great Lakes –St. Lawrence Waterway and to the shipbuilding and repairindustry located in the Great Lakes Region include: decliningmarket share, outmoded regulation, various trade-relatedissues, and an ageing fleet, which will soon require significantinvestment in infrastructure and shipbuilding. The age of theGreat Lakes vessels is particularly crucial to the long-termcompetitiveness of the industry. The following quotationcaptures the essence of this factor for both the shipbuildingand shipping segments of the marine industry.
Even though vessel owners have invested heavily in fleetmaintenance and renewal in recent years, as is evidenced by theincrease in activity at Port Weller Dry Docks, market earnings areinsufficient to allow for new vessel replacements. In fact, a newlake freighter has not been built in Canada since 1985. Theaverage age of the Canadian bulker fleet now exceeds 30 yearswhile the average age of our self-unloader fleet exceeds 20 years.Clearly, these vessels won’t last forever and we are concernedabout the prospect of renewing the Canadian fleet. In our view,Canada’s marine industry must renew itself on a competitive basisand Canada’s shipbuilding industry must be able to respond.28
And the most recent challenge to the competitiveness ofthe Great Lakes – St. Lawrence Waterway is of course the lowwater level, resulting in reduced cargo loads per ship for,probably, the next three to four years29.
For a thorough discussion of the key competitivenessissues see the CSA paper entitled A Competitive Vision for theGreat Lakes – St. Lawrence Waterway and the SAC paperentitled A Shipbuilding Policy for Canada.
Industries operating in the Great Lakes – St. LawrenceWaterway contribute billions of dollars and thousands of jobsto the Canadian economy. They have played, and will continueto play, an essential role in the efficient and effective transpor-tation of bulk goods. Working diligently with governments30
and other stakeholders, industry employers and associations aredeveloping partnerships for change that will lead to the mostcompetitive, technologically advanced, and environmentallyresponsible water management system in the world.31
28 The Welland Canal - 170 Years Later,excerpted from a speech given by WayneSmith, Vice President and GeneralManager, Seaway Marine Transport,November 25, 1999.
29 Low water, ebbing fortunes strand GreatLakes Shipping, The Toronto Star, May 13,2000.
30 The federal Treasury Board, for example,is currently reviewing the impact ofrecently imposed user fees and theindustry is hopeful that it will rectify theirnegative effect upon the industry'scompetitiveness.
31 A Competitive Vision for the Great Lakes- St. Lawrence Waterway, CSA, 1997.

Making Waves… a profile of career opportunities in Niagara’s Marine Sector EMPLOYMENT & TRAINING NEEDS
19
In this section we turn to the core focus of this study – theemployment and training needs of the Niagara/ Great Lakesmarine industry. Six tightly related matters will be discussed.We will start by taking a look at the Employment Demandprojections from our employer sample. After which, we willreview the Upgrading Intentions articulated by our marinersample, as well as their perception of the Upgrading Issuesand barriers they face. A survey of the broader Labour Supplypotential, including cadet projections through InstitutionalTraining, and the overall Replacement Challenges confrontingthe industry will round out this section.
EMPLOYMENT DEMANDIndustry participants refer to three broad ‘employee’ groups,namely core employees, relief personnel, and a generalmarine labour pool. The discussion in this section refersprincipally to the employers’ core employees and regularrelief personnel. The union member sample, discussed inUpgrading Intentions and Upgrading Issues reflects a cross-section of all three labour force groups.
Across the sample 18 of 22 employers anticipate hiringnew personnel over the next 5 years. They have projectedthat 1,304 jobs will arise through to the year 2010. Of these,761 (58%) are projected to arise over the next five years, withthe balance (543) projected to arise between the years 2005-2010. Chart 6 illustrates the number of projected jobs acrossthe sample between 2000-2010.
Em
plo
ymen
t&
Tra
inin
g N
eed
s
CHART 6

Making Waves… a profile of career opportunities in Niagara’s Marine SectorEMPLOYMENT & TRAINING NEEDS
20
Ninety-nine per cent (99%) of the employment projectionsare for full-time employment32. Business growth accounts for27% of the projected opportunities, whereas 73% areprojected to arise through replacement needs, particularlythrough anticipated retirements.
Out of the 4433 occupation codes projected, 9 occupationsaccount for 968, or 74% of all of the projected jobs. Chart 7illustrates the number of jobs projected by sampleparticipants within each of the 9 leading occupations.
CHART 7:
Projected Jobs by Occupation
With ¾ of the projected opportunities concentrated in 9occupations, it’s crucial that we understand their context. Theshipping sector of the industry accounts for 8 of the top 9occupations. And age is a crucial indicator of the replacementneed across most of these occupations. In 7 out of 9 of theoccupations projected to have the greatest number of jobs,50% to 73% of the current workforce is over 45 years of age.Table 4 provides a breakdown of the age of the employeesacross the employer sample for the top 9 occupations.
32 Many of the projected jobs involve acompressed year. For example on-boardcrew may work more than 2000 hours(a full calendar year based upon a 40-hour week) during a 9-month period.
33 Additional occupations other than thetop 9, include: engine fitters, painters/blasters, electricians, foremen, machinists,and sales personnel.

Making Waves… a profile of career opportunities in Niagara’s Marine Sector EMPLOYMENT & TRAINING NEEDS
21
TABLE 4
AGE BREAKDOWN BY OCCUPATIONOccupation <31 31-44 45-54 >54
Marine Steel Fitters 8.3% 31.7% 40% 20%
Ordinary Seamen 12.4% 47.9% 26.7% 13%
Engineering Officers 9% 29% 21.6% 35.2%
Able Seamen 4.4% 30.1% 43.4% 22%
Mechanical Assistants 7.8% 35.2% 24.2% 32.8%
Chief Cooks 1.3% 26% 33.8% 39%
Deck Officers 16.9% 45.9% 25.7% 11.5%
Captains 4.2% 29.6% 43.7% 22.5%
Chief Engineers 6.9% 29.2% 33.8% 30.6%
Salary/wage rates for the top 9 occupations ranged from$30,000 to $96, 000/ year. The average annual income acrossall 9 occupations is $50,509. All 8 of the shipping-specificoccupations are based on a typical 8-10 month season. Chart8, reveals the average annual income for the projected jobs,by the top 9 occupations. The Regional average wage isincluded in Chart 8, as a comparative reference.
CHART 8:
Wage by Occupation

Making Waves… a profile of career opportunities in Niagara’s Marine SectorEMPLOYMENT & TRAINING NEEDS
22
Employers consistently indicated that they anticipatedifficulty filling all of the projected jobs related to thefollowing occupations:• Captains • Chief Engineers• Deck Officers • Marine Steel Fitters
Across the five additional occupations, the degree to whichthey anticipate difficulty recruiting qualified crew varied byemployer. Chart 9 shows the percentage of employers thatanticipate difficulty recruiting personnel, by occupation.
CHART 9:
Recruitment Difficulty by Occupation
The 45 jobs projected across the sample for a 10th
occupation, shore-based engine fitters, may furtherexaggerate the demand for engineers. Typically employerslook for people to fill the engine fitter role with skillscomparable to the marine engineer.
Appendix A includes four short profiles of the nineoccupations cited above. Marine Steel Fitters are described inone profile. The 8 shipping focused occupations are clusteredinto three occupational groupings. Chief engineers andengineering officers are described in a second profile.Captains and deck officers are outlined in another profile.And the fourth profile summarizes the jobs for ordinaryseamen, able seamen, mechanical assistants and chief cooks.Each profile includes a brief description of the job and theeducation and experience requirements, working conditions,training availability, and employment outlook.
PER
CEN
TAG
E O
FE
MP
LOY
ER
S

Making Waves… a profile of career opportunities in Niagara’s Marine Sector EMPLOYMENT & TRAINING NEEDS
23
UPGRADING INTENTIONSA total of 267 union members from the CMOU (CanadianMarine Officers Union), SIU (Seafarers’ International Unionof Canada), the CMSG (Canadian Merchant Service Guild),and the International Brotherhood of Boilermakers respondedto member questionnaires.34 Of the 267 respondents, 55%(148) are CMOU members, 22% (60) are SIU members, 14%(38) are with the IBB, and 9% (21) are CMSG members.
Respondent Profile• Gender – 97% male, 3%- female• Age – The age of the respondents is set out in Chart 10.
CHART 10:
Union Member RespondentAge Profile
34 The participating members from thethree marine unions cited here areemployed by a cross-section of shippingcompanies plying the Great Lakes. Theyinclude employees and relief personnelfrom the employer sample, employees andrelief personnel from employers that didparticipate in this study, and members ofthe general marine labour pool. Theemployees of Upper Lakes Shipping,represented by the CMU, are not reflectedin this section. All of the IBB respondentswork for Port Weller Dry Docks.

Making Waves… a profile of career opportunities in Niagara’s Marine SectorEMPLOYMENT & TRAINING NEEDS
24
• Work Profile – Chart 11 illustrates the number of monthsrespondents’ worked in the marine sector during the 1999calendar year.
CHART 11:
Work Profile
• Occupational Profile – Chart 12 illustrates theoccupational breakdown of the respondents.
CHART 12:
Occupational Profile

Making Waves… a profile of career opportunities in Niagara’s Marine Sector EMPLOYMENT & TRAINING NEEDS
25
• Educational Attainment – Chart 13 illustrates the level offormal education completed by the respondents.
CHART 13:
EducationAttainment
• Geographic Distribution – Chart 14 illustrates theprovincial/regional home residence of the CMOU, SIU,and CMSG respondents.
CHART 14:
GeographicDistribution

Making Waves… a profile of career opportunities in Niagara’s Marine SectorEMPLOYMENT & TRAINING NEEDS
26
Career IntentionsSixty per cent (60%) of the responding officers expressed aninterest in upgrading their classifications, with 31% aspiringto achieve their 1st class ticket. Sixteen per cent (16%) intendto retire/leave the industry, with the majority (71%) of thisgroup planning to retire/leave by the year 2005.
Over 40% per cent of the SIU member respondentsexpressed an interest in staying in their present positions.Thirty per cent (30%) indicated an interest in upgrading tovarious positions, including navigation officer, wheelsman,chief cook, mechanical assistant, and engineering officer,which was the most frequently cited (67%) career goalexpressed by members with career aspirations.
Sixty-five per cent (65%) of the IBB member respondentsexpressed an interest in staying in their present positions.Almost 24% indicated an interest in upgrading theirclassification or position. The most frequently cited‘upgrading’ goal related to becoming a marine steel fitter.
UPGRADING ISSUESMembers were asked to comment on eleven potential barriersthat may hinder their ability to achieve their careeraspirabtions. Table 5 illustrates comparatively, the significanceof each of the barriers to CMOU, SIU and CMSG members.
TABLE 5
Potential Barriers
Lack of time to do the courses with limited ‘off-time’ 37%
Travel costs/time to training location are too high 33%
Course fees are too expensive 33%
Lack of flexible course scheduling 30%
Lack of specific training courses/programs 23%
No financial incentive to upgrade skills 22%
Lack of basic computer knowledge 16%
Lack of opportunity to acquire sufficient ‘sea service’ 9%
Other barriers 4%
Not sure what career options are 3%
Not sure what training needed 2%
% of Respondents who citedthe barrier as significant

Making Waves… a profile of career opportunities in Niagara’s Marine Sector EMPLOYMENT & TRAINING NEEDS
27
Current mariners clearly view the lack of time to do thecourses (37%), travel costs/time to training location (33%),expensive course fees (33%), and a lack of flexible coursescheduling (30%) as the greatest barriers to upgradingtheir skills.
Twenty-four per cent (24%) of respondents from the IBBcited selected barriers as significant impediments to theirupgrading/training aspirations. The most cited barrier (16%)was the lack of flexible course scheduling.
Preferred Learning MethodsForty-seven per cent (47%) of the union member respondentsindicated their preferred learning methods for upgradingtheir knowledge and skills. The majority of the respondentsprefer a combination of workshop tutorials, including hands-on applications where relevant, with self-directed,particularly computer-assisted, support. A third (1/3rd) of thisgroup cited an interest in on-board, computer-assistedlearning. The majority IBB respondents prefer a combinationof workshops and on-the-job training.
Assessment of Recent TrainingAcross the sample, 63% of the respondents indicated they hadparticipated in one or more training activities during the pastthree years. Courses ranged from welding, propulsion plantsimulator training and engine room resource management tofirst aid, bridgewatch, and MED training. Training deliverersincluded Georgian College, Institut Maritime du Quebec,Nova Scotia Nautical School, Canadian Coast Guard College,Holland College, Marine Institute, Pacific Marine TrainingInstitute, Niagara College, St. John’s Ambulance and variouscompany specific training providers. Overall, respondentsrated the content and facilities of their various trainingexperiences favorably. Across all courses and all trainingproviders, the respondents who rated their courses, ratedtheir training experiences as good 82% of the time. The mostfrequent criticisms were consistent with the barriers citedearlier. Respondent comments include the followingcriticisms:
• the high cost of courses (less of an issue in Quebec);
• the difficulty in attending traditionally delivered courses withlimited time off during the shipping season;
• a lack of hands-on practice;
• a lack of company financial support; and

Making Waves… a profile of career opportunities in Niagara’s Marine SectorEMPLOYMENT & TRAINING NEEDS
28
• the difficulty of completing the theory portion of the TransportCanada exams.
Suggestions included the following comments:
• changing the on-board/leave system to 1 month on and1 month off;
• introducing more on-board training through CD-ROM; and
• more support, resources & time are needed in order for on-board studying to be feasible.
A number of individual comments suggest a polarization ofthe upgrading issues facing the industry. Many of the existingofficers that have moved up through the ranks by followingthe more experiential route are distressed by the academicchallenges of Transport Canada’s certification standards.Whereas the more recent college educated officers need theopportunity to complement their academic knowledge withmore hands-on skill development. This polarization may beintensified by the perception, expressed by individual officersand selected employers, that the colleges are biased towardthe cadet route. Although the two different approaches totraining have, at times, contributed to a counterproductiverift between mariners, employer and college commitment tomeet the training needs of ‘both camps’ could help mitigatedifferences, and enhance the development of both academicand experiential proficiency.

Making Waves… a profile of career opportunities in Niagara’s Marine Sector EMPLOYMENT & TRAINING NEEDS
29
LABOUR SUPPLYConsideration of the potential labour supply should consider atleast three areas. First it requires an understanding of theupgrading intentions of existing mariners, which we covered inthe previous section. It is also important that we review the actualnumber of certificates issued by Transport Canada in recent years.An analysis of the institutional capacity of the marine trainingcolleges/institutes rounds out the supply context.
Transport Canada Issued CertificatesTable 6 (with footnote) shows the total number of newnautical and engineering certificates issued in Ontario byTransport Canada in 1998 and 1999. It is estimated thatOntario residents make up between 25-30% of the GreatLakes mariners, so the small number of new tickets issuedover the past two years raises serious supply concerns.Concomitantly, it is anticipated that a significant number ofcurrent mariners will need to renew their tickets over thenext few years, which will put increasing pressure on thetraining institutes to meet the demand for simulator training.
TABLE 635
Classification 1998 1999
Master Mariner (MM) 3 5
Ocean Navigator I (ONI) 1 1
Ocean Navigator II (ONII) 6 1
1st Class Engineer 7 13
2nd Class Engineer 5 9
3rd Class Engineer 11 13
4th Class Engineer 16 31
Institutional Training36
Seven colleges/institutes across Ontario east to Newfoundlandprovide marine training. Presently four offer engineering cadetprograms and six offer navigation cadet programs. Movingfrom west to east, the following training institutes deliver full-time co-op programs in both engineering and navigation:
• Georgian College• Institut Maritime du Quebec• Nova Scotia Nautical Institute, and• Marine Institute.
35 Transport Canada Centre – Marine, St. Catharines Office,May, 2000. Also note the engineering certificates includemotor and combined certificates.
36 Industry employers and unions co-ordinate/providevarious training courses for their employees/members.Their focus, however, has been upon upgrading and processspecific areas. The costs incurred to upgrade certificationsmay be shared by the employer and employee; or borneexclusively by the employer or individual.

Making Waves… a profile of career opportunities in Niagara’s Marine SectorEMPLOYMENT & TRAINING NEEDS
30
A full-time co-op program in engineering is also deliveredby New Brunswick Community College. And the CanadianCoast Guard College delivers a full-time co-op program innavigation.37 In addition, both New Brunswick CommunityCollege and Holland College deliver continuous-intake,modularized courses in navigation. Most of the abovecolleges/ institutes also provide a full range of upgrading,safety, and environmental training to meet Transport Canadaand STCW38 standards. Some, for example the MarineInstitute and l’Institut Maritime du Quebec also offerprograms in Naval Architecture.
With the exception of Georgian College and L’InstitutMaritime du Quebec, the more easterly colleges/institutesprimarily serve the eastern and international demand forofficers. All boast placement rates of between 90-100%. Lessthan 10% of the 1998 and 1999 graduates from the maritimecolleges/institutes have gone on to careers with the GreatLakes fleets. Whereas approximately 60% of the 1998 & 1999graduates from central region colleges are now working theGreat Lakes.
Table 7, presents a forecast39 of the number of graduates,by the two cadet programs of most relevance to the study,across the colleges/institutes.
TABLE 7
Projected # of Graduates 2000-2005
Program YEAR00 01 02 03 04 05
Marine Engineering 33 45 88 93 78 80
Marine Navigation 54 61 65 94 93 80
Participating colleges/institutes based their graduateprojections on a 60-65% completion rate. Enrolmentforecasts were based upon 50-100% of enrolment capacity. Sothere is clearly room in some programs to expand the numberof cadets further than projected, if the recruitment challengescan be addressed.
37 The CCGC is projecting to deliverengineering programs commencing in2002 and 2003 to meet Coast Guard fleetdemand.
38 STCW refers to the 1995 Standards ofTraining Certification and WatchkeepingConvention.
39 Projections are based upon a survey ofthe training institutes. Four out of sevencolleges/institutes provided concretegraduate and enrolment projections.The projections include our estimates forthe non-participating colleges/institutes.

Making Waves… a profile of career opportunities in Niagara’s Marine Sector EMPLOYMENT & TRAINING NEEDS
31
Based upon recent graduate placement patterns, we canestimate that between 18-24% of the graduates from the sevencolleges/institutes will find work with the Great Lakes fleets,with the bulk of them coming from Georgian College andl’Institut Maritime du Quebec. Charts 15 and 16 illustrate thebasic supply (cadet graduates by program) and demand(employer sample participants) comparisons, based uponthese assumptions.
CHART 15:
Engineering Graduates (Supply)vs Great Lakes Demand
CHART 16:
Navigation Graduates (Supply)vs Great Lakes Demand

Making Waves… a profile of career opportunities in Niagara’s Marine SectorEMPLOYMENT & TRAINING NEEDS
32
Three notes need to be made related to these comparisons.First, the graduate projections (supply numbers) of thecolleges/training institutes, are themselves based uponsignificant increases in enrolment. Second, they are based onan 18% ratio of graduates entering the Great Lakes-basedindustry; which may be seriously cut into by the significantinternational shortages and projected growth in the cruiseindustry. Finally, although these comparisons show that thecolleges/ institutes have the capacity to meet the projectedlong-term demand of the Great Lakes fleets40, the short termdemands for senior officers will need to be met through theupgrading of the officers currently working in the industry.And it is in this area, the upgrading of existing mariners,where the colleges/institutes need to improve access to theircourses through more flexible and timely modes of delivery.
Recruitment ChallengesRepresentatives from all of the colleges/ institutes that wespoke with remarked on the difficulty in attracting studentsinto marine engineering and navigation programs. BIMCO/ISF’s international study demonstrates that low levels ofrecruitment are a concern across OECD countries, not anissue isolated to Canada.
The Canadian public, arguably, is well aware of theemployment decline of the national and regional marineindustries. Couple this awareness with, at least for the shippingsegment of the industry, the long periods at sea, it’s clearly anindustry suited to only a small percentage of Canadians.
Employers from our sample suggested looking to theindustry’s employment inequities as a potential source forincreasing recruits. Women were identified as one of theuntapped potential labour force sources. With womenrepresenting only 3% of our sample’s respondents, industryemployers may be accurate about their ‘untapped potential’;albeit, perhaps overly optimistic of their willingness to enterthe industry without significant changes in the milieu of lifeon-board.
Internationally, women represent less than 2% of theworld’s 1.25 million seafarers, with the majority working ascooks, porters, or waitresses in the cruise segment of theindustry. Europeon Union fleets fair a little better, withwomen representing 4 – 5% of their total workforce.41 Thesocio-cultural factors impeding the integration of women on-
40 With some need to still further increasethe number of marine engineer graduates.
41 Women on-board – ten years of the IMOWomen In Development Program, PamelaTansey, International MaritimeOrganization (IMO), 1999.

Making Waves… a profile of career opportunities in Niagara’s Marine Sector EMPLOYMENT & TRAINING NEEDS
33
board have deep historical roots in most countries. Andalthough we may wish to think Canada is different, ourfindings (through both employer interviews and respondentquestionnaires) suggest that we too need to improve not onlyour (hiring) numbers, but also our support for the integrationof female mariners.
The International Maritime Organization (IMO) was thefirst organization to develop a formal strategy for theintegration of women into the maritime sector. The IMOWomen In Development Programme was initiated in 1989, andoffers the best resource for learning how to enhance marinetraining and jobs for women. Their experience suggests theneed for multifaceted interventions, including, but notlimited to, the following areas:
• Gender-Awareness Training across the sector
• Gender-specific Fellowships
• Shorter voyages and/or longer home leave, and
• Improved on-board accommodation and facilities.
The IMO also notes that the strategies above not onlyattracts more women to the marine professions but alsobenefits all seafarers, regardless of gender.42
42 Ibid.

Making Waves… a profile of career opportunities in Niagara’s Marine SectorEMPLOYMENT & TRAINING NEEDS
34

Making Waves… a profile of career opportunities in Niagara’s Marine Sector REFLECTIONS & RECOMMENDATIONS
35
The report concludes with some reflections about ourfindings, including some of the implications and caveats forNiagara, before turning to a presentation of the corerecommendations for further action.
Implications & Caveatsfor NiagaraThe findings of this study are consistent with HRDC’s 1992nation-wide study, and the Marine Institute’s 1999 study,namely, that the marine industry is facing serious skillshortages, particularly in the officer professions. For Niagara,the most immediately relevant sphere relates to the GreatLakes focused industry, which is commanded by a smallnumber of dominant companies. Within this group,employment and training needs vary significantly, resulting ina further concentration of the projected jobs. Over 60% of the1,304 jobs projected across the sample fall to two employers.Given the sample’s employment pattern is representative ofthe total Great Lakes Industry, the total number of jobsapproaches 1,800, but would still be primarily localizedwithin fewer than five organizations.
Regionally, the sample projections include the loss of 67shore-based positions over the next five years. Also of note,during the study one employer went into receivership, leaving125 (ship repair segment) unemployed. And one, more positive,finding suggests that a small number of senior, shore-basedpositions, such as superintendents and pilots, will also arise overthe next ten years. These would typically be filled by seniorofficers, and have not been included in the projections above.
Seven significant factors, discussed earlier, ease theconfinement of the sample’s projected jobs, by providing abroader, albeit at a distance, spectrum of opportunities forinterested Niagara residents. The magnitude of the marine-related opportunities rests upon the following seven factors,precisely the:
• projected retirements within the Great Lakes fleets• current mariners’ intentions to upgrade, leaving junior
officer positions open• need to begin to replace the aged Great Lakes vessels• growth in Canada’s east coast oil and gas sector• forecasted world shortages• difficulty in recruiting students into marine programs; and• growth potential through enhanced industry competitiveness.
Ref
lect
ion
s&
Rec
omm
end
atio
ns

Making Waves… a profile of career opportunities in Niagara’s Marine SectorREFLECTIONS & RECOMMENDATIONS
36
Overall, even with the aforementioned caveats about theconcentration of jobs, we can conclude from the broadermarket scope that plentiful numbers of rewarding jobs willprevail for individuals willing to and capable of flowing withthe industry tide43.
The potential for Niagara’s broader labour poolThere are three basic labour pool sources that may benefitfrom the marine sector’s projected jobs. Most obvious is theunemployed, which is currently just over 13,00044 people or6.9%. Of this group just under 1/3rd are between the ages of15-24 years, and approximately ½ are between 25-44 years ofage. Marine jobs may be particularly appealing to this group,as it may offer an immediate chance for a more secure future.
Marine opportunities may also appeal to upcoming labourforce entrants, our second potential source for labour.Included here are three audiences – recent, young graduates;adults in- transition; and immigrants to the Niagara Region.Youth ‘graduates’ include new high school and post-secondary graduates. Adults in-transition include peoplemoving, for the first time, into the ‘official’ labour force fromhome, and people returning to the paid labour force after aperiod of absence (e.g. due to illness, time away to care forchildren). Another audience of upcoming entrants iscomprised of the people we attract to the Niagara Region.
The third potential source of labour supply is Niagara’sunderemployed. People already working in the marine sectorin a relief or contract capacity, and labour force membersemployed in other industries but whose potential is under-utilized, would make up this potential labour pool.
Recommendationsfor Further ActionWe have organized the recommendations by the industrypartners. There is, of course, overlap, to ensure an integratedresponse. The recommendations are intended to provokedialogue and encourage action that will benefit all industryand community partners.
Industry Employers
• Continue with and expand the industry’s recent initiativesto raise community awareness of the impact and benefitsof, and opportunities within the marine industry.
43 We have borrowed the metaphor of the‘tide’ from the Marine Institute’s 1999report entitled Here The Tides Flow- CareerOpportunities in the Marine Transporta-tion Industry.
44 Unemployed Labour Force for theSt. Catharines-Niagara CMA, Labour ForceSurvey- Annual Average, Statistics Canada,2000.

Making Waves… a profile of career opportunities in Niagara’s Marine Sector REFLECTIONS & RECOMMENDATIONS
37
• Promote the environmental benefits of bulk transportationvia marine shipping, and facilitate and encourage publicdialogue about these benefits.
• Develop and implement recruitment strategies directed toboth the broader population and specific audiences,including youth, women and minorities.
• Ensure that equity policies and practices genuinelysupport the recruitment and integration of women andminority groups.
• Review existing on-board – leave policies and practiceswith the aim of supporting recruitment initiatives.
• Ensure training policies and practices support employeeupgrading.
• Develop reciprocal mentorship programs to promoteacademic and experiential development.
• Review the feasibility of on-board training, through the usedistance education.
• Develop the technological and operational capacity forcrew to participate in training while on-board ship.
• Strengthen relationships with training institutions byensuring appropriate cadet berths.
• Continue the dialogue with governments to ensure theindustry is able to compete evenly with its competitors.
Industry Unions
• Develop and implement, in collaboration with industrypartners, gender and minority awareness training.
• Promote and facilitate the development of members’computer skills.
• Ensure that union contracts and practices adequatelysupport member upgrading goals.
• Promote and support equitable treatment of all crew bymembers.
• Ensure equity and training support mechanisms areadequately addressed in future collective agreements.
Human Resources Development Canada- HRCC, Niagara Region
• Communicate and promote the marine industry’s jobs tothe community.
• Review and assess the labour force supply characteristics.
• Promote and support upgrading training for currentmariners, similar to the incentives available in Quebec andBritish Columbia.

Making Waves… a profile of career opportunities in Niagara’s Marine SectorREFLECTIONS & RECOMMENDATIONS
38
• Promote and support accessibility to and training for themarine industry for appropriate equity groups.
Training Institutes
• Communicate and promote the marine industry’s jobs topotential and current students.
• Develop, promote and facilitate flexible and integratedtraining delivery options that incorporate a combination oftraditional and distance education modes.
• Develop, promote and facilitate flexible and integratedtraining tutorials (focusing upon certificationrequirements) that incorporate a combination oftraditional and distance education modes.
• Integrate marine courses, where appropriate, with relatedprograms to reduce costs and broaden student exposure tothe opportunities in the marine industry.
• Review the potential to fast-track cadet (engineers inparticular) development through intense post-diplomaprograms for mechanical/ manufacturing engineeringgraduates.
• Incorporate on-site ‘coaching’ tutorials to complimentcollege lab and classroom training.
• Develop and implement recruitment strategies directed toboth the broader population and specific audiences,including women and minorities.
• Develop partnerships with industry that will facilitate thecapacity of the training institutes to attract and retainqualified instructors.45
• Develop institutional partnerships to extend the presentenrolment capacity using the existing infrastructure (e.g.simulators).
• Consider, in consultation with industry partners,introducing a mandatory 2-3 week on- board pre-enrolment experience for new students.46
• Develop and implement, in collaboration with industrypartners, gender and minority awareness training.
The above recommendations are expressed with thegenuine intention to help make a difference. For all of thepartners – employers, unions, mariners, governmentrepresentatives at all levels, student and labour forcemembers, and the colleges/ institutes – stand to benefit from acoordinated and integrated response to the needs articulatedthrough this report.
45 Given the projected shortage of officers,it may be difficult for colleges/institutes toretain and attract qualified instructors.Professional development leaves or‘teaching sabbaticals’ may attract selectedsenior officers, provided the rewards andbenefits warrant their consideration.
46 The aim is to reduce the attrition rate,by an up-front exposure to the lifeon-board ship.


