The United Nation Development Program UNDP/Malawi - Growing Sustainable Business for Poverty Reduction Program in Malawi Draft Final Report Feasibility study for the use of ethanol as a household cooking fuel in Malawi November 2007 Ethio Resource Group Pvt. Ltd.
Transcript
The United Nation Development Program UNDP/Malawi - Growing Sustainable Business for Poverty Reduction Program in Malawi Draft Final Report Feasibility study for the use of ethanol as a household cooking fuel in Malawi November 2007
Ethio Resource Group Pvt. Ltd.
i
Table of Contents 1 INTRODUCTION AND BACKGROUND ....................................................................1
1.1 People and geography....................................................................................1 1.2 Economy ........................................................................................................1 1.3 Transport infrastructure .................................................................................2 1.4 Malawi’s development strategies...................................................................2 1.5 The Malawi Energy Policy ............................................................................3
2 THE ENERGY SECTOR ................................................................................................4 2.1 Energy Resources...........................................................................................4 2.2 Energy Consumption .....................................................................................5
3 THE HOUSEHOLD ENERGY SECTOR.....................................................................10 3.1 Key energy issues in the household sector ..................................................10 3.2 Fuel and Stove Market .................................................................................12
3.2.1 The Urban Household Fuel Market .................................................12 3.3 Comparative Cooking Costs ........................................................................17 3.4 Household energy demand in Malawi .........................................................21
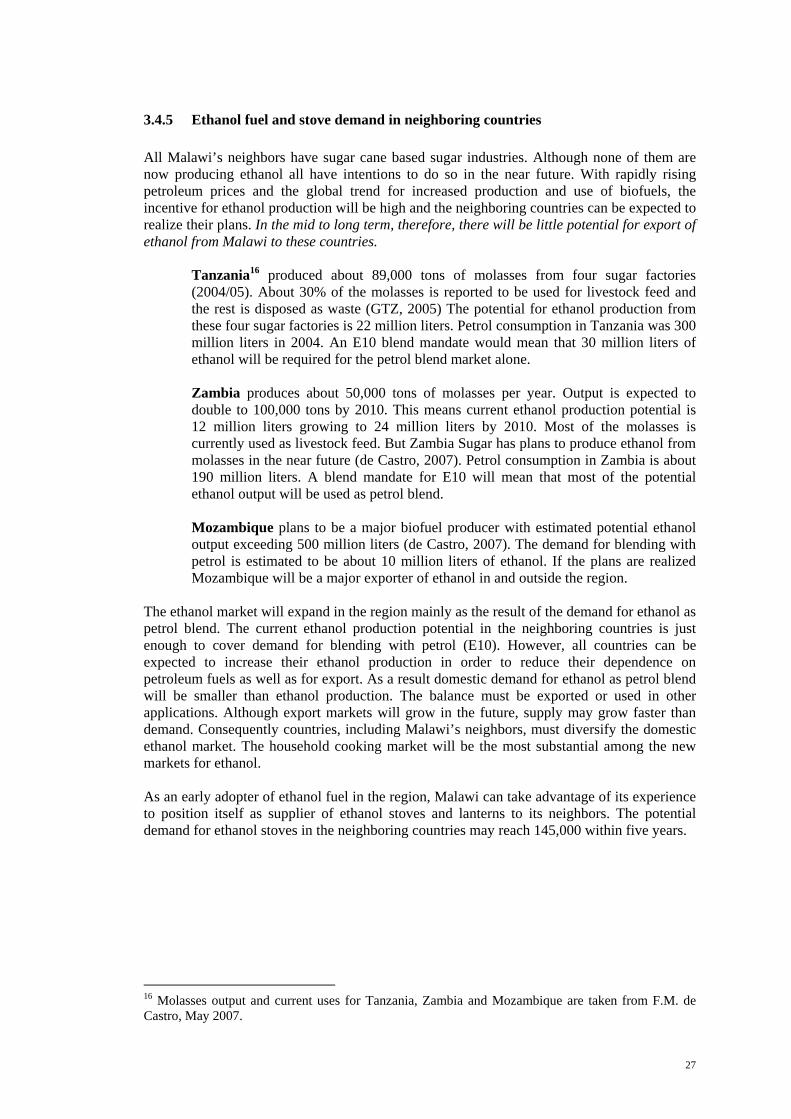
3.4.1 Household cooking energy shares ...................................................21 3.4.2 Household cooking energy consumption.........................................23 3.4.3 User capacities and preferences .......................................................23 3.4.4 The potential market for ethanol cooking in Malawi.......................26 3.4.5 Ethanol fuel and stove demand in neighboring countries................27
4 INDUSTRY ANALYSIS ..............................................................................................29 5 FINANCIAL ANALYSIS .............................................................................................30
6 ECONOMIC AND SOCIAL BENEFITS .....................................................................34 6.1 Foreign Exchange Savings...........................................................................34 6.2 Employment Benefits...................................................................................35
7 ENERGY AND GENDER IN MALAWI .....................................................................36 7.1 Gender Policy...............................................................................................36 7.2 Gender and Household Energy ....................................................................37 7.3 Time Saved: Benefits at the National Level ................................................37
8 ENERGY AND HEALTH IN MALAWI .....................................................................39 8.1 Main Public Health Issues and Concerns.....................................................39 8.2 Household Energy and Health .....................................................................40
8.2.1 The Health Implications of IAP in Malawi......................................40 8.2.2 Ethanol as a Means of Addressing the Health Impact of IAP .........40
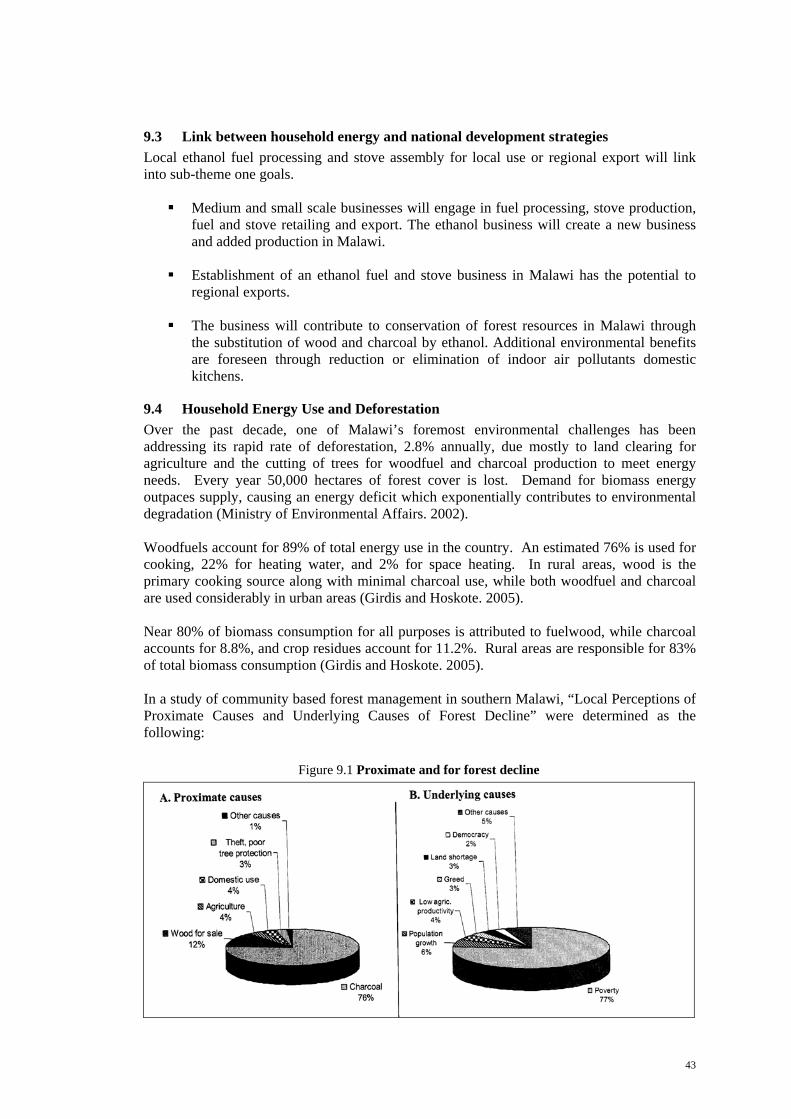
9 ENERGY AND ENVIRONMENT IN MALAWI ........................................................42 9.1 National Environmental Action Plan 1994 ..................................................42 9.2 National Environmental Policy, 2004..........................................................42 9.3 Link between household energy and national development strategies........43
ii
9.4 Household Energy Use and Deforestation...................................................43 9.4.1 Institutional response .......................................................................44 9.5 Benefit of Switching from Solid Biomass Fuels to Ethanol ........................44
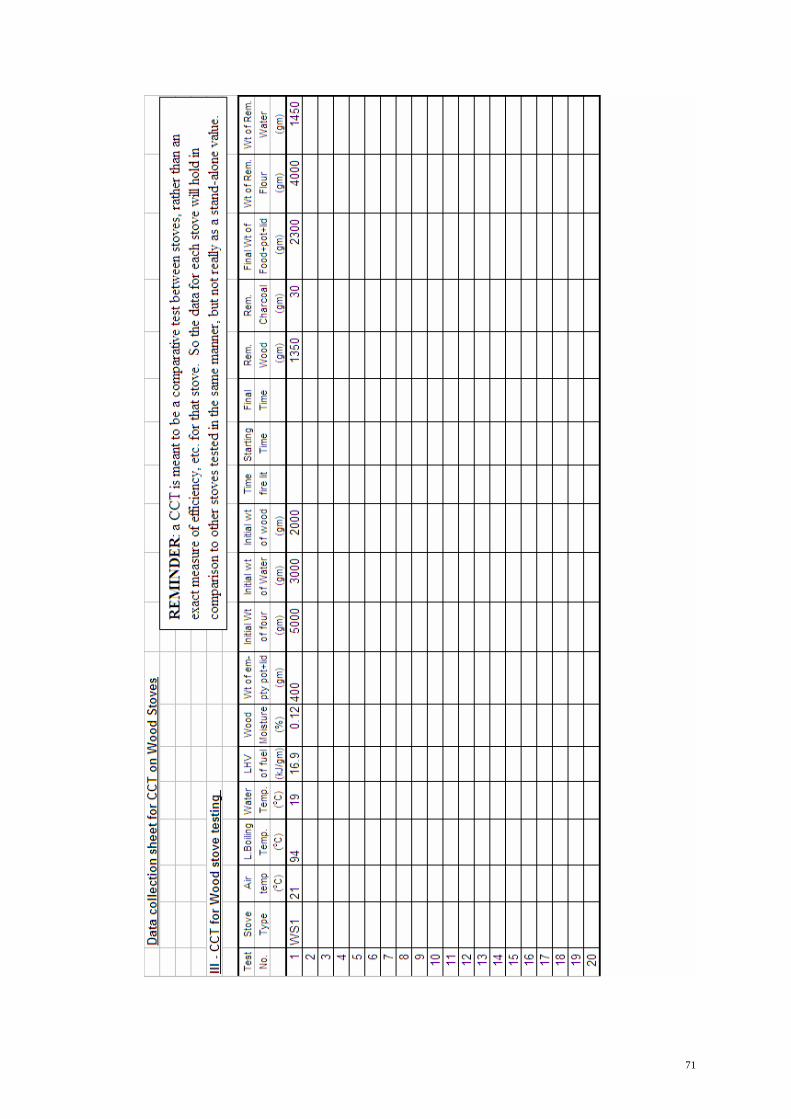
10 ACTIONS FOR PROMOTION OF ETHANOL AS DOMESTIC FUEL ....................46 REFERENCES ............................................................................................................49 ANNEX B. DESCRIPTION OF SELECTED STOVES IN MALAWI......................54 ANNEX C. CONTROLLED COOKING TEST (CCT)..............................................57 ANNEX D. EMISSIONS TEST RESULTS................................................................61 ANNEX E. CCT PROCEDURE FOR WOOD STOVES ..........................................67 ANNEX F. CONTROLLED COOKING TEST DATA COLLECTING SHEET......69 ANNEX G. PROJECTED FINANCIAL STATEMENTS..........................................72 ANNEX H. LIST OF CONTACT PERSONS.............................................................73
i
SUMMARY Malawi is home to 13.2 million people (2007 estimate according to Malawi NSO) and covers an area of 118,484 square kilometers. Malawi’s population growth rate is 3.3%, which is among the fastest in the world. At 130 people per square km Malawi also has the highest population density among SADC countries. Eighty percent of Malawians derive their livelihood from small scale agriculture. Incomes are low in Malawi, just US$160 per capita, and half the population falls under the poverty line. The Malawian economy is dominated by agriculture which contributes 35 percent to GDP and 93 percent to total exports. Imports and exports were MK137 and MK59.7 billion respectively in 2005. The major exports from Malawi are tobacco, tea, sugar and cotton and apparels. Malawi has developed two key strategies to guide its socio-economic development until 2011. The Malawi Economic Growth Strategy (MEGS, 2004) was developed with the objective of diversification of the economy into potential growth sectors including mining, manufacturing and tourism. The second strategy, the Malawi Growth and Development Strategy (MGDS, 2006) focuses on poverty reduction through sustained economic growth and infrastructure development. The MGDS identified six priority areas for action: agriculture and food security; irrigation and water development; transport infrastructure development; energy generation and supply; integrated rural development; and prevention and management of nutrition disorders, HIV and AIDS. The MGDS recognizes energy to be a crucial input for industrial development. The emphasis is on increasing access to electric power for the economy. Expected outcomes for the energy sector include increasing access to power from 6 to 10% by 2010 and to 30% by 2020, power interconnection to the Southern Africa Power Pool (SAPP), and reduction of the share of biomass fuels in the supply mix from 90% to 75% by 2010. The Malawi energy Sector Energy resources Malawi is endowed with highly fertile land and various energy resources. The biomass resource base however, has been over burdened supplying the greater portion of the energy requirements of the country. Energy resources with exploitable potential include hydropower, coal, uranium, and alternative source of energy such as solar and wind. Forests are major sources of energy in Malawi, supplying the greatest portion of energy requirements in the form of firewood and charcoal. According to the 2006 remote sensing data the total forest reserve in the country is estimated to be 275.5 million tones. The northern region accounts 41% of the total biomass available in the region. The central and southern regions are densely populated areas but with lower percentage of biomass amounting 105 and 58 million tones respectively. Hydropower potential is estimated to be about 1670 MW. Electricity generation from large scale hydropower projects are on Shire River with current installed capacity of 285MW meeting only 2.3% of the total energy demand. Annual ethanol production is about 18 million liters. The probable reserves for coal is about one billion tones, of which 22 million tones are proven reserves of bituminous type. Malawi has good solar energy resources (mean insolation of 5kWh/m2-day) and Uranium ore deposits discovered in northern Malawi in the early 1980s, are recently being exploited..
ii
Energy supply Of the total biomass energy supply 97% is woody biomass in the form of firewood and charcoal. The remaining three percent is mainly crop and factory residues. Nearly 70% of the woody biomass supply goes to the household sector (58% rural and 12% urban) while the remaining 30% is absorbed by services and industries such as tobacco processing, tea estates, brick making, fish smoking and other small-scale industries. The estimation of total woody biomass consumption by all sectors in Malawi adds up to be 10.71 million tones per year. The household sector alone consumes 7.5 million tones of woody biomass, while the sustainable supply of woody biomass in the country is 3.8 million tones per year. This is alarming as the deficit is 6.8 million tones per year or 3.7 when only considering the household sector.. Production of ethanol in Malawi reaches 17.9 million liters with Ethanol Company Ltd (ETHCO) and Press Cane Ltd contributing 5.4 and 12.5 million liters per year respectively. Each of these companies has potential to produce 16 to 18 million liters per year. Ethanol is produced in Malawi from fermentation of molasses obtained from the two sugar estates in Malawi, Illovo and Sugar Ltd. and Sugar Corporation of Malawi (SUCOMA). The majority of the ethanol produced in Malawi is for gasoline blending. During 2002 to 2005 ethanol was also used to manufacture gel fuel for domestic cooking applications, but this became later uneconomical for the producers to continue. Ethanol is also exported to East African Counties and smaller amount to Mozambique, Zambia and Botswana. The electricity supply industry in Malawi is almost entirely dependent on hydropower stations on the Shire River accounting 94% (285MW) and the remaining 6% (19MW) generated from thermal plants. Electricity Supply Corporation of Malawi (ESCOM) is the national power utility responsible for generation, transmission and distribution of electricity in Malawi. Electricity in Malawi is highly subsidized, sold at 40% of its long-run-marginal-cost, to the degree that it is the cheapest cooking method in the country. Malawi imports all its petroleum requirements (241 million liters at a value of MK 12 billion in 2005). Petroleum imports constitute 8.8 percent of total Malawian imports. The volume of petroleum imported in 2005 was ten percent less than the import in 1998, but the import bill had doubled over the same period. Household energy Less than 2% of rural households use electricity for cooking. Rural households are almost totally dependent on firewood and charcoals, meeting 90% of the total energy needs and which are relatively easily accessible and freely collectible fuels. In urban areas, the cooking fuel mix is more varied and cooking fuels are generally purchased. The major cooking fuel is charcoal, followed by firewood, then electricity. Electricity is used for cooking in 11.5% of urban households. Paraffin for cooking is used by 1.2% of urban households, mostly located in Central and Southern Regions. In Malawi energy is the second highest consumption expenditure, after food, accounting for 12% of total consumption expenditure. In rural areas most money is spend on lighting. In urban areas household energy expenditures consist of a varied set of uses including cooking, lighting, electric appliances and transport. In urban areas paraffin and electricity are main sources of energy for lighting for 56% and 32% of households respectively. Only for 2% of the rural population has access to electric lighting.
iii
Key issues in the household energy sector of Malawi Key energy issues in the household sector in Malawi revolve around scarcity of energy supply to meet the demand and the associated social and environmental impacts both at household, local and global scale. One of the main issues in the household energy sector is access constraints to biomass
cooking fuels due to a diminishing resource base. Forest clearing and over exploitation of biomass as a source of fuel has reduced the areas of protected forest cover in Malawi from 45% to 21% in the last twenty five years.
Over exploitation of the forest resource base in Malawi has already made environmental
degradation prevalent. It has been reflected on every sector of socio economic development – agriculture, hydrology, wildlife and human health. For instance the decrease in water volume in Shire River, where the main hydropower plants are located, is attributed to siltation as a result of soil erosion in the basin.
Despite constraints of access, the dependency on wood fuels remains high. Collection
distances are receding for rural households while prices are rising rapidly for urban households. As eighty-four percent of all the active individuals who collected fuelwood are women, the impact is reflected more on affecting the welfare of women.
Indoor Air Pollution (IAP) as a result of solid fuel use has been reported as one of the ten
most important threats of public health. The WHO identified that in 2000 IAP was responsible for more than 1.5 million deaths globally and 2.7% of the global burden of diseases. In Malawi, biomass fuels being the main source of cooking energy for the households, the health impact due to IAP is one of the highest in the region. The World Health Organization has evaluated the national burden of disease attributable to solid fuel use in Malawi to be 5.2%.
The urban household fuel market The most widely used cooking fuel by urban households is firewood followed by charcoal and electricity with a share of 45%, 41% and 11% respectively. The percentage of households that use paraffin for cooking is 1.2% (2005). Over the decade prices of cooking fuels have increased 10 times and 7 times respectively, at a much higher rate than increases in income. Following petroleum price rises in the world market, price of paraffin in Malawi has increased by 1750% between 1996 and 2007. The retail price for paraffin is currently 125.90MK/liter and with all duties and taxes lifted, paraffin would cost 106MK/liter. Even though there is no direct subsidy in price of paraffin, the price build-up clearly shows that it has been favored in terms of lighter taxes compared to petrol and diesel fuels. Ethanol prices have also increased at exponential rate, following the world price of petroleum. In 2000 factory gate price of ethanol was 16MK/liter and at the moment it is between 120 and 125 MK/liter, which is an increase in price by about 650%. Based on current factory gate price, ethanol can be delivered to the end-users at a price of 125MK/liter and 177MK/liter tax free and tax inclusive respectively. With additional costs and retail margin end user price of gel fuel can be as high as 187MK/liter tax free and 261MK/liter with tax. But at present gel fuel is not being produced anymore in Malawi. The gel fuel that is available in supermarkets in Malawi is imported from South Africa at a retail price of 346MK per liter. The domestic tariff for electricity consumption up to 750 kWh is about 2.94MK/kWh.
iv
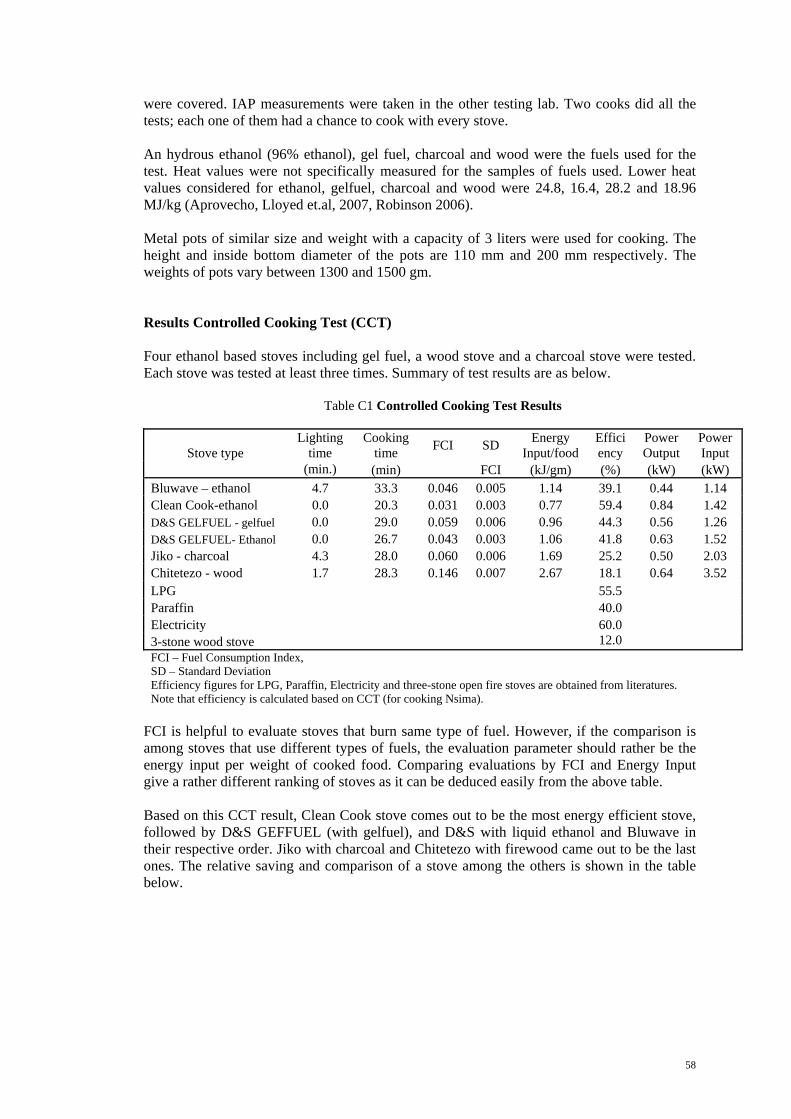
Comparative cost of cooking Comparative cost of cooking in terms of useful energy is estimated based on performances of various stoves tested cooking Nsima (maize porridge – a staple food in Malawi) as part of this assessment. Stoves tested include ethanol stoves (Bluwave, CleanCook, D&S gel fuel), improved charcoal stove (Jiko) and improved wood stove (Chitetezo Mbaula). Comparison of cost of cooking is also made with paraffin, LPG and electricity. The tests have shown that using the CleanCook stove a liter of ethanol can displace 5kg of wood, 2kg of charcoal or 0.9liter of paraffin. Comparison based on current market prices. The cheapest cooking fuel in Malawi is
electricity (1.6MK/MJ) followed by firewood using improved wood stove, Chitetozo (3.0MK/MJ). Charcoal using improved stove, Jiko (3.6MK/MJ) comes third. Paraffin (9.0MK/MJ) ranks fifth but is still the cheapest among modern liquid fuels. The CleanCook stove (12.6MK/MJ) is the cheapest ethanol stove and is cheaper than LPG (13.6MK/MJ).
Comparison based on tax free basis. On tax free basis the gap between the best performing
ethanol stove, the CC (CleanCook) stove, and paraffin narrows down but paraffin still remains cheaper than ethanol. However, the gap is slim and may disappear with expected price rise for petroleum.
If taxes are removed or lowered for ethanol while they are retained for paraffin, cooking
with ethanol will be cheaper than paraffin. The market for ethanol will then include paraffin and LPG.
Viability of ethanol as a domestic cooking fuel in Malawi The major factors that determine the market for household cooking fuels in urban areas include fuel and stove prices, safety of the fuel-stove combination, ease of use, cleanness, speed of cooking, and fuel supply certainties. The relative performance of ethanol cooking with existing alternatives is as follows.
Price: On tax free basis cooking with ethanol is only slightly more expensive than paraffin, cheaper than LPG but more than twice as expensive as charcoal and wood using the improved stoves. For this reason liquid ethanol is likely to replace only paraffin and LPG in Malawi in the short term. With the expected rise in petroleum prices, it will soon be cheaper to cook with ethanol than paraffin.
Stove prices for ethanol are significantly higher than for paraffin. However, the stove price will be within the budget of the target market (the highest expenditure quintile). In addition, various financing mechanisms are feasible to distribute the stove cost over several months.
Quality: Liquid ethanol and stoves rate high in the main quality indicators including safety, convenience and speed of cooking. The gel stove also rates high in safety and convenience but low in speed of cooking. The ethanol fuels and stoves also have very low indoor emissions (PM and CO) compared to the existing fuels and stoves. Availability: Current ethanol production in Malawi is about 18 million liters from two producers. The current demand for ethanol in Malawi for blending with petrol and for other applications is 9 to 12 million liters per year. Ethanol export from Malawi, which may be diverted to domestic cooking use, is 6 to 9 million liters per year.
v
Malawi’s particular circumstances make domestic use of ethanol very competitive. First, the export value for Malawi’s molasses should be low due to high freight costs and this favors local processing and use of Malawi’s molasses for ethanol production. Second, petroleum fuel transport into Malawi incurs high costs and this makes paraffin and other petroleum fuels very expensive and ethanol more competitive.
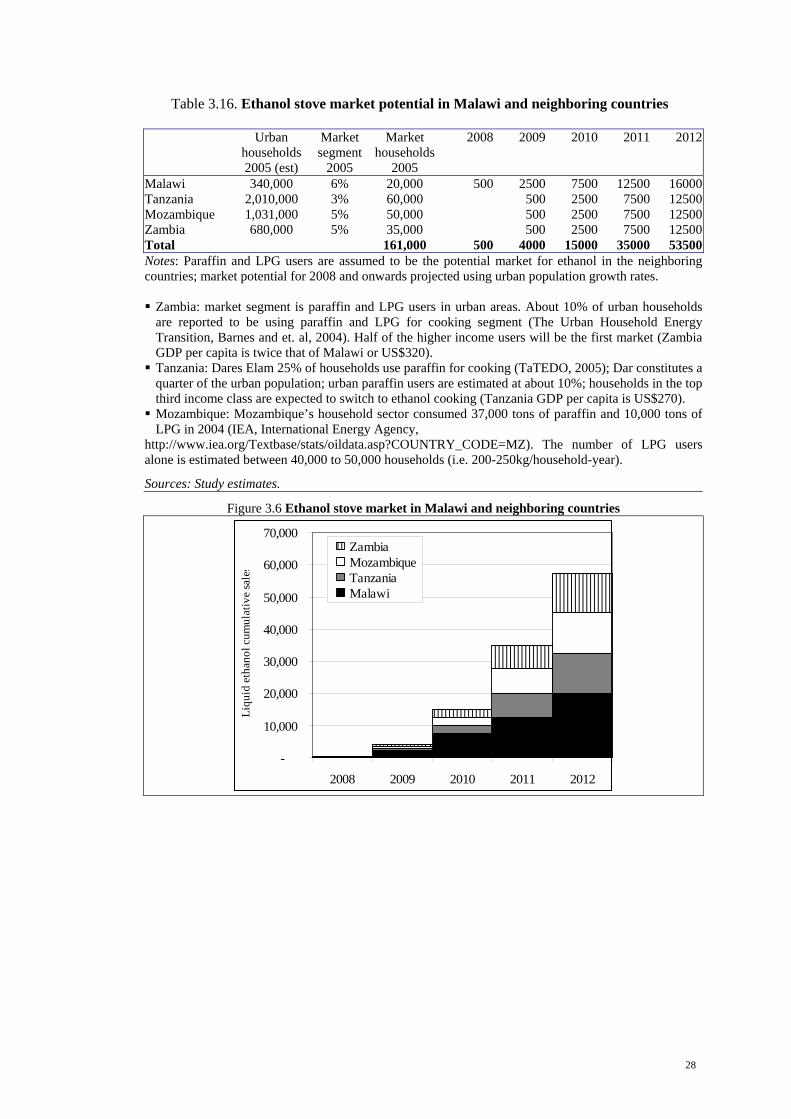
At the current market price for ethanol, the ethanol stove market segment in Malawi is only about 2% of the urban population or 7,000 households (i.e. current paraffin and LPG users). However, the price for ethanol in Malawi could be significantly lower than the current market price. In this case ethanol would become more competitive with charcoal and charcoal users in the highest quintile, about 4% of urban households or 14,000 households, may be persuaded to switch to ethanol for its quality attributes. The combined potential market for ethanol is therefore about 20,000 stoves. Ethanol fuel and stove demand in neighboring countries All Malawi’s neighbors have sugar cane based sugar industries. Although none of them are now producing ethanol all have intentions to do so in the near future. With rapidly rising petroleum prices and the global trend for increased production and use of biofuels, the incentive for ethanol production will be high and the neighboring countries can be expected to realize their plans. In the mid to long term, therefore, there will be little potential for export of ethanol from Malawi to these countries. In the neighboring countries domestic demand for ethanol as petrol blend will be smaller than ethanol production. The balance must be exported or used in other applications. Although export markets will grow in the future, supply may grow faster than demand. Consequently countries, including Malawi’s neighbors, must diversify the domestic ethanol market. The household cooking market will be the most substantial among the new markets for ethanol. As an early adopter of ethanol fuel in the region, Malawi can take advantage of its experience to position itself as supplier of ethanol stoves and lanterns to its neighbors. The potential demand for ethanol stoves in the neighboring countries (Tanzania, Mozambique and Zambia) may reach 145,000 within five years. Feasibility of ethanol fuel and stove business in Malawi Business strategy/structure: Due to the initial limited market for ethanol stove, it is suggested that stoves be imported
rather than locally produced in Malawi) Due to the initial small size of the market, it is recommended that the business to be
established combine both stove import and fuel marketing as a single business Long term fuel supply guarantee is required before setting up the new business
Investment and return of the project: The total initial investment is MK 26.5 million, 88% for fuel marketing and 12% for stove
marketing. The sources of finance used for calculations are equity capital 80 % and long-term loans 20%, respectively
The business will generate a reasonable rate of return (IRR is 23.3%, NPV at 21% discount rate is MK 6.1 million within 10 years.
vi
Economic, social and environmental benefits: Foreign exchange saving in the amount of US$2.78 million due to displacement of LPG
and paraffin imports; Foreign exchange earning of US$ 0.24 million from sale of Certified Emission
Reductions (CERs) Employment generation (27 permanent jobs) Health benefits in the form of reduced indoor air pollution Natural resource conservation due to displacement of charcoal with ethanol Stimulation of capacity expansion by ethanol producers because of the new market
Key actions required for the promotion of ethanol as cooking fuel in Malawi Three of the six objectives of the Malawi Energy Policy support the promotion of ethanol as a household cooking fuel. Government support is pledged for ethanol through fiscal incentives, R&D, and facilitation of CDM financing. These policy statements need to be translated into the following specific actions (by the Department of Energy): Awareness and market development: Promote liquid ethanol fuel and stoves in Lilongwe and Mzuzu in partnership with donors. Provide fiscal incentives for ethanol use in the household sector: Work with concerned government institutions to lower or waive taxes for ethanol stove importers and producers. The benefits for the public will be significant. Carbon finance: Seek carbon finance to use ethanol as a household cooking fuel in Malawi. Such finance can be used to cover part of the stove cost. Ethanol fuel supply guarantee: Assist the new business to obtain long-term ethanol fuels supply guarantees from ethanol producers.
vii
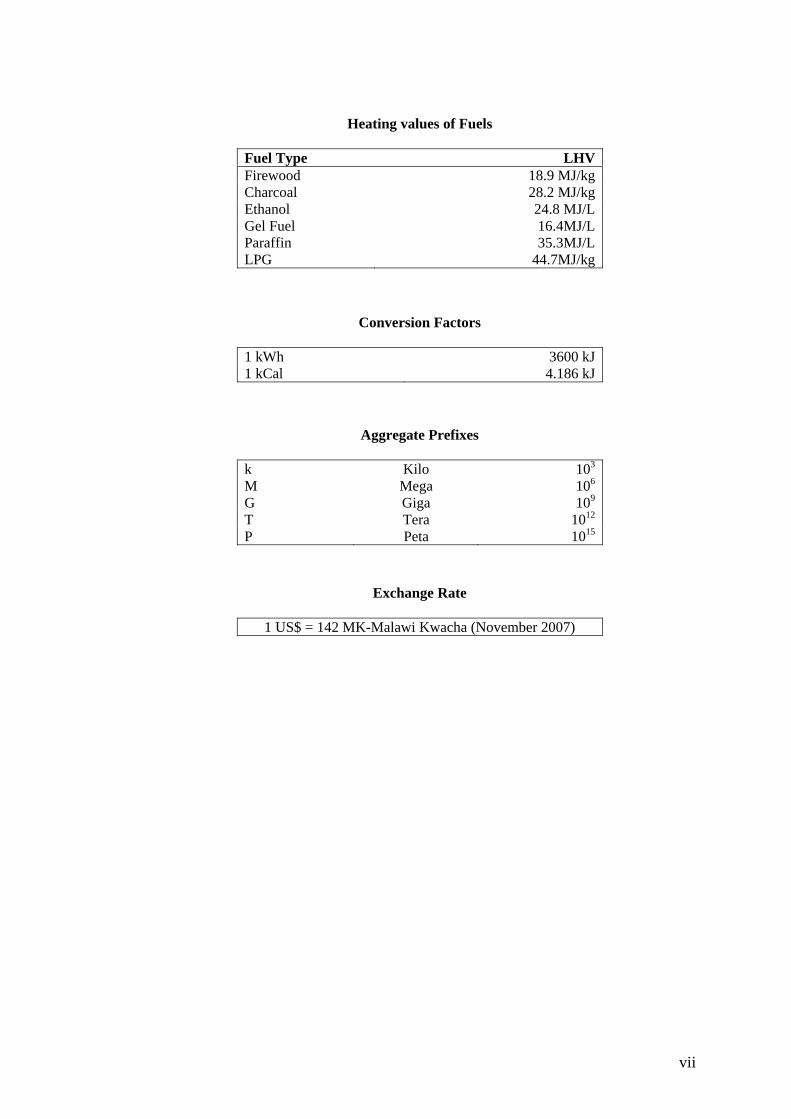
Conversion Factors
1 kWh 3600 kJ 1 kCal 4.186 kJ
Exchange Rate
1 US$ = 142 MK-Malawi Kwacha (November 2007)
Heating values of Fuels
Fuel Type LHV Firewood 18.9 MJ/kg Charcoal 28.2 MJ/kg Ethanol 24.8 MJ/L Gel Fuel 16.4MJ/L Paraffin LPG
35.3MJ/L 44.7MJ/kg
Aggregate Prefixes
k Kilo 103 M Mega 106 G Giga 109 T Tera 1012 P Peta 1015
1
1 INTRODUCTION AND BACKGROUND
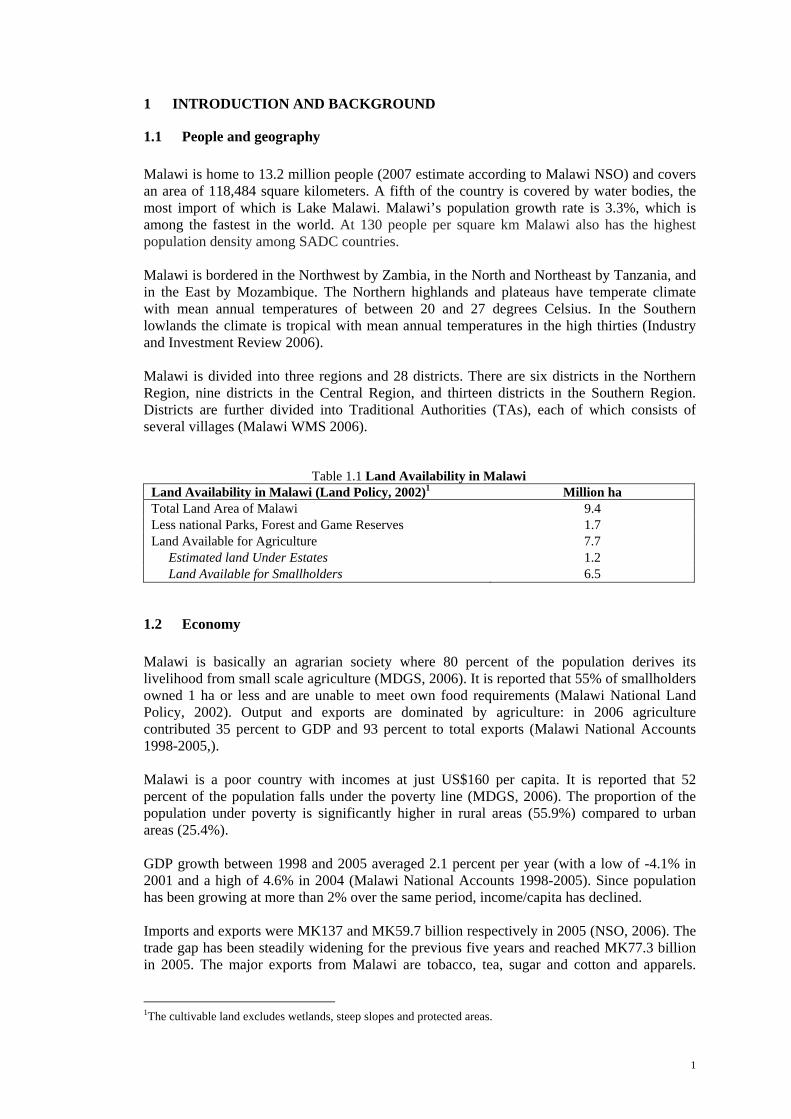
1.1 People and geography Malawi is home to 13.2 million people (2007 estimate according to Malawi NSO) and covers an area of 118,484 square kilometers. A fifth of the country is covered by water bodies, the most import of which is Lake Malawi. Malawi’s population growth rate is 3.3%, which is among the fastest in the world. At 130 people per square km Malawi also has the highest population density among SADC countries. Malawi is bordered in the Northwest by Zambia, in the North and Northeast by Tanzania, and in the East by Mozambique. The Northern highlands and plateaus have temperate climate with mean annual temperatures of between 20 and 27 degrees Celsius. In the Southern lowlands the climate is tropical with mean annual temperatures in the high thirties (Industry and Investment Review 2006). Malawi is divided into three regions and 28 districts. There are six districts in the Northern Region, nine districts in the Central Region, and thirteen districts in the Southern Region. Districts are further divided into Traditional Authorities (TAs), each of which consists of several villages (Malawi WMS 2006).
Table 1.1 Land Availability in Malawi Land Availability in Malawi (Land Policy, 2002)1 Million ha Total Land Area of Malawi 9.4 Less national Parks, Forest and Game Reserves 1.7 Land Available for Agriculture 7.7
Estimated land Under Estates 1.2 Land Available for Smallholders 6.5
1.2 Economy Malawi is basically an agrarian society where 80 percent of the population derives its livelihood from small scale agriculture (MDGS, 2006). It is reported that 55% of smallholders owned 1 ha or less and are unable to meet own food requirements (Malawi National Land Policy, 2002). Output and exports are dominated by agriculture: in 2006 agriculture contributed 35 percent to GDP and 93 percent to total exports (Malawi National Accounts 1998-2005,). Malawi is a poor country with incomes at just US$160 per capita. It is reported that 52 percent of the population falls under the poverty line (MDGS, 2006). The proportion of the population under poverty is significantly higher in rural areas (55.9%) compared to urban areas (25.4%). GDP growth between 1998 and 2005 averaged 2.1 percent per year (with a low of -4.1% in 2001 and a high of 4.6% in 2004 (Malawi National Accounts 1998-2005). Since population has been growing at more than 2% over the same period, income/capita has declined. Imports and exports were MK137 and MK59.7 billion respectively in 2005 (NSO, 2006). The trade gap has been steadily widening for the previous five years and reached MK77.3 billion in 2005. The major exports from Malawi are tobacco, tea, sugar and cotton and apparels.
1The cultivable land excludes wetlands, steep slopes and protected areas.
2
Tobacco is by far the single most important export commodity responsible for 62 percent of total exports (2005). The main imports are fuels and fertilizer. Manufacturing contributes 12 percent to Malawi’s GDP. Manufacturing output is very small at MK 1.7 billion in 2005 and it is dominated by agro-processing industries including tobacco, tea, sugar and cotton. Output contracted during 1999 to 2001 then was rising at low rates for the succeeding years then picked up in 2004. The reasons for the slow growth in output during the late nineties to 2004 were reported to be the opening of the Malawi market to external competition (South Africa, Zimbabwe), trade barriers and problems of access to capital and other inputs (NORAD, 2002).
1.3 Transport infrastructure Malawi’s transport infrastructure consists of its road network, rail system, and air links. Malawi is connected with Zambia and Tanzania through the road network and to Mozambique through the road and rail network. Link to Zimbabwe is through Mozambique. The total extent of the road network is 6500km of main and secondary roads, 7,500km of tertiary and district roads, and 1,000km of urban roads. Half of the road network is reported to be in a poor state (NORAD, 2002). Malawi is landlocked and uses ports in Mozambique, Tanzania and South Africa for its external trade. Road transport to these ports incurs high costs and this is believed to be a major constraint for external trade. Malawi’s rail network consists of a link between Lilongwe and Blantyre and to the Port of Nacala in Mozambique. Transport cost to the Nacala port by is lower compared to road transport. However, due to the poor state of the rails leading to the port, and due to limited crane capacity at the port traders prefer the Durban port. In 2005, the rail network handled about 42 percent of the freight and 0.4 percent of the passenger traffic. The contribution of rail traffic has declined by 60 percent since 2000 (Industry & Investment Review, 2006).
1.4 Malawi’s development strategies Malawi has developed two key strategies to guide its socio-economic development until 2011. In 2004 the government developed and issued the Malawi Economic Growth Strategy (MEGS) to stimulate economic growth. The main strategy was for diversification into potential growth sectors including mining, manufacturing and tourism. The private sector was recognized as the engine of growth and the government set to create conducive environment for private investment. The Malawi Growth and Development Strategy (MGDS, 2006) is Malawi’s guiding strategy to 2011. The strategic focus is on poverty reduction through sustained economic growth and infrastructure development. The MGDS identified six priority areas for action: agriculture and food security, irrigation and water development, transport infrastructure development, energy generation and supply, integrated rural development, and prevention and management of nutrition disorders, HIV and AIDS.
3
The MGDS recognizes energy to be a crucial input for industrial development. The emphasis is on increasing access to electric power for the economy through enhancing the operational efficiency of the power sector. Expected outcomes for the energy sector include increasing access to electricity from 6 to 10% by 2010 to 30% by 2020, power interconnection to the Southern Africa Power Pool (SAPP), and reduction of the share of biomass fuels in the supply mix from 90% to 75% by 2010.
1.5 The Malawi Energy Policy The goal of the 2006 Malawi Energy Policy is to promote socio-economic development and contribute to poverty reduction through sustainable provision of equitable, efficient and affordable energy services. The main objectives of the policy are Creation of an enabling environment for investment, private enterprise, and for improving
operational efficiency, Enhancement of access to efficient modern energy and to renewable energy in both rural
and urban areas, Promotion of efficient use of biomass energy and sustainable use of forest resources, Increasing the use of coal as an alternative to biomass in the household sector, and Enhancement of the operational performance of the power sector (specifically in reliability,
efficiency and effectiveness). Several of the stated objectives will be met with the large scale introduction of ethanol as a household fuel in Malawi through the private sector. Ethanol will replace biomass and petroleum fuels thus increasing households’ access to efficient and renewable energy. Substitution of biomass by ethanol will also help reduce non-sustainable forest resource extraction.
4
2 THE ENERGY SECTOR
2.1 Energy Resources Malawi is endowed with highly fertile land and various energy resources. Despite availability of other energy resources, only the biomass resource base has been over burdened supplying the greater portion of the energy requirements of the country. Energy resources with exploitable potential include hydropower, coal, uranium, and alternative source of energy such as solar and wind.
Table 2.1 Energy Resources and uses
Resource Unit Total Reserve
Exploitable potential
Current exploited
Percent exploited
Deficit
Woody biomassa2 Million tone 275.5 3.9/year 7.5 d 193% 3.6 Crop & industrial residueb
Million tone 0.14/year
Hydropowerb MW 1670 285 17% Solarb,c kWh/m2 5 5,000 SHS Windb m/s 2 - 7 Ethanold Million liter 18.8/year Coalb Million tone 1000 22 0.055/year Uraniumb Million tone 0.63 0 0%
a Sushenjit Bandyopadhyay, et.al, World Bank, 2006 b National Energy Policy, Jan 2003 c ESMAP – April 2005 d Investment Guide to Malawi, Malawi Investment Promotion Agency(MIPA, 2007) Forests are major sources of energy in Malawi, which supply the greatest portion of the country’s energy requirements in the form of firewood and charcoal. The total forest reserve in the country is estimated to be 275.5 million tones. Over dependence on woody biomass has resulted in the depletion of the natural resource base already causing profound consequences on agriculture, hydrology, water resources, wildlife, human health and on every sector of socio economic development. Biomass fuels account 93% of the total national energy supply (crop residues contributing 3% while woody biomass covers 90% of the total national energy requirement). Of the total woody biomass 59% is used in its primary form as firewood while the remaining 41% is converted into charcoal with inefficient traditional charring methods (energy policy, 2003).3 Hydropower potential is estimated to be about 1670 MW. Electricity generation from large scale hydropower projects are on Shire River with current installed capacity of 285MW meeting only 2.3% of the total demand. Contributions from other energy sources include petroleum (7.0%), ethanol (2%) and coal (Girdis, 2005). 2 Total biomass in Malawi is estimated to be 388 Million m3 (remote sensing satellite estimation in 2006). Average percentage of sustainable yield for various land categories in the 1990 estimate was used to calculate the current biomass sustainable yield. Wood density of 0.71 tone/m3 is used to convert unit from cubic meter to tone. 3 Traditional charcoal production method has very low conversion efficiency between 12% and 14%.
5
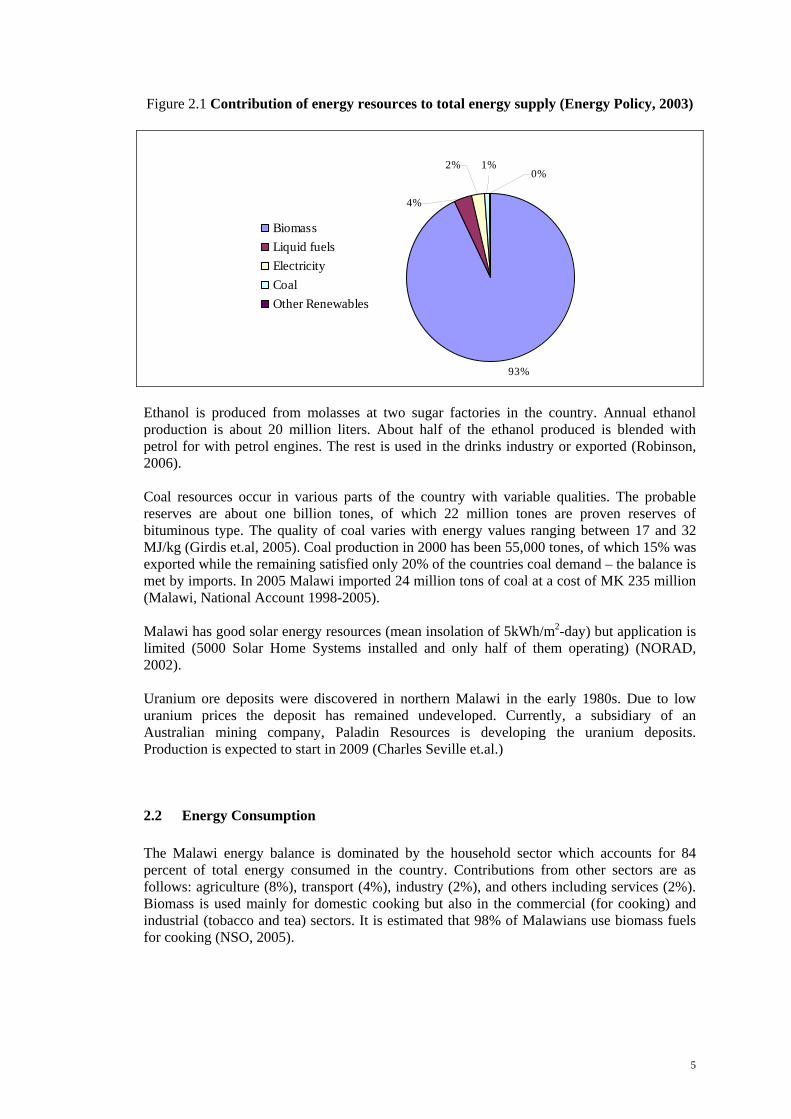
Figure 2.1 Contribution of energy resources to total energy supply (Energy Policy, 2003)
Ethanol is produced from molasses at two sugar factories in the country. Annual ethanol production is about 20 million liters. About half of the ethanol produced is blended with petrol for with petrol engines. The rest is used in the drinks industry or exported (Robinson, 2006). Coal resources occur in various parts of the country with variable qualities. The probable reserves are about one billion tones, of which 22 million tones are proven reserves of bituminous type. The quality of coal varies with energy values ranging between 17 and 32 MJ/kg (Girdis et.al, 2005). Coal production in 2000 has been 55,000 tones, of which 15% was exported while the remaining satisfied only 20% of the countries coal demand – the balance is met by imports. In 2005 Malawi imported 24 million tons of coal at a cost of MK 235 million (Malawi, National Account 1998-2005). Malawi has good solar energy resources (mean insolation of 5kWh/m2-day) but application is limited (5000 Solar Home Systems installed and only half of them operating) (NORAD, 2002). Uranium ore deposits were discovered in northern Malawi in the early 1980s. Due to low uranium prices the deposit has remained undeveloped. Currently, a subsidiary of an Australian mining company, Paladin Resources is developing the uranium deposits. Production is expected to start in 2009 (Charles Seville et.al.)
2.2 Energy Consumption The Malawi energy balance is dominated by the household sector which accounts for 84 percent of total energy consumed in the country. Contributions from other sectors are as follows: agriculture (8%), transport (4%), industry (2%), and others including services (2%). Biomass is used mainly for domestic cooking but also in the commercial (for cooking) and industrial (tobacco and tea) sectors. It is estimated that 98% of Malawians use biomass fuels for cooking (NSO, 2005).
6
Figure 2.2 Distribution of energy consumption by sector (Energy Policy 2003)
84%
8%4% 2%2%
HouseholdAgrecultureTransportIndustryOther
2.2.1 Woodfuel According to the 2006 remote sensing data, much of the biomass resource in Malawi is in the northern region which is actually the least populated region compared to the rest of the country. The northern region accounts 41% of the total biomass available in the region. This amounts 159 million cubic meters (about 113 million tones) of biomass. The central and southern regions are densely populated areas but with lower percentage of biomass amounting 105 and 58 million tones respectively4. Of the total biomass energy supply 97% is woody biomass in the form of firewood and charcoal. The remaining three percent is mainly crop and factory residues. Nearly 70% of the woody biomass supply goes to the household sector (58% rural and 12% urban) while the remaining 30% is absorbed by services and industries such as tobacco processing, tea estates, brick making, fish smoking and other small-scale industries (Energy Policy, 2003). The household sector alone consumes 7.5 million tones of woody biomass exceeding sustainable supply by 3.7 million tones (MIPA, 2006). In other words the sustainable supply of woody biomass in the country is 3.8 million tones per year. This estimation is very much similar to the estimation made in this report based on the 2006 remote sensing data for forest coverage and the 1990 estimate for sustainable yield for various categories of land (Table 2). Based on the amount and proportion of annual woody biomass consumption by the households, the consumption by industries and other services were estimated5. The estimation of total woody biomass consumption by all sectors adds up to be 10.71 million tones per year. This is more alarming, as according to these calculations the deficit would in fact be 6.8 million tones6 per year instead of 3.7. For this reason the government should not only promote market viable alternative fuels but also put special support for the alternatives as they bear the costs if biomass is otherwise used. 4 Available biomass is converted into million tones to maintain same unit throughout. 5 Household sector consumes 70% of total biomass and this amounts to be 7.5 million tones. 6 Various studies give different figures for total annual fuelwood consumption in Malawi. Estimations quoted by Sam Kainja, 2000 indicated consumption figure as high as 12 million tones per year for 1990.
7
Supply of woody biomass by land category Estimation of fuel wood supply by land category in terms of providing sustainable supply of woody biomass is shown below. Estimation was based on the 1990 study for the percentage of sustainable supply by land and applied to the 2006 satellite estimation. This however should be taken with care as the rate of depletion varies from place to place with the greater amount happening in the northern region.
Table 2.2 Sustainable supply of biomass by category of land
Category of Land Contribution to sustainable supply
Sustainable supply (mill. Tone/yr)
Private forest plantation (Own woodlot) 5% 0.2
Government forest plantation (Community woodlot) 16% 0.6 Forest Reserve 23% 0.9 Customary Land (Unframed areas of community) 56% 2.2
TOTAL 3.9 Note: Names for category of land in brackets are as used by Bandyopadhyay, et.al, 2006.
Note also that supply from private plantation in the Northern region was missing in the estimation made in 19907. However, this can still indicate potentials of each land categories in terms of providing fuel wood. The degradation of the biomass resource base has occurred most in the biomass rich north and in lesser extend in the central and southern regions which had less forests in them as they are relatively more densely populated (Bandyopadhyay, et.al).
2.2.2 Ethanol Fuel Current production and supply Following Zimbabwe, Malawi was the second country in Africa to start blending ethanol with gasoline. Malawi has been producing ethanol since the establishment of ETHCO in 1982 with annual production varying between 10 and 20 million liters depending on availability of molasses and requirement of ethanol for petrol blending. The second ethanol producing company was commissioned in 2004 with production capacity of 14 million liters per year (Liwimbi). In both factories ethanol is produced from fermentation of molasses which is the bye product of the sugar estates. Production of ethanol in Malawi reaches 17.9 million liters with Ethanol Company Ltd (ETHCO) and Press Cane Ltd contributing 5.4 and 12.5 million liters per year respectively (Owen 2006). Each of these companies has potential to produce 16 to 18 million liters per year (MIPA, Investor’s Guide, 2007). The expanded capacity for ethanol by the two factories has resulted in insufficient domestic supply of molasses. Malawi at times has had to import molasses from the neighboring countries, Mozambique and Zambia. Gasoline blending is not compulsory in Malawi. About 95% of gasoline consumed in Malawi is blended with ethanol. The blending ratio was 20% but now reduced to 10% with the
7 In the Energy Policy (2003) document, data for sustainable supply of fuel wood from the northern regions for the 1990 estimation was missing.
8
unleaded gasoline leaving the surplus to be used in the local industries and export (Johnson et.al, 2007). ETHCO in the last two years exported almost half of its ethanol mainly to East African Counties and smaller amount to Mozambique, Zambia and Botswana (Liwimbi)8. Local consumption of ethanol apart from gasoline blending is basically for liquor industries and medical uses. In the past, from 2002 to 2005, ethanol had been used to manufacture gel fuel for domestic cooking applications which later becomes uneconomical for the manufacturers to continue. There is no enough information to estimate the total amount of gel fuel manufactured or amount of ethanol supplied for this purpose in those years. Use of ethanol in its liquid form has never been practiced in Malawi as appropriate stoves were not available on the market. Ownership of the sugar estates and ethanol producing companies in Malawi Illovo Sugar Ltd. and Sugar Corporation of Malawi (SUCOMA) own the mills and refineries in the two sugar estates at Nchalo and Dwangwa. The sugar industry in Malawi is dominated by Illova Sugar Ltd. acquiring a control of 76% ownership. The remaining 24% share of SUCOMA is public and institutional (14%) and old mutual (10%). The sugar estates themselves supply 90% sugar cane for the two industries while the remaining 10% is supplied by out-growers schemes to the Dwangwa and Nchalo mills. Dwangwa Cane Growers Ltd. and Kasinthula Cane Greowers Ltd. are out-grower schemes associated with the operations of the two mills (Record, et.al. 2005).
2.2.3 Electricity The electricity supply industry in Malawi is almost entirely dependent on hydropower stations on the Shire River accounting 94% (285MW) and the remaining 6% (19MW) generated from thermal plants. Electricity Supply Corporation of Malawi (ESCOM) is the national power utility which was incorporated as a limited liability Company. It is owned almost wholly by the Government of Malawi (99%), while the remaining share of 1% is held by Malawi Development Corporation. ESCOM is characterized by a relatively poor performance with frequent outages and high system loses. Major capacity problems are foreseen in the power plants on the Shire River as the water flow in the river appears to be declining (ESMAP 2005). This could be mainly due to siltation as a result of massive deforestation and associated soil erosions. Electricity in Malawi is being sold at 40% (ESMAP 2005) of its long-run marginal cost, and hence ESCOM is unable to recover its costs let alone earning profit – the main attribute to ESCOM’s low performance and difficulty in increasing access to non-electrified areas in the country. Electricity is highly subsidized to the degree that it is the cheapest cooking fuel in the country for those who are connected. See also section about comparative cooking costs. The justification given by the Government of Malawi for subsidizing electricity was to make it affordable for the poor to be used for lighting purposes. However, as the great majority of the poor are not connected much of the subsidy goes to the middle to high income category customers. 8 Production of ethanol by ETHCO for the years 2004, 2005 and 2006 was 7.8, 6.6 and 6.4 million liters respectively; export of ethanol in the same order of years was 4.1, 3.0 and 2.6 million liters respectively (ETHCO, 2007).
9
2.2.4 Petroleum Malawi imports all its petroleum requirements (241 million liters and MK12 billion in 2005). Petroleum imports constitute 8.8 percent of total Malawian imports. The volume of petroleum imported in 2005 was ten percent less than the import in 1998 but the import costs have grown by 12 times over the same period9.
Figure 2.3 Volume of petroleum fuel imports and values
0
50
100
150
200
250
300
1998
1999
2000
2001
2002
2003
2004
2005
Vol
ume
of im
port
(Mill
ion
Lite
rs)
0
2,000
4,000
6,000
8,000
10,000
12,000
14,000
Val
ue o
f im
ports
(Mill
ion
MK
)
Petrol ParaffinDiesel & other Value
Paraffin Paraffin is the main source of fuel for lighting for 81% of households. Use of paraffin for cooking in Malawi is not very common (WMS 2006). Only 1.2% of urban households use paraffin for cooking (HIS 2004-2005). In the past, the government used to subsidize paraffin with the intention that it would be affordable for more households for cooking so that it would relieve the burden on the forest resource to a certain extent. However, the government had to stop the subsidy (in 1998) as it has been abused as the low price encouraged smuggling of the product to the neighboring countries (PAESP, 2006).
9 Over the same period exchange rate of Malawian Kwacha depreciated from 20MK to 118MK to a dollar. In real dollar terms the petroleum import costs have grown two times.
10
3 THE HOUSEHOLD ENERGY SECTOR With the current population of 13.2 million people (2007 estimate according to Malawi NSO), there are an estimated 2.7 million households in Malawi. In terms of energy consumption the household sector takes 84% of the total share, of which 98% comes from biomass resources. The remaining 2% comes from modern energy sources such as electricity and paraffin. Firewood is the main source of energy for cooking in the households accounting 90% of the total energy needs. The urban population in Malawi of about 16% of the total population is concentrated in four major towns, Blantyre, Lilongwe, Mzuzu and Zomba. These four towns together account for 80% of the urban population. In terms of cooking fuel consumption, charcoal and firewood are almost equally the most important fuels for urban households, while firewood is virtually the single source of cooking energy in rural households. Only 2% of rural households use charcoal for cooking – perhaps simply collected from the fireplace after the fire has been extinguished. Electricity for cooking is used only in 11.5% and paraffin by 1.2% of the urban households. , which are mostly located in Central and Southern Regions. For eighty-one percent of Malawian households paraffin is a major source of fuel for lighting. In urban areas paraffin and electricity are main sources of energy for lighting for 56% and 32% of households respectively. Because of limited access to electricity in rural areas, use of electricity for lighting is possible only for 2% of the rural population (WMS, 2006).
3.1 Key energy issues in the household sector Like in many developing countries key energy issues in the household sector in Malawi revolve around scarcity of energy supply to meet the demand and the associated social and environmental impacts both at household, local and global scale. One of the main issues in the household energy sector is the supply constraint of cooking fuel because of diminishing of the resource base. Forest clearing and over exploitation of biomass as a source of fuel reduced the areas of protected forest cover in Malawi from 45% to 21% in the last two and a half decades (MIPA, 2007)10. It has been argued that the major cause of deforestation is clearing of forests for agricultural and settlement expansion. However, exploitation of biomass on diminishing resource base and fuelwood consumption in high population density areas (over the sustainable supply) would also have aggravated deforestation. In Malawi much of deforestation is happening in the biomass rich and less populated north of the country. Despite scarcity of woody biomass fuels, dependency on firewood and charcoal still remains to be high in Malawi. Access to modern and affordable alternative fuels has always been distant for most Malawian households. Paraffin was widely used in urban areas in the past until the subsidy was removed and the fuel became more expensive to cook with. Because of this, households made a shift back to traditional fuels. The coping mechanisms of households for the prevalent fuel wood scarcity is by paying higher prices (in urban areas), increasing the fuel collection time and reduce frequency of collection with the later causing fuel wood collector subject to heavy loads. As eighty-four
10 About 57 percent of the forest area is estimated to have been lost between 1972 and 1992.
11
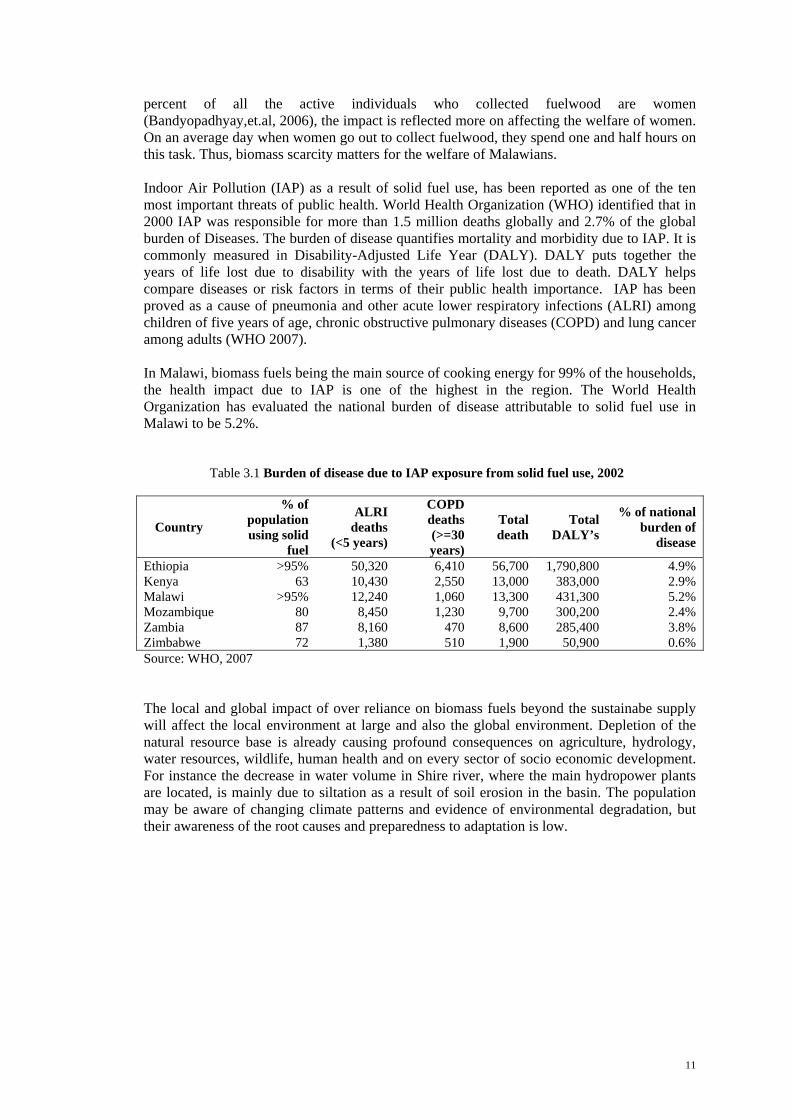
percent of all the active individuals who collected fuelwood are women (Bandyopadhyay,et.al, 2006), the impact is reflected more on affecting the welfare of women. On an average day when women go out to collect fuelwood, they spend one and half hours on this task. Thus, biomass scarcity matters for the welfare of Malawians. Indoor Air Pollution (IAP) as a result of solid fuel use, has been reported as one of the ten most important threats of public health. World Health Organization (WHO) identified that in 2000 IAP was responsible for more than 1.5 million deaths globally and 2.7% of the global burden of Diseases. The burden of disease quantifies mortality and morbidity due to IAP. It is commonly measured in Disability-Adjusted Life Year (DALY). DALY puts together the years of life lost due to disability with the years of life lost due to death. DALY helps compare diseases or risk factors in terms of their public health importance. IAP has been proved as a cause of pneumonia and other acute lower respiratory infections (ALRI) among children of five years of age, chronic obstructive pulmonary diseases (COPD) and lung cancer among adults (WHO 2007). In Malawi, biomass fuels being the main source of cooking energy for 99% of the households, the health impact due to IAP is one of the highest in the region. The World Health Organization has evaluated the national burden of disease attributable to solid fuel use in Malawi to be 5.2%.
Table 3.1 Burden of disease due to IAP exposure from solid fuel use, 2002
Country
% of population using solid
fuel
ALRI deaths
(<5 years)
COPD deaths (>=30 years)
Total death
Total DALY’s
% of national burden of
disease
Ethiopia >95% 50,320 6,410 56,700 1,790,800 4.9% Kenya 63 10,430 2,550 13,000 383,000 2.9% Malawi >95% 12,240 1,060 13,300 431,300 5.2% Mozambique 80 8,450 1,230 9,700 300,200 2.4% Zambia 87 8,160 470 8,600 285,400 3.8% Zimbabwe 72 1,380 510 1,900 50,900 0.6% Source: WHO, 2007 The local and global impact of over reliance on biomass fuels beyond the sustainabe supply will affect the local environment at large and also the global environment. Depletion of the natural resource base is already causing profound consequences on agriculture, hydrology, water resources, wildlife, human health and on every sector of socio economic development. For instance the decrease in water volume in Shire river, where the main hydropower plants are located, is mainly due to siltation as a result of soil erosion in the basin. The population may be aware of changing climate patterns and evidence of environmental degradation, but their awareness of the root causes and preparedness to adaptation is low.
12
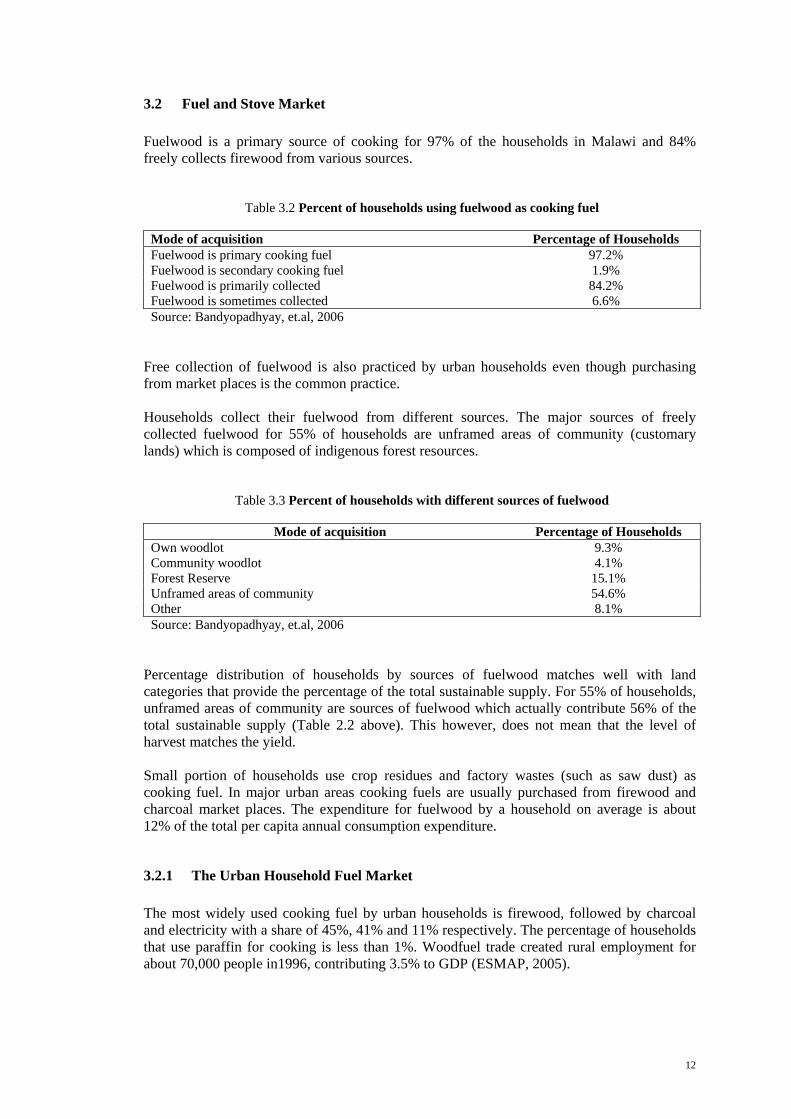
3.2 Fuel and Stove Market Fuelwood is a primary source of cooking for 97% of the households in Malawi and 84% freely collects firewood from various sources.
Table 3.2 Percent of households using fuelwood as cooking fuel
Mode of acquisition Percentage of Households Fuelwood is primary cooking fuel 97.2% Fuelwood is secondary cooking fuel 1.9% Fuelwood is primarily collected 84.2% Fuelwood is sometimes collected 6.6% Source: Bandyopadhyay, et.al, 2006
Free collection of fuelwood is also practiced by urban households even though purchasing from market places is the common practice. Households collect their fuelwood from different sources. The major sources of freely collected fuelwood for 55% of households are unframed areas of community (customary lands) which is composed of indigenous forest resources.
Table 3.3 Percent of households with different sources of fuelwood
Mode of acquisition Percentage of Households Own woodlot 9.3% Community woodlot 4.1% Forest Reserve 15.1% Unframed areas of community 54.6% Other 8.1% Source: Bandyopadhyay, et.al, 2006
Percentage distribution of households by sources of fuelwood matches well with land categories that provide the percentage of the total sustainable supply. For 55% of households, unframed areas of community are sources of fuelwood which actually contribute 56% of the total sustainable supply (Table 2.2 above). This however, does not mean that the level of harvest matches the yield. Small portion of households use crop residues and factory wastes (such as saw dust) as cooking fuel. In major urban areas cooking fuels are usually purchased from firewood and charcoal market places. The expenditure for fuelwood by a household on average is about 12% of the total per capita annual consumption expenditure.
3.2.1 The Urban Household Fuel Market The most widely used cooking fuel by urban households is firewood, followed by charcoal and electricity with a share of 45%, 41% and 11% respectively. The percentage of households that use paraffin for cooking is less than 1%. Woodfuel trade created rural employment for about 70,000 people in1996, contributing 3.5% to GDP (ESMAP, 2005).
13
Over the years prices of cooking fuels have increased significantly at much higher rate than increases in income. During the last decade prices of firewood and charcoal have increased by 1000% and 736% respectively.
Figure 3.1 Price of firewood and charcoal over the years
0
5
10
15
20
25
30
1980 1985 1990 1995 2000 2005 2010
Year
Pric
e (M
K/kg
)
Firewood Charcoal
Source: Economic Report 2002 and Malawi Pricing Study, 1992
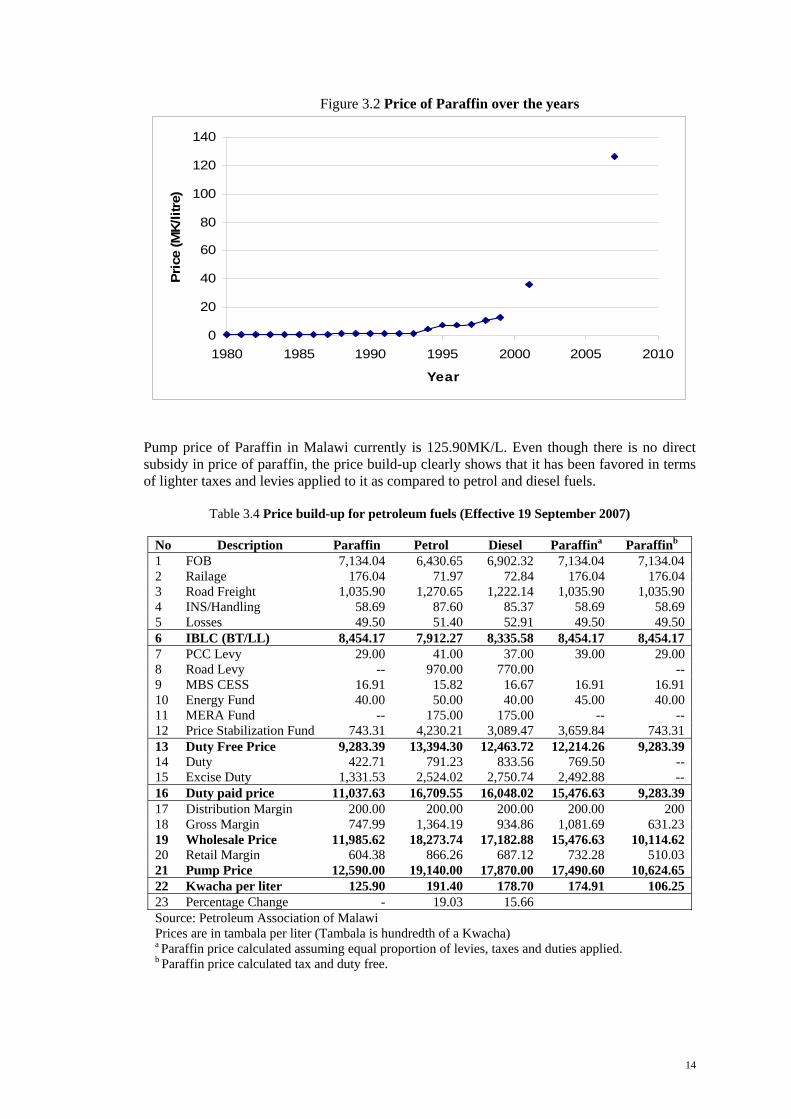
Such high increase of price in fuelwood can be partly contributed to general inflation trends in the country but perhaps is more due to the increased scarcity of fuelwood near urban areas compared to earlier days. One thing to be sure is that such high increases of fuel wood prices are not intentionally meant to narrow the gap between the actual prices and the real economic cost of the fuels. In the past the government of Malawi has put much effort to encourage and promote private fuel wood plantations, but at the end these were not successful. Paraffin used to be subsidized in the past. Even though direct subsidies are lifted, the current price of paraffin is still much lower than that of diesel and petrol, because of lower tax rates and levies applied to it. Following petroleum prices in the world market, price of paraffin in Malawi has increased by 1750% between the year 1996 and 2007.
14
Figure 3.2 Price of Paraffin over the years
0
20
40
60
80
100
120
140
1980 1985 1990 1995 2000 2005 2010
Year
Pric
e (M
K/lit
re)
Pump price of Paraffin in Malawi currently is 125.90MK/L. Even though there is no direct subsidy in price of paraffin, the price build-up clearly shows that it has been favored in terms of lighter taxes and levies applied to it as compared to petrol and diesel fuels.
Table 3.4 Price build-up for petroleum fuels (Effective 19 September 2007)
No Description Paraffin Petrol Diesel Paraffina Paraffinb 1 FOB 7,134.04 6,430.65 6,902.32 7,134.04 7,134.04 2 Railage 176.04 71.97 72.84 176.04 176.04 3 Road Freight 1,035.90 1,270.65 1,222.14 1,035.90 1,035.90 4 INS/Handling 58.69 87.60 85.37 58.69 58.69 5 Losses 49.50 51.40 52.91 49.50 49.50 6 IBLC (BT/LL) 8,454.17 7,912.27 8,335.58 8,454.17 8,454.17 7 PCC Levy 29.00 41.00 37.00 39.00 29.00 8 Road Levy -- 970.00 770.00 -- 9 MBS CESS 16.91 15.82 16.67 16.91 16.91 10 Energy Fund 40.00 50.00 40.00 45.00 40.00 11 MERA Fund -- 175.00 175.00 -- -- 12 Price Stabilization Fund 743.31 4,230.21 3,089.47 3,659.84 743.31 13 Duty Free Price 9,283.39 13,394.30 12,463.72 12,214.26 9,283.39 14 Duty 422.71 791.23 833.56 769.50 -- 15 Excise Duty 1,331.53 2,524.02 2,750.74 2,492.88 -- 16 Duty paid price 11,037.63 16,709.55 16,048.02 15,476.63 9,283.39 17 Distribution Margin 200.00 200.00 200.00 200.00 200 18 Gross Margin 747.99 1,364.19 934.86 1,081.69 631.23 19 Wholesale Price 11,985.62 18,273.74 17,182.88 15,476.63 10,114.62 20 Retail Margin 604.38 866.26 687.12 732.28 510.03 21 Pump Price 12,590.00 19,140.00 17,870.00 17,490.60 10,624.65 22 Kwacha per liter 125.90 191.40 178.70 174.91 106.25 23 Percentage Change - 19.03 15.66 Source: Petroleum Association of Malawi Prices are in tambala per liter (Tambala is hundredth of a Kwacha) a Paraffin price calculated assuming equal proportion of levies, taxes and duties applied. b Paraffin price calculated tax and duty free.
15
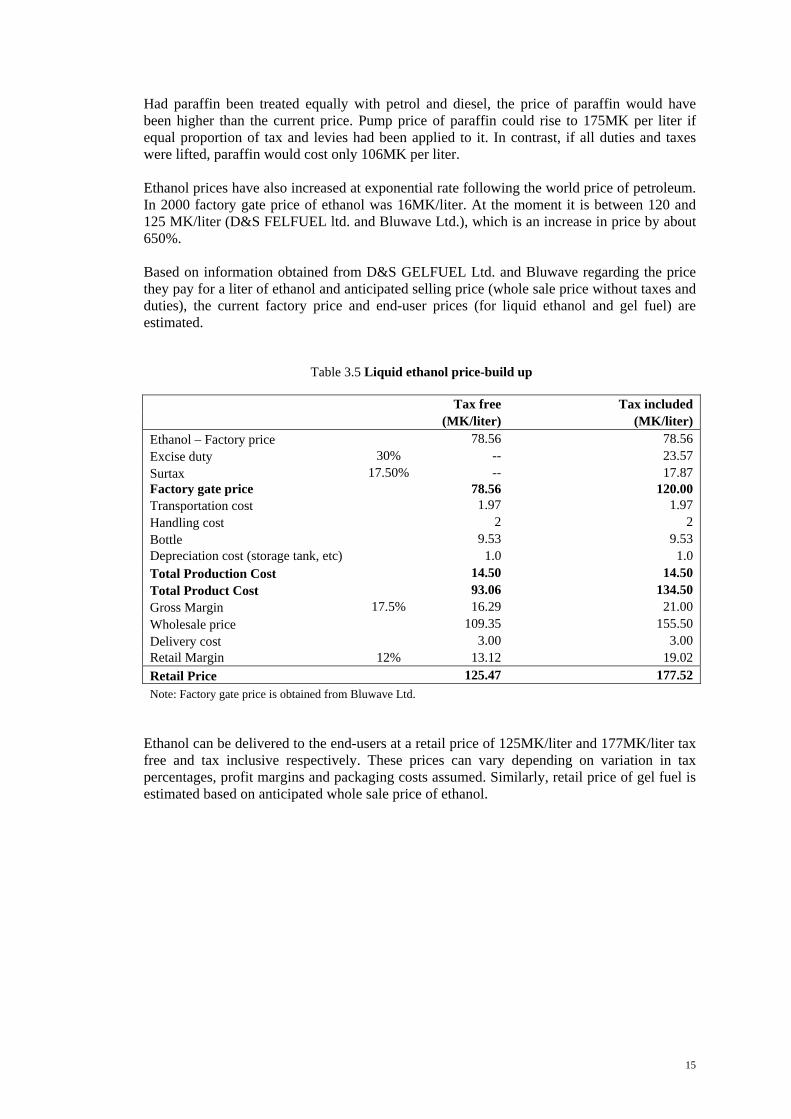
Had paraffin been treated equally with petrol and diesel, the price of paraffin would have been higher than the current price. Pump price of paraffin could rise to 175MK per liter if equal proportion of tax and levies had been applied to it. In contrast, if all duties and taxes were lifted, paraffin would cost only 106MK per liter. Ethanol prices have also increased at exponential rate following the world price of petroleum. In 2000 factory gate price of ethanol was 16MK/liter. At the moment it is between 120 and 125 MK/liter (D&S FELFUEL ltd. and Bluwave Ltd.), which is an increase in price by about 650%. Based on information obtained from D&S GELFUEL Ltd. and Bluwave regarding the price they pay for a liter of ethanol and anticipated selling price (whole sale price without taxes and duties), the current factory price and end-user prices (for liquid ethanol and gel fuel) are estimated.
Ethanol can be delivered to the end-users at a retail price of 125MK/liter and 177MK/liter tax free and tax inclusive respectively. These prices can vary depending on variation in tax percentages, profit margins and packaging costs assumed. Similarly, retail price of gel fuel is estimated based on anticipated whole sale price of ethanol.
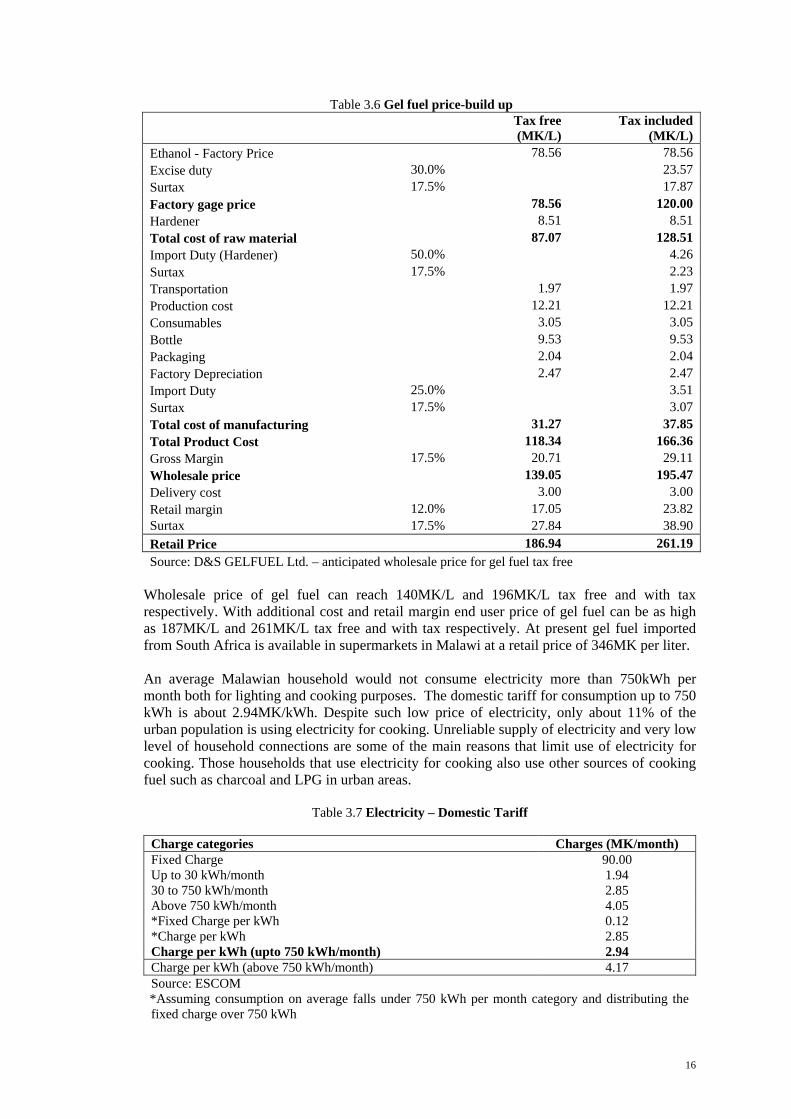
Wholesale price of gel fuel can reach 140MK/L and 196MK/L tax free and with tax respectively. With additional cost and retail margin end user price of gel fuel can be as high as 187MK/L and 261MK/L tax free and with tax respectively. At present gel fuel imported from South Africa is available in supermarkets in Malawi at a retail price of 346MK per liter. An average Malawian household would not consume electricity more than 750kWh per month both for lighting and cooking purposes. The domestic tariff for consumption up to 750 kWh is about 2.94MK/kWh. Despite such low price of electricity, only about 11% of the urban population is using electricity for cooking. Unreliable supply of electricity and very low level of household connections are some of the main reasons that limit use of electricity for cooking. Those households that use electricity for cooking also use other sources of cooking fuel such as charcoal and LPG in urban areas.
Table 3.7 Electricity – Domestic Tariff
Charge categories Charges (MK/month) Fixed Charge 90.00 Up to 30 kWh/month 1.94 30 to 750 kWh/month 2.85 Above 750 kWh/month 4.05 *Fixed Charge per kWh 0.12 *Charge per kWh 2.85 Charge per kWh (upto 750 kWh/month) 2.94 Charge per kWh (above 750 kWh/month) 4.17 Source: ESCOM *Assuming consumption on average falls under 750 kWh per month category and distributing the fixed charge over 750 kWh
17
3.3 Comparative Cooking Costs Comparative cooking costs for households in Malawi are based useful energy costs for preparation of typical Malawian diet called Nsima, which is thick maize porridge. As part of this feasibility study, Controlled Cooking Tests (CCT) were conducted on several types of stoves and fuels including firewood, charcoal, ethanol and gel-fuel – the results (efficiency and useful energy) are used to compare costs of cooking. Due to shortage of time, CCT could not be conducted using paraffin, LPG and electricity. However, based on average energy output obtained from the CCTs and efficiency of the stoves from literature, useful energy for the preparation of Nsima is calculated for the purpose of comparison.
18
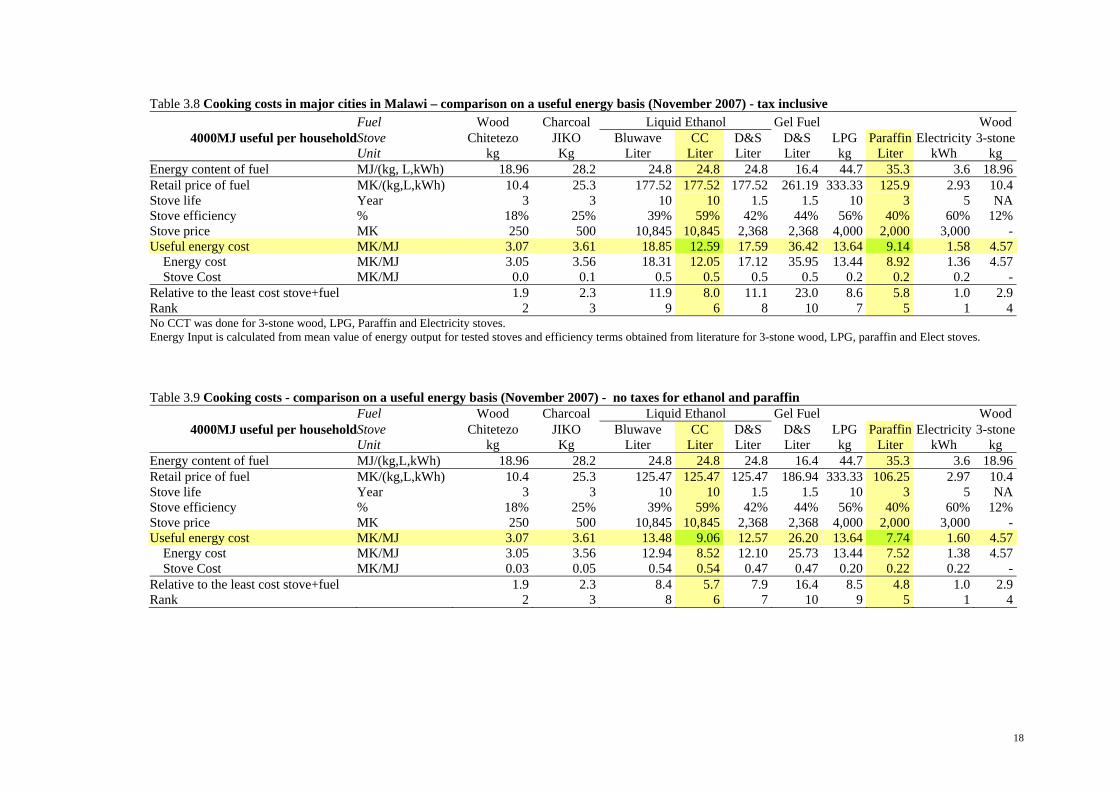
Table 3.8 Cooking costs in major cities in Malawi – comparison on a useful energy basis (November 2007) - tax inclusive Fuel Wood Charcoal Liquid Ethanol Gel Fuel Wood
4000MJ useful per household Stove Chitetezo JIKO Bluwave CC D&S D&S LPG Paraffin Electricity 3-stone Unit kg Kg Liter Liter Liter Liter kg Liter kWh kg Energy content of fuel MJ/(kg, L,kWh) 18.96 28.2 24.8 24.8 24.8 16.4 44.7 35.3 3.6 18.96 Retail price of fuel MK/(kg,L,kWh) 10.4 25.3 177.52 177.52 177.52 261.19 333.33 125.9 2.93 10.4 Stove life Year 3 3 10 10 1.5 1.5 10 3 5 NA Stove efficiency % 18% 25% 39% 59% 42% 44% 56% 40% 60% 12% Stove price MK 250 500 10,845 10,845 2,368 2,368 4,000 2,000 3,000 - Useful energy cost MK/MJ 3.07 3.61 18.85 12.59 17.59 36.42 13.64 9.14 1.58 4.57
Relative to the least cost stove+fuel 1.9 2.3 11.9 8.0 11.1 23.0 8.6 5.8 1.0 2.9 Rank 2 3 9 6 8 10 7 5 1 4 No CCT was done for 3-stone wood, LPG, Paraffin and Electricity stoves. Energy Input is calculated from mean value of energy output for tested stoves and efficiency terms obtained from literature for 3-stone wood, LPG, paraffin and Elect stoves. Table 3.9 Cooking costs - comparison on a useful energy basis (November 2007) - no taxes for ethanol and paraffin Fuel Wood Charcoal Liquid Ethanol Gel Fuel Wood
4000MJ useful per household Stove Chitetezo JIKO Bluwave CC D&S D&S LPG Paraffin Electricity 3-stone Unit kg Kg Liter Liter Liter Liter kg Liter kWh kg Energy content of fuel MJ/(kg,L,kWh) 18.96 28.2 24.8 24.8 24.8 16.4 44.7 35.3 3.6 18.96 Retail price of fuel MK/(kg,L,kWh) 10.4 25.3 125.47 125.47 125.47 186.94 333.33 106.25 2.97 10.4 Stove life Year 3 3 10 10 1.5 1.5 10 3 5 NA Stove efficiency % 18% 25% 39% 59% 42% 44% 56% 40% 60% 12% Stove price MK 250 500 10,845 10,845 2,368 2,368 4,000 2,000 3,000 - Useful energy cost MK/MJ 3.07 3.61 13.48 9.06 12.57 26.20 13.64 7.74 1.60 4.57
Relative to the least cost stove+fuel 1.9 2.3 8.4 5.7 7.9 16.4 8.5 4.8 1.0 2.9 Rank 2 3 8 6 7 10 9 5 1 4
19
Cooking cost comparison assumes current prices of fuels and stoves in urban areas. For Ethanol and gel fuel, a scenario is included for the case whereby the stoves and fuels were exempted from taxes and duties (Table 3.9). The findings are as follows: The cheapest cooking fuel is electricity followed by firewood using improved wood
stove, Chitetozo Mbaula. Charcoal using improved stove, Jiko comes at the third place being cheaper than wood used with the traditional three-stone stove. Paraffin ranks fifth but still is the cheapest among modern liquid fuels. CleanCook stove, CC is the cheapest of the ethanol based fuels with cooking costs slightly cheaper than that of LPG. Bluwave and D&S gel fuel stoves are the last two in terms of cooking costs. The high price of gel fuel is the main reason for high cost of cooking for D&S gel fuel stove.
Even though prices of the CleanCook stove is considerably higher than the other ethanol
stoves, its longer life time, higher efficiency and the relative high ethanol price gives it the lowest overall cooking cost. In cases where the fuel prices are very low the proportion of the stove cost becomes more substantial. As the domestic tariff for electricity is very low, the proportion of the electric stove (hot plate) comes out to be between 30 to 40% of the overall cooking cost. The next cheaper modern cooking fuel is paraffin – with the stove cost contributing about 3% of the total cooking cost.
Costs of stoves could be prohibitively high for low and middle income households though
the distributed share of their costs seems to be very low. D&S GELFUL stove is a low priced stove which burns ethanol by putting a ceramic fiber pad inside the container to prevent spillage of fuel. In terms of performance it is comparable with that of Bluwave stove.
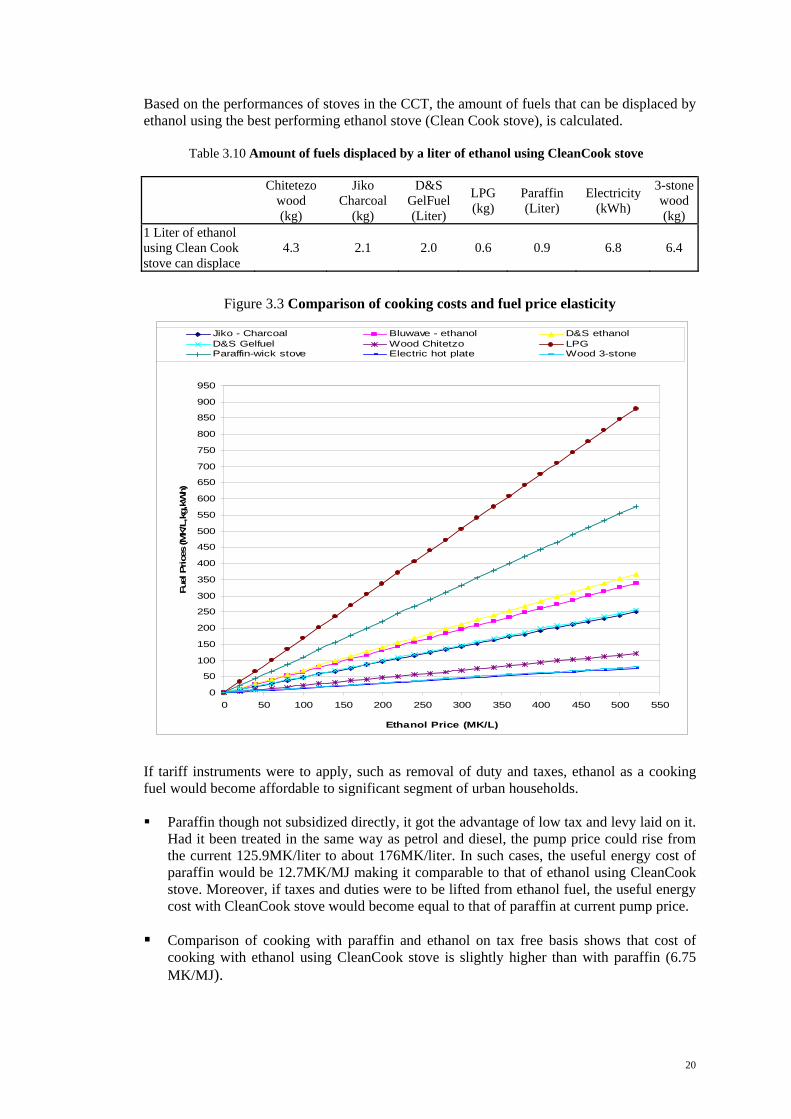
Price sensitivity for useful energy costs is analyzed with various fuels. Figure 6 below compares cost of cooking with various stoves and fuels. Since ethanol is the fuel of interest in this study, the best performing ethanol stove is taken as a base to make the comparison. In this case, Clean Cook Stove is taken as a bench-mark for all ethanol stoves as it is the one with least cost of useful energy. The findings of the analysis are: In the business-as-usual scenario, with current retail price of ethanol 177.5MK/liter, for
cooking with CleanCook stove to break-even with charcoal (using JIKO) and firewood (using Chitetozo), the price of charcoal and that of firewood should rise to 90MK/kg and 43MK/kg respectively. Or, retail price of ethanol should come down to 40MK/liter and 37MK/liter to beak-even with charcoal and firewood respectively. Comparison of ethanol and paraffin gives that paraffin price as high as 175MK/liter will still be competitive to ethanol.
For Bluwave and GELFUEL stoves to break-even with charcoal, prices of ethanol and gel
fuel should come down to 30MK/L and 23MK/L respectively. Cooking with Clean Cook stove is currently cheaper than cooking with LPG. For LPG to
compete with Clean Cook stove, price of LPG should be below 306MK/kg. All these analysis, in the business-as-usual scenario is based on unfairly priced fuels. Prices of charcoal and firewood have never reflected the sustainable supply cost. In fact, firewood plantation has never become an attractive business in Malawi as price of such fuels from a freely collected source are unbeatable. Paraffin is enjoying low tax rates and electricity is subsidized and is being sold at about 40% of its long-run-marginal cost. The scenario would be different if the social and environmental costs were to be included in the pricing of these fuels.
20
Based on the performances of stoves in the CCT, the amount of fuels that can be displaced by ethanol using the best performing ethanol stove (Clean Cook stove), is calculated.
Table 3.10 Amount of fuels displaced by a liter of ethanol using CleanCook stove
Chitetezo wood (kg)
Jiko Charcoal
(kg)
D&S GelFuel (Liter)
LPG (kg)
Paraffin (Liter)
Electricity (kWh)
3-stonewood (kg)
1 Liter of ethanol using Clean Cook stove can displace
4.3 2.1 2.0 0.6 0.9 6.8 6.4
Figure 3.3 Comparison of cooking costs and fuel price elasticity
0
50
100
150
200
250
300
350
400
450
500
550
600
650
700
750
800
850
900
950
0 50 100 150 200 250 300 350 400 450 500 550
Ethanol Price (MK/L)
Fuel
Price
s (M
K/L
,kg,
kWh)
Jiko - Charcoal Bluwave - ethanol D&S ethanolD&S Gelfuel Wood Chitetzo LPGParaffin-wick stove Electric hot plate Wood 3-stone
If tariff instruments were to apply, such as removal of duty and taxes, ethanol as a cooking fuel would become affordable to significant segment of urban households. Paraffin though not subsidized directly, it got the advantage of low tax and levy laid on it.
Had it been treated in the same way as petrol and diesel, the pump price could rise from the current 125.9MK/liter to about 176MK/liter. In such cases, the useful energy cost of paraffin would be 12.7MK/MJ making it comparable to that of ethanol using CleanCook stove. Moreover, if taxes and duties were to be lifted from ethanol fuel, the useful energy cost with CleanCook stove would become equal to that of paraffin at current pump price.
Comparison of cooking with paraffin and ethanol on tax free basis shows that cost of
cooking with ethanol using CleanCook stove is slightly higher than with paraffin (6.75 MK/MJ).
21
3.4 Household energy demand in Malawi
3.4.1 Household cooking energy shares According to the 2005 Malawi Integrated Household Survey, the overwhelming majority of Malawians (98.1%) use biomass fuels for cooking. Fuelwood is the most important cooking fuel in Malawi (89%) followed by charcoal (6.8%). Electricity and paraffin are used by only 1.7% and 0.3% of the population respectively. In rural areas the dependence on biomass fuels is almost universal (99.6%). Biomass fuels are also dominant in urban areas although to a slightly lesser degree (87.3%). The major difference between urban and rural areas is that in urban areas both firewood and charcoal are used in relatively equal share while in rural areas charcoal use is insignificant. Households in the higher expenditure classes are less dependent on biomass fuels. Households in the highest expenditure quintile account for 50% charcoal users, 70% of the paraffin users, and 87% of electricity users. Female headed households appear to be slightly more dependent on biomass energy compared to male headed households. Female headed households also tend to use more of low quality (collected and non-traded) fuels compared to male headed households.
Table 3.11 Distribution of households by type of fuel used for cooking (2005)11 Background characteristics
Northern Region 99.7 98.6 0 0.3 1.1 0 0 100Mzuzu City 84.8 49.2 1 14.2 33.5 0.8 1.3 100
Central Region 99.6 97.7 0.1 0.4 0.6 1.3 0.1 100Lilongwe City 87.1 13.8 1.7 11.3 72.5 0.4 0.4 100
Southern Region 96.9 83.3 0.3 2.8 11.9 1.2 0.5 100Blantyre City 96.3 85.8 0 3.8 10.4 0 0 100
Notes: The 2006 Welfare Monitoring Survey (WMS, 2006, p. 74) presents different results. The WMS puts rural households using paraffin for cooking as 1%, and those using charcoal as 2%. In the WMS urban users of charcoal is put as 41% and those using firewood as 45%.
11 The data is presented as if each household uses only one fuel. However, it is well known that in the urban context many households use multiple fuels at the same time. The data represents the most widely used fuel in the household.
22
70%
80%
90%
100%
1st 2nd 3rd 4th 5th
Firewood CharcoalElectricity ParaffinCrop residue, saw dust Other
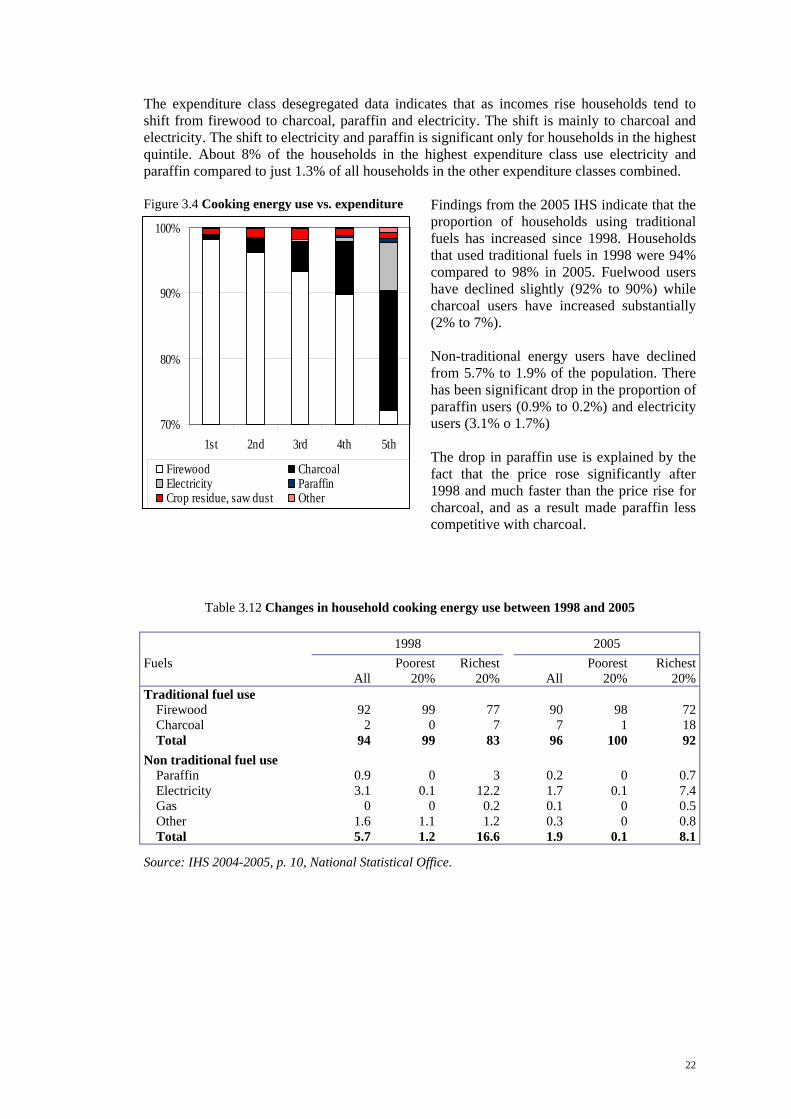
The expenditure class desegregated data indicates that as incomes rise households tend to shift from firewood to charcoal, paraffin and electricity. The shift is mainly to charcoal and electricity. The shift to electricity and paraffin is significant only for households in the highest quintile. About 8% of the households in the highest expenditure class use electricity and paraffin compared to just 1.3% of all households in the other expenditure classes combined.
Findings from the 2005 IHS indicate that the proportion of households using traditional fuels has increased since 1998. Households that used traditional fuels in 1998 were 94% compared to 98% in 2005. Fuelwood users have declined slightly (92% to 90%) while charcoal users have increased substantially (2% to 7%). Non-traditional energy users have declined from 5.7% to 1.9% of the population. There has been significant drop in the proportion of paraffin users (0.9% to 0.2%) and electricity users (3.1% o 1.7%) The drop in paraffin use is explained by the fact that the price rose significantly after 1998 and much faster than the price rise for charcoal, and as a result made paraffin less competitive with charcoal.
Table 3.12 Changes in household cooking energy use between 1998 and 2005
1998 2005 Fuels Poorest Richest Poorest Richest All 20% 20% All 20% 20%Traditional fuel use
Source: IHS 2004-2005, p. 10, National Statistical Office.
Figure 3.4 Cooking energy use vs. expenditure
23
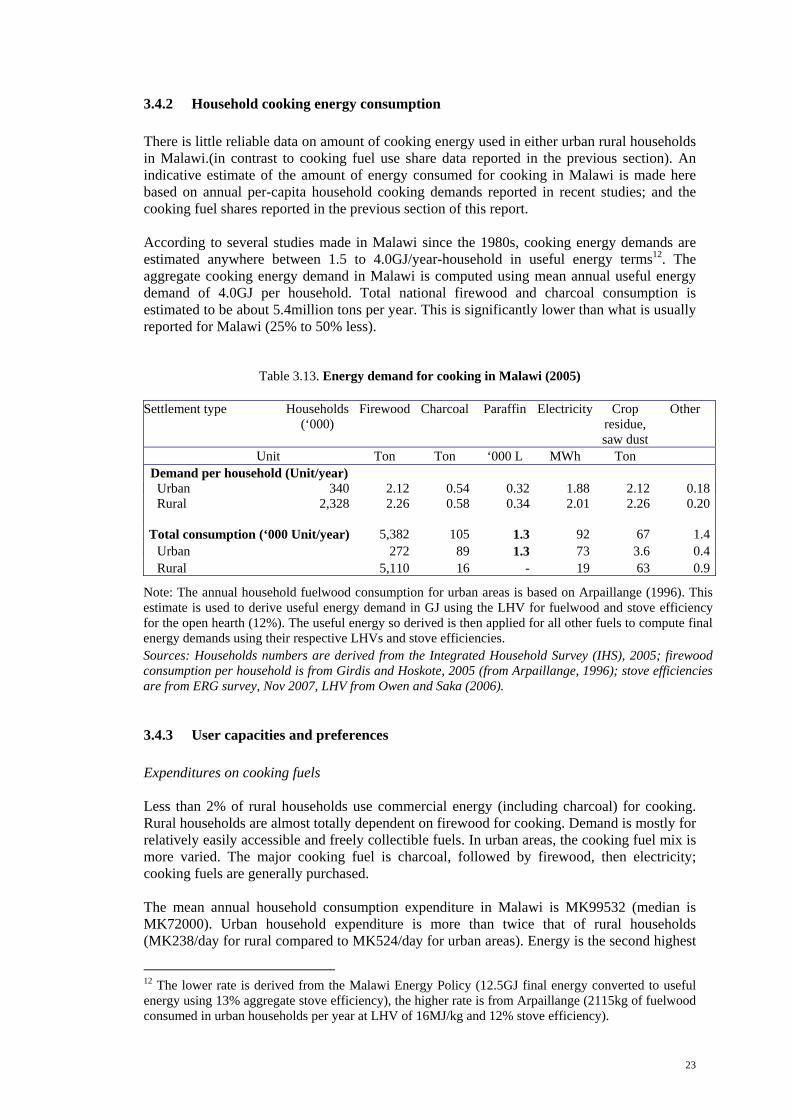
3.4.2 Household cooking energy consumption There is little reliable data on amount of cooking energy used in either urban rural households in Malawi.(in contrast to cooking fuel use share data reported in the previous section). An indicative estimate of the amount of energy consumed for cooking in Malawi is made here based on annual per-capita household cooking demands reported in recent studies; and the cooking fuel shares reported in the previous section of this report. According to several studies made in Malawi since the 1980s, cooking energy demands are estimated anywhere between 1.5 to 4.0GJ/year-household in useful energy terms12. The aggregate cooking energy demand in Malawi is computed using mean annual useful energy demand of 4.0GJ per household. Total national firewood and charcoal consumption is estimated to be about 5.4million tons per year. This is significantly lower than what is usually reported for Malawi (25% to 50% less).
Table 3.13. Energy demand for cooking in Malawi (2005) Settlement type Households
Note: The annual household fuelwood consumption for urban areas is based on Arpaillange (1996). This estimate is used to derive useful energy demand in GJ using the LHV for fuelwood and stove efficiency for the open hearth (12%). The useful energy so derived is then applied for all other fuels to compute final energy demands using their respective LHVs and stove efficiencies. Sources: Households numbers are derived from the Integrated Household Survey (IHS), 2005; firewood consumption per household is from Girdis and Hoskote, 2005 (from Arpaillange, 1996); stove efficiencies are from ERG survey, Nov 2007, LHV from Owen and Saka (2006).
3.4.3 User capacities and preferences Expenditures on cooking fuels Less than 2% of rural households use commercial energy (including charcoal) for cooking. Rural households are almost totally dependent on firewood for cooking. Demand is mostly for relatively easily accessible and freely collectible fuels. In urban areas, the cooking fuel mix is more varied. The major cooking fuel is charcoal, followed by firewood, then electricity; cooking fuels are generally purchased. The mean annual household consumption expenditure in Malawi is MK99532 (median is MK72000). Urban household expenditure is more than twice that of rural households (MK238/day for rural compared to MK524/day for urban areas). Energy is the second highest
12 The lower rate is derived from the Malawi Energy Policy (12.5GJ final energy converted to useful energy using 13% aggregate stove efficiency), the higher rate is from Arpaillange (2115kg of fuelwood consumed in urban households per year at LHV of 16MJ/kg and 12% stove efficiency).
24
consumption expenditure, next to food, accounting for 12% of total consumption expenditure. In rural areas cooking fuels are mostly freely collected and money expenditures are for lighting. In urban areas household energy expenditures consist of a varied set of uses including cooking, lighting, electric appliances and transport (for the high income groups). Cooking energy expenditure in urban areas is estimated as 11% of total energy expenditure. This means daily expenditures for cooking are about MK52 in urban areas. As incomes rises the share of energy expenditure declines but monetary expenditures rise in absolute terms. This means for the higher income households (the first potential market for ethanol) daily cooking energy expenditures will be considerably higher than MK52. Factors determining consumer choice The major factors that determine the market for household cooking fuels in urban areas include fuel and stove prices, safety of the fuel-stove combination, ease of use, cleanness, speed of cooking, and fuel supply certainties. a. The economic factor In urban areas cooking fuel prices have risen slowly in the eighties then sharply in the nineties and later (Economic Report, 2002). Prices for paraffin, charcoal and wood have increased at about the same rate (20% per year). The relative price of paraffin against charcoal (paraffin price/charcoal price) has declined from a peak in the mid eighties to a low in 1990 due to subsidy given by the Government. This may have prompted a switch from charcoal to paraffin. After the subsidy was stopped, the relative price rose again this has resulted in an increase of charcoal consumption. Such a switch may have been aided further by the introduction of the improved JIKO charcoal stove. On tax free basis cooking with ethanol is only slightly more expensive than paraffin, cheaper than LPG but more than twice that of charcoal and wood. For this reason liquid ethanol is likely to replace only paraffin and LPG in Malawi (in the short term). With the expected rise in petroleum prices, it will soon be cheaper to cook with ethanol than paraffin. Another potential target market for liquid ethanol is LPG users. The cost of cooking with LPG is higher than all existing fuels in the market and also higher than liquid ethanol. The gap will further widen with the expected price rise for LPG. Stove prices for ethanol are significantly higher than for paraffin. However, the stove price will be within the budget of the target market (according to the IHS only households in the highest quintile use paraffin for cooking). In addition, various financing mechanisms are feasible to distribute the stove cost over several months. b. The quality factor (safety, cleanness, speed) Liquid ethanol and stoves rate high in the main quality indicators, such as safety, convenience and speed of cooking. The gel stove also rates high in safety and convenience but low in speed of cooking. The ethanol fuels and stoves also have very low indoor emissions (PM and CO) compared to the other fuels and stoves. The only major concern for consumers regarding ethanol liquid and gel fuels will be the continued availability of the fuels at stable prices.
25
Table 3.14 Fuel and stove characteristics sought by households
Kerosene with wick
stove
Charcoal with JIKO
LPG Electricity Ethanol on CC stove
Ethanol gel fuel
Safety L M ND ND H H Availability & dependability H H L H M M Cleanness and convenience M L H H H H
Indoor air quality M H L L L L Speed of cooking H M H ND H L Note: H=High, M=Medium, L=Low, ND = Not Determined Source: ERG stove test in Malawi, November 2007. c. Availability of ethanol for domestic cooking Current ethanol production in Malawi is about 18 million liters from two producers13. Two grades of ethanol are produced: rectified or 96.5% pure ethanol, and absolute or 99.5% pure ethanol. Current production is 12.5 million liters of absolute ethanol and 5.4 million liters of rectified ethanol (Owen, 2006). The current markets for ethanol are for petrol blending in Malawi (now E10, but mandated to E20), hospitals, and chemical and beverage producers in Malawi and abroad. Absolute ethanol required for petrol blending in Malawi is 7 to 10 million liters per year14and rectified ethanol demand about 2 million liters per year. Ethanol export from Malawi is, therefore, 6 to 9 million liters per year: 2.5 to 5.5 million liters of absolute ethanol and 3.4 million liters of rectified ethanol. The potentially available ethanol for domestic cooking in Malawi will be about 9 million liters in 2008 and 6 million liters by 2012. Unless ethanol production increases, availability of ethanol for household usage will decline as demand from existing applications is expected to grow (petrol blend and others).
Table 3.15 Potential ethanol production and demand, 2007-2012 (Million Liters) Ethanol production 2005 2006 2007 2008 2009 2010 2011 2012Ethanol Company Ltd (Dwangwa) 7 7 PressCane Ltd. (Chikwawa) 10.9 10.9 Total supply from Malawi (S) 17.9 17.9 18 18 18 18 18 18
Petrol demand 68.7 65 65 68 73 81 90 100Ethanol (absolute) demand for blend (E10) 6.9 6.5 6.5 6.8 7.3 8.1 9.0 10.0 Ethanol demand for industrial & other uses 2 2 2 2 2 2 2 2Export (committed) – Not Available
Total demand in Malawi (D) 9 9 10 11 12
Ethanol available for cooking (S – D) 9 9 8 7 6
Can cover demand from: (‘000 households @ 360L/household ) 25 24 22 19 16Notes: Petrol consumption is estimated for 2006 and projected from 2007 onwards. For 2006 the available data for the first 10 months of the year shows that 2006 consumption was about 94% of 2005 consumption. Consumption is expected to stay constant in 2007 (due to high prices) then grow back slowly to the 1998 level (the highest in a decade at 99.3 million liters) by 2012.
Sources: Petrol consumption is from NSO (URL http://www.nso.malawi.net/)
13 These two producers have the capacity to produce twice current levels if molasses is available. 14 Petrol consumption was highest in 1998 at 99.3 million liters and lowest in 2005 at 68.5 million liters.
26
d. Ethanol prices The ethanol price in Malawi is high compared to other markets around the world. The wholesale price for ethanol in Malawi is significantly higher than prices in other markets (see following figure). In the US for instance the wholesale price for ethanol has moved between US$2.0 to US$1.5 per gallon (equivalent to US$0.4 – 0.55 per liter) during the past year compared to US0.75 to 1.0 per liter in Malawi15. At internationally competitive prices liquid ethanol will not only be considerably cheaper than kerosene but will also be more competitive with charcoal. Malawi particular circumstances make domestic use of ethanol very competitive. First, the export value for Malawi’s molasses should be low due to high freight costs and this favors local processing and use of Malawi’s molasses. Second, petroleum imported into Malawi incurs high transport costs and this makes paraffin and other petroleum fuels relatively expensive and ethanol more competitive.
3.4.4 The potential market for ethanol cooking in Malawi The combined effect of the price, quality and availability factors narrows the target market to mid and high income households in urban areas of Malawi. These households are the major users of electricity, paraffin and LPG for cooking. Liquid ethanol can replace paraffin and LPG in mid and high income households due to their comparable cost of cooking and because of the superior quality advantage of ethanol compared to both paraffin and LPG. At the current market price for ethanol, the ethanol stove market segment in Malawi is only about 2% of the urban population or an estimated 7,000 households (i.e. current paraffin and LPG users). However, as indicated in the previous section the competitive price for ethanol in Malawi should be significantly lower than current market price (as low as 60% of the current price). In this case ethanol would become more competitive with charcoal and charcoal users in the highest quintile and about 4% of urban households or 14,000 households, may be persuaded to switch to ethanol for its quality attributes. The combined potential market for ethanol is therefore about 20,000 stoves.
15 In Malawi the wholesale price for ethanol is MK155/liter (US$1.06/liter). If taxes and duties are removed the wholesale price would be MK109/liter (US$0.75/liter).
Figure 3.5 Ethanol wholesale price in the US (US$/gallon)
Source: EthanolMarket.com, LLC (Chicago Board of Trade).
27
3.4.5 Ethanol fuel and stove demand in neighboring countries All Malawi’s neighbors have sugar cane based sugar industries. Although none of them are now producing ethanol all have intentions to do so in the near future. With rapidly rising petroleum prices and the global trend for increased production and use of biofuels, the incentive for ethanol production will be high and the neighboring countries can be expected to realize their plans. In the mid to long term, therefore, there will be little potential for export of ethanol from Malawi to these countries.
Tanzania16 produced about 89,000 tons of molasses from four sugar factories (2004/05). About 30% of the molasses is reported to be used for livestock feed and the rest is disposed as waste (GTZ, 2005) The potential for ethanol production from these four sugar factories is 22 million liters. Petrol consumption in Tanzania was 300 million liters in 2004. An E10 blend mandate would mean that 30 million liters of ethanol will be required for the petrol blend market alone. Zambia produces about 50,000 tons of molasses per year. Output is expected to double to 100,000 tons by 2010. This means current ethanol production potential is 12 million liters growing to 24 million liters by 2010. Most of the molasses is currently used as livestock feed. But Zambia Sugar has plans to produce ethanol from molasses in the near future (de Castro, 2007). Petrol consumption in Zambia is about 190 million liters. A blend mandate for E10 will mean that most of the potential ethanol output will be used as petrol blend. Mozambique plans to be a major biofuel producer with estimated potential ethanol output exceeding 500 million liters (de Castro, 2007). The demand for blending with petrol is estimated to be about 10 million liters of ethanol. If the plans are realized Mozambique will be a major exporter of ethanol in and outside the region.
The ethanol market will expand in the region mainly as the result of the demand for ethanol as petrol blend. The current ethanol production potential in the neighboring countries is just enough to cover demand for blending with petrol (E10). However, all countries can be expected to increase their ethanol production in order to reduce their dependence on petroleum fuels as well as for export. As a result domestic demand for ethanol as petrol blend will be smaller than ethanol production. The balance must be exported or used in other applications. Although export markets will grow in the future, supply may grow faster than demand. Consequently countries, including Malawi’s neighbors, must diversify the domestic ethanol market. The household cooking market will be the most substantial among the new markets for ethanol. As an early adopter of ethanol fuel in the region, Malawi can take advantage of its experience to position itself as supplier of ethanol stoves and lanterns to its neighbors. The potential demand for ethanol stoves in the neighboring countries may reach 145,000 within five years.
16 Molasses output and current uses for Tanzania, Zambia and Mozambique are taken from F.M. de Castro, May 2007.
28
Table 3.16. Ethanol stove market potential in Malawi and neighboring countries
Urban
households Market segment
Market households
2008 2009 2010 2011 2012
2005 (est) 2005 2005 Malawi 340,000 6% 20,000 500 2500 7500 12500 16000Tanzania 2,010,000 3% 60,000 500 2500 7500 12500Mozambique 1,031,000 5% 50,000 500 2500 7500 12500Zambia 680,000 5% 35,000 500 2500 7500 12500Total 161,000 500 4000 15000 35000 53500Notes: Paraffin and LPG users are assumed to be the potential market for ethanol in the neighboring countries; market potential for 2008 and onwards projected using urban population growth rates. Zambia: market segment is paraffin and LPG users in urban areas. About 10% of urban households are reported to be using paraffin and LPG for cooking segment (The Urban Household Energy Transition, Barnes and et. al, 2004). Half of the higher income users will be the first market (Zambia GDP per capita is twice that of Malawi or US$320).
Tanzania: Dares Elam 25% of households use paraffin for cooking (TaTEDO, 2005); Dar constitutes a quarter of the urban population; urban paraffin users are estimated at about 10%; households in the top third income class are expected to switch to ethanol cooking (Tanzania GDP per capita is US$270).
Mozambique: Mozambique’s household sector consumed 37,000 tons of paraffin and 10,000 tons of LPG in 2004 (IEA, International Energy Agency,
http://www.iea.org/Textbase/stats/oildata.asp?COUNTRY_CODE=MZ). The number of LPG users alone is estimated between 40,000 to 50,000 households (i.e. 200-250kg/household-year).
Sources: Study estimates.
Figure 3.6 Ethanol stove market in Malawi and neighboring countries
-
10,000
20,000
30,000
40,000
50,000
60,000
70,000
2008 2009 2010 2011 2012
Liqu
id e
than
ol c
umul
ativ
e sa
les
ZambiaMozambiqueTanzaniaMalawi
29
4 INDUSTRY ANALYSIS Key issues, challenges and relative attractiveness of ethanol fuel and stove in the household market can be measured by negotiating power of product suppliers, market entry barriers, negotiating power of buyers, threats of substitute products and the overall degree of rivalry. High bargaining power of suppliers implies that suppliers can easily enforce their will reducing the attractiveness of the product.
Table 4.1 Industry Analysis
Industry Definition Key Issues Ethanol Clean Cook stove
Negotiating Power of Suppliers
HIGH Currently there are two ethanol producing factories. The demand for ethanol is high for petroleum blending, local industries and export market. In the long term the demand for the product will be even higher as it develops as domestic cooking fuel and for flex vehicles that use higher proportion of ethanol that the government is promoting. If ethanol is available the demand for gel fuel (low heat content but high price fuel) will be low as customers prefer to buy relatively cheaper ethanol.
MEDIUM The design of the stove is patent protected, but there are many models available on the world market. Manufacturing set-up is complex, with high switching cost from other products. No alternative suppliers of the same stove but suppliers for low cost and lower quality alternatives are present.
Existence of Entry Barrier
HIGH The production of ethanol is currently dominated by two major companies that have direct access to molasses from the sugar estates, which give them a competitive advantage.
HIGH Establishing a production workshop (with tools and an initial stock of raw materials) requires significant start-up capital. Manufacturing expertise and well equipped workshop are needed. Not all components of the product can be manufactured locally. Alternatively the stoves can be imported.
Negotiating Power of Buyers
HIGH Households are currently using very low price fuels. Most of high income households who can afford to pay for ethanol as cooking fuel have access to electricity, the cheapest cooking fuel.
HIGH Buyers have alternatives available for cooking and relatively low switching costs.
Threats of Substitute Products
HIGH Price of ethanol at the moment is very high, as a result it cannot compete with cooking fuels such as firewood, charcoal and electricity at their current prices. The existing market for paraffin and LPG, which ethanol can compete with is limited.
HIGH Because of high cost of ethanol fuel cooking is rather expensive and many buyers may prefer to remain with their traditional low price stoves and low price fuels. In addition to this, electricity is the cheapest cooking fuel, although access to it is limited to small portion of the population. The fuel that ethanol can compete with is paraffin, but current usage of paraffin for cooking is very low.
Degree of Rivalry
LOW The industry is dominated by two big companies. This might explain the current high price of ethanol.
HIGH The industry is fairly small and competition is high, so there is considerable rivalry, as interest in the product will be low if prices of other fuels remain low.
30
5 FINANCIAL ANALYSIS 5.1 Assumptions The basic assumptions for the financial analysis are summarized below. The lifetime of the Project is assumed to be 10 years. All fixed assets will be replaced at the end of their expected economic lives based on their respective depreciation rates.
Table 5.1 Basic Assumptions for Financial Analysis
1. Project Life 10 years2. Financing Sources and Terms:
Equity (Share Capital): 80% of investment costLong Term Loan 20 per cent of total capitalInterest Rate 21% per annumLoan Repayment 10 years
3. Depreciation Method of Depreciation Straight Line Method
4. Profit Tax 30%
5.2 Investment Costs and Financing Sources The total initial investment required for the establishment of the Ethanol Cooking Fuel and CC Stove Marketing Enterprise is approximately MK 26.5 million. This will cover initial investment costs, working capital requirements and project start-up costs. Of this initial investment cost, 88 percent will be for the fuel marketing business and the stove marketing 12 percent. Of the estimated initial total costs, MK 0.3 million (1.13%) will be for land lease for the bulk storage and fuel bottling facility and MK 4.0 million (15%) will be for civil works and building construction. Fuel tankers, metering pumps, manual-operated cupping machines, and fire fighting equipment will cost MK 6.4 million or 24 percent of the total costs. A pick-up truck required for transportation of bottled fuels and for office services will cost MK 8 million (30% percent). Working capital requirement is estimated at MK 4.5 million or 17% of the total initial investment cost.
Table 5.2 Summary of Initial Investment Costs
Fixed Investment Cost Total Fuel Marketing CC Stove
Marketing % of total Land Lease cost 300,000 300,000 - 1.13 Civil works 4,000,000 4,000,000 - 15.10 Office Furniture and Equipment 2,890,000 2,260,000 630,000 10.91 Fuel Tankers 3,500,000 3,500,000 - 13.21 Metering Pumps 1,000,000 1,000,000 - 3.78 Cupping machine 400,000 400,000 - 1.51 Fire fighting equipment 1,500,000 1,500,000 - 5.66 Vehicle 8,000,000 8,000,000 - 30.20
Pre-operating expenses 400,000 400,000 - 1.51 Working Capital 4,500,000 2,000,000 2,500,000 16.99 Total initial investment cost 26,490,000 23,360,000 3,130,000 100.00 Percent 100 88 12 Financed by:
The sources of finance will be equity capital and long-term loans. It is assumed that the envisaged Enterprise will be capitalized by its owners in an equivalent to 80 percent of the total initial investment amounting MK 21.2 million and MK 5.3 million or 20 percent of total investment, through a long-term loan. It is further assumed that interest rate on the long-term loan would be 21% per annum (20% interest rate and 1 % commitment charge) and will be repaid over ten years. 5.3 Projected Revenue and Costs The annual revenue is projected based on sales volume and unit sales prices of the CC stove and ethanol. The envisaged business will import the single burner CleanCook Stove at MK 6,993 and sale it at wholesale price of MK 8042, i.e., a margin of MK 1,049per stove. The purchase price of ethanol, excluding excise and surtax of 30% and 17.5%, respectively, will be MK 78.56. The wholesale price of ethanol fuel is MK 125.47 per liter. The volume of ethanol marketed is projected based on average consumption of 360 liters per household per year and a product loss of 5%. The projected revenue from sales of CC Stove and ethanol fuel marketing during the first year of operation will be MK 53.2 million (MK 8 million from the sale of the stove and MK 45.2 million from the fuel sales). The aggregate revenue will increase to MK 98 million and MK 157 million during the second and third years of operations. During the first year of operation, the business will import and sell 500 singe burner stoves and purchase 380 million liters of ethanol. The total cost of sales will be MK 37 million (MK 7 thousands for the CC Stove and MK 30 million for ethanol).
5.4 Projected Financial Statements A complete set of financial projections for the first ten years of operation are provided in Annex I. The projections include balance sheets, income statements, and statement of cash flow. The projections are prepared on an annual basis. A summary of major balance sheet and income statement and cash flow statement items is presented below. The business will generate revenue of MK 53 million during its first year and MK 98 million during the second year. The cost of sales is projected to grow from MK 37 million during the first year to MK 67 million during the second year. The projected gross profit during the first and second years of operation will therefore be MK 16 million and MK 32 million, respectively. The annual general and administration expenses are projected at MK 31 million during the first years of operation and will increase to MK 39 million during the second year. The gross loss during the first is projected at MK 15 million. As volume of the business increases, the gross loss will be reduced to MK 7 million during the second year. Included as non-operating expenses is interest payment on long-term bank loan. The Enterprise will pay MK 1 million in interest on the long-term loan during the first year and MK 2 million during the second year of operation. The business will make net loss of MK 16 million during the initial year of operation. The business will continue to make loss until the third year of operation. During this period the net profit will be about MK 0.4 million.
Table 5.4 Summary of Financial Projections, ‘000 MK
5.5 Financial Returns The financial profitability analyses for the fuel and stove marketing combined indicate that the business will generate a reasonable rate of return. The internal rate of return (IRR) on equity is 23.3 percent and the net present value (NPV) at a discount rate of 21% (the current commercial banks lending rate) is MK 6.1 million. On the other hand, when the fuel and stove marketing were treated separately, the stove marketing business will not be financially viable; the IRR is negative and the NPV at commercial banks lending rate of 21% is MK -11 million. However, when carbon financing is included in the stove marketing business, the IRR will be 19.3% (but still below the bank lending rate). The NPV at the bank lending rate of 21% will be MK -1.7 million.
Table 5.5 Summary of Project Worth, ‘000 MK
Project Worth Fuel and Stove
Marketing CombinedFuel
MarketingStove
Marketing
Stove Marketing with Carbon Finance
Net Present Value (NPV) at 15% 28,864 41,885 (13,022) 5,385 Net Present Value (NPV) at 16% 24,195 36,810 (12,614) 3,978
Net Present Value (NPV) at 21% 6.095 16,988 (10,892) (1,711)
IRR on Equity 23.3% 28.5% - 19.3%
34
6 ECONOMIC AND SOCIAL BENEFITS The ethanol fuel and stove marketing is expected to have significant economic, social and environmental benefits to Malawi. These include saving of scarce foreign exchange through substitution of imported LPG and paraffin, and earning of foreign exchanges from sale of Certified Emission Reductions (CERs), improved health and protection of natural resources. 6.1 Foreign Exchange Savings Domestically produced ethanol will substitute imported LPG and kerosene and thus saving scarce foreign exchange. The present value of the net foreign exchange saving (foreign exchange savings less the foreign exchange requirements for importing CC stoves and foreign exchange lost as a result of diverting ethanol exports for domestic use), is US$ 2.78 million in total. Additionally, the business has the potential to earn US$0.24 million in foreign exchange through sales of CERs.
6.2 Employment Benefits The ethanol fuel and stove marketing business will offer employment opportunities to a total of 27 people. In addition, the business could potentially stimulate further expansion of ethanol production capacity of the Sugar factories in Malawi and should result in the creation of new employment opportunities there.
36
7 ENERGY AND GENDER IN MALAWI Women are severely disadvantaged in almost every sector of development in Malawi due to deeply rooted social attitudes which lead to gender based discrimination against women. Gender relations and roles are based on the idea of the inferiority of woman and are maintained by cultural norms and beliefs (UN: CEDAW, 2004, p 29). This discrimination begins at birth and is visible at every stage of life for Malawian women. In terms of education, although the enrolment gap has narrowed in recent years, fewer girls than boys complete secondary education. The most common reasons for girls’ dropping out are early marriage, teenage pregnancy and high rates of HIV/AIDS, resulting in girls becoming care givers (UN: CEDAW, 2004, p 43). Only 23% of girls are enrolled in secondary school (UNDP HDR p 374). The literacy rate for women is 54%, which is low compared with the male literacy rate of 74.9% (UNDP HDR p 366). Approximately 91% of the economically active women in Malawi work in agricultural activities requiring manual labour (UN: CEDAW, 2004, p 51). Often, women’s economic contribution within the agriculture sector is not reflected in the national accounts. Women tend to be concentrated in economic activities that reflect their socially designated gender roles. The HIV/AIDS epidemic in Malawi has had a disproportionate impact on women. HIV/AIDS prevalence for young women aged 15-24 is 4 to 6 times higher than that for young men (UN: CEDAW, 2004, p 57). This statistic is a reflection of the imbalance in power relations between women and men in Malawi. Generally, the burden of care for the increasing number of orphaned children in Malawi falls on women. The stark inequalities between men and women are reflected in political and public life, where women are outnumbered in all key decision making positions (UN: CEDAW, 2004 p 35). Women occupy 13.6% of seats in parliament and just 26% of deputy ministers are women (UN: CEDAW, 2004 p 35). Three out of 22 judges and 3 out of 19 ambassadors are women.
7.1 Gender Policy The Ministry of Gender, Youth and Community Services is mandated with overseeing and implementing gender policy in Malawi. Central to gender policy is the recognition that gender is a cross cutting issue and accordingly, policy is developed along 6 thematic areas: Education and Training, Reproductive Health, Food and Nutrition Security, Natural Resource and Environmental Management, Government and Human Rights and Economic Empowerment (2000-05, Malawi Gender Policy, section 2.0). The main policy objective is to mainstream gender in the national development process to enhance the participation of women and men, girls and boys for sustainable and equitable development for poverty eradication (2000-05, Malawi Gender Policy, section 3.1). The link between gender and energy is highlighted in section 3.4 where the promotion of energy saving technologies and alternative, appropriate sources of energy are listed as strategies for mainstreaming gender in the thematic area of National Resource and Environmental Management (2000-05, Malawi Gender Policy, section 3.4).
37
Malawi is a signatory to conventions and declarations related to women and children, most notably, the Convention on the Elimination of All Forms of Discrimination against Women, and the SADC declaration on Gender and the addendum on violence against women.17
7.2 Gender and Household Energy In Malawi, like in most developing countries, women are responsible for cooking and for household energy provision. On average, women and girls in Malawi walk for more than an hour every day in order to gather fuelwood and, when they return home, many more hours cooking on inefficient stoves (Rehfuess, 2006, p20). The time required for these activities means that less time is available to women for other more productive, income generating activities. Moreover, girls are often forced to miss school or drop out altogether to assist with fuelwood collection and cooking. Gathering fuelwood can be a risky activity for women and girls as it can leave them vulnerable to attack and injury, and carrying heavy loads can lead to prolapse during pregnancy (WHO, 2006, p 20). The health impacts of burning biomass indoors are evaluated in a separate section on health. Switching to cleaner fuels and more efficient stoves can reduce the burden on women and girls by removing the need for fuelwood. The time saved gathering fuelwood can be used for activities to supplement the household income and for girls’ education. Improving the household energy situation can improve women’s health and can increase the number of hot meals consumed per day and thus improve food safety and nutrition (Rehfuess, 2006, p20). See the table below for a summary of the benefits to women of switching to ethanol for cooking.
Table 7.1 Benefits to Women of Switching from Traditional Fuels to Ethanol for Cooking
Benefits to Women In Detail Income Saved • Where more expensive fuels were used (paraffin, LPG),
income will be saved • Increased productivity due to time saved during cooking, • Time and income saved caring for ill family members
Health and Wellbeing • Reduced Indoor Air Pollution • Safer fuel – fewer accidents, burns, etc.
Nutrition • Free up women’s time – more time available for income
generating activities Source: Adapted from: Clancy, J, 2003, Household Energy and Gender, the Global Context, Table: Livelihood outcomes as consequence of improved energy services and their consequences for women, p 8.
7.3 Time Saved: Benefits at the National Level The time saved by women at the household level could translate into significant savings at the national level. Table 7.2 below is an extract from an economic analysis conducted by WHO to calculate the returns from investing in household energy. The analysis was conducted for 11 sub regions in order to reflect variations such as health, fuels used, environment and income per capita. The figures below reflect benefits which could be accrued in sub region
17 UNDP, Gender Issues and Activities in Malawi, http://www.sdnp.org.mw/gender/mlw_gender_policy_env.html
38
AFR-E, (where Malawi is located) if 50% of the population cooking with solid fuels in 2005 switched to cooking with ethanol by 2015. Although the figures represent savings in the region as a whole, they nonetheless convey the enormous potential savings that a switch to ethanol could have in Malawi.
Table 7.2 Returns from investing in household energy if 50% of the population cooking with solid biomass in 2005 switched to cooking with ethanol by 2015 (Africa sub Region)
Urban Rural Total Annual fuel collection time savings (million hours) 146 707 853
Annual value of fuel collection time savings in million US$)
543 2633 3176
Annual cooking time savings (million hours)
208 278 486
Annual value of cooking time savings (million US$)
774 1037 1811
Annual value of time savings (cooking and fuelwood gathering) (million USD)
1317 3669 4986
Adapted from: Hutton, G, Rehfuess, E, Tediosi, F, Weiss, S, 2006, Evaluation of the Costs and Benefits of Household Energy and Health interventions at Global and Regional Levels, WHO, p 79-81 https://www.who.int/indoorair/publications/household_energy_health_intervention.pdf
The links between household energy and gender are undeniable. Improving the household energy situation positively impacts the health, livelihoods, and well being of women and girls. It is clear from this analysis that Malawi has much to gain, both at the household and at the national level, from encouraging a switch from traditional fuels to clean fuels such as ethanol.
39
8 ENERGY AND HEALTH IN MALAWI According to the WHO, life expectancy at birth in Malawi is 47 years for males and 46 years for females, with a healthy life expectancy being 35 years both for males and for females (WHO, 2006, Country Profile). The total expenditure on health as a percentage of gross domestic product is 12.9% and the Per capita total expenditure on health at international dollar rate is 57.8 USD. The probability of dying under 5 is 125 in 1,000 live births (WHO Country Profile).
8.1 Main Public Health Issues and Concerns Although some improvements have occurred over recent decades, Malawi’s overburdened and under resourced health system still faces myriad complex health problems. The five major causes of morbidity and mortality are HIV/AIDS, Lower Respiratory Infection, Malaria, Diarrhoeal Diseases and conditions occurring during the perinatal period (WHO, 2006, Health Action in Crises, p 1) See Table --- below for the top ten causes of death across all ages, 2002.
Table 8.1 Top Ten Causes of Death, All Ages, Malawi, 2002
Source: Death and DALY Estimates by Cause, 2002. http://www.who.int/entity/healthinfo/statistics/bodgbddeathdalyestimates.xls
Chronic malnutrition is widespread in Malawi with 44% of preschool students found to be stunted (WHO, Health Action in Crises, p1). Approximately 16% of infants have a low birth weight (UNDP, 2006, p 308).This extensive malnutrition, coupled with a weak health infrastructure, has left the population extremely vulnerable. The prevalence of TB has increased over the past decade to 502 per 100,000 in 2004. More than half (52%) of all patients living with TB are also living with HIV. The current HIV rate in Malawi stands at 14%. According to the 2004-05 Integrated Household Study conducted by the National Statistics Office, Malawi, the overall prevalence of reported chronic illness in Malawi is about 9% (NSO, 2005, p 34). The most frequently reported chronic illness was Arthritis/Rheumatism (33% of the surveyed population) followed closely by Asthma (30% of the surveyed population (NSO, 2005, p 34). Asthma was reported as the main type of chronic illness affecting people in urban areas (NSO, 2005, p 34).
40
8.2 Household Energy and Health In Malawi, approximately 99% of households in rural areas and more than 90% in urban centres rely on biomass (wood, dung, crop residues, etc.) for their cooking needs (WHO Malawi Health Fact Sheet, p4) Typically burnt on open ‘3-stone’ fires or traditional, inefficient cook stoves, the use of such fuels produces high concentrations of dangerous pollutants, primarily carbon monoxide (CO) and small particulates (PM), but also nitrogen oxides, benzene, butadiene, formaldehyde and polyaromatic hydrocarbons (Rehfuess, 2006, p 8). It is now widely accepted that exposure to indoor air pollution (IAP) increases the risk of acute lower respiratory infections (ALRI) in children, chronic obstructive pulmonary disease (COPD) in adults, and lung cancer where coal is widely used (WHO 2002, p 8). There is also emerging evidence of causal links between IAP and tuberculosis (TB), perinatal mortality (stillbirths and deaths in the first week of life), low birth weight, asthma, otitis media, cancer of the upper airway and cataracts (WHO 2002, p 8). In 2000, IAP was responsible for more than 1.6 million deaths and 2.7% of the global burden of disease (Rehfuess, 2006, p 12). In most cases it is women and children who endure the most prolonged exposure times and are consequently most at risk from IAP.
8.2.1 The Health Implications of IAP in Malawi Recently, the WHO assessed the burden of disease from IAP at the national level. This evaluation is based on, by country, • The percentage of the population using biomass fuels and coal • Deaths and DALYs* for ALRI, COPD and lung cancer by age group and country • Relative risk of ALRI, COPD and lung cancer when exposed to IAP (WHO, 2007, p 1) * DALY (Disability-Adjusted Life Year) is the measure typically used to quantify mortality and morbidity due to a given disease or risk factor. The DALY combines the years of life lost due to disability with the years of life lost due to death (WHO, 2007, p1). It was reported that in 2002 in Malawi, the total DALYs attributable to solid fuel use was 431,300 (WHO, 2007, p 4). It was found that, for the same year, 12,240 ALRI deaths and 1060 COPD deaths were attributable to solid fuel use (WHO , 2007, p4) Moreover, 5.2% of the national burden of disease was due to solid fuel use (WHO, 2007, p4). These findings correspond with the WHO and National Statistics Office data presented above which show that respiratory infections are the second biggest killer in Malawi and a major public health issue. Evidence is also emerging which suggests that IAP may also increase the risk of TB and Asthma, diseases highlighted by WHO and NSO as prevalent in Malawi. Solid fuel smoke poses particularly serious problems for immunocompromised HIV/AIDS patients with increased susceptibility to respiratory infections (Rehfuess, 2006, p 11). This is a fact that Malawi, with a national AIDS rate of 14%, cannot afford to ignore.
8.2.2 Ethanol as a Means of Addressing the Health Impact of IAP There are numerous methods of reducing levels of indoor air pollution to decrease the associated health risks. These include, improved cooking devices, alternative fuel-cooker combinations, improving ventilation and changing cooking practices (Rehfuess, 2006, p 28). The World Health Organization recognizes that switching from wood, dung or charcoal to
41
more efficient, modern fuels such as kerosene, LPG and biogas, brings about the largest reductions in indoor smoke (Rehfuess, 2006, p 28). Ethanol is emerging as one of the cleanest and safest modern fuels for household cooking and has been ranked by UNDP above kerosene on the ‘energy ladder’(UNDP, 2005, Energising the MDGs). Controlled emissions testing of ethanol show that the primary products of combustion of ethanol and methanol are CO2 (Carbon Dioxide) and water vapour. Maximum CO emissions were less than 20 PPM (parts per million), which is well below WHO recommended emission levels and no PM was emitted. Thus, the safety of ethanol in terms of emissions during combustion is clearly demonstrated. An indoor air quality measurement was made on major cooking fuels and stoves as part of this assessment. The findings are shown in Annex D. Benefits at the Household and National Level Encouraging households to switch to a clean burning fuel such as ethanol and providing them access to ethanol and ethanol burning stoves would have an extremely positive impact on the health in Malawi both at the household and at the national level. The burden of disease attributable to burning solid biomass would be reduced and women’s and children’s health would be improved. As household health improves, health related costs for families, including income lost to due an inability to work (due to illness or caring for sick relatives), will be reduced. Significant health care savings at the national level are also possible. Table 8.2 below is an extract from an economic analysis conducted by WHO to calculate the returns from investing in household energy. The analysis was conducted for 11 sub regions in order to reflect variations such as health, fuels used, environment and income per capita. The figures below reflect benefits which could be accrued in sub region AFR-E, (where Malawi is located) if 50% of the population cooking with solid fuels in 2005 switched to cooking with ethanol by 2015.Although the figures represent savings in the region as a whole, they nonetheless convey the enormous potential savings that a switch to ethanol could have in Malawi. These savings are considerable, with an annual saving of US$29 million in health care costs and 96,000 deaths averted annually (Hutton, Rehfuess, Tediosi, Weiss, 2006 p 82). Table 8.2 Returns from investing in household energy if 50% of the population cooking with solid
biomass in 2005 switched to cooking with modern biofuels by 2015 (Africa Sub Region)
Cost items Urban Rural Total Annual value of health system cost savings (million US$) 10 16 26 Annual sickness time avoided (million work days) 26 43 69 Annual value of sickness time avoided (million US$) 55 91 146 Annual number of deaths averted (thousands) 39 57 96 Annual value of deaths averted (millions US$) 552 810 1362 Annual value of patient cost savings (million US$) 0.8 1.3 2.1 Annual value of total health care cost savings (million US$) 11 18 29
Source: WHO, 2006, Hutton, G, Rehfuess, E, Tediosi, F, Weiss, S, 2006, Evaluation of the Costs and Benefits of Household Energy and Health interventions at Global and Regional Levels, WHO, p 77-83 The potential savings to the health system in Malawi are significant, particularly given the current poor state of the health care sector. As the Malawi Growth and Development Strategy maintains, a healthy population is a pre requisite for economic growth and development (Hutton, Rehfuess, Tediosi, Weiss, 2006 p 48). In order for the government to effectively address the health crises in Malawi, it must recognize the clear linkages between the use of solid biomass as a household cooking fuel and the various health problems detailed in this section, and take action accordingly.
42
9 ENERGY AND ENVIRONMENT IN MALAWI The mandate for environmental policy in Malawi is derived from the National Constitution. Section Thirteen 13.d. provides the principles of national policy and states the environment principles as follows: "To manage the environment responsibly in order to: prevent the degradation of the environment; provide a healthy living and working environment for the people of Malawi; accord full recognition to the rights of future generations by means of environmental
protection; conserve and enhance the biological diversity of Malawi."
9.1 National Environmental Action Plan 1994 The Government of Malawi, through a comprehensive participatory process involving the private sector, non-governmental organizations (NGOs), local communities and government institutions prepared a National Environmental Action Plan (NEAP) which was formally launched in December of 1994. In pursuance of the National Environmental Action Plan, and to provide a coherent environmental framework for its development policies, the Government decided to prepare a National Environmental Policy.
9.2 National Environmental Policy, 2004 Malawi issued its National Environmental Policy with the stated goal of promoting sustainable social and economic development through sound management of the environment and natural resources. Climate change and air pollution are identified as threats to socio-economic development in Malawi. As a mainly agricultural economy, life for most Malawians is intimately intertwined with the climate. Any adverse climatic change will, therefore, impact most Malawians quite heavily. One of the 7 strategies identified for mitigating climate change is enhancement of GHG sinks (i.e. forests) through promotion of alternative energy systems to replace fuelwood. Air pollution is recognized to be inhibiter of social and economic development. Indoor Air Pollution (IAP), though not directly addressed in the policy, is probably the most widespread and serious air pollution problem in Malawi. The policy does not indicate any management or technical strategies to mitigate air pollution. However, substitution of fuelwood by alternative energy sources will help reduce IAP as well as reduce GHG emissions. Demand for fuelwood is understood to have significant adverse impact on forest resources. Conservation of forests through improving fuelwood use efficiency and substitution by alternative sources is considered in both the forestry and energy sectoral policies. The alternatives energy resources identified in the policy include paraffin, solar, biogas, electricity and coal. An ethanol-paraffin blend is proposed [as replacement to paraffin]. Ethanol [or the blend] will be the best option to meet the key objectives and principles18 as it is more viable compared to solar, biogas and electricity and at the same time it is GHG neutral unlike coal and paraffin. 18 These are GHG emission reduction, air pollution control, reduction of dependence on petroleum, and private sector participation.
43
9.3 Link between household energy and national development strategies Local ethanol fuel processing and stove assembly for local use or regional export will link into sub-theme one goals.
Medium and small scale businesses will engage in fuel processing, stove production, fuel and stove retailing and export. The ethanol business will create a new business and added production in Malawi.
Establishment of an ethanol fuel and stove business in Malawi has the potential to
regional exports.
The business will contribute to conservation of forest resources in Malawi through the substitution of wood and charcoal by ethanol. Additional environmental benefits are foreseen through reduction or elimination of indoor air pollutants domestic kitchens.
9.4 Household Energy Use and Deforestation Over the past decade, one of Malawi’s foremost environmental challenges has been addressing its rapid rate of deforestation, 2.8% annually, due mostly to land clearing for agriculture and the cutting of trees for woodfuel and charcoal production to meet energy needs. Every year 50,000 hectares of forest cover is lost. Demand for biomass energy outpaces supply, causing an energy deficit which exponentially contributes to environmental degradation (Ministry of Environmental Affairs. 2002). Woodfuels account for 89% of total energy use in the country. An estimated 76% is used for cooking, 22% for heating water, and 2% for space heating. In rural areas, wood is the primary cooking source along with minimal charcoal use, while both woodfuel and charcoal are used considerably in urban areas (Girdis and Hoskote. 2005). Near 80% of biomass consumption for all purposes is attributed to fuelwood, while charcoal accounts for 8.8%, and crop residues account for 11.2%. Rural areas are responsible for 83% of total biomass consumption (Girdis and Hoskote. 2005). In a study of community based forest management in southern Malawi, “Local Perceptions of Proximate Causes and Underlying Causes of Forest Decline” were determined as the following:
Figure 9.1 Proximate and for forest decline
44
The intersection of poverty and deforestation is apparent when the high proximate causal perception rate of charcoal production (76%) is viewed alongside the high underlying cause of poverty (77%). Charcoal production is a commercial venture for lower income groups that supplies energy demands in urban areas (Zulu, Leo Charles. 2006). People living in rural areas are permitted to use forest products in areas not protected by law for their personal use, but are not permitted to sell forest products without the permission of the Department of Forestry. Past government policy that banned charcoal production in wooded areas was not adhered to by locals, and was little enforced, resulting into what is today a sizable illicit charcoal trade in Malawi (Girdis and Hoskote. 2005). An additional outcome of tree felling and burning of wood is increased greenhouse gas emissions. Less tree cover reduces the size of the carbon sink in the country, while burning wood emits greenhouse gases, a double negative impact resulting from the use of wood, which is the primary cooking energy source in Malawi (Ministry of Environmental Affairs. 2002).
9.4.1 Institutional response In September of 1996, the Government of Malawi enacted a new National Forestry Policy which set out to “sustain the contribution of national forest resources and to improve and uplift the quality of life in Malawi by conserving the resources for the benefit of the nation.” The objectives of the policy were designed to give all citizens regulated and monitored access to some forest products, improve the quality of life in rural areas, stabilize the local economy, reduce environmental impact, and promote community based management of forest resources. However, lack of government funding has caused implementation of these measures to not be carried out (Girdis and Hoskote. 2005). Wood harvesting and charcoal production management is the responsibility of the Ministry of Forestry, Fisheries, and Environmental Affairs (MOFFEA). The Department of Forestry is housed within MOFFEA, and is the agency first responsible for forestry development, protection and conservation. However, because much of the woodland is not protected by government, but rather is found on farmlands or community lands, the government’s policy does not reach all woodlands (Girdis and Hoskote. 2005).
9.5 Benefit of Switching from Solid Biomass Fuels to Ethanol In a study conducted by WHO in 2005, it was determined that approximately 6940 tons of firewood is consumed in Malawi every year, which averages out to some 2227 kg of fuelwood per household/year, resulting in an average of 6.10 kg/household/day. Charcoal consumption for the subregion under which Malawi falls into estimates that 1.89 kg charcoal are consumed per household per day. It is estimated that for the subregion that Malawi was grouped into, US$ 1390 million would be saved if 50% households using traditional fuels for cooking were to switch to ethanol for cooking by 2015. While it is not possible to determine the exact amount to be saved by Malawi, one can infer that given the more than one billion dollars in cost savings for the region, Malawi would surely stand to benefit economically by moving towards ethanol as a cooking energy policy for its people (WHO. 2005). Note: the price per kg of wood used in the study was US$ 0.05 for urban areas and US$ 0.03 for rural areas. The price per kg of charcoal used in the study was US$ 0.30 for urban areas and US$ 0.15 for rural areas. Ethanol pricing per kg used in study was: US$ 0.36 (world price), US$ 0.52 (urban price), and US$ 0.624 (rural price).
45
Using the same study, if 50% of households in the subregion switched to ethanol by 2015 for cooking, near US$ 1 billion in local environmental benefits would be achieved. Globally, CO2 reductions for the same scenario would result in US$ 345 million in environmental benefits. CH4 emissions reductions would result in some US$ 11 million in environmental benefits (WHO. 2005).
46
10 ACTIONS FOR PROMOTION OF ETHANOL AS DOMESTIC FUEL Malawi, despite its considerable domestic resources, relies heavily on a limited set of domestic and imported energy sources. Its heavy reliance on solid biomass fuels has impacted severely on the health, productivity and economic well being of its citizens. On the other side, Malawi is also exclusively dependent on imported petroleum fuels for its transport sector and for meeting demand from segments of its industrial, commercial and domestic sectors; petroleum imports sap as much as 20% of its hard currency income. The Malawi Energy Policy underscores the need to move towards an environmentally and economically sustainable energy supply mix. One of the three strategic goals of the policy is to reduce its dependence on biomass fuels from 93% to 50% and increase the use of renewable energy from 0.2% to 7.0% by 2020.
The policy has issued six specific objectives to meet the goals outline above. Promotion of ethanol as a domestic cooking fuel will address three of the six policy objectives. These are
Objective 2: Improve the security and reliability of energy supply systems o Support other fuel ethanol applications (aside from petrol-ethanol blend)
Objective 3: Increase access to affordable and modern energy services, and o Review government fiscal policies to make modern energy services and end
appliances affordable o Promoting R&D into alternative modern fuels, for example, the possibility of
using ethanol gel to replace more costly options Objective 6: Mitigate environmental safety, and health impacts of energy production
and utilization. o Promoting environmentally benign energy technologies including RETs
through a combination of subsidies, tax breaks and other incentives as appropriate,
o Developing projects that will facilitate carbon trading under the CDM. The government has expressed the desire to support domestic production and use of ethanol for cooking. These policies must be backed up by concrete actions from government and non-government stakeholders to realize the policy goals. The following are the main actions required for promoting ethanol cooking in Malawi.
47
Stakeholder Action
Stove promotion In the first two years ethanol stove demand in Malawi can reach 2500 with an additional demand for 1500 stoves in the neighboring countries. For the first years, therefore, it will make sense to import the stoves rather than produce them locally. Local production of ethanol stoves should be promoted after two years based on the rate of adoption of the stoves. The CleanCook stove or another stove with similar or better performance (efficiency, safety, and cost) should be promoted for the first two years then locally assembled to lower production costs.
Department of Energy
Awareness and market development Seek partners for promotion of ethanol stoves then conduct the
promotion in Lilongwe and Mzuzu. B Promote the stoves with financing from partners. Also carry
out acceptability tests in up to 500 households. The partner should work with a private enterprise to import and demonstrate the stoves.
B Start promotion in Lilongwe and Mzuzu (few Blantyre residents use paraffin or LPG for cooking)
B Promotion should start with the highest and second highest income groups in these cities. Promote the stove as a safe, efficient and high quality product.
B Users should pay a significant share of the stove cost over several months (eg. Half the cost over six to twelve months)
Conduct further demonstration of the stoves based on results from the first acceptability tests and demonstrations.
Fiscal incentives Work with concerned government institutions to lower or waive
taxes for ethanol stove importers and producers.19 The benefits for the public will be significant.
Carbon finance Seek carbon finance to cover part of the stove cost (first for
promotion of the stove then to paying users)
Private enterprise (D&S, BluWave, other)
Import and local production of ethanol stoves
19 The government will forgo US$40,000/year in the local currency compared to savings of US$768,000 in avoided paraffin import costs in hard currency (this assumes an average annual sale of 4000 ethanol stoves, 20% tax on a US$50 stove, paraffin import cost of US$0.6/liter, and an ethanol stove displacing 320 liters of paraffin).
48
Stakeholder Action Fuel promotion
The ethanol available for domestic use in Malawi from existing producers will be 6 to 9 million liters. This amount of ethanol is currently exported from Malawi to neighboring countries. Malawi’s benefits would be enhanced if it uses its ethanol internally because it can then replace imported paraffin and LPG and also reduce charcoal used in the country.
Department of Energy
Awareness and market development See awareness and market development for promotion of ethanol stoves. Fiscal incentives Work to get duty and tax exemption for ethanol sold in Malawi
Ethanol producers
Ethanol production and supply
Private enterprise (D&S, BluWave, other)
Ethanol distribution D&S or/and BluWave can bottle and distribute liquid ethanol in Lilongwe and Mzuzu (because these have experience in handling and distributing ethanol fuel and stoves to consumers)
49
REFERENCES 1. Francis X. Jonson, Frank Rosillo – Calle, April 2007, Biomass-Livelihood &
International Trade, SEI Climate & Energy Report 1007-01. 2. Dan Liwimbi, 2006, Ethanol – The Spirit of Success. 3. Charles Seville & Veronica Kalema, March 2007, Fitch Rating, International Credit
Update, Republic of Malawi, www.fitchrating.com 4. Richard Record, Joy Richard Chipitula, Oct. 2005, A study into the impact of the EU
Sugar Reforms on Malawi, government of Malawi, Ministry of Trade and Private Sector Development.
5. Dean Girdis, Mangesh Hoskote, April 2005, Malawi: Rural Energy and Institutional Development, Energy Sector Management Assistance Program (ESMAP).
7. Department of Energy Affairs, Dec. 2006, Promotion of Alternative Energy Sources Project (PAESP), Project Document.
8. Sushenjit Bandyopadhyay, Priya Shyamsundar, Alessandro Baccini, Nov. 2006, Forests, Biomass Use and Poverty in Malawi, Draft Background Paper for the Malawi Poverty Assessment, World Bank Policy Research Working Paper 4068.
9. World Health Organization, 2007, Indoor Air Pollution, National Burdon of Disease Estimates.
10. Department of Energy Affairs, Ministry of Natural Resources and Environmental Affairs, Aug. 2002, Gelfuel Program in Malawi, Proceedings of Kambiri Lodge Workshop.
11. Sam Kainja, Dec. 2000, Forestry Outlook Study(FOSA) for Malawi. 12. James Robinson, Oct. 2006, Bio-Ethanol as a Household Cooking Fuel: A Mini Pilot
Study of the SuperBlu Stove in Per-Urban Malawi, A report developed from an MSc. Thesis.
13. PJD Lloyd and EM Visagie, April 2007, The testing of gel fuels and their comparison to alternative cooking fuels, energy Research Center, University of Cape Town, South Africa.
14. Malawi Integrated Household Survey 2004-2005, Volume 1, National Statistical Office 15. Malawi Multiple Indicator Cluster Survey (MICS), 2006, Preliminary Report, Feb 2007 16. Republic of Malawi, National Energy Policy, January 2003. 17. Rebecca J. Elias & David G. Victor, June 2005,Energy Transitions in Developing
Countries: a Review of Concepts and Literature, 18. Matthew Owen and John Saka, Oct 2006, The Gel Fuel Experience in Malawi: An
evaluation. 19. Júlio F.M. de Castro, May 2007, Biofuels – An overview, Final Report, DGIS/DMW/IB, 20. Liquid Biofuels for Transportation in Tanzania: Potential and Implications for Sustainable
Agriculture and Energy in the 21st Century, GTZ, August 2005 21. Douglas F. Barnes, Kerry Krutilla, and William Hyde, March 2004, The Urban
Household Energy Transition: Energy, Poverty, and the Environment in the Developing World.
22. UN-DESA REPORT, Final Report, Sustainable Energy Consumption in Africa, 14th May 2004.
23. The United Republic Of Tanzania, Ministry Of Energy And Minerals, The National Energy Policy, July 2000.
24. Godfrey Alois Sanga, TaTEDO, June 2005, Evaluation of the economic impacts of efficient stoves and cooking fuel substitution for urban households in Dar es Salaam, Tanzania, Dar es Salaam, Tanzania.
25. Clancy, J, 2003, Household Energy and Gender, the Global Context, Sparknet. 26. Hutton, G, Rehfuess, E, Tediosi, F, Weiss, S, 2006, Evaluation of the Costs and Benefits
of Household Energy and Health interventions at Global and Regional Levels, WHO. 27. Rehfuess, E, 2006, Fuel for Life: Household Energy and Health, Geneva, WHO
50
28. UNDP, 2006, Human Development Report, Oxford, Oxford University Press, http://www.afro.who.int/home/countries/fact_sheets/malawi.pdf
29. UNDP, Gender Issues and Activities in Malawi 30. United Nations 2004, Consideration of Reports Submitted by States Parties under Article
18 of the Convention on the Elimination of all forms of Discrimination against Women (CEDAW): Combined Second, Third, fourth & Fifth Periodic Reports of States Parties, Malawi.
31. 2000-2005, Malawi National Gender Policy – web address 32. Gaia Association, 2006, Annual Report Submitted to UNHCR 33. Gaia Association, 2005, Addis Ababa Pilot Study 34. Gaia Association and CEIHD, 2007, IAP Report, Addis Ababa 35. Hutton, G, Rehfuess, E, Tediosi, F, Weiss, S, 2006, Evaluation of the Costs and Benefits
of Household Energy and Health interventions at Global and Regional Levels, WHO. 36. UNDP, 2005, Energising the MDGs, - reference needed,
http://www.afro.who.int/home/countries/fact_sheets/malawi.pdf 37. WHO, 2002, Addressing the links between Indoor Air Pollution, Household Energy and
Human Health, Washington DC, WHO. 38. WHO, 2006, Health Action in Crises: Malawi,
(http://www.who.int/hac/crises/mwi/background/Malawi_June06.pdf 39. WHO, 2006, Country Profile: Malawi, 40. WHO, 2006, Country Health System Fact Sheet, Malawi, 41. WHO, 2007, Indoor Air Pollution: National Burden of Disease Estimates 42. Utria B, 2004, Ethanol and gelfuel: clean renewable cooking fuels for poverty alleviation
in Africa. Energy for Sustainable Development. 43. http://ceihd.berkeley.edu/Docs/CCT_Version_2.0_with_appendix5_Jan2007.pdf 44. Rob Bailis, Damon Ogle, Nordica MacCarty, and Dean Still Kirk R. Smith and Rufus
Edwards – Household Energy and Health Programme, Shell Foundation, http://ceihd.berkeley.edu/Docs/WBT_Version_3.0_Jan2007.pdf, http://ceihd.berkeley.edu/Docs/KPT_Version_3.0_Jan2007.pdf.
45. The ORIGO® stove manufactured by the ORIGO division of the Dometic Corporation, www.origo-sweden.com.
46. Chowdhury Z, Edwards R, Johnson M, Shields KN, Allen T, Canuz E, Smith KR, 2007, An inexpensive light-scattering particle monitor: chamber and field validations with woodsmoke, Journal of Environmental Monitoring, 9 (10), 1099-1106, http://ehs.sph.berkeley.edu/krsmith/publications/2007%20pubs/Chowdhury_et_al_2007_Particle_Monitor_Validation_JEM1.pdf.
47. Edwards R, Smith KR, Kirby B, Allen T, Litton CD, Hering S, 2006, An Inexpensive Dual-Chamber Particle Monitor: Laboratory Characterization, Journal of the Air and Waste Management Association, 56:789-799, http://ehs.sph.berkeley.edu/hem/hem/documents/Edwards_2006.pdf
48. School of Public Health, University of California, Berkeley, 2005, Indoor Air Pollution Team, Indoor Air Pollution Monitoring Protocols, Version 05.1, http://ceihd.berkeley.edu/heh.IAPprotocols.htm
49. Litton CD, Smith KR, Edwards R, Allen T, 2004, Combined optical and ionization measurement techniques for inexpensive characterization of micrometer and submicrometer aerosols, Aerosol Science and Technology, 38:1054.1062, http://ehs.sph.berkeley.edu/hem/hem/documents/Litton%20et%20al%20Final.pdf
50. World Health Organization, 2000, Air quality guidelines for Europe; second edition, Copenhagen, WHO Regional Office for Europe (WHO regional publications, European series; No 91).
51. WHO,2005, Air Quality Guidelines Global Update, Report on a Working Group meeting,Bonn, Germany, 18-20 October 2005. Geneva, (http://www.euro.who.int/Document/E87950.pdf).
51
ANNEX A. EVALUATION OF STOVES Evaluation Criteria Preliminary evaluation (screening) criteria is used to help eliminate stoves that are not suitable or not yet ready for household cooking in their present condition, including stoves that are still under research. It was also used to rank stoves and limit their number to the extent possible to conduct enough tests on each within the given period of time. All candidate ethanol burning stoves must pass the preliminary evaluation in order to conduct Controlled Cooking Tests (CCT). Stakeholders in Malawi were expected to suggest candidate stoves and participate in the evaluation. The evaluation criteria was not actually used to eliminate stoves from testing as the number of stoves available for testing was manageable to conduct enough tests on each stove within the given period. For statistical validation each stove had to be tested at least three times with a possibility of repeating additional tests in case of outlying data. With the suggested CCT protocol, a maximum number of 6 stoves could be tested in the time available. Categories/types of stoves tested Improved charcoal and firewood stove were suggested as “must be tested” as their data was needed as benchmarks for comparison of cooking cost. All ethanol based stoves including gelfuel stove that were available were tested. Lily stove was not available in Malawi during stove evaluation. However, the evaluation criteria was applied on a sample Lily stove obtained in Ethiopia. The outcome of the evaluation, tells that Lily stove is rather a burner than a stove and does not qualify as a household stove. The following table shows list of stoves tested.
Table A1. Types of stoves tested
No Category of Stove Type of stove Fuel type Stove Name Remark
Improved biomass Charcoal burning Charcoal Jiko Most commonly used
3 Bluwave Earlier design 4 Clean Cook Single burner 5
Ethanol D&S Liquid stove
6
Ethanol based
Ethanol based stove
Gel fuel D&S GELFUEL stove Chetetezo – designed and produced by ProBEC CleanCook – product of Dometic AB D&S GELFUEL stove used with ceramic fiber pad so that it can be used with liquid ethanol
CCTs could not be conducted on paraffin, electric and LPG stoves. These are stoves with likelihood to be displaced by direct ethanol or gel fuel. For reason of comparison, their performances were estimated based on their efficiency and average energy output for Nsima (maize porridge) cooking, energy absorbed by the food to be cooked. Preliminary Evaluation Criteria The preliminary criteria are based on only physical inspections. The criteria are divided into three groups as safety condition, functionality and design. Each criterion under the group will be evaluated as High, Medium, Low, Minimum having associated values of 4, 3, 2 and 1 respectively. Failing to fulfill certain criteria (those indicated by asterisk below) will result an
52
outright rejection of the stove. Each one of these criteria by themselves are sufficient conditions to fail a stove.
Table A2. Screening Criteria No. Criteria Group Criteria Rank Range (1 to 4) Ranked 1 *Stability Yes or No 2 Cookstove tipping High/Medium/Low/Minimum 3 Handling High/Medium/Low/Minimum 4 Surface Temperature High/Medium/Low/Minimum 5 Containment of
Combustion High/Medium/Low/Minimum
6 Sharp Edges/Points High/Medium/Low/Minimum 7
Stove Safety
Separate fuel storage Yes or No 8 Ease of lighting High/Medium/Low/Minimum 9 Power regulation High/Medium/Low/Minimum 10 Time between
Ranking:- High/V.Good = 4; Medium/Good = 3; Low = 2; Minimal/Poor =1; Most of these criteria are taken from Safety Protocols developed by Nathan G. Johnson from Iowa State University. They have been used to test many stoves, and are generally accepted by most folks working with improved cook stoves as a fair assessment. Illustration of Criteria: • Stability – the tendency of the stove to fall down due to actions performed during
operation; while stirring the food, accidental pushes, etc, • Cookstove tipping - no fuel leakage if stove tips over, or upside down even if it thumps to
the floor from a counter, • Handling – portability, size, • Surface Temperature –any surface of the stove body touchable during cooking should not
be hotter than that can be touched (including the handles), • Containment of Combustion - Flame/ Heat surrounding cookpot, flame/ heat which can
harm the cook while cooking , • Sharp Edges/Points – that can cause cuts while handling the stove, • Separate Fuel Storage (Flames/Heat Exiting Fuel Chamber) – the fuel in the tank should
not be heated above its flash point within one hour of lighting the stove (or the cooking period). If the burner itself is the fuel storage the fuel reaches its flash point in a few minutes after lighting – this is real cause of accident. This criteria however may not apply to gel fuel burning stoves,
• Ease of lighting – How difficult is lighting or how long does it take to be ready, • Power regulation – How smooth is fire power controlling and also how fast can the fire be
extinguished, • Time between refueling – How long does it cook with the stove started full, • Power generated – Minimum firepower (Power input) must at least be 1kW as
preparation of the staple food in Malawi (maize porridge) for an average family size (of 5 people) requires an output power of about 700W,
• Durability – durability the stove and various parts of the stove – the workmanship, the material used, etc,
• Aesthetics – the attractiveness of the stove,
53
If there are too many candidate stoves and identification becomes highly contested, single Water Boiling Test could be conducted on some of them. Results of Evaluation Stove Labels: BWS – Bluwave stove D&S – GELFUEL stove from D&S limited D&SE – GELFUEL stove used with liquid ethanol (has ceramic fiber bad), Lily – Lily ethanol burner, Jiko – Metal cladded ceramic liner charcoal stove, CWS – Chitetezo wood stove,
Table A3. Ranks of stoves Rank (1 to 4) and weighted value No Criteria
Group Criteria Weight % BWS D&S D&SE CC Jiko CWS Lily
Sum/out of total 46/52 39/52 37/52 51/52 39/48 36/48 28/52 Total Weighted (out of 4) 3.4 3.15 2.9 3.95 3.1 2.9 2.2 Total 88.5 75.0 71.2 98.1 81.3 75.0 53.8 Percentage Weighted average 85.0 87.5 72.5 98.8 86.1 80.6 55.0
Rank based on weighted average 4 2 6 1 3 5 7 Ranking:- High/V.Good = 4; Medium/Good = 3; Low = 2; Minimal/Poor =1;
54
ANNEX B. DESCRIPTION OF SELECTED STOVES IN MALAWI Bluwave (SuperBlu) Stove (SBS) SuperBlu stove is developed by Bluwave Ltd. It has been specially developed to burn ethanol in an economic and safe way. The stove first heats the ethanol to above its boiling point of 78ºC at which point the fuel vaporizes. It is then passed over a copper catalyst at a temperature of 400ºC where the process of hydrogenation takes place and the ethanol reacts to form acetaldehyde and hydrogen gas. The stove is started by pouring a small quantity of ethanol into the nozzle preheat reservoir and igniting it with either matches or the supplied piezo-electric starter stick. The combusting fuel draws air from under the flash plate causing a partial vacuum in the bottom of the burner cup and also in the fuel tank. This then causes fuel to be sucked, via the fuel feed pipe, from the tank into the burner cup where it is heated by the nozzle element. Once above 78ºC the fuel vaporizes and gaseous ethanol rises up the capillary feed pipes towards the nozzle. The pilot tube ensures ignition and the burning ethanol, in the form of a low blue flame, heats the nozzle to approximately 400ºC at which point the stove becomes operational. The entire starting process takes under 5 minutes but is dependant on fuel levels in the tank. Once operational the ethanol gas passes around the nozzle tunnel, becomes superheated and undergoes hydrogenation. This process causes the developed blue flame to have a yellow outer section making it more visible to the user. The fuel feed and outlet pipes ensure that there is only a minimal level of fuel in the burner cup ensuring a controlled combustion and a high degree of safety if the stove is turned over. When operational the tank is kept under vacuum, enabling the fuel to be stored in liquid phase at high temperatures well above the ambient flashpoint temperature of 14ºC. Bluwave (SuperBlu) stove Bluwave stove
55
CleanCook stove CleanCook stove is designed to burn liquid ethanol. The new CleanCook stove prototype is modeled after the ORIGO® stove manufactured by the ORIGO division of the Dometic Corporation. The ORIGO stove was developed by Swedish inventor Bengt Ebbeson of Halmstad in 1979. Since that time, the ORIGO stove has become one of the most popular stoves in the boat and recreational vehicle (RV) market, where safety and cleanliness are held at a premium. Acquired by the Electrolux Corporation in 1986, the ORIGO stove and its company are now part of the newly formed Dometic Company, which is constituted in part of the former alcohol appliance division of the Electrolux Corporation. It is a non-pressurized alcohol stove that retains its liquid fuel in a manner that prevents spilling, leaking, fires and explosions. It is equipped with a refillable fuel canister containing a permanent, porous, refractory mass that absorbs the alcohol and makes it available to the flame by capillary action. The fuel canister is durable and will last the life of the stove (15 or more years), but can be easily replaced. The fuel used is alcohol, ethanol or methanol or a combination of the two, which are miscible in any proportion. The stove has been redesigned for the Ethiopian market to be economically manufactured, to be stronger, hold larger pots, and hold round-bottomed pots. Further modifications will be made to the design of the stove after the commencement of local production. CleanCook – single burner
CleanCook – double burner
The Improved Charcoal Stove Initially developed in Kenya and has got the name Kenyan Ceramic Jiko (KCJ). The design has been adopted in many countries in the region, in Malawi it is called Malawi Ceramic Mbaula. The Improved Charcoal Stove has a ceramic thermal liner with an outside metal cladding. The liner helps increase efficiency compared to the traditional all metal charcoal stove. It is perhaps one of the most widely disseminated improved solid biomass stove in the world. Its diameter is approximately 25 cm and weighs around 3.5kg. Charcoal is placed in the middle of the ceramic liner and lit with ignited wood and the starting process takes around 5-10 minutes. Combustion air enters via an air door on the base of the stove.
Improved Charcoal Stove (Jiko)
(Picture by Robinson)
56
Gel Fuel Stove (GFS) The Gel Fuel Stove is a simple can structure with a regulator that sits in a basic metal frame. Fuel is poured into the can though the middle of the regulator and lit with matches, quickly producing a developed blue flame. The stove is turned off by placing a lid over the regulator. Gel Fuel stove to burn ethanol Similar to the gel fuel stove but with fiber glass pad inside the fuel container to absorb ethanol and prevent fuel spillage. It has a regulator fitted in the basic metal structure. Fuel is poured into the can through the middle of the regulator and lit with matches, quickly producing a blue flame. By placing a lid over the regulator the stove can be shut off. Its efficiency and emission results are similar to the gel fuel stove. Imporved Wood Stove (Chitetezo Mbaula) Chitetezo is developed by ProBEC in Malawi. In Chichewa language Chitetezo Mbaula means “protecting stove”. It is primarily designed to burn wood in a safe, cleaner and affordable manner. Chitetezo is made from fired clay and weighs about 10 kg which provides more stability. It can accommodate pot sizes that range between 120 mm to 127 mm in diameter. The wider top part gives the stove a conical structure.
Gel Fuel Stove
Gel Fuel Stove
Chitetezo stove
57
ANNEX C. CONTROLLED COOKING TEST (CCT) Selection of test protocol For comparison of cooking cost, various stoves the fuel of which can be displaced by ethanol need to be tested. Water boiling test may not always tell performances of stoves in actual cooking. Stoves performance may also differ depending on the type of food cooked with them. A stove that performed well in cooking a particular type of food may not be so in another. Therefore, stoves should be tested by cooking the main food that they will be used to cook in an area of interest. In this study Controlled Cooking Test (CCT) is used to evaluate the comparative cost advantage of using various fuels and stoves in Malawi. Stoves, therefore will be evaluated by Fuel Consumption Index (FCI), a unit of fuel consumed to cook a unit of food. In the case of Malawi, Nsima (thick maize porridge) which is the staple food is used for CCT. CCT is not a silver bullet instrument that precisely tells performances of stoves. Comparison with FCI does not have the mechanism to judge the food when it is just cooked. There is some subjectivity of the cook to tell when the food is cooked enough. Some cooks take off food from the stove earlier while others let it stay a bit late – but in all cases the food is simply referred to as cooked food. The more the food is cooked the lighter it becomes and the more fuel it consumes. In such cases the result of FCI is doubly affected and of course wrongly judges stoves misleading the tester. All CCT protocols are subject of this fact. CCT protocol used in this evaluation is that of Aprovecho but with additional efficiency term which helps account the evaporated water and energy absorbed by the food (useful energy or energy output) with respect to the energy consumed. This will help to consider the cooks factor to a greater extent. This sort of protocol has actually been used in developing an improved injera (Ethiopian diet) stove in Ethiopia as part of the World Bank Energy 1 project. The problem of (over) cooking injera was evident as cooked injera can contain moisture contents that vary between 20% and 30%. This method is adapted as to apply to Nsima cooking. Nsima is normally served with fish source (boiled fish with tomato and onion) and vegetables (Rape) as a side meal. In this regard the major cooking is preparation of maize porridge which takes on average about 40 minutes. The time required for other cooking is: boiling fish – 7 minutes, the sauce for fish – 10 minutes, boiling rape takes 13 minutes, and sauce for rape takes 8 minutes. The major cooking which is the most energy intensive and the longest cooking is Nsima. This is preparation of food that serves five adults (Robinson 2006). Limited by time, the CCT did not include preparation of the whole menu but cooking the main dish, Nsima. See test procedure in Annex E. Description of Test set up Tests were conducted in ProBEC lab in Mulaje in two separate labs. In each lab only one stove at a time was tested as emissions of particulate matters and CO were also being measured at the same time. A total number of twenty one tests were conducted on six different types of stoves and four different types of fuel. The test facility was equipped with digital balances with 1 gm precision and 30 kg capacity, digital thermocouples with 0.1oC precision, and moisture meters for measuring wood moisture in percentage of weight wet basis. HOBO and UCB were used for Indoor Air Pollution (IAP) measurement (see Annex D for details of IAP measurements). One of the labs at ProBEC was a well ventilated model kitchen. In order to avoid differences between the two labs, all the opening around the kitchen below about 80 cm from the roof
58
were covered. IAP measurements were taken in the other testing lab. Two cooks did all the tests; each one of them had a chance to cook with every stove. An hydrous ethanol (96% ethanol), gel fuel, charcoal and wood were the fuels used for the test. Heat values were not specifically measured for the samples of fuels used. Lower heat values considered for ethanol, gelfuel, charcoal and wood were 24.8, 16.4, 28.2 and 18.96 MJ/kg (Aprovecho, Lloyed et.al, 2007, Robinson 2006). Metal pots of similar size and weight with a capacity of 3 liters were used for cooking. The height and inside bottom diameter of the pots are 110 mm and 200 mm respectively. The weights of pots vary between 1300 and 1500 gm. Results Controlled Cooking Test (CCT) Four ethanol based stoves including gel fuel, a wood stove and a charcoal stove were tested. Each stove was tested at least three times. Summary of test results are as below.
FCI is helpful to evaluate stoves that burn same type of fuel. However, if the comparison is among stoves that use different types of fuels, the evaluation parameter should rather be the energy input per weight of cooked food. Comparing evaluations by FCI and Energy Input give a rather different ranking of stoves as it can be deduced easily from the above table. Based on this CCT result, Clean Cook stove comes out to be the most energy efficient stove, followed by D&S GEFFUEL (with gelfuel), and D&S with liquid ethanol and Bluwave in their respective order. Jiko with charcoal and Chitetezo with firewood came out to be the last ones. The relative saving and comparison of a stove among the others is shown in the table below.
Bluwave 33% (16%) (7%) -47% -133% Clean Cook -49% (-26%) -39% -120% -249% D&S GELFUEL (-19%) (20%) (-10%) -75% -177% D&S with ethanol (-8%) 55% (9%) -59% -151% Jiko – charcoal 32% 55% 43% 37% -58% Chitetezo - wood 57% 71% 64% 60% 37% Negative values indicate that consumption is low by the indicated percentage Numbers in parenthesis indicate that differences are not significant at 95% confidence level
From the above table one can certainly conclude (at 95% confidence level) that all ethanol based stoves (including gel fuel) perform much better than the improved stoves for charcoal and firewood.
Among all ethanol stoves Clean Cook stove exhibits the greatest saving over charcoal and wood stoves. Compared to Clean Cook stove, Jiko and Chitetezo stoves consume 55% and 71% more fuel respectively.
Bluwave stove consumes 47% less fuel compared to Chitetezo wood stove. It can also be said that Chitetezo stove consumes 57% more fuel compared to Bluwave stove.
Bluwave consumes 33% more fuel compared to Clean Cook stove (or Clean Cook consumes 49% less fuel compared to Bluwave stove).
Other parameters that households mind while cooking are ease of lighting (or heat up time) and cooking time. These are some of the parameters among others that determine the convenience or ease of use. Lighting time (stove heat-up time) is relatively short but with charcoal and wood stoves it may take up to 10 minutes depending on the fuel moisture. The firewood used in this CCT was quite dry and the mean lighting time was under two minutes for Chitetezo stove. Bluwave stove needs to warm up before putting the pot on. Though lighting is easier, the stove on average has to be heated up for about five minutes. Cooking time is rather important for the cook. Comparison of cooking time among stoves is shown below. Comparison of stoves by cooking time
Bluwave 39% (13%) 20% 39% (15%) Clean Cook -64% -43% -31% -38% (-39%) D&S GELFUEL (-15%) 30% (8%) (3%) (2%) D&S with ethanol -25% 27% (-9%) (-5%) (-6%) Jiko – charcoal (-19%) 27% (-4%) (5%) (-1%) Chitetezo - wood (-18%) (28%) (-2%) (6%) 0% Negative values indicate that consumption is low by the indicated percentage Numbers in parenthesis indicate that differences are not significant at 95% confidence level
60
The difference in cooking time among the stoves tested is minimal. Clean Cook stove is the only stove that takes less cooking time at 95% confidence level compared to the other ethanol based stoves and Jiko stoves.
Table C4 Amount of fuels displaced by a liter of ethanol using Clean Cook stove
Chitetezo wood (kg)
Jiko Charcoal
(kg)
D&S GelFuel (Liter)
LPG (kg)
Paraffin (Liter)
Electricity (kWh)
3-stone wood (kg)
1 Liter of ethanol using Clean Cook stove can displace
4.3 2.1 2.0 0.6 0.9 6.8 6.4
Observation Bluwave stove While conducting the third CCT on Bluwave, more ethanol came out from the container through the burner to the outer surface of the stove; and the stove was set on fire. The fire was extinguished with water and test was interrupted. After the stove is let to cool down, another test was conducted and successfully completed. Product standardization is the current problem facing production of Bluwave stoves. Manufacturer of Bluwave stove (Bluwave Ltd.) claims that it has improved the stove both in terms of performance and safety. As a solution for production difficulty, it has proposed manufacturing of high precision components abroad and less complicated parts of the stove and assembling will be done locally. Unfortunately, the prototype of the final design could not be available for testing during the time the team was conducting CCT in Malawi. Hence, the evaluation for performance and safety is based on the earlier version provided to the team by Bluwave Ltd. D&S GELFUEL Stove Power regulation and extinguishing of fire is not so smooth nor easily manageable with liquid ethanol as with gelfuel. Fire is extinguished by putting back the lid on the stove – flames are longer when the stove burns liquid ethanol. The design of the stove lid should be made as to tightly seal the stove when cooking is over – this will help reduce the amount of ethanol that will evaporate from the left over ethanol in the container.
61
ANNEX D. EMISSIONS TEST RESULTS Carbon Monoxide (CO) and Particulate Matter (PM) were chosen as Indoor Air Pollutants to be measured since they have most consistently been associated with respiratory and cardiovascular health effects. The equipment that was deployed during the Controlled Cook Test (CCT) collects both CO and PM. The CO concentrations in the cooking rooms were measured with the HOBO CO logger, which was set to record concentration every minute. Fine particulate matters were measured by the University of California Berkeley Particle Monitor (UCB PM), which uses a photoelectric detector. The UCB PM measured the PM concentration every minute (reported in units of milligrams PM per cubic meter of air, mg/m3). So far tests have been completed with different type of stoves in a controlled room setting. Indoor Air Pollution (IAP) tests empirically show different level of emissions. The results from the IAP study are compared and analyzed below. Methods Installing the indoor air pollution (IAP) instruments in a standardized manner was somewhat challenging. A variety of factors (including irregularly shaped rooms, different building materials, varying stove types and locations, and so forth) made it difficult to standardize the placement of the IAP instruments. However, it was critical to use standard installation guidelines throughout the IAP sampling period. The following standard procedures were used for the comparison of measurements taken within ProBEC laboratory and for the presentation of results in a scientifically convincing manner. Particularly important was standardizing the height of the IAP samplers, because air pollutants are extremely vertically stratified inside a house (concentrations increase greatly with increasing height in a room). The IAP study was conducted in a total of twelve tests on CleanCook stove (CC), Bluwave stove (BWS), Gel Fuel (GF), Gel Fuel stove used with liquid ethanol (LGF), Kenyan Ceramic Jiko (KCJ), and Chitetezo wood stove (WS). This involved several Controlled Cooking Tests on preparation of Malawian staple food (Nsima). This test was designed to assess and compare the performance of different stoves and fuels using the HOBO CO logger and UCB. These instruments were set to record concentration every minute. The amount that was cooked represented average lunch for a family of four. During the test there was no frying of meat or deep frying, the reason for not performing these cooking activates was because they could lead to a significant additional source of organic carbon. Sampling times varied from 25 to 60 min, depending on the cooking time taken by stoves. The test place was in ProBEC Laboratory and the structure of the cooking areas is 330 _ 290 _ 360 cm (W _ H _ L) with a door and window for ventilation. During the study stove position in the room had not moved and the instruments were placed in the same location for each stove test. Monitoring equipment was positioned in kitchens in accordance with the standard placement protocols given by Center for Entrepreneurship in International Health and Development (CEIHD) The requirements were: 1. 100 cm from the edge of the stove (combustion zone) 2. 140 cm above the floor 3. 150 cm from any openable door or window, where possible
62
IAP measuring devices were placed for a 12 hour period in accordance with the above requirements for each test day. IAP levels were measured for various stoves and fuels - liquid ethanol stoves, gelfuel stove, charcoal stove and imporved wood stove. The instruments were co-located (placed next to each other) with a two centimeters of space between them to ensure that their inlets are not blocked. Over the duration of the study, measurements were taken in the same kitchen with equipments installed in same position to ensure that comparison of stoves will not be confounded by factors that are not constant in the lab. Although comparisons may be influenced by time-varying characteristics, the effects of these characteristics on air pollution levels should be minimal over the duration of this study. CO concentrations in the room were measured with HOBO CO logger (model # H11-001, Onset Computer Corporation, Bourne, MA, USA), which was set to record concentration levels every minute. Before starting measurements, a co-location calibration check was performed to test whether or not the HOBO logger was working properly. The HOBO logger was tested against a “Gold Standard” (and was not otherwise used) HOBO logger. This protocol was followed after each of the devices was used six times. The UCB particle monitors were produced and calibrated in the IAP Lab at UC-Berkeley before they were used. Photoelectric chambers of each device were cleaned with isopropyl alcohol after every five uses. Results The baseline (night-time, low) level in parts-per-million (ppm) were reasonably low during the sampling period of CO measurement. Baseline readings of HOBO were in the range of about 0.2 – 3.7 ppm. PM baseline level too was quite flat and registered almost zero. The graph revealed the pattern of peaks and lows which signifies a clean data set. Using Excel spread sheet the average value of the CO concentration was calculated. The average value of the concentration indicates the correct channel that should be used. The choice of channels depend on the overall maximum CO reading: if the maximum CO reading is less than 124.3 ppm, the average formula should use Channel 1; if the maximum CO reading is greater than or equal to 124.3 ppm, but less than 497 ppm, the average formula should use Channel 2; if the maximum CO reading is greater than 497 ppm, the average formula should use Channel 3.
Pictures of Lab Installation of IAP Instruments
140 cm high
100 cm from edge of combustion zone
63
Monitoring equipments were placed and began collecting data 20 minutes before any material was cooked. Background CO and PM levels were measured before and after each cooking. Averages of these background measurements were subtracted from the concentrations measured during the cooking event. Carbon monoxide contribution from human respiration was estimated to be negligible. Contribution of pollutants at the background was also adjusted while calculating PM emission factors. The graph below shows mean values of Carbon Monoxide (CO) emissions from each stove. The lines represent the values of HOBO CO logger, which was set to record concentration every minute. The time required to conduct CCT depended on lighting (heat-up) time and cooking time taken by the stoves. Due to this factor the rage of cook time varied for each stove. Bluwave and the charcoal stove (Jiko) took longer lighting and heat-up time and hence the overall cooking time was longer.
Figure D1 Time series values of CO emissions from stoves tested
0
50
100
150
200
250
300
1 6 11 16 21 26 31 36
Time (ppm)
CO
(ppm
)
CCGel FuBWSLGSKCJWS
In terms of CO emission levels, Jiko stove using charcoal is the highest, while CleanCook stove emitted the least. Average values of Particulate Maters (PM) emitted by each stove are presented in the figure below.
64
Figure D2 Time series values of PM emissions from stoves tested
-5
5
15
25
35
45
55
65
1 6 11 16 21 26 31 36
Time (min)
PM (m
g/m
3)
CCGel FuelBWSLGSKCJWS
Highest PM level was observed while cooking with the charcoal stove. Occasionally, the cook placed small pieces of trash wood for the lighting of charcoal. These small pieces of wood easily ignite but unfortunately produce sooty smoke. The next highest PM level was for the wood stove. Wood used for the study was thoroughly dry. All liquid ethanol and gelfuel stoves emitted very low level of PM.
Figure D3 Mean CO and PM profile for all stoves
Mean CO profile for all stoves
0
50
100
150
200
250
BWS CC Gel Fuel LGS KCJ WSStove Type
CO
(ppm
)
Mean PM profile for all stoves
0
1
2
3
4
5
6
7
BWS CC Gel Fuel LGS KCJ WSStove Type
PM
(mg/
m3 )
Table D1 Average and maximum values of CO and PM concentrations in test lab during CCT HOBO CO(ppm) PM2.5 Concentration (mg/m3) Stove Ave Max STD Ave Max STD
From mean values of emissions it can be concluded for sure that ethanol based fuels reduce the carbon fuels and stoves reduce concentration of particulate matters to a significant extent as compared to solid biomass fuels. Carbon monoxide level in a kitchen is very high when cooking with charcoal. Reduction of CO level is also evident with ethanol fuels with maximum reduction obtained with CleanCook stove. Discussion Comparison of CCT Concentrations to International Standards The World Health Organization (WHO) sets air pollution guidelines to offer guidance in reducing the health impact of air pollution (both indoor and outdoor) based on current scientific evidence. WHO recently sets new Air Quality Guidelines (AQG) for PM2.5, ozone, nitrogen dioxide, and sulfur dioxide, along with interim targets that are intended as incremental steps in a progressive reduction of air pollution in more polluted areas (WHO, 2005). The guideline for carbon monoxide was set in 2000 (WHO, 2000). The results of the IAP monitoring are compared to the World Health Organization’s AQG and interim target-1 (WHO, 2005) in Table below. Note that the CO concentrations reported above in parts per million (ppm) were converted to mg/m3 to match the unit used by WHO (by multiplying by the gram molecular weight of CO, 28, and dividing by the conversion factor of 24.45).
Table D2 Comparison of kitchen concentrations to WHO guidelines
(minutes – average)
BWS CC Gel Fuel LGS KCJ WS
WHO interim target-1
WHO AQG
PM2.5
μg/m3 (minutes average)
0 (37)
4 (22)
0 (30)
179 (25)
6300 (39)
1153 (22)
75μg/m3 (24-hr avg.)
25 μg/m3 (24-hr avg.)
CO (mg/m3) (minutes average)
79.10 (37)
48.34 (22)
91.82 (30)
93.23 (25)
228.59 (39)
94.54 (22)
NA
10 mg/m3 (8hr avg.)
WHO target-1 and AQG are averages over 8 and 24 hours. This time duration includes cooking time and non-cooking time as well. The results given above for the stoves are averages of emission levels during cooking period; it is therefore obvious to expect a higher number compared to WHO standards. PM levels in the kitchen was zero while cooking with Bluwave (BWS) and D&S stove (using gelfuel). On the other hand for the charcoal stove (Jiko) and wood stove (Chitetezo), the PM level was high. Though emissions of stoves were measured in actual cooking time (maximum 40 minutes), the concentration levels while using ethanol based fuels are in the same magnitude as that of WHO standards. Health Implications Indoor air pollution is associated with tuberculosis, asthma, recurrent respiratory infection, chronic bronchitis and chronic obstructive pulmonary disease. It has been postulated that decreasing IAP in third world dwellings might improve respiratory health and in addition decrease infant, child and adult mortality (Zhou et al., 2006). The study on quantifying the human health impact of air pollution has evolved in the last several decades. The advancements in quantifying the effects are due to improvements in pollution monitoring, epidemiological studies, and statistical techniques. Epidemiological
66
studies have measured outdoor air pollution (primarily particulate mater) and impacts on the following health conditions: mortality, hospital admission for cardiovascular and respiratory disease, urgent care visits, asthma attacks, acute bronchitis, respiratory symptoms, and restrictions in activity (Ostro, 2004). As noted above, the WHO Quality Guidelines apply to both outdoor and indoor air. These issues not only affect adults but also children under the age of five. Studies have shown that there is an association between ambient PM and infant mortality (Ostro WHO report, 2004). There is also an association between PM and low birth weight and premature delivery (Ostro WHO report, 2004) (Ritz et al, 2000). Both long and short-term exposure to IAP has detrimental effects on these populations. This study has shown that the appliance employed to burn these alcohol-based fuels (ethanol and gelfuel) are good in terms of their ability to reduce IAP levels with some variation among themselves. In terms of PM emission D&S stove used with liquid ethanol emits more compared with the other stoves that use the same type of fuel.
Table D5 Rating of stoves by their emission levels
Emissions from Stoves Overall Rating Carbon monoxide Particulate Matters
Best CleanCook Stove Bluwave Stove Gel Fuel Stove CleanCook Stove
Good Bluwave Stove D&S Gelfuel stove using liquid ethanol
ANNEX E. CCT PROCEDURE FOR WOOD STOVES Input: Initial Measurements A TEST No. B Stove Type C Air Temp. (oC) D Local boiling temp (oC) E Initial Water Temp. (oC) F LHV of fuel (kJ/gm) G Wood moisture (%) H Wt of empty pot + lid (gm) I Initial Weight of flour (gm) J Initial weight of water (gm) K Initial weight of wood (gm) L Time fire lit M Starting Time Final Measurements N Final Time O Remaining Wood (gm) P Remaining Charcoal (embers) (gm) Q Final weight of food+Pot+Lid (gm) R Weight of remaining flour (gm) S Weight of remaining water (gm) Outputs:- Calculation T Weight of flour used (gm) (R - I) U Weight of water used (gm) (S - J) V Weight of Adjusted wood (gm) (K-O)-((K-O)*G+P*1.5+((K-O)*G*((0.004186*
(D-C))+2.26))/F) W Weight of cooked food (gm) Q -H X Ignition time (Min) (M36-L36) Y Cooking Time (Min) (N - M) Z Fuel per cooked food (gm) (V/W) AA Energy Output (KJ) (D - E)*U*0.004186 + (D - E)*T*0.0018 +
((T+U)-W)*2.26 AB Energy Output per kg of
food (KJ) ((AA/(W/1000)))
AC Efficiency (%) (AA/(AF))*100 AD Power Output (KW) AA/((X+Y)*60) AE Power Input (or Fire power) (KW) AF/((X+Y)*60) AF Energy Input (KJ) V*F AG Rate at which wood burns (gm/S) (K-O)/((X+Y)*60) Where:- 0.004186 kJ/gm = specific heat of water 0.0018 kJ/gmK = specific heat of flour (ranges b/n 1.8 – 1.88kJ/kgK 2.26 kJ/gm = Latent heat of vaporization
68
Descriptions: Add 1845 gm of water in the pot and light the stove. When water reaches about 60oC, add 200 grams of maize flour. Stir well and put the lid on. When the water boils, add more flour (400 gm) and keep stirring the food until it is cooked. Wood Moisture – Using a moisture meter take readings from five wood samples. Five readings will be taken from each sample (a total of 25 readings) and will be averaged. The readings should be distributed along the surface of the wood sample so that the average will be representative of the sample. Weight of Adjusted Wood - the wood used will be adjusted for the moisture content and the charred wood embers leftover at the end of each test. Moisture content of wood shall be measured on a wet weight basis and this amount will be subtracted from the total weight of wood used. The energy that would be consumed to dry up the wood used will also be calculated and deducted from the measured weight of wood. This includes the energy used to heat up and evaporate wood moisture. The initial temperature of the wood moisture is assumed to be equal to the room temperature. Energy Output – is the energy absorbed by the food (i.e. the flour and water). It takes the specific heat of flour and water into consideration. Energy Input – the amount of heat released by the fuel. Power Output – The rate at which power is being absorbed by the food. Power Input (Fire Power) – the rate at which heat is being released by the fuel. Efficiency – (Energy Output/Energy Input)*100%
69
ANNEX F. CONTROLLED COOKING TEST DATA COLLECTING SHEET
70
71
72
ANNEX G. PROJECTED FINANCIAL STATEMENTS Please see the attached MS Excell spread sheet
73
ANNEX H. LIST OF CONTACT PERSONS United Nations Development Program – Malawi Ms. Agnes Chimbiri, Assistant Deputy Resident Representative Ms. Etta R. M’mangisa, Programme Analyst Mr. Jan Willem van den Broek, Broker Growing Sustainable Business (GSB) Programme Government of Malawi Malawi Investment Promotion Agency (MIPA) Ms. Suzana Tangu Mjuweni, Manager, Corporate Affairs Mr. Jonathan K. Banda, Manager, Investor Service Mr. Victor Mponda, Investor Service Executive Mr. B. Kaselo, Documentation Section Head Mr. Patrick Mandula, Chief Accountant Department of Energy Affairs, Ministry of Energy, Mines and Natural Resource Mr. Harry W. Chitenje, Deputy Director of Energy Affairs Mr. Joseph Kalowekamo Environmental Affairs, Ministry of Energy, Mines and Natural Resource Dr. Aloysius Kamperewera, Deputy Director Environemtal Affairs GTZ - ProBEC (Programme for Biomass Energy Conservation in Southern Africa) Ms. Christa Roth, Joint Regional Coordinator, for Malawi, Zambia and Tanzania Dr. Christoph Messinger, Joint Regional Coordinator, for Malawi, Zambia and Tanzania Mr Francis Chagunda, Renewable Energy Engineer D&S GELFUEL Ltd. Mr. Sandy Wynne-Jones, Managing Director Mr. Richard Franz BluWave Ltd Mr. A.Gaffar A.Jakhura, Chairman Dr. Eddie J.S. McFadden, Technical Director TNT Post Drs. Inge C.J.M. Knapen, Project leader, Private Sector Partnership TNT-WFP