10
Malaysia – Mobile market projections 2020 2 futures … - Stagnate or Grow Saravanan S Freelance Consultant – Telecom Strategy & Change [email protected] 3 April 2015 [email protected] 1
| Date post: | 30-Jul-2015 |
| Category: |
Business |
| Upload: | saravanan-s |
| View: | 99 times |
| Download: | 0 times |
Malaysia – Mobile market projections 2020
2 futures … - Stagnate or Grow
Saravanan SFreelance Consultant – Telecom Strategy & [email protected]
3 April 2015
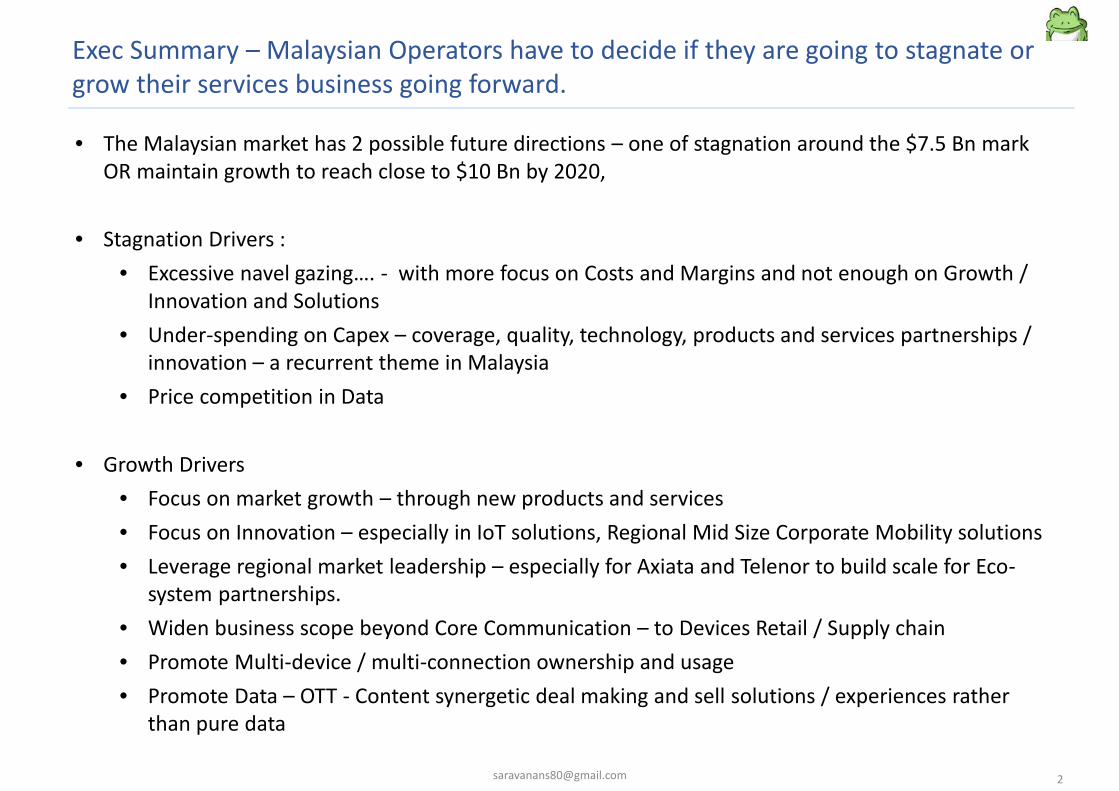
Exec Summary – Malaysian Operators have to decide if they are going to stagnate orgrow their services business going forward.
• The Malaysian market has 2 possible future directions – one of stagnation around the $7.5 Bn markOR maintain growth to reach close to $10 Bn by 2020,
• Stagnation Drivers :• Excessive navel gazing…. - with more focus on Costs and Margins and not enough on Growth /
Innovation and Solutions• Under-spending on Capex – coverage, quality, technology, products and services partnerships /
innovation – a recurrent theme in Malaysia• Price competition in Data
• Growth Drivers• Focus on market growth – through new products and services• Focus on Innovation – especially in IoT solutions, Regional Mid Size Corporate Mobility solutions• Leverage regional market leadership – especially for Axiata and Telenor to build scale for Eco-
system partnerships.• Widen business scope beyond Core Communication – to Devices Retail / Supply chain• Promote Multi-device / multi-connection ownership and usage• Promote Data – OTT - Content synergetic deal making and sell solutions / experiences rather
than pure data
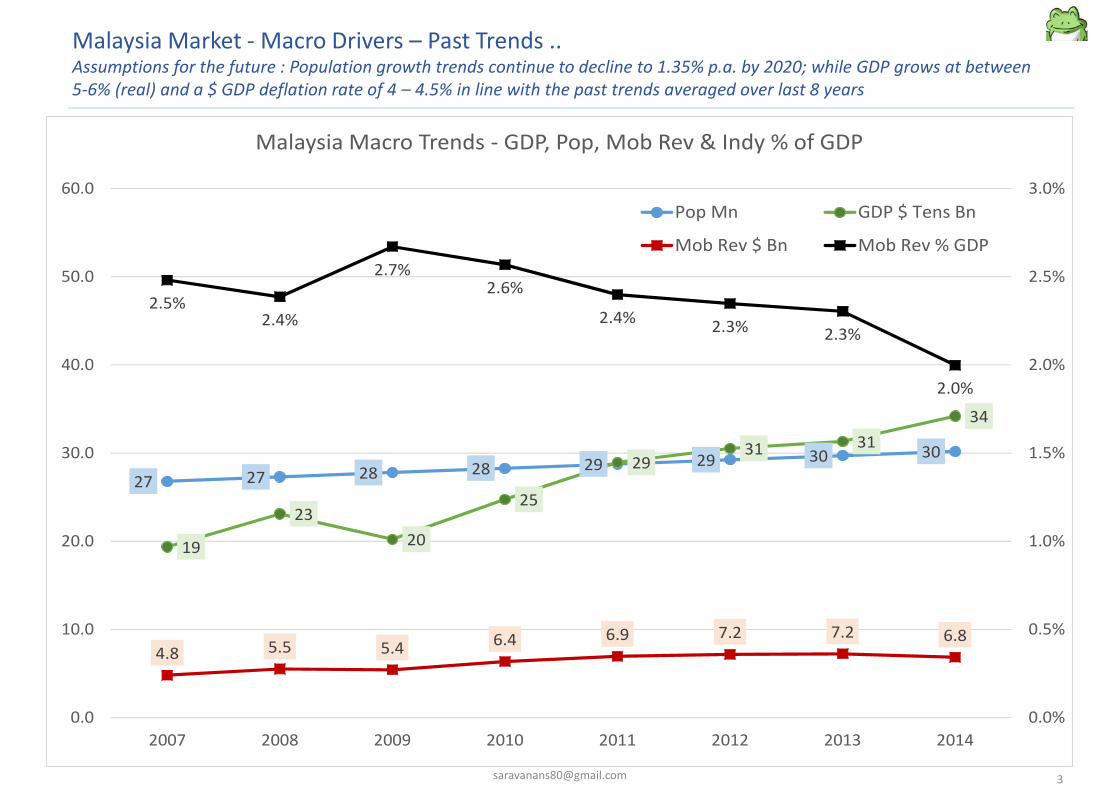
Malaysia Market - Macro Drivers – Past Trends ..Assumptions for the future : Population growth trends continue to decline to 1.35% p.a. by 2020; while GDP grows at between5-6% (real) and a $ GDP deflation rate of 4 – 4.5% in line with the past trends averaged over last 8 years
27 27 28 28 29 29 30 30
19
2320
25
2931 31
34
4.8 5.5 5.4 6.4 6.9 7.2 7.2 6.8
2.5%2.4%
2.7%2.6%
2.4% 2.3% 2.3%
2.0%
0.0%
0.5%
1.0%
1.5%
2.0%
2.5%
3.0%
0.0
10.0
20.0
30.0
40.0
50.0
60.0
2007 2008 2009 2010 2011 2012 2013 2014
Malaysia Macro Trends - GDP, Pop, Mob Rev & Indy % of GDP
Pop Mn GDP $ Tens Bn
Mob Rev $ Bn Mob Rev % GDP
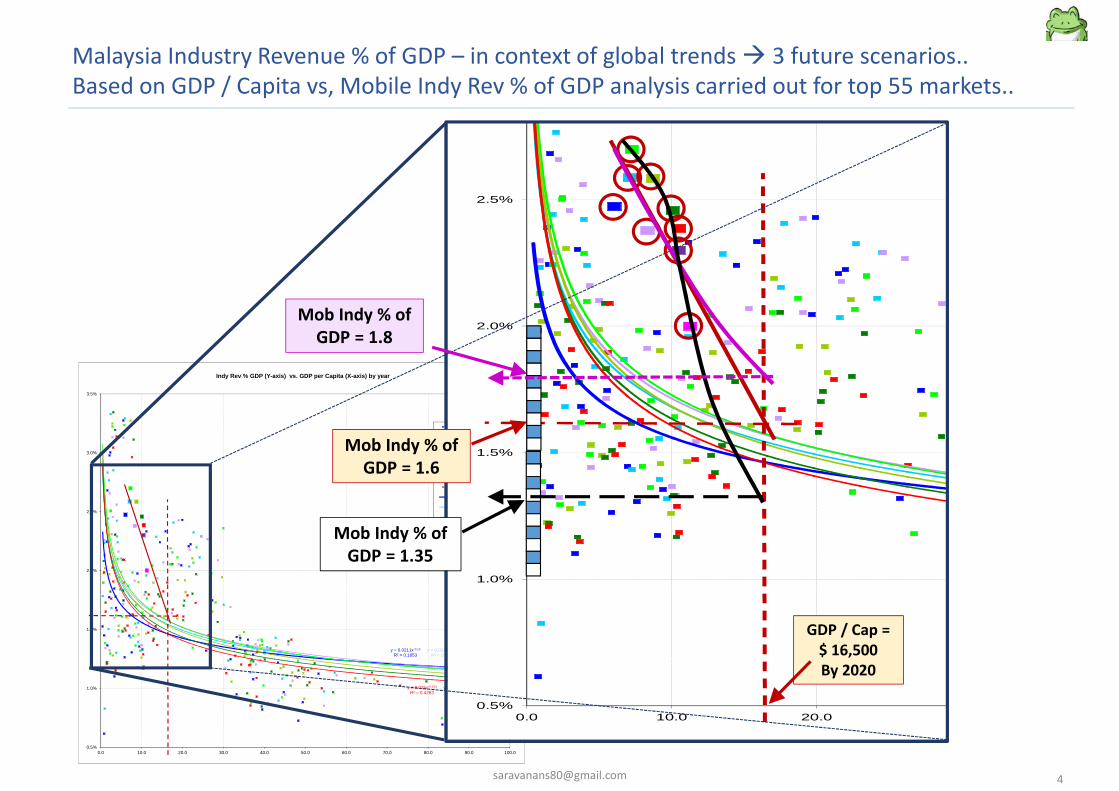
Malaysia Industry Revenue % of GDP – in context of global trends 3 future scenarios..Based on GDP / Capita vs, Mobile Indy Rev % of GDP analysis carried out for top 55 markets..
y = 0.0211x-0.13
R² = 0.1853y = 0.0249x-0.171
R² = 0.3288y = 0.0257x-0.176
R² = 0.3917
y = 0.0266x-0.187
R² = 0.3999
y = 0.0259x-0.188
R² = 0.4114y = 0.0251x-0.186
R² = 0.4155y = 0.025x-0.193
R² = 0.4263
0.5%
1.0%
1.5%
2.0%
2.5%
3.0%
3.5%
0.0 10.0 20.0 30.0 40.0 50.0 60.0 70.0 80.0 90.0 100.0
Indy Rev % GDP (Y-axis) vs. GDP per Capita (X-axis) by year
Indy Rev % GDP 06
Indy Rev % GDP 07
Indy Rev % GDP 08
Indy Rev % GDP 09
Indy Rev % GDP 10
Indy Rev % GDP 11
Indy Rev % GDP 12
Power (Indy Rev % GDP 06)
Power (Indy Rev % GDP 07)
Power (Indy Rev % GDP 08)
Power (Indy Rev % GDP 09)
Power (Indy Rev % GDP 10)
Power (Indy Rev % GDP 11)
Power (Indy Rev % GDP 12)
GDP / Cap =$ 16,500By 2020
Mob Indy % ofGDP = 1.6
Mob Indy % ofGDP = 1.8
Mob Indy % ofGDP = 1.35
7.37.8
8.2
8.8
9.3
9.9
4.8
5.5 5.4
6.4
6.97.2 7.2
6.87.2
7.57.8
8.28.5
8.8
7.1 7.2 7.3 7.4 7.4 7.4
2.0% 2.0% 1.9% 1.9% 1.9% 1.8% 1.8%
2.5%2.4%
2.7%
2.6%
2.4%2.3%
2.3%
2.0%1.9%
1.9%1.8%
1.7%1.7%
1.6%
2.0%
1.9%
1.8%
1.7%
1.6%
1.5%
1.4%
1.0%
1.2%
1.4%
1.6%
1.8%
2.0%
2.2%
2.4%
2.6%
2.8%
3.0%
0.0
1.0
2.0
3.0
4.0
5.0
6.0
7.0
8.0
9.0
10.0
2007 2008 2009 2010 2011 2012 2013 2014 2015 2016 2017 2018 2019 2020
Malaysia - Mobile Revenue Projections $ Bn
Mob Rev Scen 1 Mob Rev Scen 2Mob Rev Scen 3 Mob Rev % GDP Scen 1Mob Rev % GDP Scen 2 Mob Rev % GDP Scen 3
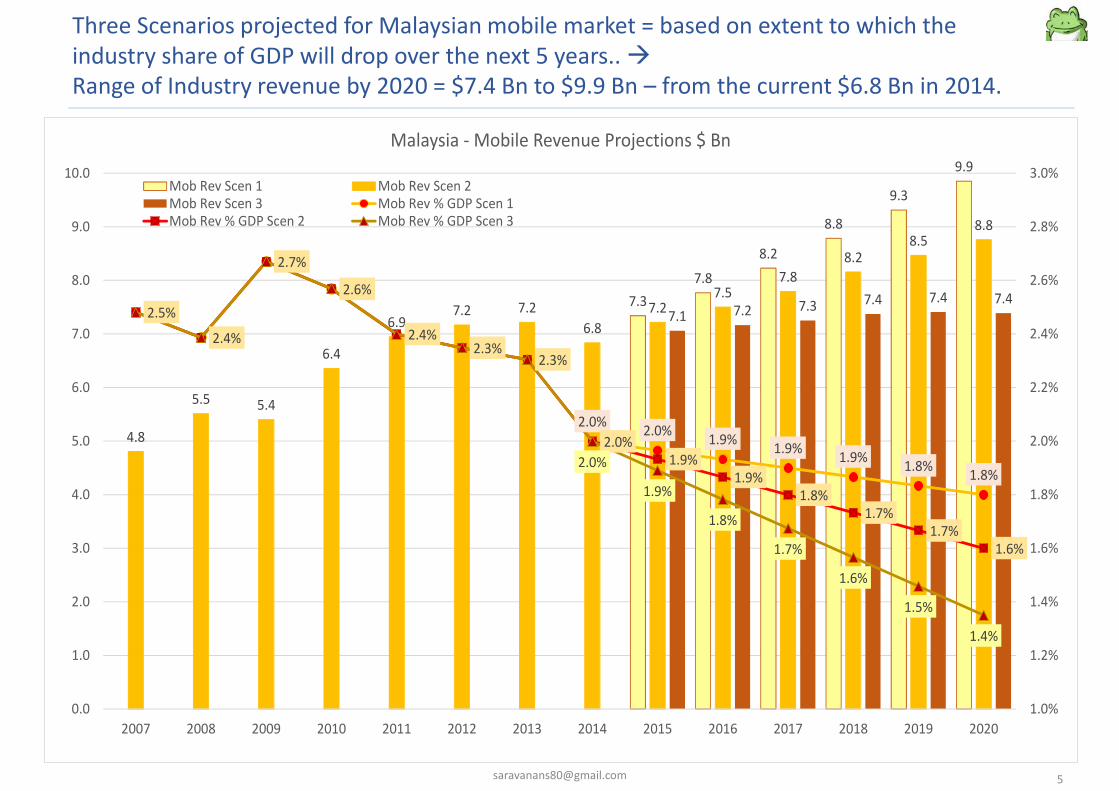
Three Scenarios projected for Malaysian mobile market = based on extent to which theindustry share of GDP will drop over the next 5 years..Range of Industry revenue by 2020 = $7.4 Bn to $9.9 Bn – from the current $6.8 Bn in 2014.
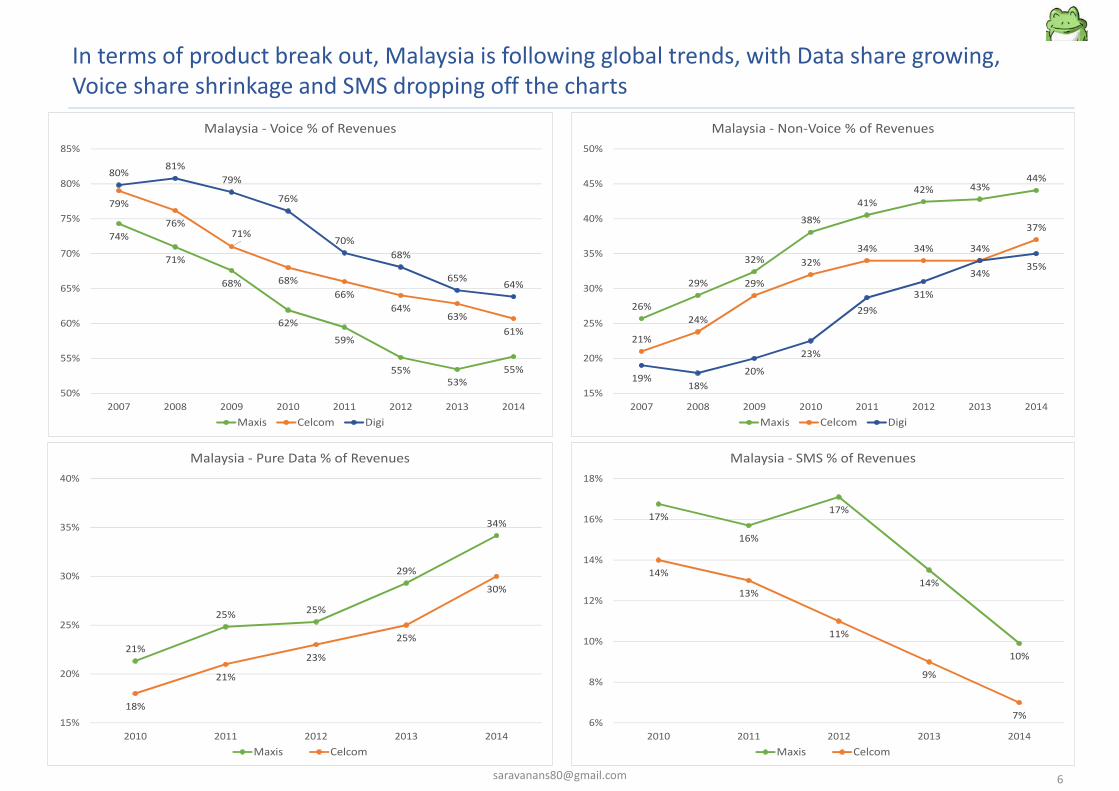
In terms of product break out, Malaysia is following global trends, with Data share growing,Voice share shrinkage and SMS dropping off the charts
74%
71%
68%
62%59%
55%53%
55%
79%
76%71%
68%66%
64%63%
61%
80% 81%79%
76%
70%68%
65% 64%
50%
55%
60%
65%
70%
75%
80%
85%
2007 2008 2009 2010 2011 2012 2013 2014
Malaysia - Voice % of Revenues
Maxis Celcom Digi
26%
29%
32%
38%41%
42% 43%44%
21%
24%
29%
32%34% 34% 34%
37%
19%18%
20%
23%
29%31%
34%35%
15%
20%
25%
30%
35%
40%
45%
50%
2007 2008 2009 2010 2011 2012 2013 2014
Malaysia - Non-Voice % of Revenues
Maxis Celcom Digi
21%
25% 25%
29%
34%
18%
21%
23%
25%
30%
15%
20%
25%
30%
35%
40%
2010 2011 2012 2013 2014
Malaysia - Pure Data % of Revenues
Maxis Celcom
17%
16%
17%
14%
10%
14%
13%
11%
9%
7%6%
8%
10%
12%
14%
16%
18%
2010 2011 2012 2013 2014
Malaysia - SMS % of Revenues
Maxis Celcom
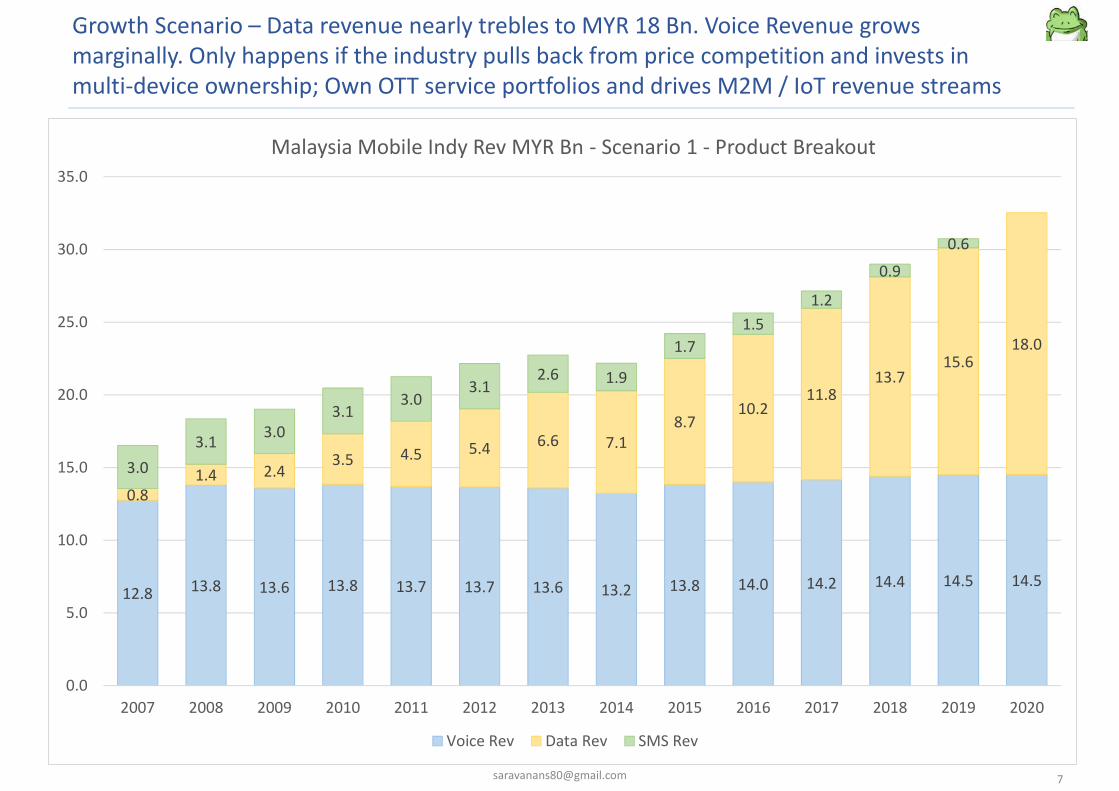
Growth Scenario – Data revenue nearly trebles to MYR 18 Bn. Voice Revenue growsmarginally. Only happens if the industry pulls back from price competition and invests inmulti-device ownership; Own OTT service portfolios and drives M2M / IoT revenue streams
12.8 13.8 13.6 13.8 13.7 13.7 13.6 13.2 13.8 14.0 14.2 14.4 14.5 14.5
0.81.4 2.4
3.5 4.5 5.4 6.6 7.18.7
10.211.8
13.715.6
18.0
3.03.1 3.0
3.13.0
3.12.6 1.9
1.71.5
1.2
0.90.6
0.0
5.0
10.0
15.0
20.0
25.0
30.0
35.0
2007 2008 2009 2010 2011 2012 2013 2014 2015 2016 2017 2018 2019 2020
Malaysia Mobile Indy Rev MYR Bn - Scenario 1 - Product Breakout
Voice Rev Data Rev SMS Rev
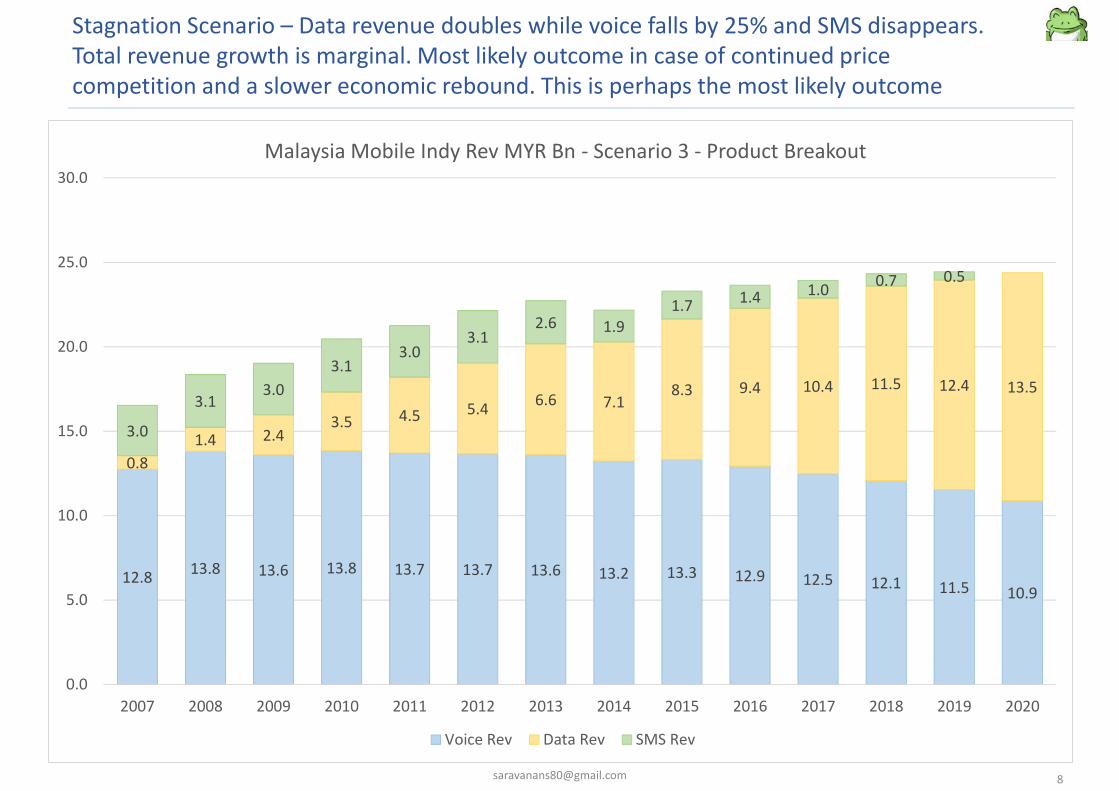
Stagnation Scenario – Data revenue doubles while voice falls by 25% and SMS disappears.Total revenue growth is marginal. Most likely outcome in case of continued pricecompetition and a slower economic rebound. This is perhaps the most likely outcome
12.8 13.8 13.6 13.8 13.7 13.7 13.6 13.2 13.3 12.9 12.5 12.1 11.5 10.9
0.81.4 2.4
3.5 4.5 5.4 6.6 7.18.3 9.4 10.4 11.5 12.4 13.5
3.0
3.13.0
3.13.0
3.12.6 1.9
1.7 1.4 1.0 0.7 0.5
0.0
5.0
10.0
15.0
20.0
25.0
30.0
2007 2008 2009 2010 2011 2012 2013 2014 2015 2016 2017 2018 2019 2020
Malaysia Mobile Indy Rev MYR Bn - Scenario 3 - Product Breakout
Voice Rev Data Rev SMS Rev
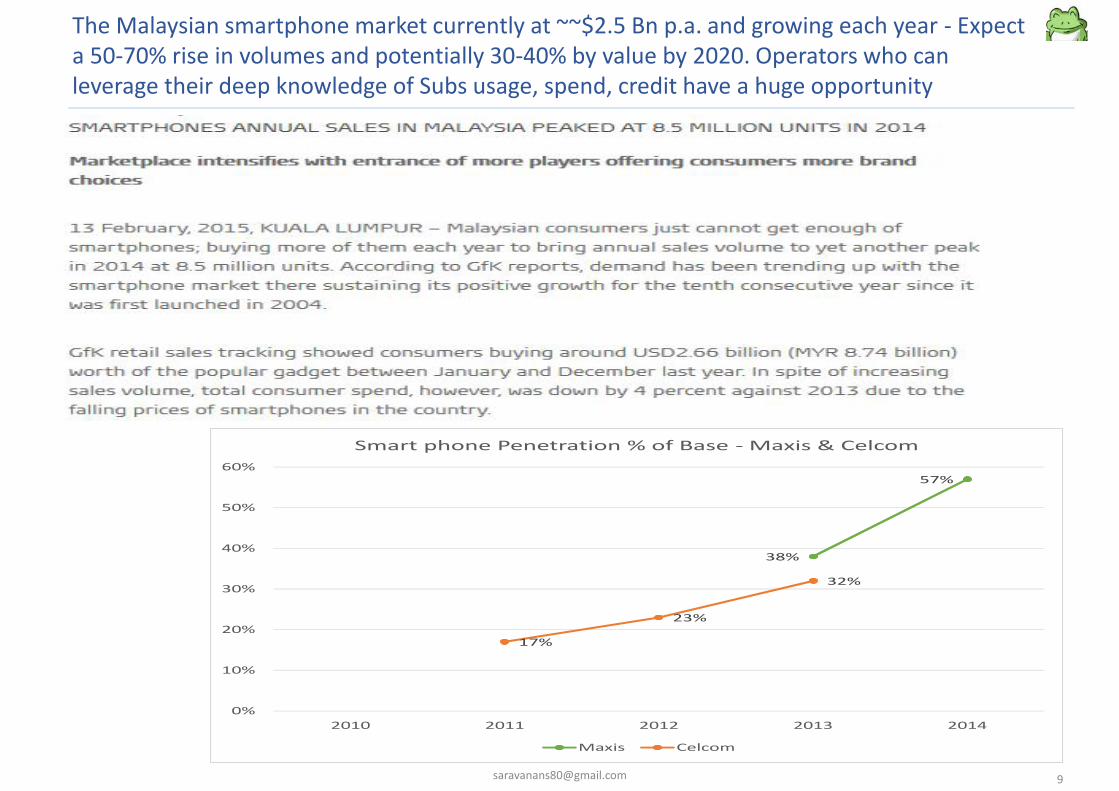
The Malaysian smartphone market currently at ~~$2.5 Bn p.a. and growing each year - Expecta 50-70% rise in volumes and potentially 30-40% by value by 2020. Operators who canleverage their deep knowledge of Subs usage, spend, credit have a huge opportunity
38%
57%
17%
23%
32%
0%
10%
20%
30%
40%
50%
60%
2010 2011 2012 2013 2014
Smart phone Penetration % of Base - Maxis & Celcom
Maxis Celcom
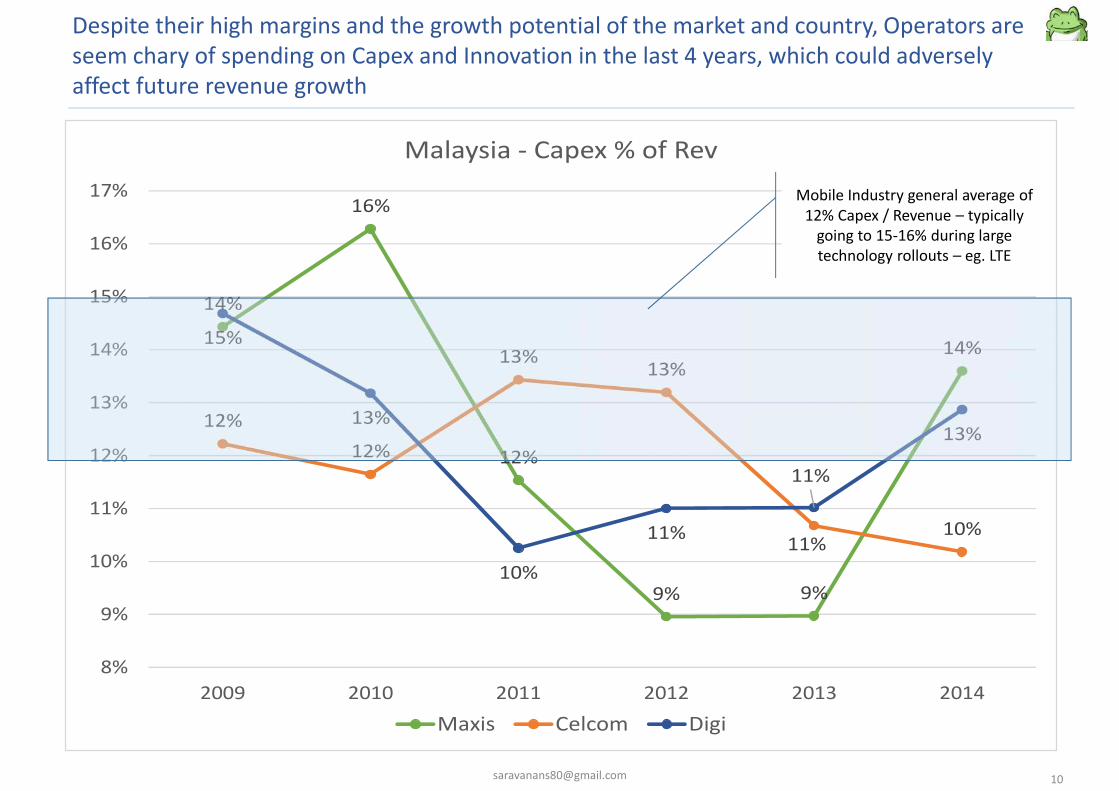
Despite their high margins and the growth potential of the market and country, Operators areseem chary of spending on Capex and Innovation in the last 4 years, which could adverselyaffect future revenue growth
14%
16%
12%
9% 9%
14%
12%12%
13% 13%
11%10%
15%
13%
10%
11%
11%
13%
8%
9%
10%
11%
12%
13%
14%
15%
16%
17%
2009 2010 2011 2012 2013 2014
Malaysia - Capex % of Rev
Maxis Celcom Digi
Mobile Industry general average of12% Capex / Revenue – typically
going to 15-16% during largetechnology rollouts – eg. LTE


![STAGNATE TO STUNNING [INBOUND 2014]](https://static.documents.pub/doc/80x56/557c25ebd8b42aa77f8b49b8/stagnate-to-stunning-inbound-2014.jpg)
![[Skku2]20070730hd V3.0](https://static.documents.pub/doc/80x56/558eb8611a28ab70778b4589/skku220070730hd-v30.jpg)