65
Malaysian Palm Oil Complemen0ng IRAN’s Oils and Fats Needs Dr. Yusof Basiron Chief Execu0ve Officer MALAYSIAN PALM OIL COUNCIL (MPOC)

Malaysian Palm Oil Complemen0ng IRAN’s Oils and Fats Needs
Dr. Yusof Basiron Chief Execu0ve Officer
MALAYSIAN PALM OIL COUNCIL (MPOC)

PRESENTATION OUTLINE
1. Global Oils & Fats Scenario 2. The Role of Palm Oil 3. Iran Oils and Fats Scenario 4. Bilateral Trade: Malaysia and Iran 5. Why Buy Malaysia Palm Oil 6. Conclusions
1.Global Oils and Fats Scenario

Oils and Fats Produc0on (1990 – 2012)
Others, 47
Palm Oil, 13
Soyabean Oil, 20
Rapeseed Oil, 10
Sunflower Oil, 10
Others, 27
Palm Oil, 29
Soyabean Oil, 23
Rapeseed Oil, 13
Sunflower Oil, 8
1990 Produc0on : 80.91 million MT
2012 Produc0on : 183.61 million MT
Source: Oil World

• Growth in popula@on , income growth, low per caput consump@on level
• Against a backdrop of lack of arable land and reduced supply from compe@ng soG oils, palm oil reliability in supply gives it the added advantage
• Food and industrial demand: an increased applica@on in the produc@on of food and non food (oleo chemicals/bio diesel), especially in countries such China, India, Middle East, EU , America
1990 Exports : 23.1 million MT
2012 Exports :72.34 million MT
Oils and Fats Exports (1990 – 2012)
Source: Oil World

Average Annual Growth in World Vegetable Oil Produc0on (1993 – 2012)
0
10000
20000
30000
40000
50000
60000
1993 1994 1995 1996 1997 1998 1999 2000 2001 2002 2003 2004 2005 2006 2007 2008 2009 2010 2011 2012
Palm Oil Rapeseed Oil Soybean Oil Sunflower Oil Coconut Oil Palm Kernel Oil
‘000 MT
Average Annual Growth (1993 – 2013) Palm Oil (7.03%) Rapeseed Oil (5.2) Soybean Oil (4.6%) Sunflower Oil (4.4%) Coconut Oil (-‐0.01%) Palm Kernel Oil (6.3%)
Source: Oil World

World’s Growing Dependence on Palm Oil Will Boost Demand Further in the Future (Exports)
0
5000
10000
15000
20000
25000
30000
35000
40000
45000
Palm Oil Sunflower, Soybean, Rapeseed Oil
‘000 MT
Source: Oil World

Despite increase in annual produc@on, overall global oils and fats produc@on is showing a declining y-‐o-‐y growth trend from 1994 to 2012
Y-‐o-‐Y Growth Change of Oils and Fats Produc0on
0
1
2
3
4
5
6
7
8
9
0
1000
2000
3000
4000
5000
6000
7000
8000
9000
10000 1994
1995
1996
1997
1998
1999
2000
2001
2002
2003
2004
2005
2006
2007
2008
2009
2010
2011
2012
Volume Change Percent Change Linear (Percent Change)
‘000 MT
% change
Source: Oil World
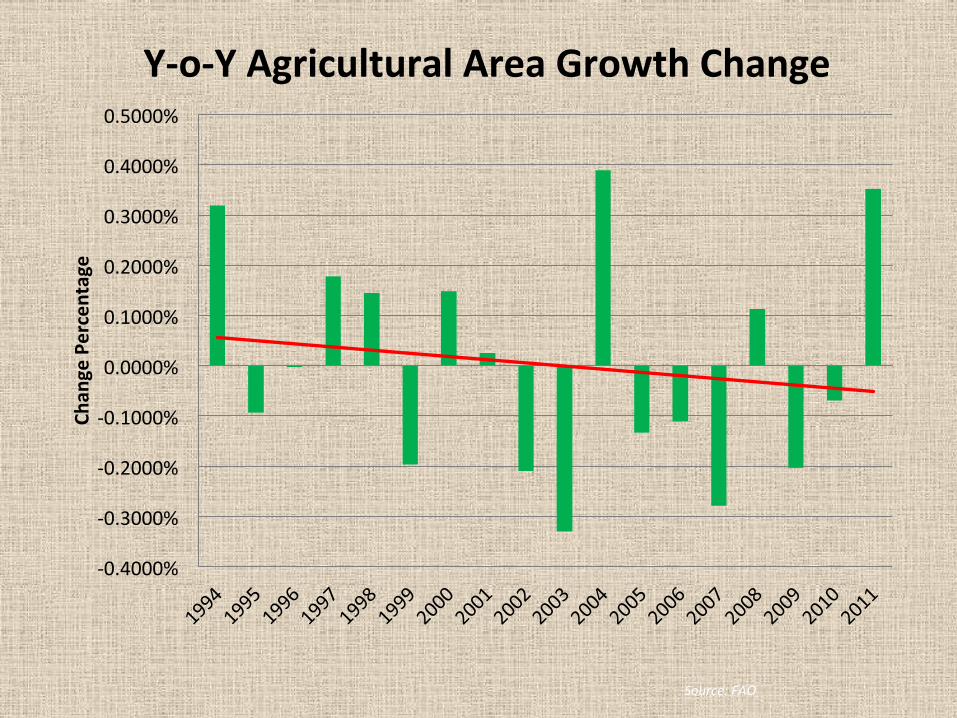
Y-‐o-‐Y Agricultural Area Growth Change
-‐0.4000%
-‐0.3000%
-‐0.2000%
-‐0.1000%
0.0000%
0.1000%
0.2000%
0.3000%
0.4000%
0.5000%
Chan
ge Percentage
Source: FAO
‘000 MT
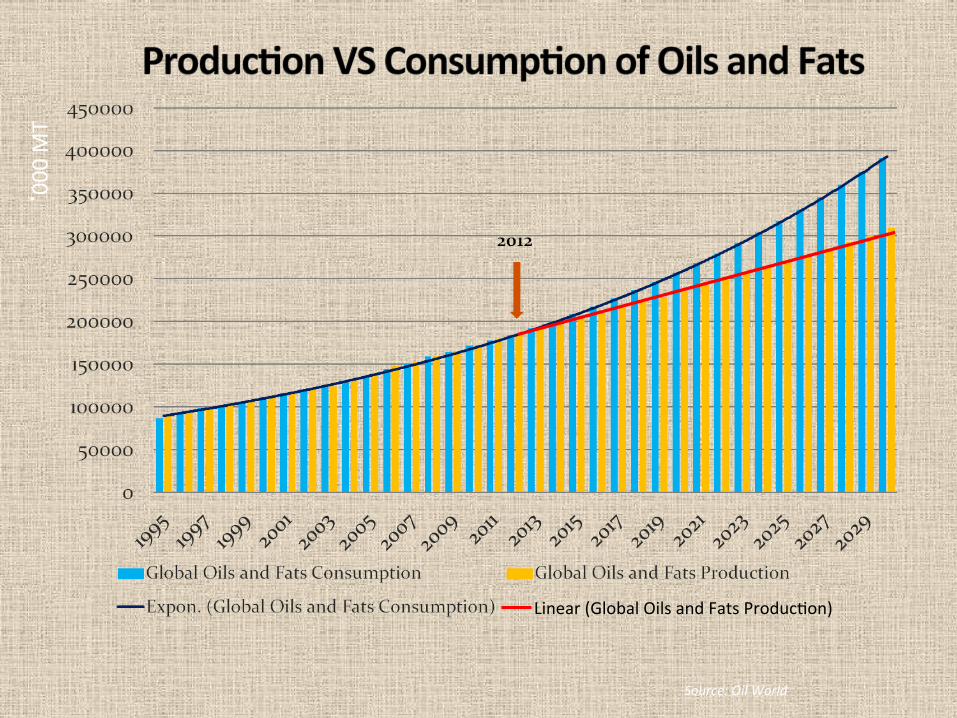
Linear (Global Oils and Fats Produc@on)
Source: Oil World

Oils and Fats Consump0on of Developed VS Developing Countries
Developed Countries, 33,719 t MT, (42%)
Developing Countries, 45,743 t MT
(58%)
1993
Developed Countries, 54808 t MT,
(30%) Developing Countries,
127,490 t MT, (70%)
2012
Source: Oil World

Net Impor0ng Countries of Oils and Fats
0
10000
20000
30000
40000
50000
60000
2000 2002 2004 2006 2008 2010 2012
Others Bangladesh Pakistan India EU27 China
‘000 MT
Source: Oil World

Growth in World Popula0on / Food Security
Russia Philippines
Canada Ukraine
Brazil Argen@na
Malaysia Indonesia
Taiwan Nigeria
South Korea South Africa
Turkey Japan
Egypt Mexico Iran
Bangladesh Pakistan
North Africa India
EU-‐27 China
-‐15000 -‐10000 -‐5000 0 5000 10000 15000 20000 25000
Net Importers Net Exporters
FAO es0mates that by 2050, rising popula0on and incomes will require 70 percent in crease in global food produc0on
› Net exporters of oils and fats – Asia Pacific (palm oil) & Americas (soybean) › The rest of the countries are net importers Source: Oil World

2.Role of Palm Oil in Global Scenario

Scarcity of Arable Land Year World’s popula0on
(bil) Arable land per
capita (x10-‐3km2)
Arable land per capita (ha)
1922 1975 2005 2030 2042
2.0 4.0 6.6 8.0 9.0
7.50 3.75 2.27 1.88 1.67
0.75 0.38 0.23 0.19 0.17
• World popula0on increasing • Arable land resource decreasing
Source: Freeworld Academy & University of Michigan
Need to Use Land Wisely
“The FAO has called upon governments to pay urgent attention to the needs of agriculture and to increase investments in agricultural practices.”Sustainability Team Discussion Paper- March 2010- Dexia Asset Management

Distribu0on of Agricultural Area

Growth in World Popula0on / Food Security
Nearly all of the population growth will occur in developing countries. Sub-Saharan Africa's population is expected to grow the fastest (up 108 %; 910 million people), and East and South East Asia's the slowest (up 11 %; 228 million people).

Food Security
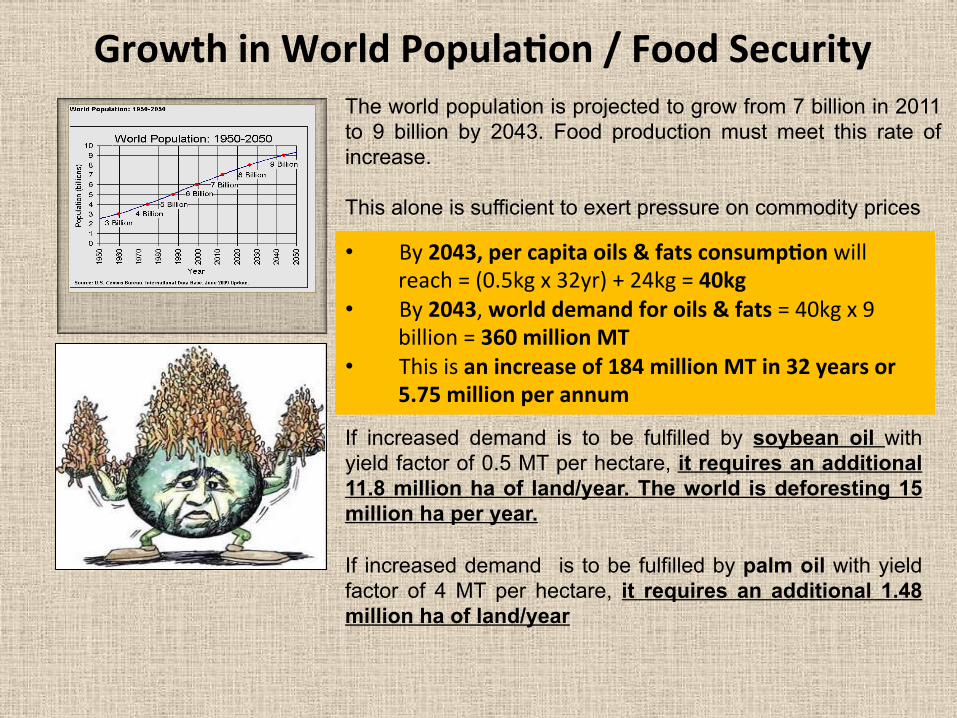
• By 2043, per capita oils & fats consump0on will reach = (0.5kg x 32yr) + 24kg = 40kg
• By 2043, world demand for oils & fats = 40kg x 9 billion = 360 million MT
• This is an increase of 184 million MT in 32 years or 5.75 million per annum
Growth in World Popula0on / Food Security The world population is projected to grow from 7 billion in 2011 to 9 billion by 2043. Food production must meet this rate of increase. This alone is sufficient to exert pressure on commodity prices
If increased demand is to be fulfilled by soybean oil with yield factor of 0.5 MT per hectare, it requires an additional 11.8 million ha of land/year. The world is deforesting 15 million ha per year. If increased demand is to be fulfilled by palm oil with yield factor of 4 MT per hectare, it requires an additional 1.48 million ha of land/year

Land Use Type Total Area (mil ha) As % Area
Total Agricultural Land 4911 100
Oil Seeds 258.03 5.25
Soybean 103.88 2.12
Rapeseed 33.28 0.68
Sunflower 25.83 0.53
Oil Palm 14.14 0.29
Coconut 9.76 0.2
Other Oil Seeds 57.8 1.18
Malaysian Palm Oil 4.32 0.09 Source: FAO (2011), Oil World, MPOB -2012
› 5.25 percent of total land area planted with oil seeds
› Only 0.29 percent of world agricultural land is used for palm oil and Malaysian palm oil only took 0.09 percent

Scarcity of Land – Expansion VS Produc0vity
Oil Crop Produc0on (Mn T) % of Total Produc0on
Average Oil Yield (t/ha/year)
Total Area (Mn Ha) % Area
Soybean 41.75 22.54 0.40 103.88 40.26
Sunflower 14.92 8.06 0.58 25.83 10.01
Rapeseed 24.21 13.07 0.73 33.28 12.90
Oil Palm1 66.96 36.15 4.73 14.14 5.48
Total2 160.21 258.03
Soybean Sunflower Rapeseed Oil Palm
0.40 0.58 0.73
4.73
Higher palm oil yields – a solu0on to land scarcity
Source: Oil World, Dec 2012
Note: 1 for palm oil and palm kernel oil 2 for 7 major oils (groundnut, coconut, cottonseed and above oils)

3.Iran Oils and Fats Scenario

WIDE DISCOUNT PALM OIL OVER SOYBEAN AND SUNFLOWER OIL
Source: Oil World (Rott. Price)

MALAYSIAN PALM OIL MONTHLY PRODUCTION,
EXPORT & ENDING STOCK (2011 – Nov 2013)
Source: MPOB
-‐
500,000
1,000,000
1,500,000
2,000,000
2,500,000
3,000,000
MT
Stock Produc@on Exports

IRAN’S OILS AND FATS CONSUMPTION PATTERN
0 100 200 300 400 500 600 700 800
2008 2009 2010 2011 2012
'000 M
T
Palm oil Soybean oil Rapeseed oil Buier fat Others
Source: Oil World, December 2012

IRAN’S OILS AND FATS CONSUMPTION PATTERN
• Iran is now the biggest importer of Malaysian palm oil for Middle East Region. Palm oil is the most consumed oil in Iran since 2009 as shown in the chart earlier accounting around 37% of total usage of oils and fats.
• Growth in domestic economy and population will spur the development in domestic food processing industry. This will boost the demand for oils and fats including palm oil.
• Palm oil import is expected to remain strong. As at November 2013, Iran imported some 611,038 MT of Malaysian palm oil, an increase of 29% from the same period in the previous year.

4.BILATERAL TRADE MALAYSIA-
IRAN

BILATERAL TRADE RELATIONSHIP BETWEEN
IRAN & MALAYSIA • Total trade value between Malaysia and Iran
was USD1.43 billion (RM 4,583,025.6 in 2012 .
• Total Malaysian export to Iran was USD1.1 billion (RM3.52 billion) and palm oil and its fractions are Malaysia’s main exports to Iran accounting for 54.43% of the total trade.
• Malaysia imported USD331.25 million (RM1.06 billion) worth of goods from Iran in the form of petroleum products, fruits, building materials and other goods.
• Can we swop OILS?

MALAYSIA’S EXPORTS TO IRAN (2012)
54%
11%
4%
31% Palm Oil Products
Rubber Products
Woods Products
Other Products
Source: Department of Statistic Malaysia

MALAYSIA’S IMPORTS FROM IRAN (2012)
87%
2% 1% 10%
Petroleum Products
Fruits
Building Material
Other Products
Source: Department of Statistic Malaysia

ROLE OF MALAYSIAN PALM OIL
Functionality • Palm oil, being a vegetable oil, is
cholesterol-free. Having a naturally semi solid characteristic at room temperature with a melting point between 33ºC to 39ºC, it does not require hydrogenation for use as a food ingredient.
• Palm oil has a balanced ratio of unsaturated and saturated fatty acids. It contains 40% oleic acid (monounsaturated fatty acid), 10% linoleic acid (polyunsaturated fatty acid ), 45% palmitic acid and 5% stearic acid (saturated fatty acid). This composition results in an edible oil that is nutritionally and fuctionally suitable for use in a variety of food applications.

ROLE OF MALAYSIAN PALM OIL
Functionality • Palm olein is widely used as a frying oil
and much of its popularity is due to its good resistance to oxidation and formation of breakdown products at frying temperatures and longer shelf life of finished products.
• In fact, palm olein is considered as the gold standard in frying and is perhaps, on its own, the most widely used frying oil in the world!
• It also blends perfectly with other popular vegetable oils that are traditionally used in many parts of the world.

ROLE OF MALAYSIAN PALM OIL
Functionality • Palm stearin is a very useful source of
natural hard fat component for products such as shortening and pastry and bakery margarines.
• Refined Palm kernel oil, palm kernel olein and palm kernel stearin find uses in margarine, confectioneries, coffee whitener, filled milk, biscuit cream and coating fats; with little or no further processing. There is a growing trend to use palm kernel oil products as an ingredient in the production of non-hydrogenated trans fat free margarine.
• Palm kernel stearin is widely used to substitute for the more expensive cocoa butter in many of its traditional applications.

5.Why Malaysian Palm Oil

Why MPO?
2. Global Expansion and Well-‐Established Networking by Malaysian
Companies

Malaysian plantation companies like Sime Darby, IOI, FELDA, KLK, and KOG are now venturing further afield to Indonesia, Thailand, Cambodia, Papua New Guinea and increasingly to West Africa. Their branded oils can be from various sources
Why MPO? 3. Diversified Ac@vi@es and
Applica@on for Long Term Supply Assurance

Malaysia Experiences in Global Marketing - Opportunities and Applications
Upstream Midstream Downstream Processing Consumer Products
ACTIVITIES • Seed production • Nursery • Cultivation • Harvesting • Milling
• Trading • Crude palm oil bulking
• Refining • Fractionation • Oleochemical • Esterification • Refined product storage
• Packaging and branding • Food products • Non – food products
PRODUCTS • DxP seeds • Fresh fruit bunches • Crude palm oil • Palm kernel • Biomass (Empty Fruit Bunches, kernel shell, fronds) • Palm oil mill effluent
• DxP seeds • Fresh fruit bunches • Crude palm oil • Palm kernel • Biomass (Empty Fruit Bunches, kernel shell, fronds) • Palm oil mill effluent
• RBD Palm Oil • Palm Fatty Acid Distillate • RBD Palm Olein • RBD Palm Stearin • RBD PK Olein • RBD PK Stearin • Cocoa Butter Equivalent • Cocoa Butter Substitute • Cocoa Butter Replacers • Fatty acid, alcohols, amines, amides • Glycerines • Palm methyl esters • Tocotrienol
• Cooking oil, frying fats • Margarine • Shortening • Vanaspati • Ice cream, non-dairy creamers • Candles, soap • Emulsifiers • Vitamin E supplements • Confectionery • Bakery fats • Biodiesel • Energy generation • Animal feed • Organic fertiliser from biomass
These days, palm oil and derived products are channeled into worldwide industrial and commercial activities to churn out food products as well as non-food applications Source: MPOC Publications & USDA Database
1. Source of food (global food security ): 80%
2. Oleochemicals: 15%
3. Biofuel : 2%
4. Renewable energy source: Potential Remains Largely Untapped through Palm Biomass
3. Diversified Ac@vi@es and Applica@on for Long Term Supply Assurance
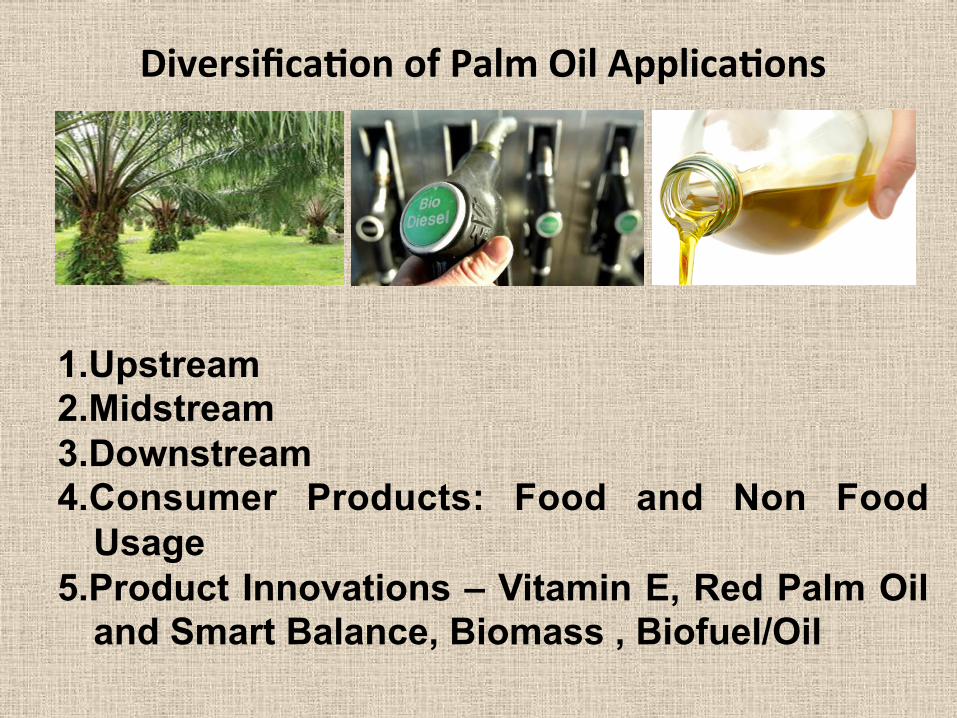
Diversifica0on of Palm Oil Applica0ons
1. Upstream 2. Midstream 3. Downstream 4. Consumer Products: Food and Non Food
Usage 5. Product Innovations – Vitamin E, Red Palm Oil
and Smart Balance, Biomass , Biofuel/Oil

Versa0lity of Palm Oil in Food Applica0ons
• Traditional Foods
• Cooking oil
• Industrial Frying Fats
• Margarine
• Shortening
• Vegetable Ghee
• Confectionery Fats
• Ice Cream
• Filled Milk
• Non-Dairy Food Products (Cheese analogue, Creamer)
• As a source of pro Vitamin A and E

Versa0lity of Palm Oil in Non Food Applica0ons
Personal Care Products
Powder & Liquid Detergent for Fabric Cleaning
Fabric Softener Using Palm-Based Esterquat
Cosmetics and personal care products can be formulated using palm-based oleo chemicals such as glycerin, fatty acids , fatty alcohols and their esters. The amount of palm based materials in the formulations ranges from 45% to 98%.

Why MPO? 4. Reliability in Providing AGer Sales Services and Quality Assurance Checks at Port of Loading 5. Quality Assurance to ensure transhipments via Iran to neighboring countries such as Afghanistan are in good condi@ons (quality and quan@ty) 6. Vegetable Ghee and Blended Oil Marke@ng and Branding can be assisted by MPOC and MPOB for beier consumer acceptance. (MPOC Prime Grant, MPOB R&D facili@es)
Why MPO?
7. Marke@ng of Palm Olein or its blends in Opaque boiles can be facilitated like what was done in
Romania and Saudi Arabia, Dubai (Hayat Brand for 1.8 litre opaque boile, 50% cheaper than corn and
sunflower oils) This solves cloudiness visual problems, but quality
is beier at muchlower cost to consumers
Why MPO? 8. Trans-‐free vegetable ghee formula@on can be facilitated in collabora@on with MPO Service Providers:-‐MPOB and MPOC

Why MPO?
9. Health Issues will be addressed appropriately with high quality MPO, Red palm oil
vitamin E

Why MPO?
10. A complementary Case Study Conducted by MPOC on Consump@on of Palm Oil by Malaysian Popula@on can be the source of reference for Nutri@onal Acceptance Assurance for Iranian Consumers
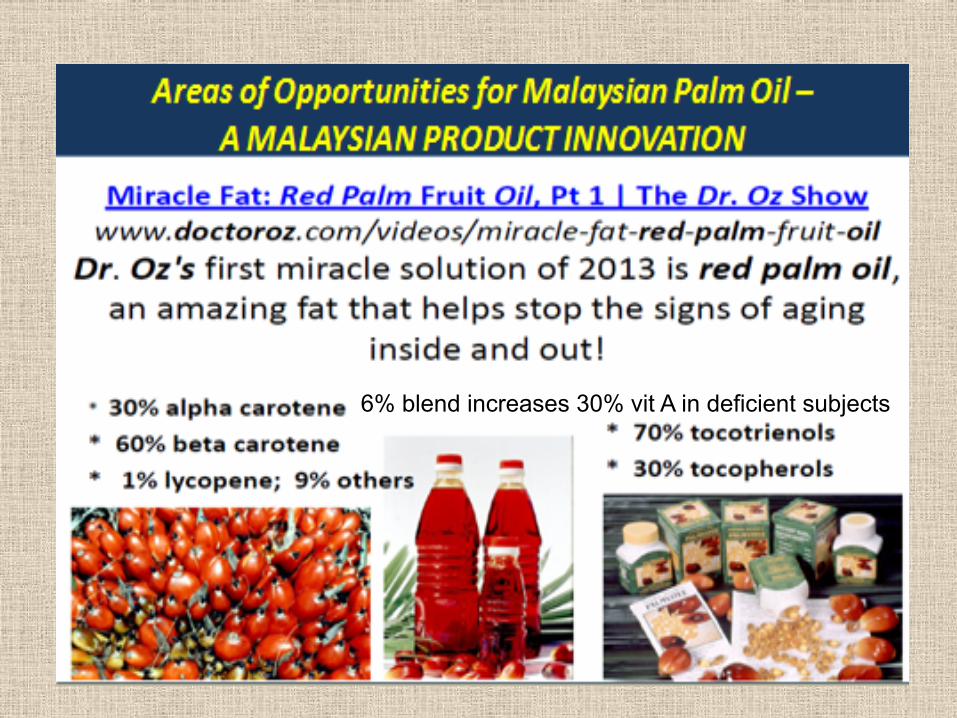
6% blend increases 30% vit A in deficient subjects

Areas of Opportunities for Malaysian Palm Oil – A MALAYSIAN PRODUCT INNOVATION in the US
to help Improve HDL/LDL cholesterol ratio through 50:50 blends


Trans fat (TFA) GRAS Status Removal! In the US, FDA is currently manda0ng GRAS Status removal of TFA • Food industry may no longer hide behind
“less than 0.5g TFA per serving size”. • Most Western countries are fully prepared through reformulated
products, mostly with palm oil as the solu0on • UNFORTUNATE SCENARIO IN THE DEVELOPING WORLD Most developing countries including IRAN are s0ll unprepared and con0nue to consume TFA based fats and foods
• REMINDER: Even 1% TFA in your diet increases risk for coronary
heart disease (Walter Willel, Harvard Medical School, 1998)
In IRAN TFAs are s0ll incorporated in Vegetable Ghee based products. We have proven technology to reformulate with palm as an ingredient to achieve Zero TFA

Oxidized fat consumption has been associated with: • increased free radical activity, which are disease triggers • with potential increased risk of certain types of cancer • interrupts endothelial functions and could lead to coronary events • Frying is great technology but the technology includes knowing which oil to use and not to use.
Do Not Choose to Fry With Polyunsaturated Oils – Oxidized Fats Are Equally Unhealthy as Trans Fats

7
8
16
7
7
13
14
15
27
43
51
72
87
26
62
62
15
28
23
18
47
38
18
4
55
26
21
71
57
54
54
9
10
2
3
3.5
10
1
1
8
1
0% 10% 20% 30% 40% 50% 60% 70% 80% 90% 100%
Natreon Canola AOM 42
Natreon Sun AOM 53
Low lin Soy AOM 20
Low Lin canolca (C5) AOM 30
Canola AOM 18
Sunflower AOM 14
Com AOM 25
Soybean AOM 15
Cotton AOM 25
Lard AOM 25
Palm AOM 50
Sats Oleic 18:1 Linoleic 18:2 Linolenic 18:3
Oxidative Stability Measurement (AOM) of Common Oils and Fats
• A variety of commercially available oils were evaluated for their oxidative stability. Palm olein is the oil with the highest oxidative stability (AOM 50). Most other fats have AOM values halve that of palm. High oleic oils such as Nateron Canola are GMO derived and costly. Supply mainly confined to North America

Deterioration during Frying
Oil hours FFA % Smoke point ˚C
Viscosity (CP)
Polymers % Foam Index *
Peanut Oil 0 0.02 235 50 0.2
82 0.28 229 102 12.6 10.2
Palm olein 0 0.03 222 49 0.4
82 0.32 182 72 6.3 9.4
Longer shelf life of fried food with no rancid or off flavors produced for longer period as compared to other oils. Fried Packaged Products: Minimum of 6 to 12 months shelf life, therefore can stay much longer on the shelf as compared to foods fried in other oils.
Palm Olein is Superior To Peanut Oil For Deep Frying
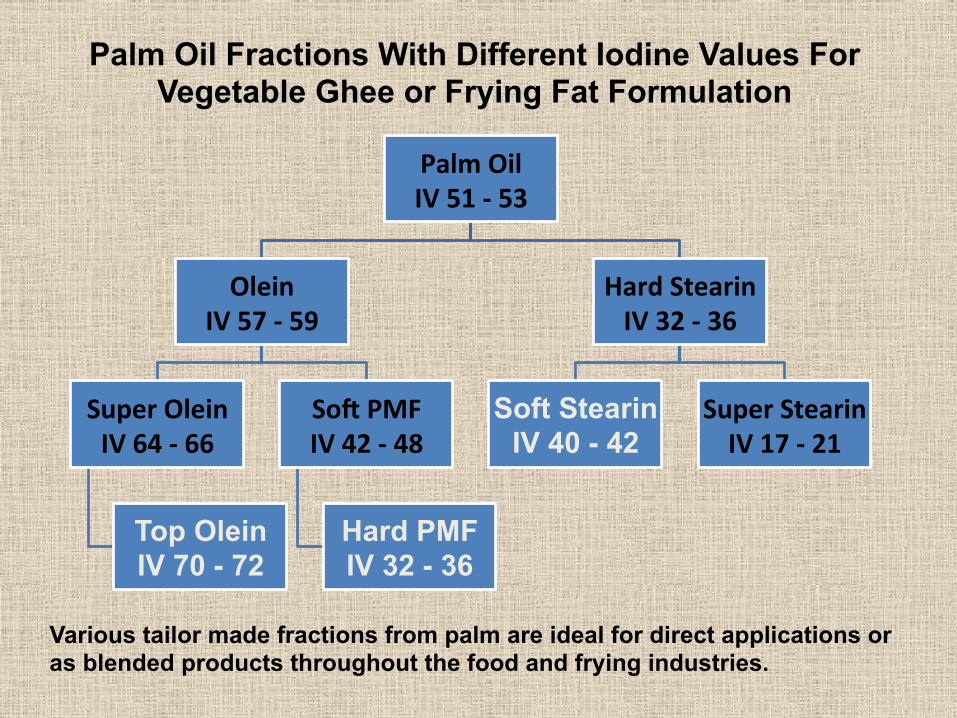
Palm Oil Fractions With Different Iodine Values For Vegetable Ghee or Frying Fat Formulation
Palm Oil IV 51 -‐ 53
Olein IV 57 -‐ 59
Super Olein IV 64 -‐ 66
Top Olein IV 70 - 72
Son PMF IV 42 -‐ 48
Hard PMF IV 32 - 36
Hard Stearin IV 32 -‐ 36
Soft Stearin IV 40 - 42
Super Stearin IV 17 -‐ 21
Various tailor made fractions from palm are ideal for direct applications or as blended products throughout the food and frying industries.

What Happens When A Population Is Exposed to Palm Oil As The Primary Dietary Fat Consumed Over 20 years
Results from an on-going Collaborative Population Study (Unpublished, 2013)
National University of Malaysia and MPOC
Sundram et al. 2013
Through our own experiences with palm oil consumption in Malaysia, we are prepared to assure beneficial nutritional outcomes from palm oil for the IRANIAN consumers as well!
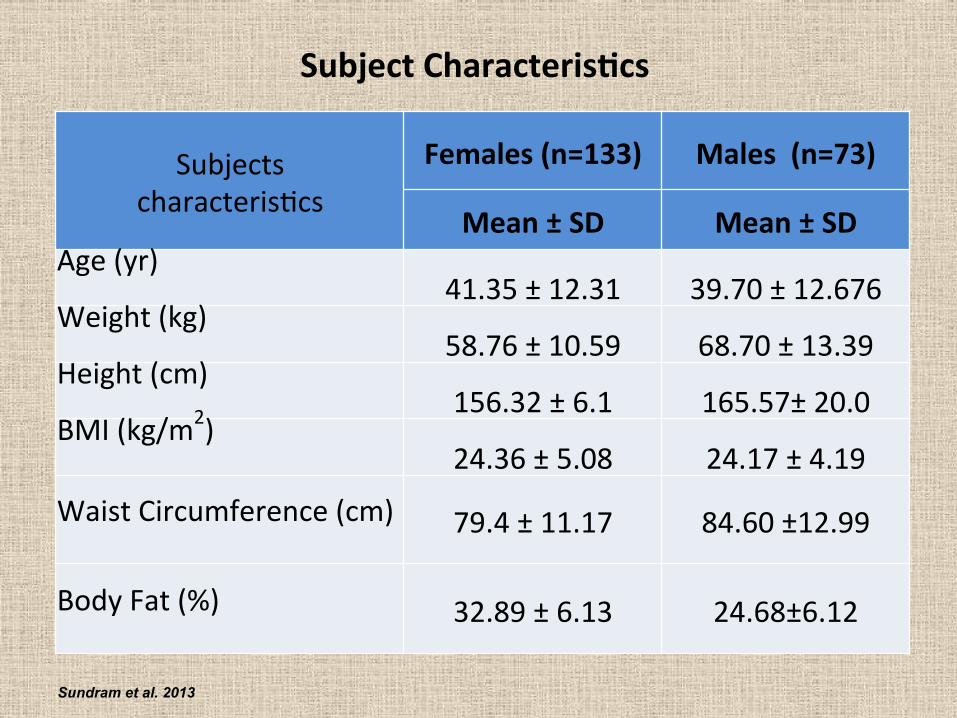
Subject Characteris0cs
Subjects characteris@cs
Females (n=133) Males (n=73)
Mean ± SD Mean ± SD Age (yr)
41.35 ± 12.31 39.70 ± 12.676 Weight (kg)
58.76 ± 10.59 68.70 ± 13.39 Height (cm)
156.32 ± 6.1 165.57± 20.0 BMI (kg/m2)
24.36 ± 5.08 24.17 ± 4.19
Waist Circumference (cm) 79.4 ± 11.17 84.60 ±12.99
Body Fat (%) 32.89 ± 6.13 24.68±6.12
Sundram et al. 2013

% Distribu0on and use of cooking oil in daily diet
Canola, 0.6 Corn, 3.6 Olive, 0.6
Palm, 81.7%
Rice Bran Oil, 0.6
Sunflower, soya, etc. , 13%
Canola
Corn
Olive
Palm
Rice Bran Oil
Sunflower
Sundram et al. 2013

LDL particle size is a crucial determinant of CVD risk. Small LDL particles are the most atherogenic How diet influences LDL size is an active on-going research question, largely still unexplored but we have emerging data for palm oil!

Lipoprotein Par0cle Size unit Palm Oil Group
Other PUFA Oils P value
Total LDL nmol/L 1131±374 1116±416 NS
Large LDL nmol/L 181±87 181±121 NS
Medium LDL nmol/L 542±249 577±249 NS
Small LDL nmol/L 407±340 357±363 NS
Total HDL µmol/L 31±5 29±3 p=0.04
Small HDL µmol/L 16±5 13±4 p=0.01
The long term (>20 years) consumption of palm oil has similar effects as PUFA oils on LDL particles but on HDL particles, palm oil has a beneficial outcome not seen with PUFA oils.
Sundram et al. 2013
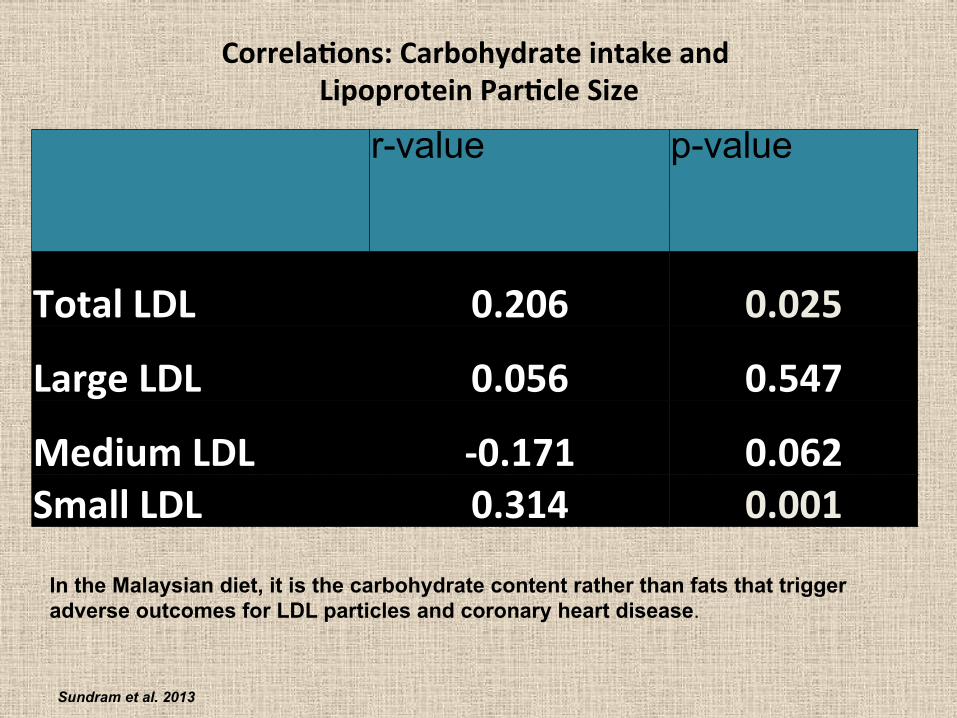
r-value p-value
Total LDL 0.206 0.025
Large LDL 0.056 0.547
Medium LDL -‐0.171 0.062 Small LDL 0.314 0.001
Correla0ons: Carbohydrate intake and Lipoprotein Par0cle Size
Sundram et al. 2013
In the Malaysian diet, it is the carbohydrate content rather than fats that trigger adverse outcomes for LDL particles and coronary heart disease.

Total LDL 0.053 NS
Large LDL -0.044 NS
Medium LDL -0.185 NS
Small LDL 0.188 NS
Correla0ons: Fat intake (Primarily Palm Oil) and LDL Par0cle Size
Sundram et al. 2013
Fat consumption in the form of palm oil had no adverse outcomes on LDL particles after >20 years consumption
While Malaysians generally consume nearly 80% of their daily fat intake as palm oil, IRANIANs are likely to have much lower consumption of palm oil. No adverse nutritional events are therefore likely, to be attributable to palm oil consumption in IRAN.
Conclusion • Rising global demand for oils & fats will not be easily met with limited arable land.
• Possible solu@on is to rely on high yielding crop like oil palm and iden@fying the developing country with best poten@al to produce more palm oil
• Dominance of Palm Oil Increasing: Palm Oil con@nues to be an airac@ve long term commodity for producers and consumers

Conclusion (cont.)
• Solu@on Provider: Consumers get strategic solu@ons from Malaysian palm oil:
• food security, • trans free products • and compe@@ve prices

Conclusion
• Malaysian Palm Oil: “Your Perfect Partner for Progress” in your oils and fats business.

THANK YOU Visit MPOC.org.my and follow my Tweets, and my blog
http://www.ceopalmoil.com


