+ All Categories
Home > Documents > MALAYSIA'S AUG 1-20 EXPORTS - The Trade News … · MALAYSIA'S AUG 1-20 EXPORTS - The ... DATA 3...

MALAYSIA'S AUG 1-20 EXPORTS - The Trade News … · MALAYSIA'S AUG 1-20 EXPORTS - The ... DATA 3...

Date post: 20-Aug-2018
Category:
Upload: hanhan
View: 217 times
Download: 0 times
Share this document with a friend
21
MALAYSIA'S AUG 1-20 EXPORTS - The Societe Generale de Surveillance (SGS) midweek reported that a total of 792.817 tonnes of bulk palm and lauric oils were exported from Malaysian ports during IN THIS EDITION: Aug 1-20. This was an 8 pct decline from HEADLINE NEWS 1 the 864,258 tonnes shipped during the same CRUDE VEG OILS 2 period last month, and an 11 pct drop from STATS AND NEWS 3 the 891,582 tonnes lifted during the same CANADA'S PRODUCTION 3 period last year. Included in the mot recent ABIOVE ESTIMATES 3 total were 303,307 tonnes RBD palm olein, CHINA'S TRADE DATA 3 188,797 tonnes crude palm oil, 63,413 MONTHLY SLAUGHTER 4 tonnes RBD palm stearin and 63,346 tonnes TALLOW & GREASE 4 RBD palm oil. Major destinations and WEEKLY STATISTICS 5 tonnages included India (254,836 tonnes), CANADA'S JLY CRUSH 6 the EU (118,070), China (60,520), the USA ROTTERDAM OILS 8 (54,925), South Korea (40,145), Japan' SOYBEAN OIL BASIS 10 (34,917), Iran (30,463), Pakistan (24,250), NY REFINED OILS 10 Singapore (18,370) and Taiwan (12,265). NEARBY FUTURES 11 Earlier in the day Intertek Testing Services WEEKLY PRICES 12 (ITS) had reported exports for the period totaling 822,026 tonnes. This was down 5 pct WEEKLY CHARTS 14 from the 868,843 tonnes shipped Jly 1-20 and down 7 pct from the 880,979 exported STATS AND NEWS 15 during the same period last year. CANADIAN STATS 16 SOYBEANS FOR VIETNAM - The USDA on Wednesday reported the sale of a total BIOFUEL PRICES 17 of 110,000 tonnes of soybeans to Vietnam. Delivery was scheduled for the 2014/15 CATTLE-ON-FEED 18 (Sep-Aug) marketing year. HATCHERY REPORT 19 CHINA BUYS SOYBEANS - The USDA this morning reported the sale of a total of COLD STORAGE 19 120,000 tonnes of soybeans to China. Delivery was scheduled for the 2014/15 (Sep-Aug) CANADIAN LIVESTOCK 19 marketing year. PALM/LAURIC CHARTS 20 CHART TRENDS 21 tion and/or forwarding by e-mail, fax or other modes is strictly We thank you for your cooperation! TEL: (585) 396-0027 E-MAIL: [email protected] Volume 100, No. 34 August 22, 2014 3701 ROUTE 21 SOUTH, CANANDAIGUA, NY 14424-9020 prohibited. "The Trade News Service" is published weekly, 52 weeks a year, for the sole use of its sub- © 2014 The Trade News Service scribers. The copying, distribu- "THE TRADE NEWS SERVICE" EDIBLE FATS AND OILS INDEX 200 225 250 275 300 325 J AS OND JFMAMJ JA SONDJFMAM J JA SONDJ FMAM J JA S WEEKLY JLY 2011 TO DATE 1976 = 100 IMTT Through Service We Grow! Avondale (LA), Bayonne (NJ), Channahon (IL), Chesapeake (VA), Geismar (LA), Gretna (LA), Lemont (IL), Newfoundland (Canada), Quebec (Canada), Richmond (CA), Richmond (VA), St. Rose (LA). International-Matex Tank Terminals 321 St. Charles Avenue New Orleans, LA 70130 Call US Today 504-586-8300
Transcript

MALAYSIA'S AUG 1-20 EXPORTS - TheSociete Generale de Surveillance (SGS) midweek reported that a total of 792.817tonnes of bulk palm and lauric oils wereexported from Malaysian ports during

IN THIS EDITION: Aug 1-20. This was an 8 pct decline from HEADLINE NEWS 1 the 864,258 tonnes shipped during the same CRUDE VEG OILS 2 period last month, and an 11 pct drop from STATS AND NEWS 3 the 891,582 tonnes lifted during the same CANADA'S PRODUCTION 3 period last year. Included in the mot recent ABIOVE ESTIMATES 3 total were 303,307 tonnes RBD palm olein, CHINA'S TRADE DATA 3 188,797 tonnes crude palm oil, 63,413 MONTHLY SLAUGHTER 4 tonnes RBD palm stearin and 63,346 tonnes TALLOW & GREASE 4 RBD palm oil. Major destinations and WEEKLY STATISTICS 5 tonnages included India (254,836 tonnes), CANADA'S JLY CRUSH 6 the EU (118,070), China (60,520), the USA ROTTERDAM OILS 8 (54,925), South Korea (40,145), Japan' SOYBEAN OIL BASIS 10 (34,917), Iran (30,463), Pakistan (24,250), NY REFINED OILS 10 Singapore (18,370) and Taiwan (12,265). NEARBY FUTURES 11 Earlier in the day Intertek Testing Services WEEKLY PRICES 12 (ITS) had reported exports for the period totaling 822,026 tonnes. This was down 5 pct WEEKLY CHARTS 14 from the 868,843 tonnes shipped Jly 1-20 and down 7 pct from the 880,979 exported STATS AND NEWS 15 during the same period last year. CANADIAN STATS 16 SOYBEANS FOR VIETNAM - The USDA on Wednesday reported the sale of a total BIOFUEL PRICES 17 of 110,000 tonnes of soybeans to Vietnam. Delivery was scheduled for the 2014/15 CATTLE-ON-FEED 18 (Sep-Aug) marketing year. HATCHERY REPORT 19 CHINA BUYS SOYBEANS - The USDA this morning reported the sale of a total of COLD STORAGE 19 120,000 tonnes of soybeans to China. Delivery was scheduled for the 2014/15 (Sep-Aug) CANADIAN LIVESTOCK 19 marketing year. PALM/LAURIC CHARTS 20 CHART TRENDS 21

tion and/or forwarding by e-mail,fax or other modes is strictly

We thank you for yourcooperation!

TEL: (585) 396-0027 E-MAIL: [email protected]

Volume 100, No. 34August 22, 2014

3701 ROUTE 21 SOUTH, CANANDAIGUA, NY 14424-9020

prohibited.

"The Trade News Service" ispublished weekly, 52 weeks a

year, for the sole use of its sub-

© 2014 The Trade News Service

scribers. The copying, distribu-

"THE TRADE NEWS SERVICE"EDIBLE FATS AND OILS INDEX

200

225

250

275

300

325

J A S O N D J F M A M J J A S O N D J F M A M J J A S O N D J F M A M J J A SWEEKLY JLY 2011 TO DATE

1976

= 1

00

IMTTThrough Service

We Grow!

Avondale (LA), Bayonne (NJ),Channahon (IL), Chesapeake (VA),Geismar (LA), Gretna (LA), Lemont

(IL), Newfoundland (Canada), Quebec (Canada), Richmond (CA), Richmond

(VA), St. Rose (LA).

International-Matex Tank Terminals321 St. Charles AvenueNew Orleans, LA 70130

Call US Today 504-586-8300

THE TRADE NEWS SERVICE Volume 100, No. 34 Page 2 August 22, 2014

SOYBEAN OIL - Strong demand for soybean meal in the interior has put additional pressure on soybean oil prices this weekBasis levels for oil, on the other hand, have strengthened again at the close of the week as consumers that need oil are having to pay up. We even heard that someone was "stuck" paying 350 to 400 over for crude oil in the West. We believe that this was outof the "norm," but have adjusted our levels to reflect the stronger values that we've seen. Nominally, we're calling IL crude andWestern crude around 200 over, with the East a nominal 250 over. We're told that Gulf crude is basically unavailable, but if youneed it for nearby shipment it would probably take at least 450 over to buy (and maybe more). Earlier in the week we had Octdegummed valued around 400 over, but we're not sure this would be available now. The market for fully refined oil has tightenedup as well, we hear that there was a good amount that traded into the Northeast this week for OND. Nearby fully refined soybean"salad" oil was valued around 1,100 over, with Oct around 1,000 over and OND nominally 800 over delivered New YorkCOTTONSEED OIL - We haven't heard of much activity in the cottonseed oil markets this week and basis levels remain allover the place. We haven't heard of much of any demand for the 4th quarter either. There is at least one supplier that has offeredPBSY at 1500 over for nearby shipment and that claims to have OND available at 500 over. On the other had we have anothersupplier that doesn't have old crop and wants 1,000 to 1,200 over for new-crop PBSY oil. "Pick a number." Fully refinedcottonseed "cooking" oil delivered to the New York area is nominally around 59 cents per poundPEANUT OIL - Nothing new to report in the peanut oil market this week. Crude peanut oil for nearby delivery was nominallypriced at 59 cents fob Southeast, with fully refined oil delivered to the New York area by rail nominally priced at 78 cents perpound (and considered shadeable). There has been some concern for crops in the Southeast because of the heat, but in ouropinion that would just make for less edibles and more crushing stock.COCONUT/PALM KERNEL OIL - Lauric oil prices remained relatively weak, with palm kernel oil in Rotterdam finishingthe week at a $220 per tonne discount to coconut oil. This was, however, better than the $265 per tonne discount seen midweekAlthough we haven't seen any "official" figures. coconut oil exports for the month of August are expected to be somewhere around 30+ thousand tonnes higher than the estimated 50 thsnd tonnes shipped in July. This is also putting pressure on prices,as did this week's slide in palm oil prices.CORN OIL - Corn oil values were steady this week, but remain high-priced compared with soybean oil. We hear that themain reason for this has been demand for corn oil from the export market (although we have been unable to confirm this). Atthe close of the week crude corn oil fob the Midwest was a nominal 38 cents per pound, with Gulf crude nominally $925 pertonne fob. Fully refined corn oil delivered New York was nominally priced at 49 1/2 cents per pound.CANOLA OIL - This week's Stats Canada production report (see next page) came as a bit of a surprise to a lot of people, and we think that ultimately the 2014 production number will be revised upward. For now, the weekly numbers from the Canadian Grain Commission (CGC) shows seen moving at a good pace, with strong export demand and good domestic consump-tion (see page 16). At the close of the week, superdegummed oil delivered Vancouver for export was firmer at a nominal 250over ($US), with refined oil for domestic consumption a nominal 600 over ($C). Fully refined oil delivered Toronto was calleda nominal 1,150 over ($US). In the US Midwest fully refined oil was nominally 725 over ($US), with delivery to the West coast a nominal 1,025 over ($US). Fully refined oil delivered New York was steady at a nominal 1,100 over ($US).SUNFLOWER OIL - Nothing much new to report in the sunflower oil markets this week. Nominally, RBWD NuSun continuesto be priced around 63 cents per pound, with RBWD Linoleic oil nominal 74 cents per pound. From South America, we havereports that nearly 13 pct of new-crop planting has been completed, about on par with the average for this time of year. Crudesunflower oil was reportedly priced around a nominal level of $930 per tonne fob.PALM OIL - Palm oil prices continued to slide to 5-year lows, palm oil futures on the Bursa Malaysia for Oct and Nov settledbelow the psychological level of 2,000 ringgit per tonne. The main problem, as we see it, is increasing production and sluggishexports demand, particularly from China. As of Aug 20, shipments of RBD palm olein to China were 32,500 tonnes. This isdown sharply from the 154.310 tonnes seen at the same point last year. Overall, shipments of palm and lauric oils to all destina-tions were down 11 pct on the year according to the latest data from SGS (see page 1).S. AMERICAN SOYOIL - South American premiums were slightly firmer this week, but finished off the highs of the weekNominally, the last values we saw in Argentina for degummed soybean oil was 420 over. Brazilian degummed soybean oil waslast reported to us around a nominal level of 385 over. There is talk that both countries will see increased acreage going to beansfrom corn this fall due to the current weakness in corn prices.INDUSTRIAL OILS - Industrial oil prices remained steady at the close of the week. India's monsoon remains less than normal. Castor oil delivered to the New York area was steady at a nominal 79 cents per pound, with tung oil steady at a nominal$1.50 per pound. Bulk, raw linseed oil delivered Minneapolis was unchanged at a nominal 71 cents per pound.

© 2014 "THE TRADE NEWS SERVICE" Reproduction or transmission of any portion without permission is strictly prohibited.

THE TRADE NEWS SERVICE Volume 100, No. 34 Page 3 August 22, 2014

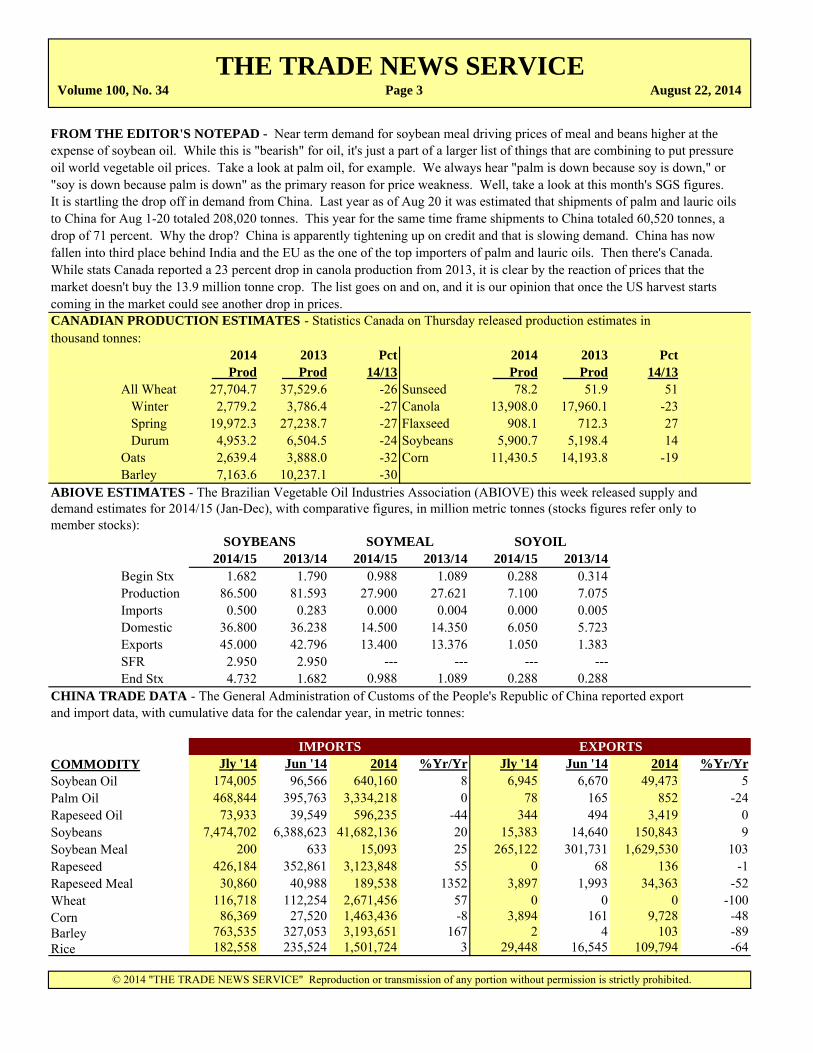
FROM THE EDITOR'S NOTEPAD - Near term demand for soybean meal driving prices of meal and beans higher at theexpense of soybean oil. While this is "bearish" for oil, it's just a part of a larger list of things that are combining to put pressureoil world vegetable oil prices. Take a look at palm oil, for example. We always hear "palm is down because soy is down," or"soy is down because palm is down" as the primary reason for price weakness. Well, take a look at this month's SGS figures.It is startling the drop off in demand from China. Last year as of Aug 20 it was estimated that shipments of palm and lauric oils to China for Aug 1-20 totaled 208,020 tonnes. This year for the same time frame shipments to China totaled 60,520 tonnes, a drop of 71 percent. Why the drop? China is apparently tightening up on credit and that is slowing demand. China has now fallen into third place behind India and the EU as the one of the top importers of palm and lauric oils. Then there's Canada.While stats Canada reported a 23 percent drop in canola production from 2013, it is clear by the reaction of prices that themarket doesn't buy the 13.9 million tonne crop. The list goes on and on, and it is our opinion that once the US harvest startscoming in the market could see another drop in prices.CANADIAN PRODUCTION ESTIMATES - Statistics Canada on Thursday released production estimates inthousand tonnes:

2014 2013 Pct 2014 2013 Pct Prod Prod 14/13 Prod Prod 14/13

All Wheat 27,704.7 37,529.6 -26 Sunseed 78.2 51.9 51 Winter 2,779.2 3,786.4 -27 Canola 13,908.0 17,960.1 -23 Spring 19,972.3 27,238.7 -27 Flaxseed 908.1 712.3 27 Durum 4,953.2 6,504.5 -24 Soybeans 5,900.7 5,198.4 14Oats 2,639.4 3,888.0 -32 Corn 11,430.5 14,193.8 -19Barley 7,163.6 10,237.1 -30

ABIOVE ESTIMATES - The Brazilian Vegetable Oil Industries Association (ABIOVE) this week released supply anddemand estimates for 2014/15 (Jan-Dec), with comparative figures, in million metric tonnes (stocks figures refer only tomember stocks):

2014/15 2013/14 2014/15 2013/14 2014/15 2013/14Begin Stx 1.682 1.790 0.988 1.089 0.288 0.314Production 86.500 81.593 27.900 27.621 7.100 7.075Imports 0.500 0.283 0.000 0.004 0.000 0.005Domestic 36.800 36.238 14.500 14.350 6.050 5.723Exports 45.000 42.796 13.400 13.376 1.050 1.383SFR 2.950 2.950 --- --- --- ---End Stx 4.732 1.682 0.988 1.089 0.288 0.288

CHINA TRADE DATA - The General Administration of Customs of the People's Republic of China reported exportand import data, with cumulative data for the calendar year, in metric tonnes:

COMMODITY Jly '14 Jun '14 2014 %Yr/Yr Jly '14 Jun '14 2014 %Yr/YrSoybean Oil 174,005 96,566 640,160 8 6,945 6,670 49,473 5Palm Oil 468,844 395,763 3,334,218 0 78 165 852 -24Rapeseed Oil 73,933 39,549 596,235 -44 344 494 3,419 0Soybeans 7,474,702 6,388,623 41,682,136 20 15,383 14,640 150,843 9Soybean Meal 200 633 15,093 25 265,122 301,731 1,629,530 103Rapeseed 426,184 352,861 3,123,848 55 0 68 136 -1Rapeseed Meal 30,860 40,988 189,538 1352 3,897 1,993 34,363 -52Wheat 116,718 112,254 2,671,456 57 0 0 0 -100Corn 86,369 27,520 1,463,436 -8 3,894 161 9,728 -48Barley 763,535 327,053 3,193,651 167 2 4 103 -89Rice 182,558 235,524 1,501,724 3 29,448 16,545 109,794 -64

SOYBEANS SOYMEAL SOYOIL

© 2014 "THE TRADE NEWS SERVICE" Reproduction or transmission of any portion without permission is strictly prohibited.

IMPORTS EXPORTS

THE TRADE NEWS SERVICE Volume 100, No. 34 Page 4 August 22, 2014

MONTHLY LIVESTOCK SLAUGHTER - The USDA this week released monthly livestock slaughter and meat productionstatistics. Details follow in thousand head, with production in million pounds (revisions highlighted):

Commercial Slaughter Jly '14 Jun '14 Jly '13 %Yr/Yr 2014 2013 %Yr/YrCattle 2,599.8 2,605.9 2,894.9 -10 17,810.8 19,000.9 -6Calves 48.5 45.3 70.0 -31 357.7 438.2 -18Hogs 8,456.7 8,099.5 9,077.4 -7 61,164.8 63,706.2 -4Sheep/Lambs 210.2 193.3 213.7 -2 1,358.2 1,334.4 2Goats 57.9 56.0 68.1 -15 361.1 387.5 -7Bison 5.0 5.1 5.2 -4 36.0 32.7 10

Commercial Production Jly '14 Jun '14 Jly '13 %Yr/Yr 2014 2013 %Yr/YrBeef 2,085.9 2,068.7 2,294.1 -9 14,137.5 14,982.1 -6Veal 7.8 7.6 9.6 -19 57.8 64.9 -11Pork 1,799.3 1,734.3 1,840.3 -2 13,088.6 13,131.5 0Lamb/Mutton 13.9 13.4 14.2 -2 93.6 92.6 1DOMESTIC TALLOW AND GREASE - Domestic values of yellow grease getting hit hard again this week as the "dumping"of product on the market (in the aftermath of the accident at the Diamond Green facility) continued to make plenty of supplyavailable to the market. We hear that prices of yellow grease might be getting close to where European consumers might startto take a look, but haven't heard of anything happening yet. Choice white grease prices were also weakening as hog kills beganto pick up over the past couple of weeks. This week's hog kill, however, was put at 1,991 thsnd head, down from last week's 2,017 thsnd head and still well below last year's 2,204 thsnd head kill. hog weights remain heavy at an average of 284 poundsversus 271 the same week last year.This week's cattle kill picked up to590 thsnd head from 577 thsnd lastweek, but remained well below the636 thsnd head kill recorded the same week last year. Domestic tallow prices were under pressurethis week, as well, but not to thedegree that grease prices were.Chicken slaughter for the latest weekwas steady on the year, with broiler placements up 2 pct on the year.Poultry fat prices have been underpressure from falling values in theyellow grease market and good supplies.EXPORT TALLOW & GREASE - The following are nominal prices at the close of the week, in dollars per metric tonne, fob:More pressure on parcel prices thisweek. There's a lot of product Week Month Yearlooking for a home and there's likely Ago Ago Ago Pct Chgto be more availability in the coming 08/22/14 08/15/14 07/25/14 08/23/13 Yr/Yrweeks in the wake of the Diamond Tech Tallow, Gulf $940 $955 $985 $990 -5Green accident. Weakness in Top White, Gulf $890 $935 $960 $975 -9global veg oil prices, including palm Yellow Greasestearin has also added to the weak- East Coast $685 $710 $765 $850 -19ness in nearby values for tallow and Gulf $685 $725 $785 $850 -19grease. West Coast $650 $670 $700 $750 -13

© 2014 "THE TRADE NEWS SERVICE" Reproduction or transmission of any portion without permission is strictly prohibited.

Jan-Jly

PARCEL PRICES, FOB US GULF

275375475575675775875975

107511751275137514751575

07 08 09 10 11 12 13 14

JAN 2007 TO DATE

DO

LLA

RS/

MT

Tech Ed Top White Yellow Grs

Volume 100, No. 34 August 22, 2014

EXPORT INSPECTIONS - The USDA reported export inspections, with comparisons as follows, in thousands of bushels(revisions highlighted):

Pct08/14/14 08/07/14 08/15/13 2013/14 2012/13 Yr/Yr

Wheat 21,924 20,146 33,887 190,379 273,584 -30Corn 38,221 35,725 7,164 1,765,567 666,168 165Soybeans 2,065 3,634 5,292 1,587,930 1,308,362 21Flaxseed 25 1 0 43 19 132

SOYBEANS: NORTH ATLANTIC to Indonesia 10, Thailand 15. MISSISSIPPI RIVER to Barbados 156, Japan 229, Mexico 504. CALIFORNIA to Indonesia 1. INTERIOR to Indonesia 308, Japan 14, Meixoc 533, Taiwan 228, Thailand 14,Vietnam 49.TOTAL SOYBEANS: 2,062.

CORN: YELLOW CORN: ATLANTIC to Jamaica 181, Morocco 1075. GULF to Brbados 239, Colombia 1299, Costa Rica1004, Egypt 4209, Japan 9625, Mexico 2673, Nicaragua 358, Peru 869. PACIFIC to Japan 4, South korea 10073. INTERIORto China 63, Costa Rica 2, Hong Kong 14, Indonesia 49, South Korea 12, Malaysia 10, Mexico 3680, Spain 3, Taiwan 519,Vietnam 9. Shipments to Canada 691. WHITE CORN: GULF to El Salvador 453, Mexico 1069. INTERIOR to Mexico 35.TOTAL CORN: 38,221.

WHEAT: LAKES to Mexico 92. ATLANTIC to China 34, Philippines 189, Taiwan 90, Thailand 11. GULF to Barbados 192,Brazil 926, Colombia 937, Dominican Republic 555, Ecuador 610, El Salvador 763, Ethiopia 1102, Mexico 993, Nigeria 2726, Peru 1907. PACIFIC to Burma 4, Japan 2888, South Korea 983, Malaysia 11, Peru 1402, Philippines 3327. INTERIOR toMexico 1261. Shipments to Canada 919.TOTAL WHEAT: 21,924.EXPORT SALES AND SHIPMENTS - The USDA's Foreign Agricultural Service reported exporter data for the week and season to date, in thousands of metric tonnes (revisions in highlighted):

08/14/14 08/07/14 2014/15 2013/14 2014/15 2015/16 2014/15 2015/16Wheat 532.0 501.3 5,006.7 7,153.3 209.2 0.0 5,863.9 38.2Flaxseed 0.0 0.0 0.0 0.0 0.0 0.0 0.0 0.0Linseed Oil 0.0 0.1 3.8 5.0 0.0 0.0 3.1 0.0

08/14/14 08/07/14 2013/14 2012/13 2013/14 2014/15 2013/14 2014/15Corn 1,144.3 721.8 44,872.0 17,278.8 99.9 719.3 3,846.5 9,253.7Soybeans 93.4 146.9 44,239.4 36,084.3 -89.6 1,420.6 1,851.3 19,514.3Soybean Meal 50.3 136.0 9,554.4 9,077.1 99.8 78.6 849.4 4,373.7Soybean Oil 15.0 6.5 713.6 858.4 15.7 5.0 108.0 41.7Cotton Oil 0.2 0.0 11.8 24.9 0.0 0.0 7.4 0.0Sun Oil 0.0 0.1 12.2 34.3 0.0 0.0 0.9 1.8

08/14/14 08/07/14 2014 2013 2014 2015 2014 2015Beef 13.5 14.1 424.4 436.0 9.5 0.6 93.6 2.2ARGENTINE REGISTRATIONS - The Argentine Agriculture Ministry reported the following weekly sales and cumulativeexport data for the week ended August 13, in thousand tonnes. Cumulative data shown with comparable week's data from the previous season.

Mkt. Yr 2013/14 2012/13 2013/14 2012/13 2013/14 2012/13 %13/12Wheat (Dec-Nov) 26.0 7.0 2,369.4 4,885.3 1,410.4 3,080.4 -54

Mkt. Yr 2014/15 2013/14 2014/15 2013/14 2014/15 2013/14 %14/13Corn (Mar-Feb) 348.0 193.3 13,985.9 18,058.9 8,243.0 14,523.9 -43Soybeans (Apr-May) 275.0 265.7 9,015.9 8,462.0 5,490.5 4,980.8 10Sunseed (Jan-Dec) 0.8 0.5 33.6 30.0 0.0 0.0 ---

WEEKLY SALES CUMULATIVE SALES CUMULATIVE SHIPMENTS

© 2014 "THE TRADE NEWS SERVICE" Reproduction or transmission of any portion without permission is strictly prohibited.

For Week Ending Season To Date Week Ended 08/14 Ttl Undlvd Sales

THE TRADE NEWS SERVICEPage 5

The following are inspections for export from port areas to countries of destination:

EXPORTS SALES

Volume 100, No. 34 August 22, 2014

DELIVERABLE STOCKS - Deliverable stocks in Federally licensed elevators at selected locations, in thousands ofbushels, as reported by the Chicago Board of Trade (revisions highlighted):

PctCORN 08/15/14 08/07/14 08/16/13 Yr/Yr Chicago 168 160 85 98 Creve Coeur/Pekin 1 96 0 --- Lockport/Seneca 387 451 200 94 Ottawa/Chillecothe 1,212 1,307 320 279 TOTAL 1,768 2,014 605 192

WHEAT Chicago 9,096 8,793 7,955 14 Mississippi River 2,973 2,810 12,176 -76 Northwest Ohio 10,391 10,424 8,207 27 Ohio River 3,642 3,982 9,466 -62 St. Louis 1,344 1,261 657 105 Toledo/Maumee 16,965 16,586 21,819 -22 TOTAL 44,411 43,856 60,280 -26

SOYBEANS Chicago 2 1 64 -97 Creve Coeur/Pekin 545 561 387 41 Havana/Grafton 187 120 134 40 Lockport/Seneca 45 49 104 -57 Ottawa/Chillecothe 311 212 539 -42 St. Louis 113 439 266 -58 TOTAL 1,203 1,382 1,494 -19

WEEKLY CANADIAN CRUSH - The Canadian Oilseed Processors Association reported weekly member crush ofcanola and soybeans as follows, with comparisons and cumulative data, in metric tonnes (revisions highlighted):

Wk Pct Pct08/20/14 08/13/14 08/21/13 Yr/Yr 2014/15 2013/14 Yr/Yr

Canola Crush 123,512 135,017 70,317 76 389,704 241,067 62Soybean Crush 20,747 15,266 26,755 -22 52,803 77,169 -32

Canola Capacity Use 71.3% 77.9% n/a 80.3% 50.2%Soybean Capacity Use 31.5% 23.2% n/a 28.6% 41.9%CANADA'S CANOLA CRUSH - Statistics Canada reported monthly canola crush and production of meal and oil as follows, in thousand tonnes:

Pct PctJly '14 Jun '14 Jly '13 Yr/Yr 2013/14 2012/13 Yr/Yr

Canola Crush 680.8 574.8 501.5 36 6,979.4 6,716.8 4Meal Production 383.4 324.3 299.1 28 3,966.2 3,989.9 -1Oil Production 298.0 252.7 218.1 37 3,041.0 2,916.5 4

CCC SEEKS PACKAGED OIL - The Farm Service Agency (FAS) on behalf of the Commodity Credit Corporation (CCC)on Thursday called for offers n a total of 5,020 tonnes of packaged, refined veg oil for use in Title II and Food for Progressexport programs. Included in the total were 3,020 tonnes in 4 liter cans/plastic bottles and 2,000 tonnes in 4 liter cans. Destinations included Mauritania (2,400 tonnes), Ethiopia (1,720), Uganda (450), Niger (270), Zimbabwe (100) and Congo(80). Shipment was set for October 1-31 (Oct 16-Nov 15 for plants at ports). All offer must reach the Kansas City Commodity Office (KCCO) by 9AM CT on Sep 3 with notification to successful offerors the following day.

THE TRADE NEWS SERVICEPage 6

Total From Aug 1

© 2014 "THE TRADE NEWS SERVICE" Reproduction or transmission of any portion without permission is strictly prohibited.

Aug-Jly

Volume 100, No. 34 August 22, 2014

BROILER CHICK REPORT - The USDA reported broiler chick placements and eggs set for production in 19 states,with revised week-ago and year-ago figures as follows (in millions):

Pct08/16/14 08/09/14 08/17/13 Yr/Yr

Eggs Set 205.257 206.073 200.769 2Chicks Placed 168.899 169.233 165.763 2

MEAT PRODUCTION - The USDA's Agricultural Marketing Service estimated US slaughter and production of meatunder Federal Inspection at the end of the following weeks (production in million pounds, slaughter in thousand head, with revisions highlighted):

PctSLAUGHTER 08/23/14 08/16/14 08/24/13 Yr/YrCattle 590 577 636 -7Calves 10 10 14 -29Hogs 1,991 2,017 2,204 -10Lamb/Sheep 38 38 43 -12

MEAT PRODUCTIONBeef 477.0 465.5 506.8 -6Calf/Veal 1.6 1.6 2.0 -20Pork 424.0 429.7 447.5 -5Lamb/Mutton 2.6 2.6 2.9 -10

ROTTERDAM TALLOW/GREASE - The following are nominal prices of tallow and grease, in US dollars per tonne,CIF Rotterdam:

Fri Thurs Wed Tue MonInedible Tallow, Max 2%, US 970.00 970.00 1015.00 1015.00 1015.00Yellow Grease, US 765.00 765.00 790.00 790.00 790.00

ACTUAL LIVESTOCK SLAUGHTER - The USDA reported the following actual slaughter and meat production forthe week ended August 9, 2014, in millions of pounds:

Cattle Calves Hogs Sheep Goats BisonMonday 109,921 2,262 340,061 9,020 2,727 201Tuesday 114,365 1,804 403,956 7,940 1,822 129Wednesday 114,188 1,861 407,028 7,724 1,383 231Thursday 115,334 1,930 407,224 8,167 1,831 223Friday 114,290 2,273 345,535 6,445 1,849 102Saturday 5,329 0 23,876 34 17 0 TOTAL 573,427 10,130 1,927,680 39,330 9,629 886Meat Production 463.6 1.7 410.8 2.6 n/a n/a

POULTRY SLAUGHTER - The USDA reported the following preliminary Federally Inspected chicken and turkeyslaughter estimates for the week ended August 16, 2014, in thousands:

Pct08/16/14 08/09/14 08/17/13 Yr/Yr

Young Chickens 158,114 158,069 158,185 0Hens 3,279 3,270 3,170 3 Total Chicken 161,393 161,339 161,355 0Young Turkeys 4,542 4,450 4,471 2 Total Turkey 4,556 4,458 4,471 2

THE TRADE NEWS SERVICEPage 7

© 2014 "THE TRADE NEWS SERVICE" Reproduction or transmission of any portion without permission is strictly prohibited.

.

THE TRADE NEWS SERVICE Volume 100, No. 34 Page 8 August 22, 2014

08/22 08/21 08/20 08/19 08/18Coconut Oil, Philippine/Indonesian 3%, max 4% FFAAug/Sep 1150.00 1150.00Sep/Oct 1100.00 1100.00 1085/1085T 1120.00 1110.00Oct/Nov 1100.00 1100.00 1085.00 1115.00 1110.00Nov/Dec 1100.00 1100/1095T 1080.00 1115.00 1110.00Dec/Jan '15 1100.00 1110.00 1080.00 1120.00 1110.00Jan/Feb 1090.00 1130.00Palm Oil, Crude Malaysian/Sumatran, max 5% FFAOct/Dec 705.00 715.00 725.00 737.50Jan/Mar '15 727.50 740.00 745.00 755.00 760.00Apr/Jun 737.50 750.00 740.00 757.50 765.00RBD Palm Oil, MalaysianSep 750.00 757.50 765.00 767.50 772.50Oct 745.00 747.50 755.00 757.50 765.00Oct/Dec 737.50 745.00 752.50 755.00 762.50Jan/Mar '15 752.50 760.00 767.50 767.50 775.00Apr/Jun 770.00 775.00 772.50 780.00RBD Palm Stearin, MalaysianSep 742.50 750.00 755.00 762.50 767.50Oct 737.50 745.00 750.00 757.50 762.50Nov/Dec 730.00 740.00 745.00 752.50 762.50Jan/Mar '15 755.00Palm Kernel Oil, Crude Indonesian/Malaysian, max 5% FFAAug/Sep 850/850TSep/Oct 880.00 880.00 820/800T 850.00 860.00Oct/Nov 880.00 880.00 820.00 850.00 860.00Nov/Dec 880.00 880.00 820/800T 850.00 860.00Dec/Jan '15 890.00 890/840T 820/840T 850.00 860.00Jan/Feb 890.00 900/850T 850/850T 860/860-850TFeb/Mar 850/850T 860/860TSunflower Oil, EU 2%, max 3% FFA, fob Northern PortsAug/Sep 805.00 800.00 800.00 802.50 807.50Oct/Dec 815.00 810.00 810.00 815.00 812.50Jan/Mar '15 825.00 825.00 820.00 825.00 817.50Apr/Jun 835.00 830.00 830.00 830.00 825.00Jly/Sep 845.00 845.00 840.00 840.00 835.00Oct/Dec 855.00 850.00 850.00 850.00 845.00

Coconut Oil, Philippine 3%, max 4% FFASep 1075.00 1050.00 1050.00 1150.00 1150.00

© 2014 "THE TRADE NEWS SERVICE" Reproduction or transmission of any portion without permission is strictly prohibited.

CIF ROTTERDAM PRICING ($/MT)

The following are nominal offered prices CIF Rotterdam, in US dollars per metric tonne unless otherwise noted:

FOB PHILIPPINES ($/MT)

Volume 100, No. 34 August 22, 2014

FOB MALAYSIA PRICING ($/MT)

08/22 08/21 08/20 08/19 08/18Palm Oil, RBD Malaysian/SumatranSep 670.00 677.50 685.00 687.50 692.50Oct 665.00 667.50 675.00 677.50 685.00Oct/Dec 657.50 665.00 672.50 675.00 682.50Jan/Mar '15 672.50 680.00 687.50 687.50 695.00Apr/Jun 690.00 700.00 692.50 700.00Palm Olein, RBD Malaysian, max .01% FFASep 675.00 682.50 690.00 692.50 697.50/695-

702.50TOct 670.00 672.50 675/685T 682.50 690.00Oct/Dec 662.50/672.50T 670/670-671.50- 672.50/675- 687.50/685T

672.50T 677.50-679TNov/Dec 680/687.50-690TJan/Mar '15 677.50/677.50- 685/685-682.50- 687.50/685T 692.50 700/695-705T

680-684T 686.50-687.50TApr/Jun 687.50/687.50- 695/695-690- 700/690-692.50- 697.50 705/702.50T

690T 695T 695-696TPalm Stearin, RBD Malaysian (PORAM)Sep 662.50 670.00 675.00 682.50 687.50Oct 657.50 665.00 670.00 677.50 682.50Nov/Dec 650.00 660.00 665.00 672.50 682.50Jan/Mar '15 675.00Palm Fatty Acid Distillate, RBD MalaysianSep 640.00 655.00 665.00 680.00 680.00Palm Kernel Oil, RBD MalaysianOct/Dec 950.00 900.00 895.00 920.00 945.00Palm Kernel Oil, RBD IndonesianSep 880.00 850.00 820.00 850.00 880.00Palm Kernel Oil, Crude IndonesianSep 800.00 850.00 820.00 850.00 880.00

Castor Oil, Any OriginAug/Sep 1700.00 1700.00 1700.00 1700.00 1700.00Linseed Oil, Any Origin, CrudeSep/Oct 1170.00 1170.00 1170.00 1170.00 1170.00Tung Oil, Any OriginAug/Sep 2575.00 2575.00 2575.00 2575.00 2575.00

Soy Oil, 0.75% FFAAug 655 650 645 650 650Sep/Oct 645 640 635 640 640Nov/Dec 635 630 625 630 630Jan/Mar '15 640 635 630 635 635Apr/Jun 650 645 640 645 645Rapeseed Oil, Max 2% FFAAug/Oct 635 635 630 630 630Nov/Jan '15 640 637/635T 630 632/630-628T 630Feb/Apr 643 642 635/636T 635/635T 640/631-630TMay/Jly 648 650 638 640 645

THE TRADE NEWS SERVICE Page 9

© 2014 "THE TRADE NEWS SERVICE" Reproduction or transmission of any portion without permission is strictly prohibited.

DUTCH ORIGIN, FOB MILL (Euros Per Tonne)

EX-TANK ROTTERDAM PRICING ($/MT)

THE TRADE NEWS SERVICE Volume 100, No. 34 August 22, 2014

SOYBEAN OIL BASIS

08/22 08/21 08/20 08/19 08/18Aug over Sep Futures 32.36 32.78 33.86 32.66 32.96Unrestricted 200 over 150 over 150 over 150 over 150 overEast Only 250 over 200 over 200 over 200 over 200 overDelivered Chicago 310 over 260 over 260 over 260 over 260 overWestern Oil 200 over 150 over 150 over 150 over 150 overSep over Sep Futures 32.36 32.78 33.86 32.66 32.96Unrestricted 200 over 150 over 150 over 150 over 150 overEast Only 250 over 200 over 200 over 200 over 200 overDelivered Chicago 310 over 260 over 260 over 260 over 260 overWestern Oil 200 over 150 over 150 over 150 over 150 overOct over Oct Futures 32.40 32.86 32.95 32.75 33.05Unrestricted 150 over 150 over 150 over 150 over 150 overEast Only 200 over 200 over 200 over 200 over 200 overDelivered Chicago 260 over 260 over 260 over 260 over 260 overWestern Oil 150 over 150 over 150 over 150 over 150 over

REFINED OILS DELIVERED NEW YORK - JUMBO CARS

08/22 08/21 08/20 08/19 08/18Cottonseed Oil Salad oil Aug/Sep 61.00 61.00 61.00 61.00 61.00 Cooking Oil Aug/Sep 59.00 59.00 59.00 59.00 59.00

Soybean Oil Aug 43.36 43.78 44.86 43.66 43.96Sep 43.36 43.78 44.86 43.66 43.96Oct 42.40 42.86 42.95 42.75 43.05

Corn Oil Aug/Sep 49.50 49.50 49.50 49.50 49.50

Peanut Oil Aug/Sep 78.00 78.00 78.00 78.00 80.00

Canola Oil Aug 43.36 43.78 44.86 43.66 43.96Sep 42.86 43.28 44.36 43.16 43.46Oct 42.90 43.36 43.45 43.25 43.55

REFINED OILS DELIVERED NEW YORK - TRUCKS

Coconut Oil Aug 66.00 67.00 67.50 70.00 71.88Sep 65.88 67.00 67.50 70.00 71.00Oct 65.38 66.00 66.50 67.88 67.88

Palm Oil Aug 46.38 48.00 48.00 47.13 49.25Sep 46.00 48.00 48.00 47.13 47.75Oct 45.88 47.25 47.25 47.00 47.38

The following are nominal crude as refined oil basis levels as of 4:30 P.M. Eastern Standard Time:

Page 10

© 2014 "THE TRADE NEWS SERVICE" Reproduction or transmission of any portion without permission is strictly prohibited.

THE TRADE NEWS SERVICE Volume 100, No. 34 August 22, 2014

The following are nearby settlement prices on nearby delivery futures contracts. Grains and soybeans are priced in dollars perbushel, Winnipeg canola in Canadian dollars per metric tonne, meals in dollars per short ton, soyoil, cotton and livestock incents per pound, currencies in US dollars except J-yen which is in cents per US dollar, cocoa in dollar per tonne, sugar in cents per pound, light crude oil in dollars per barrel, heating oil in dollars per gallon:

08/22 08/21 08/20 08/19 08/18 HIGH LOWGrains/Oilseeds/SoftsCorn Sep 3.6550 3.6225 3.5950 3.6250 3.6075 3.6550 3.5950Oats Sep 3.8400 3.7625 3.6300 3.7025 3.7075 3.8400 3.6300Wheat - Chicago Sep 5.5200 5.4625 5.3950 5.4600 5.4250 5.5200 5.3950 - Kansas City Sep 6.3350 6.2200 6.1875 6.2450 6.1775 6.3350 6.1775 - Minneapolis Sep 6.2675 6.1575 6.1025 6.1750 6.0825 6.2675 6.0825Canola, Winnipeg Nov 418.30 419.60 424.20 426.90 431.70 431.70 418.30Soybeans Sep 11.6600 11.3625 11.1975 11.2025 11.1550 11.6600 11.1550Soybean Meal Sep 433.30 413.80 402.60 399.80 392.10 433.30 392.10Soybean Oil Sep 32.36 32.78 32.86 32.66 32.46 32.86 32.36Crude Palm Oil (Ringgit/mt) Sep 2021 2055 2054 2074 2099 2099 2021Cotton Oct 67.46 66.50 65.32 63.47 63.34 67.46 63.34Cocoa Sep 3196 3198 3221 3199 3259 3259 3196Coffee Sep 181.60 183.75 194.10 182.20 188.90 194.10 181.60Sugar, World #11 Oct 15.64 15.99 15.70 15.47 15.68 15.99 15.47Butter Sep 274.000 272.000 267.000 262.250 259.000 274.000 259.000LivestockFeeder Cattle Sep 210.900 209.425 211.250 214.250 216.075 216.075 209.425Live Cattle Oct 147.000 145.550 145.400 147.225 148.550 148.550 145.400Lean Hogs Oct 92.875 93.625 92.500 94.825 95.100 95.100 92.500CurrenciesBrazilian Real Sep 0.43785 0.44065 0.44115 0.44300 0.44115 0.44300 0.43785British Pound Sep 1.6574 1.6583 1.6595 1.6615 1.6723 1.6723 1.6574Euro Currency Sep 1.3243 1.3282 1.3265 1.3321 1.3363 1.3363 1.3243Japanese Yen Sep 0.009623 0.009636 0.009644 0.009718 0.009749 0.009749 0.009623Swiss Franc Sep 1.0943 1.0974 1.0954 1.1002 1.1034 1.1034 1.0943Canadian Dollar Sep 0.9131 0.9130 0.9113 0.9132 0.9178 0.9178 0.9113Australian Dollar Sep 0.9302 0.9288 0.9273 0.9292 0.9307 0.9307 0.9273Mexican Peso Sep 0.076060 0.076230 0.076130 0.076480 0.076460 0.076480 0.076060Credit Markets30 Year T-Bonds Sep 140.4375 140.0625 139.6875 139.7813 140.1563 140.4375 139.687510 Year T-Notes Sep 125.8906 126.0156 125.9219 126.2188 126.3594 126.3594 125.89065 Year T-Notes Sep 119.4219 119.5859 119.5547 119.8125 119.8750 119.8750 119.42191 Mo. Libor Sep 99.8450 99.8450 99.8450 99.8450 99.8475 99.8475 99.8450Eurodollar Sep 99.7625 99.7650 99.7675 99.7675 99.7675 99.7675 99.7625Index FuturesS&P 500 Sep 1987.80 1989.60 1983.30 1977.20 1967.50 1989.60 1967.50US Dollar Index Sep 82.377 82.208 82.280 81.937 81.631 82.377 81.631Nikkei Sep 15560 15655 15565 15500 15435 15655 15435Energy FuturesLight Crude Oil Oct 93.65 93.96 93.45 92.86 93.75 93.96 92.86Heating Oil Sep 2.8279 2.8375 2.8258 2.8171 2.8060 2.8375 2.8060

© 2014 "THE TRADE NEWS SERVICE" Reproduction or transmission of any portion without permission is strictly prohibited.

Page 11

THE TRADE NEWS SERVICE Volume 100, No. 34 August 22, 2014

The following are nominal prices as of 4:30 P.M. Eastern Standard Time. All prices are in cents per pound FOB and CIF asnoted, except Brazilian and Argentine values in U.S. dollars per tonne FOB (highlighted prices corrected from daily report):

08/22 08/21 08/20 08/19 08/18 HIGH LOW

Crude/RBD (Tanks FOB), unless noted:PBSY Cottonseed, MS Valley Aug 47.36 47.78 47.86 47.66 47.46 47.86 47.36Peanut, Southeast Aug 59.00 59.00 59.00 59.00 59.00 59.00 59.00Corn, Midwest Aug 38.00 38.00 38.00 38.00 38.00 38.00 38.00Soybean, Decatur Aug 34.36 34.28 34.36 34.16 34.46 34.46 34.16Soybean, Brazil, US$/mt Sep 798.29 807.54 814.82 814.82 817.02 817.02 798.29Soybean, Argentina, US$/mt Sep 806.00 815.26 821.43 821.43 823.64 823.64 806.00Sunflower, Argentina, US $/mt Sep 930.00 930.00 930.00 930.00 930.00 930.00 930.00Coconut, Gulf Spot 52.75 53.00 53.00 54.38 54.63 54.63 52.75Coconut, Pacific Spot 52.25 52.50 52.50 53.88 54.13 54.13 52.25RBD Palm, Gulf Spot 36.00 36.25 36.63 36.75 37.00 37.00 36.00SD Canola, Vancouver, US$ Aug 34.86 34.78 34.86 34.66 34.96 34.96 34.66RBD Canola, Toronto, US$ Aug 43.86 44.78 44.86 44.66 44.96 44.96 43.86RBD Canola, Vancouver, C$ Aug 38.36 37.78 37.86 37.66 37.96 38.36 37.66Crude/RBD (CIF)Crude Coconut, US Gulf Afloat --- --- --- --- --- --- ---Crude Coconut, US Gulf Aug 51.75 52.00 52.00 53.38 53.63 53.63 51.75Crude Coconut, US Gulf Sep 51.38 51.13 51.13 52.25 52.25 52.25 51.13Crude Coconut, Pacific Spot 51.25 51.50 51.50 52.88 53.13 53.13 51.25RBD Palm, US Gulf Sep 35.00 35.25 35.63 35.75 36.00 36.00 35.00RBD Palm Olein, US Gulf Sep 35.25 35.50 35.88 36.00 36.25 36.25 35.25RBD Palm Stearin, US Gulf Sep 34.63 35.00 35.25 35.50 35.75 35.75 34.63RBD Palm Kernel, US Gulf Afloat --- --- --- --- --- --- ---RBD Palm Kernel, US Gulf Aug 45.75 45.25 44.25 45.25 45.75 45.75 44.25RBD Palm Kernel, US Gulf Sep 45.50 45.25 44.25 45.00 45.75 45.75 44.25RBWD NuSun, fob Dakotas Aug 63.00 63.00 63.00 63.00 63.00 63.00 63.00RBWD Linoleic Sun, fob Dakotas Aug 74.00 74.00 74.00 74.00 74.00 74.00 74.00Fully Refined (Tanks del.)Cottonseed, Salad, NY Aug 61.00 61.00 61.00 61.00 61.00 61.00 61.00Cottonseed, Cooking, NY Aug 59.00 59.00 59.00 59.00 59.00 59.00 59.00Peanut, NY Aug 78.00 78.00 78.00 78.00 80.00 80.00 78.00Corn, NY Aug 49.50 49.50 49.50 49.50 49.50 49.50 49.50Soybean, NY Aug 43.36 43.78 43.86 43.66 43.96 43.96 43.36Coconut (Wagons), NY Aug 66.00 67.00 67.50 70.00 71.88 71.88 66.00RBD Palm (Wagons), NY Aug 46.38 48.00 48.00 47.13 49.25 49.25 46.38Canola, NY Aug 43.36 43.78 43.86 43.66 43.96 43.96 43.36Canola, LA Aug 42.61 42.78 42.61 42.41 42.71 42.78 42.41Edible Fat/Oil Index 1976 = 100 204.57 205.21 205.52 206.45 206.79 206.79 204.57

Tanks (FOB)Castor, No. 1, NY Spot 79.00 79.00 79.00 79.00 79.00 79.00 79.00Linseed, Minneapolis Spot 71.00 71.00 71.00 71.00 71.00 71.00 71.00Linseed, NY Spot 76.00 76.00 76.00 76.00 76.00 76.00 76.00Tung, NY Spot 150.00 150.00 150.00 150.00 150.00 150.00 150.00

© 2014 "THE TRADE NEWS SERVICE" Reproduction or transmission of any portion without permission is strictly prohibited.

WEEKLY PRICE RECORD

Page 12

EDIBLE OILS

INDUSTRIAL OILS

THE TRADE NEWS SERVICE Volume 100, No. 34 August 22, 2014

WEEKLY PRICE RECORD

The following are nominal prices as of 4:30 P.M. Eastern Standard Time. Edible and inedible fat prices are in cents perpound FOB unless noted, with Bulk-Lot Feedstuffs priced in dollars per short ton FOB (tallow/grease trades in italicsnominal changes highlighted in blue)

08/22 08/21 08/20 08/19 08/18 HIGH LOW

Delivered ChicagoLard, Chicago 46.00 46.00 46.00 46.00 46.00 46.00 46.00Edible Tallow, Chicago 40.75 41.00 41.00 41.50 41.50 41.50 40.75Delivered US Gulf/HoustonTechnical Edible Tallow, Gulf 40.50 41.00 41.00 41.50 41.50 41.50 40.50

Tanks Delivered New York CityFancy Tallow 41.00 41.00 41.00 41.00 41.00 41.00 41.00Choice White Grease (Feed) 37.00 37.00 37.00 37.50 37.50 37.50 37.00Choice White Grease (Chemical) 37.50 37.50 37.50 38.00 38.00 38.00 37.50Yellow Grease , 10 Acid 29.00 29.00 29.00 30.00 30.00 30.00 29.00Yellow Grease, 15 Acid 28.50 28.50 28.50 29.50 29.50 29.50 28.50Missouri RiverPacker Bleachable Fancy Tallow 38.75 38.75 38.75 38.75 38.75 38.75 38.75Choice White Grease (Feed) 33.00 33.00 33.00 33.00 33.00 33.00 33.00Yellow Grease, 15 Acid, fob MO Points 26.00 26.00 27.00 27.00 27.00 27.00 26.00Delivered US Gulf/HoustonPacker Bleachable Fancy Tallow 36.50 39.00 39.00 39.50 40.50 40.50 36.50Choice White Grease (Feed) 37.50 37.50 37.50 38.00 38.00 38.00 37.50Yellow Grease, 15 Acid, NOLA 27.00 27.00 27.50 29.50 29.50 29.50 27.00Yellow Grease, 15 Acid, Houston 27.00 27.00 27.50 29.50 29.50 29.50 27.00Delivered ChicagoPacker Bleachable Fancy Tallow 39.75 39.75 39.75 39.75 39.75 39.75 39.75Renderer Bleachable Fancy Tallow 40.00 40.00 40.00 40.00 40.00 40.00 40.00Choice White Grease (Chemical) 36.50 36.50 36.50 37.00 37.00 37.00 36.50Yellow Grease, 15 Acid, Fob IL Points 27.50 27.50 28.50 30.00 30.00 30.00 27.50FOB Los Angeles PlantsYellow Grease, 15 Acid 31.00 31.00 31.00 31.00 31.75 31.75 31.00Delivered Imperial ValleyYellow Grease, 15 Acid 31.75 31.75 31.75 31.75 32.00 32.00 31.75Delivered San Joaquin ValleyYellow Grease, 15 Acid 31.25 31.25 31.25 31.25 31.50 31.50 31.25Delivered CarolinasYellow Grease, 15 Acid 29.00 29.00 29.00 31.00 31.00 31.00 29.00Poultry Fat (Feed) 29.50 29.50 29.50 31.00 31.00 31.00 29.50Delivered Texas PanhandleYellow Grease, 15 Acid 27.50 27.50 28.00 30.00 30.00 30.00 27.50

Soy Meal, Decatur 44%, $/ST 573.30 533.80 482.60 459.80 452.10 573.30 452.10Soy Meal, Decatur 48%, $/ST 583.30 543.80 492.60 469.80 462.10 583.30 462.10Soy Meal, US Gulf 44%, $/ST Unq Unq Unq 449.80 442.10 449.80 442.10Soy Meal, US Gulf 48%, $/ST Unq Unq Unq 459.80 452.10 459.80 452.10Cotton Meal, Memphis 41% 300.00 300.00 300.00 300.00 300.00 300.00 300.00Linseed Meal, Mpls 34% 235.00 235.00 235.00 235.00 240.00 240.00 235.00Sun Meal, ND/SD/MN 32% 150.00 150.00 150.00 150.00 155.00 155.00 150.00

© 2013 "THE TRADE NEWS SERVICE" Reproduction or transmission of any portion without permission is strictly prohibited.

Page 13

EDIBLE FATS

INEDIBLE FATS

FEED INGREDIENTS (Bulk)

THE TRADE NEWS SERVICE Volume 100, No. 34 Page 14 August 22, 2014

© 2014 "THE TRADE NEWS SERVICE" Reproduction or transmission of any portion without permission is strictly prohibited.

WET-MILLED CORN OILFOB MIDWEST

35

40

45

50

55

60

65

70

J AS OND J FM AMJ J A SON D J FM AM J J A SON D J FMAM J J A S

WEEKLY CLOSE FROM JLY 2011 TO DATE

CEN

TS P

ER P

OU

ND

RBD PALM KERNEL OILCIF US GULF

35404550556065707580

J AS OND J FM AMJ J A SON D J FM AM J J A SON D J FMAM J J A S

WEEKLY CLOSE FROM JLY 2011 TO DATE

CEN

TS P

ER P

OU

ND

PBSY COTTONSEED OILFOB MS VALLEY

40

50

60

70

80

90

100

J AS OND J FM AMJ J A SON D J FM AM J J A SON D J FMAM J J A S

WEEKLY CLOSE FROM JLY 2011 TO DATE

CEN

TS P

ER P

OU

ND

RBD PALM OILCIF US GULF

33

38

43

48

53

58

63

J AS OND J FM AMJ J A SON D J FM AM J J A SON D J FMAM J J A S

WEEKLY CLOSE FROM JLY 2011 TO DATE

CEN

TS P

ER P

OU

ND

CRUDE PEANUT OILFOB SOUTHEAST

50

60

70

80

90

100

110

J AS OND J FM AMJ J A SON D J FM AM J J A SON D J FMAM J J A S

WEEKLY CLOSE FROM JLY 2011 TO DATE

CEN

TS P

ER P

OU

ND

CRUDE COCONUT OIL CIF US GULF

2232425262728292

102112

J AS OND J FMAMJ J A SON D J FMAM J J A SON D J FMAM J J A S

WEEKLY CLOSE FROM JLY 2011 TO DATE

CEN

TS P

ER P

OU

ND

THE TRADE NEWS SERVICE Volume 100, No. 34 Page 15 August 22, 2014

FOB NOLA OVERAGES - FOB vessel NOLA/Houston nominal vegetable oil overages basis CBOT soybean oil futures, with corn oil and sun oil in US dollars per tonne, as of Friday afternoon:

Oil Shipped Nominal Shipped NominalSoyoil, Crude Degummed Aug/Sep 450 Sep/Oct 75Soyoil, Fully Refined Sep Unq Sep/Oct 600Cottonseed Oil, PBSY Sep Unq Sep/Oct 150Corn Oil, Crude Sep $925 Sep/Oct $940Corn Oil, Refined Sep $1,145 Sep/Oct $1,140

Crop Stage 08/10/14 08/11/13 Average Stage 08/10/14 08/11/13 AverageCorn Dough 70 49 63 Dented 22 10 27Cotton Set. Bolls 88 83 88 Bolls Open 12 8 12Peanuts Pegging 98 96 96Soybeans Blooming 95 91 95 Set. Pods 83 70 79Spr Wheat Harvested 17 16 33

Pct Pct Pct Pct PctCrop Crop Yr Excellent Good Fair Poor V. PoorCorn 2014 21 51 20 6 2

2013 17 44 26 9 4Cotton 2014 11 39 34 12 4

2013 9 37 31 14 9Peanuts 2014 11 53 28 7 1

2013 12 49 33 5 1Soybeans 2014 17 54 23 5 1

2013 14 48 28 8 2Spring Wheat 2014 14 54 26 5 1

2013 11 55 27 5 2CCC BUYS VEGETABLE OIL - The Kansas City Commodity Office (KCCO) on Thursday announced the purchase of a total of 2,359,843 pounds of vegetable oil for use in domestic programs during the months of Oct, Nov and Dec. Includedin the totl were 1,646,568 pounds in 48 ounce bottles, priced in a range from 51.12 to 68.40 cents per pound, 443,520 poundsin 1 gllon bottles at prices ranging from 50.16 to 60.54 cents per pound, 221,760 pounds low saturated fat soybean oil in 1 gallon bottles, priced from 71.13 to 80.87 cents per pound, and 48,000 pounds bulk oil priced at 42.66 cents per pound.ROMANIA RAPESEED A RECORD - According to Romania's Agriculture Minnister, Daniel Constantin, the countryproduced a record 1.1 million tonnes of rapeseed this year. This was about double last year's total of 647,811 tonnes, according to Constantin, surpassing the 2010 record of 943,000 tonnes that was set in 2010. WEEKLY GRAIN STOCKS - The USDA reported stocks of grain and soybeans at elevators/terminals, with comparisonsin thousands of bushels (revisions highlighted):

Pct08/17/14 08/10/14 08/18/13 Yr/Yr

Corn 27,463 26,995 13,225 108Soybeans 2,541 2,412 2,071 23Wheat 118,064 114,305 163,449 -28

© 2014 "THE TRADE NEWS SERVICE" Reproduction or transmission of any portion without permission is strictly prohibited.

08/23/1308/22/14

US CROP PROGRESS

US CROP RATINGS

This report will be discontinued as of August 29, 2014.

Volume 100, No. 34 August 22, 2014

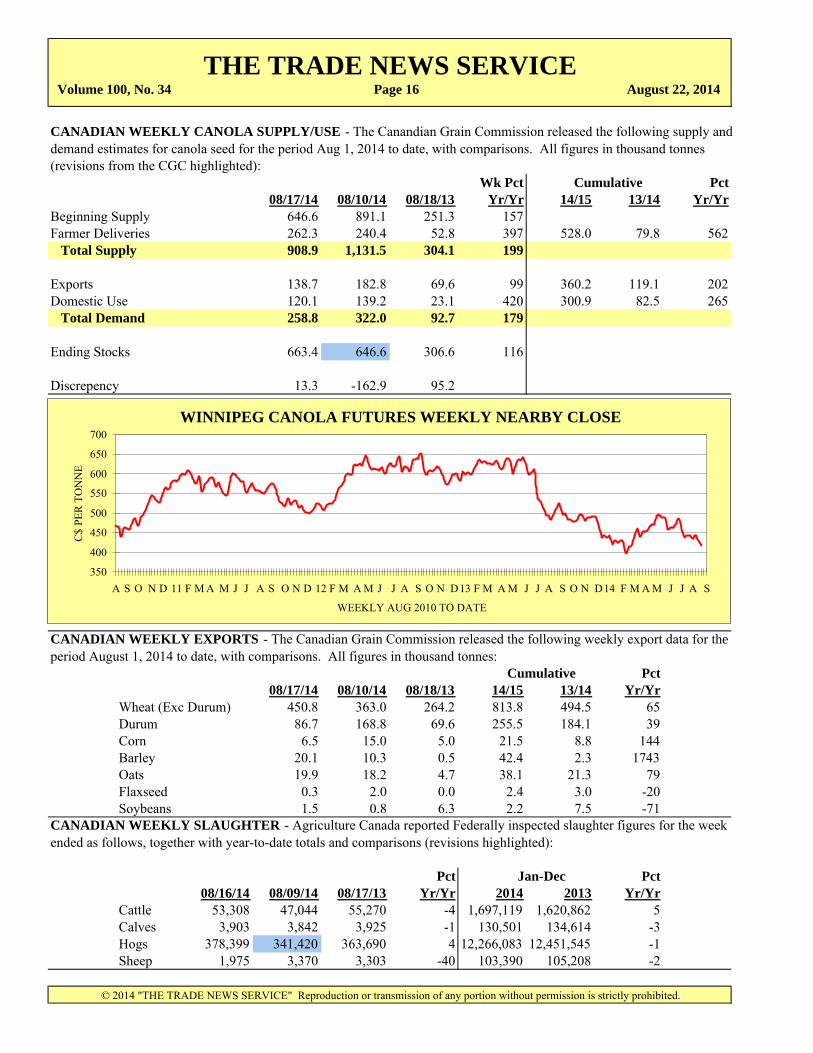
CANADIAN WEEKLY CANOLA SUPPLY/USE - The Canandian Grain Commission released the following supply anddemand estimates for canola seed for the period Aug 1, 2014 to date, with comparisons. All figures in thousand tonnes(revisions from the CGC highlighted):

Wk Pct Pct08/17/14 08/10/14 08/18/13 Yr/Yr 14/15 13/14 Yr/Yr

Beginning Supply 646.6 891.1 251.3 157Farmer Deliveries 262.3 240.4 52.8 397 528.0 79.8 562 Total Supply 908.9 1,131.5 304.1 199

Exports 138.7 182.8 69.6 99 360.2 119.1 202Domestic Use 120.1 139.2 23.1 420 300.9 82.5 265 Total Demand 258.8 322.0 92.7 179

Ending Stocks 663.4 646.6 306.6 116

Discrepency 13.3 -162.9 95.2

CANADIAN WEEKLY EXPORTS - The Canadian Grain Commission released the following weekly export data for theperiod August 1, 2014 to date, with comparisons. All figures in thousand tonnes:

Pct08/17/14 08/10/14 08/18/13 14/15 13/14 Yr/Yr

Wheat (Exc Durum) 450.8 363.0 264.2 813.8 494.5 65Durum 86.7 168.8 69.6 255.5 184.1 39Corn 6.5 15.0 5.0 21.5 8.8 144Barley 20.1 10.3 0.5 42.4 2.3 1743Oats 19.9 18.2 4.7 38.1 21.3 79Flaxseed 0.3 2.0 0.0 2.4 3.0 -20Soybeans 1.5 0.8 6.3 2.2 7.5 -71

CANADIAN WEEKLY SLAUGHTER - Agriculture Canada reported Federally inspected slaughter figures for the weekended as follows, together with year-to-date totals and comparisons (revisions highlighted):

Pct Pct08/16/14 08/09/14 08/17/13 Yr/Yr 2014 2013 Yr/Yr

Cattle 53,308 47,044 55,270 -4 1,697,119 1,620,862 5Calves 3,903 3,842 3,925 -1 130,501 134,614 -3Hogs 378,399 341,420 363,690 4 12,266,083 12,451,545 -1Sheep 1,975 3,370 3,303 -40 103,390 105,208 -2

© 2014 "THE TRADE NEWS SERVICE" Reproduction or transmission of any portion without permission is strictly prohibited.

THE TRADE NEWS SERVICE Page 16

Cumulative

Cumulative

Jan-Dec

WINNIPEG CANOLA FUTURES WEEKLY NEARBY CLOSE

350

400

450

500

550

600

650

700

A S O N D 11 F M A M J J A S O N D 12 F M A M J J A S O N D13 F M A M J J A S O N D14 F M A M J J A S

WEEKLY AUG 2010 TO DATE

C$

PER

TO

NN

E

Volume 100, No. 34 August 22, 2014

08/22/14 08/15/14 Change 08/22/14 08/15/14 ChangeCrude Oct $93.65 $95.32 -$1.67 New England $3.434 $3.435 $0.000Light Nov $93.17 $94.74 -$1.57 Central Atlantic $3.278 $3.311 -$0.033

Dec $92.92 $94.39 -$1.47 Lower Atlantic $3.237 $3.256 -$0.019Heating Sep $2.8279 $2.8480 -$0.0201 Midwest $3.265 $3.276 -$0.012Oil Oct $2.8343 $2.8542 -$0.0199 Gulf Coast $3.271 $3.284 -$0.013

Nov $2.8413 $2.8622 -$0.0209 Rocky Mountain $3.379 $3.371 $0.008Natural Sep $3.840 $3.776 $0.064 West Coast $3.338 $3.354 -$0.016Gas Oct $3.883 $3.807 $0.076 US Average $3.315 $3.327 -$0.012

Nov $3.956 $3.879 $0.077RBOB Sep $2.7384 $2.6986 $0.0398Gasoline Oct $2.5889 $2.5750 $0.0139Blendstock Nov $2.5537 $2.5510 $0.0027

08/22/14 08/15/14 ChangeEastern US $3.52 $3.51 $0.01

08/22/14 08/15/14 Change Central US $3.48 $3.50 -$0.02Sep $2.172 $2.158 $0.014 Gulf Coast $3.45 $3.47 -$0.02Oct $2.023 $2.035 -$0.012 Western US $3.68 $3.68 $0.00Nov $1.927 $1.936 -$0.009 RINs: 2013 $0.54 $0.53 $0.01Dec $1.861 $1.862 -$0.001Jan '15 $1.812 $1.819 -$0.007Feb $1.786 $1.794 -$0.008 08/22/14 08/15/14 ChangeMar $1.764 $1.778 -$0.014 Nearby Soyoil Futures $0.3236 $0.3287 -$0.0051

Heating Oil Futures $2.8279 $2.8480 -$0.0201Soyoil $ per gallon $2.4270 $2.4653 -$0.0383

08/22/14 08/15/14 ChangeEastern US $2.250 $2.290 -$0.04 HOBO Spread $0.4009 $0.3828 $0.0182Central US $2.100 $2.115 -$0.02Gulf US $2.210 $2.225 -$0.02Western US $2.280 $2.320 -$0.04D6 RINs $0.520 $0.530 -$0.01

Page 17

BIODIESEL AND ETHANOL

THE TRADE NEWS SERVICE

ENERGY FUTURES AVG SPOT DIESEL PRICE $/GAL*

AVG SPOT ETHANOL PRICE $/GAL

© 2014 "THE TRADE NEWS SERVICE" Reproduction or transmission of any portion without permission is strictly prohibited.

* Less State and Federal Excise Taxes

AVG SPOT SOY B100 PRICE $/GAL

ECBOT ETHANOL FUTURES $/GAL

HOBO SPREAD $/GAL

SOY B100: AVG EAST COAST

2.5

3.0

3.5

4.0

4.5

5.0

5.5

6.0

6.5

08 09 10 11 12 13 14

FRIDAY CLOSE JAN '08 TO PRESENT

US$

/ G

ALL

ON

Volume 100, No. 34 August 22, 2014

US CATTLE ON-FEED - The USDA this afternoon released its US Cattle-On-Feed report, with year-ago comparisonsin thousand head (revisions highlighted)

Pct Pct2014 2013 2012 14/13 13/12

On Feed Aug 1 9,837 10,025 10,656 -2 -6Placed in Jly 1,560 1,684 1,922 -7 -12Marketed in Jly 1,787 1,970 1,913 -9 3Other Disap in Jly 63 64 63 -2 2On Feed Jly 1 10,127 10,375 10,710 -2 -3

THE TRADE NEWS SERVICE Page 18

© 2014 "THE TRADE NEWS SERVICE" Reproduction or transmission of any portion without permission is strictly prohibited.

US CATTLE-ON-FEED

-15-10

-505

101520

96 97 98 99 00 01 02 03 04 05 06 07 08 09 10 11 12 13 14

1000+ Feedlots

PCT

YR/

YR

US CATTLE-ON-FEED

-60-40-20

0204060

96 97 98 99 00 01 02 03 04 05 06 07 08 09 10 11 12 13 14

1000+ Feedlots

RA

TIO

MA

RK

ETIN

GS

TO P

LACE

MEN

TS

US CATTLE-ON-FEED

700080009000

10000110001200013000

96 97 98 99 00 01 02 03 04 05 06 07 08 09 10 11 12 13 14

1000+ Feedlots

Thou

sand

Hea

d

US CATTLE PLACEMENTS

1000

1500

2000

2500

3000

3500

96 97 98 99 00 01 02 03 04 05 06 07 08 09 10 11 12 13 14

1000+ Feedlots

Thou

sand

Hea

d

US CATTLE MARKETED

1500

1700

1900

2100

2300

2500

96 97 98 99 00 01 02 03 04 05 06 07 08 09 10 11 12 13 14

1000+ Feedlots

Thou

sand

Hea

d

US CATTLE-ON-FEED 2013 VS 5YR AVG

95001000010500110001150012000

J F M A M J J A S O N D1000+ FEEDLOTS

AVG 2014

THE TRADE NEWS SERVICE Volume 100, No.34 August 22, 2014

HATCHERY REPORT - The USDA reported the following hatchery production statistics, with monthly and year-agocomparisons. All figures in thousands:

Eggs In Incubators Aug 1, '14 Jly 1, '14 Aug 1, '13 %Yr/Yr 2014 2013 %Yr/Yr Egg-Type Chickens 38,507 40,316 36,367 6 327,273 322,924 1 Broiler-Type Chickens 643,233 635,795 627,529 3 5,060,848 4,995,378 1

Chicks Hatched Jly '14 Jun '14 Jly '13 %Yr/Yr 2014 2013 %Yr/Yr Egg-Type Chickens 42,290 43,470 36,367 16 42,290 39,225 8 Broiler-Type Chickens 784,499 762,783 783,999 0 5,310,649 5,309,047 0

Pullets Placed Jly '14 Jun '14 Jly '13 %Yr/Yr Egg-Type Chickens 267 172 275 -3 Broiler-Type Chickens 6,212 7,094 60,591 -90END-MONTH COLD STORAGE - Month-end U.S. stocks of meat and other commodities in cold storage were reportedby the USDA for the following periods, in THOUSAND POUNDS:

Jly '14 Jun '14 Jly '13 %Yr/YrTotal Beef 366,549 58,171 462,597 -21 Boneless 327,898 320,350 418,721 -22 Beef Cuts 38,651 37,821 43,876 -12Total Pork 529,250 537,447 543,668 -3 Pork Bellies 64,690 83,936 28,177 130 Hams 149,543 126,493 180,677 -17 Loins 22,992 27,591 25,688 -10Other Red Meat 37,989 34,443 29,221 30Total Chicken 612,605 569,696 703,665 -13 Whole Broilers/Fryers 13,578 7,932 21,631 -37Total Turkey 491,116 459,136 581,357 -16French Fries 726,622 807,376 903,749 -20Other Frozen Potatoes 198,938 205,458 234,641 -15Butter 170,207 186,020 295,751 -42

CANADIAN LIVESTOCK ESTIMATES - Statistics Canada this week reported July 1, 2014 livestock inventories, withyear ago comparisons, in thousand head, as follows:

2014 2013 2014 2013 2014 2013Atlantic 230.7 232.0 123.4 123.0 47.7 46.7Quebec 1,175.0 1,200.0 4,265.0 4,140.0 264.0 263.0Ontario 1,739.3 1,743.0 2,937.6 3,045.0 336.0 351.0Manitoba 1,220.0 1,255.0 2,910.0 2,860.0 72.0 76.0Saskatchewan 2,845.0 2,910.0 1,135.0 1,070.0 123.0 126.0Alberta 5,470.0 5,535.0 1,475.0 1,440.0 201.0 204.0British Colombia 650.0 645.0 89.0 87.0 56.0 59.0 TOTAL 13,330.0 13,520.0 12,935.0 12,765.0 1,099.7 1,125.7

CCC DOMESTIC TENDER - The Farms Service Agency (FS) on behalf of the Commodity Credit Corporation (CCC)called for offers on 576,000 pounds bulk refined veg oil and 111,780 pound buttery spread in 15 ounce tubs for use in domesticprograms during the months of Oct, Nov and Dec. All offer are due at the Kansas City Commodity Office (KCCO) by 9 AMCT on Sep 2, with notification to successful offerors by 2 PM CT the following day.

© 2014 "THE TRADE NEWS SERVICE" Reproduction or transmission of any portion without permission is strictly prohibited.

Page 19

Jan-Aug 1

Jan-Jly

Cattle Hogs Sheep/Lambs

Volume 100, No. 34 August 22, 2014

Volume 89, No. 40

THE TRADE NEWS SERVICEPage 20

© 2014 "THE TRADE NEWS SERVICE" Reproduction or transmission of any portion without permission is strictly prohibited.

RBD PALM STEARIN, FOB MALAYSIA

650

700

750

800

850

900

950

O N D J F M A M J J A S

FRIDAY CLOSE

US$

/TO

NN

E

13/14 12/13

RBD PALM OLEIN, FOB MALAYSIA

625

675

725

775

825

875

925

975

O N D J F M A M J J A S

FRIDAY CLOSE

US$

/TO

NN

E

13/14 12/13

RBD PALM OIL, FOB MALAYSIA

625

675

725

775

825

875

925

975

O N D J F M A M J J A S

FRIDAY CLOSE

US$

/TO

NN

E

13/14 12/13

SPREAD: DEGUMMED SOYOIL, FOB GULF MINUS RBD PALM OIL, FOB

MALAYSIA

050

100150200250300350400450

O N D J F M A M J J A SFRIDAY CLOSE

US$

/TO

NN

E

13/14 12/13

CRUDE COCONUT OIL, FOB PHILIPPPINES

700

800

900

1000

1100

1200

1300

1400

1500

O N D J F M A M J J A S

FRIDAY CLOSE

US$

/TO

NN

E

13/14 12/13

RBD PKO, FOB MALAYSIA

700800900

1000110012001300140015001600

O N D J F M A M J J A S

FRIDAY CLOSE

US$

/TO

NN

E

13/14 12/13

Volume 100, No. 34 August 22, 2014

Volume 89, No. 40

THE TRADE NEWS SERVICEPage 21

© 2014 "THE TRADE NEWS SERVICE" Reproduction or transmission of any portion without permission is strictly prohibited.

RENDERER BLEACHABLE FANCYTALLOW, FOB CHICAGO

2830323436384042444648

O N D J F M A M J J A S O

FRIDAY CLOSE

CEN

TS/P

OU

ND

13/14 12/13

SOYBEAN OIL CRUDE DECATUR

3234363840424446485052

O N D J F M A M J J A SFRIDAY CLOSE

CEN

TS/P

OU

ND

13/14 12/13

EDIBLE TALLOWFOB CHICAGO

32

37

42

47

52

O N D J F M A M J J A S

FRIDAY CLOSE

CEN

TS/P

OU

ND

13/14 12/13

SPREAD: EDIBLE TALLOWMINUS RENDERER BFT, FOB CHICAGO

-4

-2

0

2

4

6

8

10

O N D J F M A M J J A SFRIDAY CLOSE

CEN

TS/P

OU

ND

13/14 12/13

LARDFOB CHICAGO

30

3540

45

50

5560

65

70

O N D J F M A M J J A SFRIDAY CLOSE

CEN

TS/P

OU

ND

13/14 12/13

15 ACID YELLOW GREASEFOB ILLINOIS POINTS

22242628303234363840

O N D J F M A M J J A S

FRIDAY CLOSE

CEN

TS/P

OU

ND

13/14 12/13


Recommended