33
Malaysia’s Investment Malaise: What Happened and Can It Be Fixed? Jayant Menon No. 312 | April 2012 ADB Economics Working Paper Series
Malaysia’s Investment Malaise: What Happened and Can It Be Fixed?
Jayant Menon No. 312 | April 2012
ADB Economics Working Paper Series
Malaysia’s Investment Malaise: What Happened and Can It Be Fixed?Private investment in Malaysia has never fully recovered from the impact of the Asian financial crisis. Resolving the problem requires addressing the distortions in the New Economic Policy and curtailing the influence of government-linked corporations.
About the Asian Development BankADB’s vision is an Asia and Pacific region free of poverty. Its mission is to help its developing member countries reduce poverty and improve the quality of life of their people. Despite the region’s many successes, it remains home to two-thirds of the world’s poor: 1.8 billion people who live on less than $2 a day, with 903 million struggling on less than $1.25 a day. ADB is committed to reducing poverty through inclusive economic growth, environmentally sustainable growth, and regional integration. Based in Manila, ADB is owned by 67 members, including 48 from the region. Its main instruments for helping its developing member countries are policy dialogue, loans, equity investments, guarantees, grants, and technical assistance.
Asian Development Bank6 ADB Avenue, Mandaluyong City1550 Metro Manila, Philippineswww.adb.org/economics
Printed on recycled paper Printed in the Philippines

ADB Economics Working Paper Series
Malaysia’s Investment Malaise: What Happened and Can It Be Fixed?
Jayant Menon
No. 312 April 2012
Jayant Menon is Lead Economist, Office for Regional Economic Integration, Asian Development Bank. The author is grateful to Prema-Chandra Athukorala, Hal Hill, K.S. Jomo, Greg Lopez, Anant Menon, Adelene Teo, Ng Thiam Hee, and participants at the Transforming Malaysia: Ideas for the Next Decade workshop (ISEAS, Singapore, 29 September 2011) for useful comments and discussions. Anna Cassandra Melendez provided excellent research assistance.

Asian Development Bank 6 ADB Avenue, Mandaluyong City 1550 Metro Manila, Philippines www.adb.org © 2012 by Asian Development Bank April 2012 ISSN 1655-5252 Publication Stock No. WPS124852 The views expressed in this paper are those of the author and do not necessarily reflect the views and policies of the Asian Development Bank (ADB) or its Board of Governors or the governments they represent. ADB does not guarantee the accuracy of the data included in this publication and accepts no responsibility for any consequence of their use. By making any designation of or reference to a particular territory or geographic area, or by using the term “country” in this document, ADB does not intend to make any judgments as to the legal or other status of any territory or area. Note: In this publication, “$” refers to US dollars.
The ADB Economics Working Paper Series is a forum for stimulating discussion and eliciting
feedback on ongoing and recently completed research and policy studies undertaken by the
Asian Development Bank (ADB) staff, consultants, or resource persons. The series deals with
key economic and development problems, particularly those facing the Asia and Pacific region;
as well as conceptual, analytical, or methodological issues relating to project/program economic
analysis, and statistical data and measurement. The series aims to enhance the knowledge on
Asia’s development and policy challenges; strengthen analytical rigor and quality of ADB’s
country partnership strategies, and its subregional and country operations; and improve
the quality and availability of statistical data and development indicators for monitoring
development effectiveness.
The ADB Economics Working Paper Series is a quick-disseminating, informal publication whose
titles could subsequently be revised for publication as articles in professional journals or
chapters in books. The series is maintained by the Economics and Research Department.
Printed on recycled paper

CONTENTS
ABSTRACT v
I. INTRODUCTION 1
II. DOMESTIC INVESTMENT (PRE- AND POST-AFC) 2
III. FOREIGN INWARD AND OUTWARD INVESTMENT (PRE- AND POST-AFC) 3
A. Foreign Inward Investment 3
B. Foreign Outward Investment 6
IV. THE FALL IN PRIVATE INVESTMENT: LIKELY CAUSES 9
V. POLICY CHANGES TO RETAIN AND REVIVE PRIVATE INVESTMENT 15
A. The NEM and the NEP 19
VI. CONCLUSION 21
REFERENCES 23


ABSTRACT
Private investment in Malaysia has never fully recovered from the impact of the Asian financial crisis (AFC). Both domestic and foreign investment have remained lackluster post-AFC; while foreigners continue to shun Malaysia, it seems even domestic investors are fleeing as well, with Malaysia having become a net exporter of capital since 2005. The crucial questions are: what happened and can it be fixed? We argue that the investment malaise can be attributed to two interrelated factors: (i) distortions introduced by the New Economic Policy (NEP) and its reincarnates, and (ii) the widespread presence and overbearing influence of government-linked corporations (GLCs) that deter new investment. While the impacts of both factors may have been masked during the heady days leading up to the AFC, this is no longer the case in the current competitive environment where residency options for both capital and skilled labor are much greater. Fixing the problem requires addressing the distortions of the NEP and curtailing the influence of the GLCs. Although there have been a few recent moves to dilute the NEP, some of these measures have already been reversed. Similarly, while there has been an active program of divestment from GLCs, there have also been GLC acquisitions in new sectors, making it more of a diversification than a divestment program. Malaysia’s investment malaise can be fixed, but not in this way.


“Unfortunately, the protection and privileges accorded by the New Economic Policy (NEP) may weaken the Malays further by lulling the next generation into complacency, thinking that the NEP’s affirmative action will always be there for them to fall back upon. I have spoken about this danger many times, likening the NEP to crutches which, when used too long, would result in atrophy of the muscles. The NEP can make the users so dependent that their inherent capability regresses.” Tun Mahathir Mohamad (2011) Former Prime Minister of Malaysia
I. INTRODUCTION
It was not long ago that the Malaysian development story was hailed as a model of foreign direct investment (FDI)-driven, export-led industrialization worthy of emulation by aspirants in the developing world. The transformation from a largely agrarian economy in the 1950s and 1960s to a manufacturing-based one was rapid and spectacular, with the share of agriculture in gross domestic product (GDP) falling from 30% in 1970 to 8% today, and that of industry increasing from 27% to 55% over the same period. Per capita income almost doubled each decade to reach more than $8,000 per year in 2012. These economic achievements are reflected in dramatic improvements in social conditions. Extreme poverty has almost been eliminated, despite persistently high inequality, and access to all kinds of social services has improved dramatically. FDI played a critical role in this transformation. Domestic investment was also robust at around 40% of GDP at the onset of the Asian financial crisis (AFC). Yet, although the slump in economic growth during the AFC was quickly reversed in the ensuing V-shaped recovery, private investment—both foreign and domestic—never really recovered.
These days, references to Malaysia in the development economics literature tend to
highlight it as a classic case of the “middle income trap.” No longer able to compete in the labor-intensive manufacturing activities that drove its transformation due to factor price adjustments, it also finds itself unable to move up the value chain to more sophisticated activities within manufacturing and services in order to graduate to developed country status. The revival of domestic and foreign private investment must play a key role in raising productivity levels in order to break out of the middle income trap. The need to revive private investment is recognized in all government strategic and planning documents, particularly the Tenth Malaysia Plan (TMP), and also the New Economic Model (NEM) and Economic Transformation Program (ETP).
The purpose of this paper is to critically examine the factors underlying the decline in
private domestic and foreign investment in Malaysia, with a view to identifying policy changes that could reverse this trend. The remainder of the paper is divided into five parts. In the next section, we examine trends in domestic investment, both private and public, in the pre- and post-AFC periods. Section III focuses on foreign investment, both in terms of inflows and outflows, also for the pre- and post-AFC periods. We then consider possible reasons underlying the performance of private investment, focusing on the period after the AFC in Section IV. Policy changes required to improve the investment climate is the subject of Section V. A final section concludes.

2 І ADB Economics Working Paper Series No. 312
II. DOMESTIC INVESTMENT (PRE- AND POST-AFC) In the 5 years leading up to the AFC (1993–1997), total investment (public and private) averaged a robust 41.3% of GDP (Figure 1), peaking at 43.6% in 1995. Investment rates were so high that there was even some concern that Malaysia had been over-investing (ADB 2012). There were a slew of megaprojects that underpinned the robust investment numbers. However, investment levels fell sharply to an annual average of 22.1% of GDP in the period following the AFC (1998–2011). The onset of the global financial crisis (GFC) pushed investment below 15% of GDP in 2009, the lowest level in recent history. Although preliminary estimates for 2011 suggest a recovery to the period average of about 22%, there has been a clear trend of decline from 2001 onward.
Figure 1: Malaysia Gross Capital Formation as % of GDP, 1993–2011
GDP = gross domestic product. Source: Bank Negara Malaysia Annual Report (various years) and Bank Negara Malaysia Q1 2012 Bulletin.
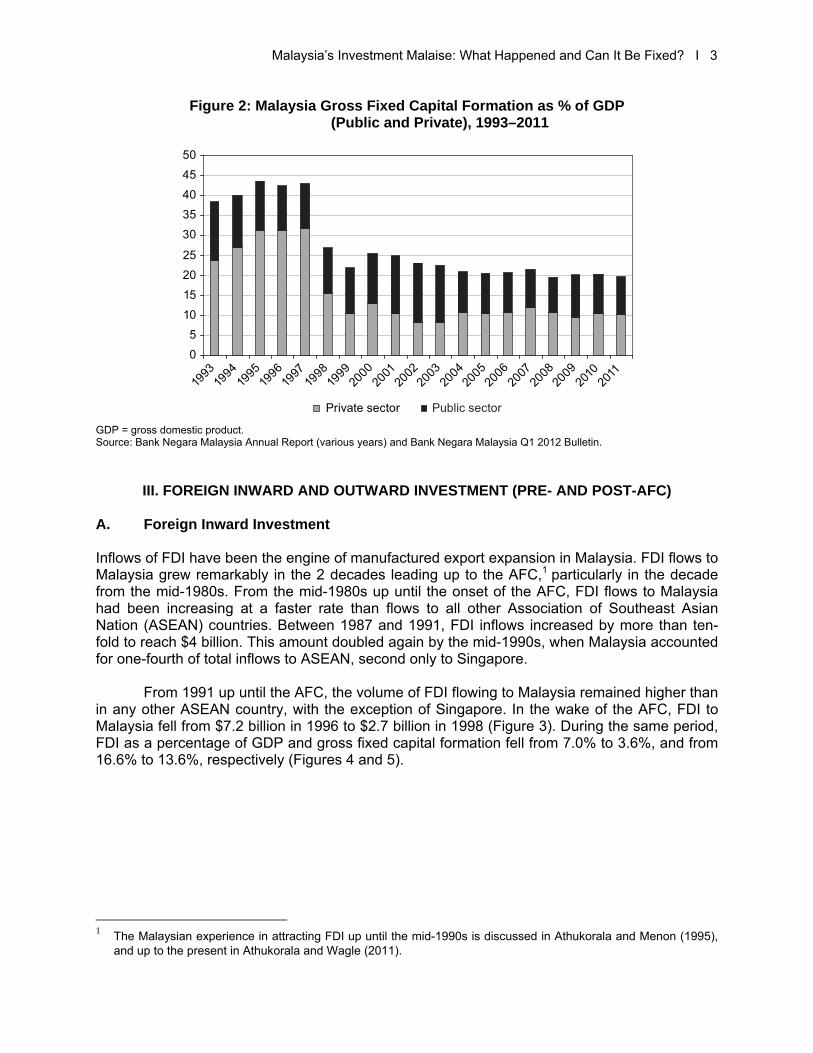
Even these dismal figures mask the much more disturbing decline in private investment. While private investment accounted for more than 70% of total investment in the boom years leading up to the AFC (1993–1997), its share had fallen to about half of this ratio (or less) in the years following the AFC. For 10 out of the 14 years since 1998, private investment has been about equal to or less than public investment. In 2002–2003, when private investment as a share of GDP slumped to about 8% (Figure 2). Its share was only about half that of public investment if not for the increase in public investment following the AFC, the overall investment picture in Malaysia would have been even more dismal. Unlike private investment, public investment as a share of GDP has remained relatively stable over the past 2 decades, averaging about 11.5%. Underlying this stable but robust share of public investment over the years has been the gradual encroachment of the public sector into activities that would usually be associated with private firms. This is an issue we will return to in Section IV, when we look at whether private investment may have been crowded out by public investment.
0.05.0
10.015.020.025.0
30.035.040.0
45.050.0
1993
1994
1995
1996
1997
1998
1999
2000
2001
2002
2003
2004
2005
2006
2007
2008
2009
2010
2011
Gross capital formation as a % of GDP
Malaysia’s Investment Malaise: What Happened and Can It Be Fixed? І 3
Figure 2: Malaysia Gross Fixed Capital Formation as % of GDP Figure 6:(Public and Private), 1993–2011
GDP = gross domestic product. Source: Bank Negara Malaysia Annual Report (various years) and Bank Negara Malaysia Q1 2012 Bulletin.
III. FOREIGN INWARD AND OUTWARD INVESTMENT (PRE- AND POST-AFC) A. Foreign Inward Investment
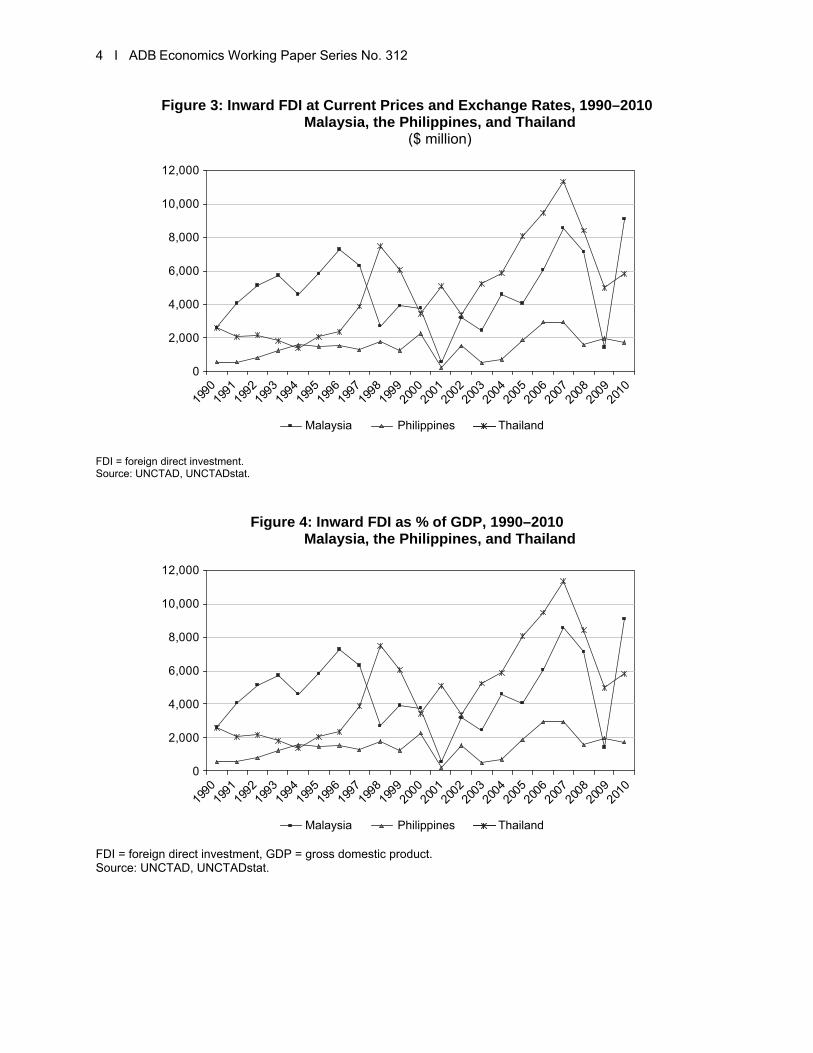
Inflows of FDI have been the engine of manufactured export expansion in Malaysia. FDI flows to Malaysia grew remarkably in the 2 decades leading up to the AFC,1 particularly in the decade from the mid-1980s. From the mid-1980s up until the onset of the AFC, FDI flows to Malaysia had been increasing at a faster rate than flows to all other Association of Southeast Asian Nation (ASEAN) countries. Between 1987 and 1991, FDI inflows increased by more than ten-fold to reach $4 billion. This amount doubled again by the mid-1990s, when Malaysia accounted for one-fourth of total inflows to ASEAN, second only to Singapore.
From 1991 up until the AFC, the volume of FDI flowing to Malaysia remained higher than
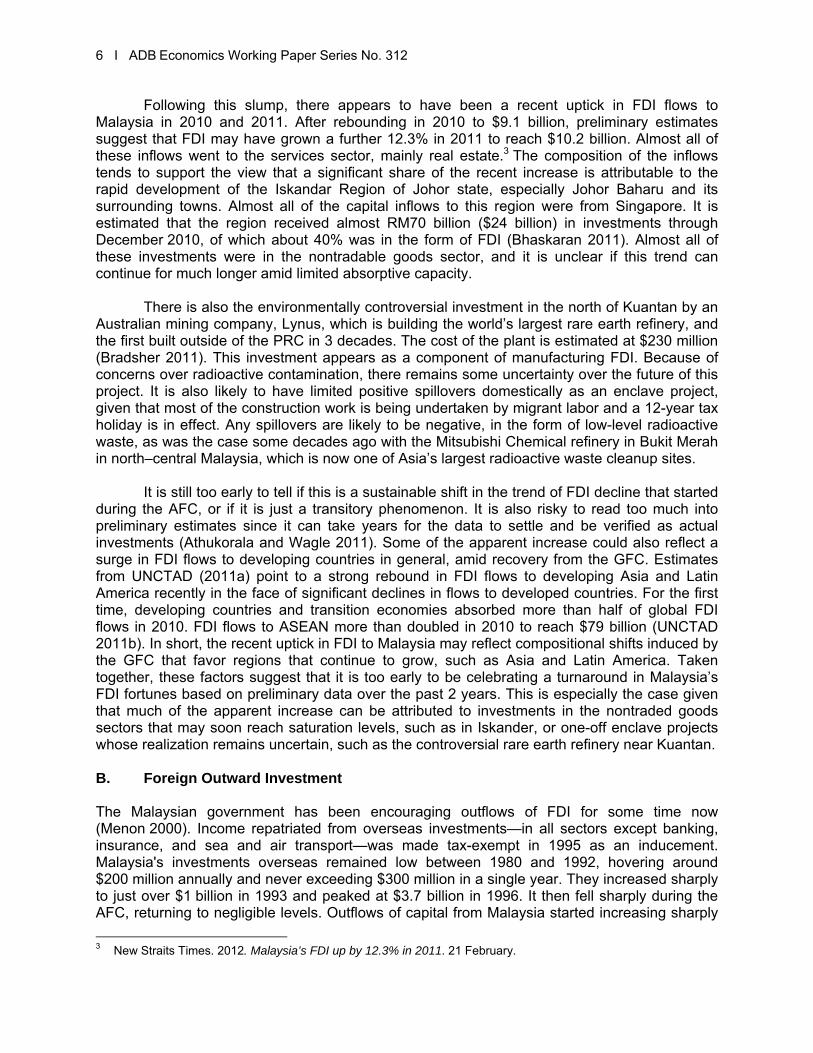
in any other ASEAN country, with the exception of Singapore. In the wake of the AFC, FDI to Malaysia fell from $7.2 billion in 1996 to $2.7 billion in 1998 (Figure 3). During the same period, FDI as a percentage of GDP and gross fixed capital formation fell from 7.0% to 3.6%, and from 16.6% to 13.6%, respectively (Figures 4 and 5).
1 The Malaysian experience in attracting FDI up until the mid-1990s is discussed in Athukorala and Menon (1995),
and up to the present in Athukorala and Wagle (2011).
05
10
1520
25
3035
40
45
50
1993
1994
1995
1996
1997
1998
1999
2000
2001
2002
2003
2004
2005
2006
2007
2008
2009
2010
2011
Private sector Public sector
4 І ADB Economics Working Paper Series No. 312
Figure 3: Inward FDI at Current Prices and Exchange Rates, 1990–2010 Figure 6: Malaysia, the Philippines, and Thailand
Figure 6: ($ million)
FDI = foreign direct investment. Source: UNCTAD, UNCTADstat.
Figure 4: Inward FDI as % of GDP, 1990–2010 Figure 6: Malaysia, the Philippines, and Thailand
FDI = foreign direct investment, GDP = gross domestic product. Source: UNCTAD, UNCTADstat.
0
2,000
4,000
6,000
8,000
10,000
12,000
1990
1991
1992
1993
1994
1995
1996
1997
1998
1999
2000
2001
2002
2003
2004
2005
2006
2007
2008
2009
2010
Malaysia Philippines Thailand
0
2,000
4,000
6,000
8,000
10,000
12,000
1990
1991
1992
1993
1994
1995
1996
1997
1998
1999
2000
2001
2002
2003
2004
2005
2006
2007
2008
2009
2010
Malaysia Philippines Thailand

Malaysia’s Investment Malaise: What Happened and Can It Be Fixed? І 5
Figure 5: Inward FDI as % of Gross Fixed Capital Formation, 1990–2009 Figure 6: Malaysia, the Philippines, and Thailand
(%)
FDI = foreign direct investment. Source: UNCTAD, UNCTADstat.
This sharp contraction in FDI was common among all of the original ASEAN members. The depleted FDI inflows that were triggered by the AFC continued well into the recovery and up until about 2001. In 2001, FDI flows to Malaysia fell to $554 million, the lowest level since 1987. The persistence of contracting FDI is attributable to the global slowdown in FDI flows, which declined by more than half from $134 billion in 2000 to $63 billion in 2003. Total inflows during the 4 years from 2001–2004 were 24% lower than the comparable figure for the preceding 4 years (1998–2000) (Athukorala and Wagle 2011).
But the experience in Malaysia was different. FDI did not recover like it did in the other
crisis-affected countries. After having been the second largest recipient of FDI in ASEAN after Singapore prior to the AFC, Malaysia was overtaken by Thailand in 2000, Indonesia and Viet Nam in 2008, and the Philippines in 2009. There was mild recovery in 2005–2007, when FDI inflows to Malaysia rose slightly above the amount flowing to Indonesia, although this period corresponded with some unusual sectoral shifts in the composition of the inflows. During this period, FDI flows to agriculture averaged $671 million annually, second only to the People’s Republic of China (PRC) in terms of volume. As a share of gross fixed capital formation, it was the highest among all ASEAN countries at 21.9%, beating even the predominantly agrarian, new member countries that have historically recorded high shares (UNCTAD 2009). In 2007, inflows to this sector were attributed mainly to the merger (and subsequent restructuring) of PPB Oil Palms with the Singapore-based Wilmar International. The total value of this merger and acquisition (M&A) was roughly $1.1 billion. In 2009, FDI flows slumped again to $1.4 billion, the least among the ASEAN-5 countries, and less than a third of the FDI flows to Indonesia or Thailand.2
2 ASEAN-5 comprises Indonesia, Malaysia, the Philippines, Thailand, and Viet Nam.
0
5
10
15
20
25
30
35
1990
1991
1992
1993
1994
1995
1996
1997
1998
1999
2000
2001
2002
2003
2004
2005
2006
2007
2008
2009
Malaysia Philippines Thailand
6 І ADB Economics Working Paper Series No. 312
Following this slump, there appears to have been a recent uptick in FDI flows to Malaysia in 2010 and 2011. After rebounding in 2010 to $9.1 billion, preliminary estimates suggest that FDI may have grown a further 12.3% in 2011 to reach $10.2 billion. Almost all of these inflows went to the services sector, mainly real estate.3 The composition of the inflows tends to support the view that a significant share of the recent increase is attributable to the rapid development of the Iskandar Region of Johor state, especially Johor Baharu and its surrounding towns. Almost all of the capital inflows to this region were from Singapore. It is estimated that the region received almost RM70 billion ($24 billion) in investments through December 2010, of which about 40% was in the form of FDI (Bhaskaran 2011). Almost all of these investments were in the nontradable goods sector, and it is unclear if this trend can continue for much longer amid limited absorptive capacity.
There is also the environmentally controversial investment in the north of Kuantan by an
Australian mining company, Lynus, which is building the world’s largest rare earth refinery, and the first built outside of the PRC in 3 decades. The cost of the plant is estimated at $230 million (Bradsher 2011). This investment appears as a component of manufacturing FDI. Because of concerns over radioactive contamination, there remains some uncertainty over the future of this project. It is also likely to have limited positive spillovers domestically as an enclave project, given that most of the construction work is being undertaken by migrant labor and a 12-year tax holiday is in effect. Any spillovers are likely to be negative, in the form of low-level radioactive waste, as was the case some decades ago with the Mitsubishi Chemical refinery in Bukit Merah in north–central Malaysia, which is now one of Asia’s largest radioactive waste cleanup sites.
It is still too early to tell if this is a sustainable shift in the trend of FDI decline that started
during the AFC, or if it is just a transitory phenomenon. It is also risky to read too much into preliminary estimates since it can take years for the data to settle and be verified as actual investments (Athukorala and Wagle 2011). Some of the apparent increase could also reflect a surge in FDI flows to developing countries in general, amid recovery from the GFC. Estimates from UNCTAD (2011a) point to a strong rebound in FDI flows to developing Asia and Latin America recently in the face of significant declines in flows to developed countries. For the first time, developing countries and transition economies absorbed more than half of global FDI flows in 2010. FDI flows to ASEAN more than doubled in 2010 to reach $79 billion (UNCTAD 2011b). In short, the recent uptick in FDI to Malaysia may reflect compositional shifts induced by the GFC that favor regions that continue to grow, such as Asia and Latin America. Taken together, these factors suggest that it is too early to be celebrating a turnaround in Malaysia’s FDI fortunes based on preliminary data over the past 2 years. This is especially the case given that much of the apparent increase can be attributed to investments in the nontraded goods sectors that may soon reach saturation levels, such as in Iskander, or one-off enclave projects whose realization remains uncertain, such as the controversial rare earth refinery near Kuantan. B. Foreign Outward Investment The Malaysian government has been encouraging outflows of FDI for some time now (Menon 2000). Income repatriated from overseas investments—in all sectors except banking, insurance, and sea and air transport—was made tax-exempt in 1995 as an inducement. Malaysia's investments overseas remained low between 1980 and 1992, hovering around $200 million annually and never exceeding $300 million in a single year. They increased sharply to just over $1 billion in 1993 and peaked at $3.7 billion in 1996. It then fell sharply during the AFC, returning to negligible levels. Outflows of capital from Malaysia started increasing sharply
3 New Straits Times. 2012. Malaysia’s FDI up by 12.3% in 2011. 21 February.

Malaysia’s Investment Malaise: What Happened and Can It Be Fixed? І 7 after the AFC, and have grown to the point where Malaysia has been a net exporter of capital since 2005 (Figure 6). During 2006–2009, total outflows reached $40.4 billion, almost double the inflows of $23.2 billion over the same period. With the gap between inflows and outflows increasing over time, total outflows peaked at almost $15 billion in 2008. Preliminary estimates from UNCTAD (2012) suggest that outflows have started rising sharply again after the GFC, amounting to $13.3 billion and $14.8 billion in 2010 and 2011, respectively. Malaysia is also the only net exporter of capital among the ASEAN countries.
Figure 6: Outward FDI at Current Prices and Exchange Rates, 1990–2010 Figure 6: Malaysia, the Philippines, and Thailand
($ million)
FDI = foreign direct investment. Source: UNCTAD, UNCTADstat.
A significant portion of the outflows appear to be taking place in the services sector,
which are dominated by oil and gas, as well as in mining and banking. Earlier, we noted how there has been an unexpected surge in FDI into the agriculture sector in Malaysia in recent years, yet the outflows of capital destined for agriculture are substantially larger, especially with respect to plantations. Furthermore, Petronas has been investing heavily in offshore oil and gas operations in a wide range of countries in several continents, including Australia, Algeria, Cameroon, Chad, Iraq, and Mauritius, as well as closer to home in Indonesia, Myanmar, and Viet Nam. Sime Darby is the largest agriculture multinational corporation in the world. Two other Malaysian government-linked corporations (GLCs) are among the world’s 10 largest in this sector: Kuala Lumpur Kepong and Kulim (UNCTAD 2009).4 There have been increasing levels of outward FDI in the oil palm sector, mostly going to Indonesia due to lower land and labor
4 GLCs are defined as companies that have a primary commercial objective and in which the Government of
Malaysia has a direct controlling stake through Khazanah (the main sovereign wealth fund), the Ministry of Finance, Kumpulan Wang Amanah Pencen (National Pension Fund), or Bank Negara Malaysia (BNM). Some GLCs are also controlled by other federal government-linked agencies such as Permodalan Nasional Berhad, the Employees Provident Fund, and Tabung Haji. Apart from a percentage of ownership, a controlling stake also refers to the government’s ability to appoint board members and senior management, and make major decisions (e.g., contract awards, strategy, restructuring and financing, acquisitions, and divestments) for GLCs either directly or through government-linked investment companies.
–2,000
0
2,000
4,000
6,000
8,000
10,000
12,000
14,000
16,000
$ m
illion
1990
1991
1992
1993
1994
1995
1996
1997
1998
1999
2000
2001
2002
2003
2004
2005
2006
2007
2008
2009
2010
Malaysia Philippines Thailand
8 І ADB Economics Working Paper Series No. 312 costs. In a move to diversify horizontally, Sime Darby also purchased rubber plantations in Liberia at a total value of $800 million in 2009 (UNCTAD 2009). Meanwhile, the MSC Group has investments in mining in Australia, Canada, Indonesia, and the Philippines (UNCTAD 2011b). Singapore appears to be a large recipient covering a wide range of sectors.5 A lot of these outward investments in almost all sectors are associated, predictably, with M&A activity.
Outflows of capital are not necessarily a bad thing. On the contrary, they can contribute
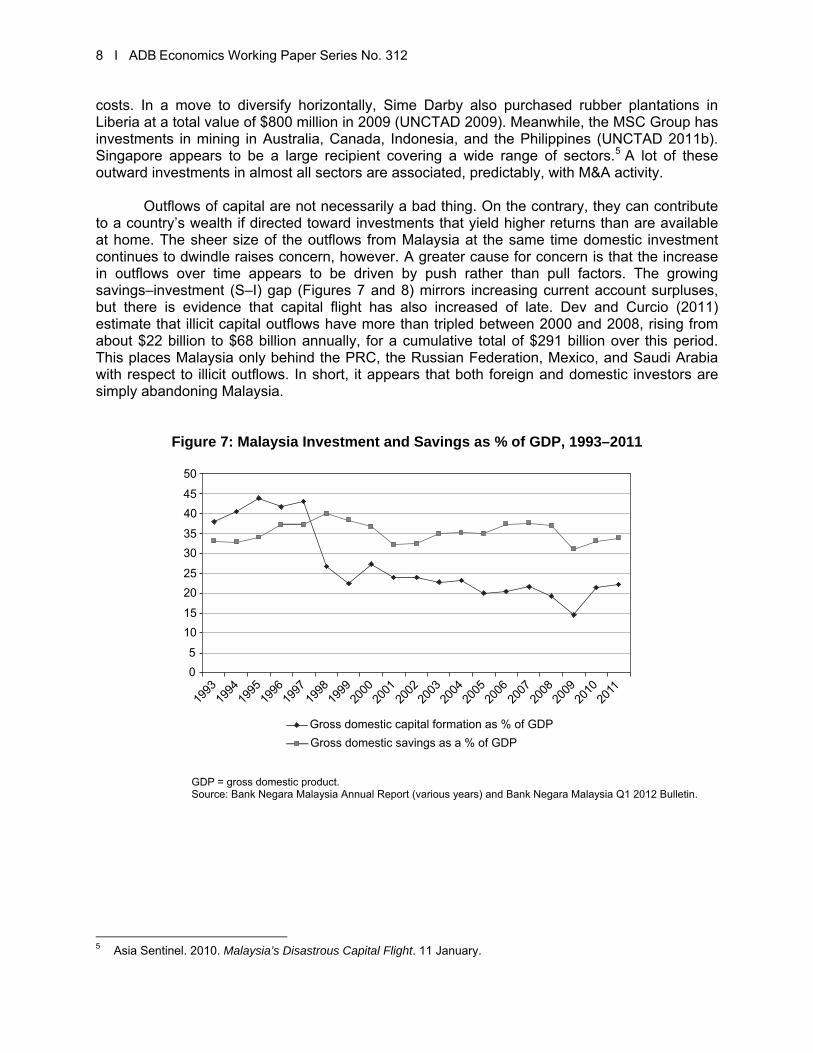
to a country’s wealth if directed toward investments that yield higher returns than are available at home. The sheer size of the outflows from Malaysia at the same time domestic investment continues to dwindle raises concern, however. A greater cause for concern is that the increase in outflows over time appears to be driven by push rather than pull factors. The growing savings–investment (S–I) gap (Figures 7 and 8) mirrors increasing current account surpluses, but there is evidence that capital flight has also increased of late. Dev and Curcio (2011) estimate that illicit capital outflows have more than tripled between 2000 and 2008, rising from about $22 billion to $68 billion annually, for a cumulative total of $291 billion over this period. This places Malaysia only behind the PRC, the Russian Federation, Mexico, and Saudi Arabia with respect to illicit outflows. In short, it appears that both foreign and domestic investors are simply abandoning Malaysia.
Figure 7: Malaysia Investment and Savings as % of GDP, 1993–2011
GDP = gross domestic product. Source: Bank Negara Malaysia Annual Report (various years) and Bank Negara Malaysia Q1 2012 Bulletin.
5 Asia Sentinel. 2010. Malaysia’s Disastrous Capital Flight. 11 January.
05
1015
2025
3035
4045
50
1993
1994
1995
1996
1997
1998
1999
2000
2001
2002
2003
2004
2005
2006
2007
2008
2009
2010
2011
Gross domestic capital formation as % of GDPGross domestic savings as a % of GDP

Malaysia’s Investment Malaise: What Happened and Can It Be Fixed? І 9
Figure 8: Malaysia Savings–Investment Gap (Public and Private), 1993–2010
Note: 2010 data are preliminary; 2011 data unavailable. Source: Bank Negara Malaysia Annual Report (various years).
IV. THE FALL IN PRIVATE INVESTMENT: LIKELY CAUSES A number of reasons have been put forward to explain the dismal performance of private
investment in Malaysia in the post-AFC era. Some explanations have more validity than others. Many potential explanatory factors existed prior to the AFC and so the challenge is to explain why they should matter now if they had not previously. In what follows, we review some of the key explanations put forward, assessing their relative merits in accounting for the decline in investment before deciding on what we consider to be the main causes.
During the initial phase of the slowdown in private investment in the immediate aftermath
of the AFC, a popular explanation involved the unintended consequences of the capital controls introduced during the AFC—unintended in that they were designed to curb short-term flows, not FDI—and the negative perceptions that they generated. This explanation continued to gather support even as the gradual easing of these controls failed to stem the decline in FDI. But as time went on and FDI continued to fall, it became clear that this explanation could no longer hold water, if it ever did.
Another explanation blames the historic high reliance on FDI itself for its subsequent
drop-off. This over reliance on FDI is seen as having precluded the emergence—or stunted the growth—of domestic firms and innovation.6 Proponents of this view often draw the contrasting comparison with the Republic of Korea where, apparently, domestic firms grew because they were not crowded out by foreign ones. But Malaysia has some prominent domestic companies, although most of them can hardly be described as private. Many are either publicly controlled or are GLCs. In this sense, they bear some resemblance to the chaebols in the Republic of Korea, but they are generally considered to be less efficient, lacking the same entrepreneurial drive, more politically constrained because public ownership can be quite high, and less outward-
6 This view also ignores the possibility that activities of multinational corporations could generate knowledge
externalities and other spillovers that increase productivity by facilitating the transfer of more efficient technology and management practices from foreign to domestic firms (Menon 1998a).
–60,000
–40,000
–20,000
0
20,000
40,000
60,000
80,000
100,000
120,000
140,000
19931994
19951996
19971998
19992000
20012002
20032004
20052006
20072008
20092010
Public deficit/surplus Private deficit/surplus

10 І ADB Economics Working Paper Series No. 312 oriented. The government estimates that GLCs employ around 5% of the national workforce and account for approximately 36% and 54%, respectively, of the market capitalization of Bursa Malaysia and the benchmark Kuala Lumpur Composite Index. They can wield significant market power, and therefore can be a deterrent to the entry of private firms.
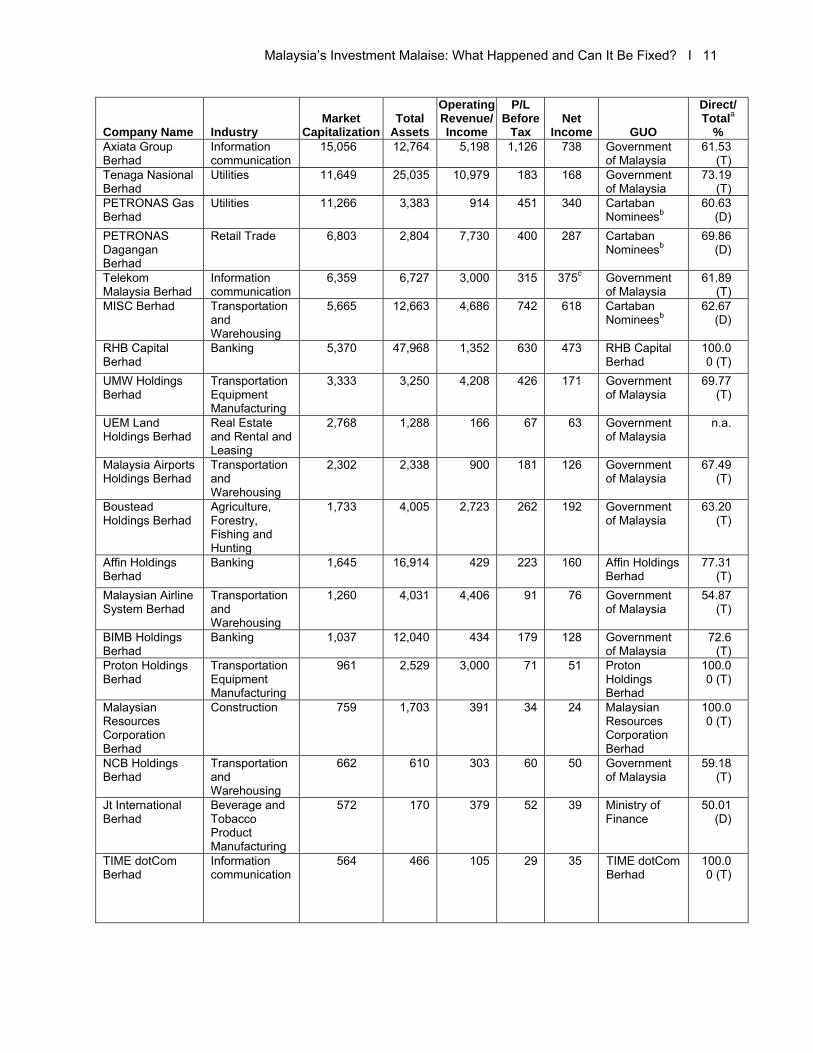
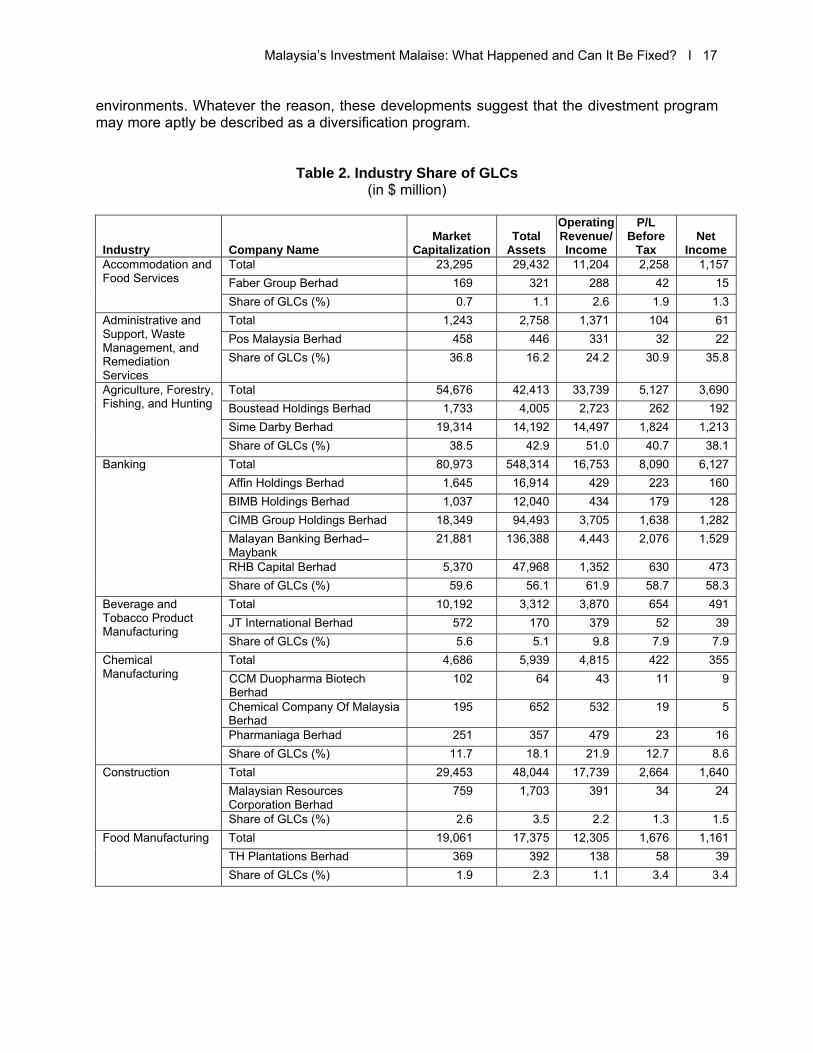
Tables 1 and 2 contain data that attempt to capture the influence of GLCs. Table 1 lists
the GLCs included in the government’s Transformation Program together with other GLCs where government is the ultimate owner or controlling shareholder, either directly or through its funds. Data relating to market capitalization, total assets, operating revenue, net income, the global ultimate owner (GUO), as well as the GUO direct ownership share is reported. Table 2 aggregates the GLCs into industries, and reports data similar to that provided in Table 1 as shares held by GLCs. These data were derived from the Oriana and Bankscope databases, which provide the most comprehensive financial information on public and private financial companies in Asia. They have been assembled after careful review of numerous records and entries, and aggregated into broad industry groups. Both databases combine data from many sources and allow users to search companies based on criteria such as their location, status, and industry classification. Oriana and Bankscope also contain detailed ownership and shareholder information, including information on a company’s ultimate owner and controlling shareholder. All types of ownership are covered, including ownership by government entities or funds.
From Tables 1 and 2, it is clear that the influence of GLCs, however measured, is both
widespread and pervasive. Many of the GLCs in Table 1 are household names in Malaysia, and some are quite well known internationally, attesting to both their sheer size and influence. Table 2 confirms the dominating role of GLCs in all sectors except for some food-related, mineral and services industries. Using the industry share of operating revenue or income as a proxy for market share, we find that the dominance of GLCs is highest in utilities (93%) and transportation and warehousing (80%), while it is greater than 50% in agriculture; banking; information communications; and retail trade. Most of these industries are neither natural monopolies nor strategic, and therefore the heavy presence of GLCs cannot be economically justified. In the aggregate, the GLC share is approximately one-third, irrespective of the measure of firm presence employed. This is highly unusual for a country representing itself as a open, modern, market economy.
Table 1. Overview of Malaysian GLCs
Table 1. (in $ million)
Company Name Industry Market
CapitalizationTotal
Assets
Operating Revenue/Income
P/L Before
Tax Net
Income GUO
Direct/Totala
% Malayan Banking Berhad–Maybank
Banking 21,881 136,388 4,443 2,076 1,529
Government of Malaysia
63.19 (T)
Sime Darby Berhad
Agriculture, Forestry, Fishing and Hunting
19,314 14,192 14,497 1,824 1,213
Government of Malaysia
59.31 (T)
CIMB Group Holdings Berhad
Banking 18,349 94,493 3,705 1,638 1,282
Cimb Group Holdings Berhad
100.00 (T)
PETRONAS Chemicals Group Berhad
Transportation and Warehousing
16,739 8,951 3,770 1,227 825 PETRONAS Chemicals Group Berhad
100.00
Malaysia’s Investment Malaise: What Happened and Can It Be Fixed? І 11
Company Name Industry Market
CapitalizationTotal
Assets
Operating Revenue/Income
P/L Before
Tax Net
Income GUO
Direct/Totala
% Axiata Group Berhad
Information communication
15,056 12,764 5,198 1,126 738 Government of Malaysia
61.53 (T)
Tenaga Nasional Berhad
Utilities 11,649 25,035 10,979 183 168 Government of Malaysia
73.19 (T)
PETRONAS Gas Berhad
Utilities 11,266 3,383 914 451 340 Cartaban Nomineesb
60.63 (D)
PETRONAS Dagangan Berhad
Retail Trade 6,803 2,804 7,730 400 287 Cartaban Nomineesb
69.86 (D)
Telekom Malaysia Berhad
Information communication
6,359 6,727 3,000 315 375c Government of Malaysia
61.89 (T)
MISC Berhad Transportation and Warehousing
5,665 12,663 4,686 742 618 Cartaban Nomineesb
62.67 (D)
RHB Capital Berhad
Banking 5,370 47,968 1,352 630 473 RHB Capital Berhad
100.00 (T)
UMW Holdings Berhad
Transportation Equipment Manufacturing
3,333 3,250 4,208 426 171 Government of Malaysia
69.77 (T)
UEM Land Holdings Berhad
Real Estate and Rental and Leasing
2,768 1,288 166 67 63 Government of Malaysia
n.a.
Malaysia Airports Holdings Berhad
Transportation and Warehousing
2,302 2,338 900 181 126 Government of Malaysia
67.49 (T)
Boustead Holdings Berhad
Agriculture, Forestry, Fishing and Hunting
1,733 4,005 2,723 262 192 Government of Malaysia
63.20 (T)
Affin Holdings Berhad
Banking 1,645 16,914 429 223 160 Affin Holdings Berhad
77.31 (T)
Malaysian Airline System Berhad
Transportation and Warehousing
1,260 4,031 4,406 91 76 Government of Malaysia
54.87 (T)
BIMB Holdings Berhad
Banking 1,037 12,040 434 179 128 Government of Malaysia
72.6 (T)
Proton Holdings Berhad
Transportation Equipment Manufacturing
961 2,529 3,000 71 51 Proton Holdings Berhad
100.00 (T)
Malaysian Resources Corporation Berhad
Construction 759 1,703 391 34 24 Malaysian Resources Corporation Berhad
100.00 (T)
NCB Holdings Berhad
Transportation and Warehousing
662 610 303 60 50 Government of Malaysia
59.18 (T)
Jt International Berhad
Beverage and Tobacco Product Manufacturing
572 170 379 52 39 Ministry of Finance
50.01 (D)
TIME dotCom Berhad
Information communication
564 466 105 29 35 TIME dotCom Berhad
100.00 (T)

12 І ADB Economics Working Paper Series No. 312
Company Name Industry Market
CapitalizationTotal
Assets
Operating Revenue/Income
P/L Before
Tax Net
Income GUO
Direct/Totala
% Pos Malaysia Berhad
Administrative and Support, Waste Management and Remediation Services
458 446 331 32 22 Pos Malaysia Berhad
100.00 (T)
TH Plantations Berhad
Food Manufacturing
369 392 138 58 39 Government of Malaysia
67.62 (T)
Pharmaniaga Berhad
Chemical Manufacturing
251 357 479 23 16 Government of Malaysia
n.a.
Boustead Heavy Industries Corporation Berhad
Management of Companies and Enterprises
230 365 172 1 4 Government of Malaysia
n.a.
Chemical Company Of Malaysia Berhad
Chemical Manufacturing
195 652 532 19 5 Permodalan Nasional Berhad
69.28 (D)
United Malayan Land Berhad
Real Estate and Rental and Leasing
194 382 109 24 17 Government of Malaysia
n.a.
Faber Group Berhad
Accommodation and Food Services
169 321 288 42 15 Faber Group Berhad
100.00 (T)
CCM Duopharma Biotech Berhad
Chemical Manufacturing
102 64 43 11 9 Permodalan Nasional Berhad
n.a.
UAC Berhad Nonmetallic Mineral Product Manufacturing
100 112 60 5 3 Government of Malaysia
n.a.
Time Engineering Berhad
Information communication
81 58 50 30 28 Time Engineering Berhad
100.00 (T)
Theta Edge Berhad
Professional, Scientific, and Technical Services
15 27 28 0 –1 Lembaga Tabung Haji
63.76 (D)
D = Direct Ownership, GLC = government linked corporation, GUO = Global Ultimate Owner (ownership of at least 50.01%), n.a. = not available, P/L = profit/loss, T = Total Ownership. aCartaban nominees. bTempatan Sdn Berhad Petroliam Nasional Berhad Strategic Inv. cNet income is higher than P/L before tax due to a "negative tax". Sources: Oriana database, database updated 31/05/2012, and Bankscope database, database updated 13/06/2012.
The NEM (2010, p. 45) is forthright in admitting that “(i)n some industries, heavy
government and GLC presence has discouraged private investment.” Although GLCs tend to be associated with resource-based, agriculture and services sectors, perhaps because their concentrations in these sectors are particularly high, there is hardly a sector from which they are absent.
While we can hardly blame a lack of FDI for all of Malaysia’s current ailments, we also
cannot look to FDI alone for salvation either. It would appear that the factors affecting FDI and its slowdown may not be that different from those curtailing domestic private investment. It is

Malaysia’s Investment Malaise: What Happened and Can It Be Fixed? І 13 also more likely that it is domestic GLCs that may be deterring private investment and the entry of new private firms, rather than foreign ones. Furthermore, the pervasiveness of GLCs across almost all sectors, and their ability to exercise not only significant market power but to use their special access to government and regulatory agencies to their favor, suggests that they may present a formidable barrier to both competition and the entry of new private firms. A further disincentive for private firms is illustrated by the links between the NEP and the GLCs in the conduct of business. At present, only firms that meet bumiputera (literally “sons of the soil”) equity quotas are allowed to bid for government or GLC procurement contracts. Apart from deterring genuine private sector investment, this system also fails when it comes to meeting its redistributive objectives. This is acknowledged by former Prime Minister Mahathir in his recently released memoirs: “(t)he bumiputera were also selling contracts, licenses, and permits immediately after they were allocated” (2011, p. 468).
Yet another explanation puts the blame on the influx of low-skilled foreign workers,
apparently reducing the incentive of multinational corporations to upgrade into higher value-added activities. Although most of the migrant labor is employed in the agriculture and construction sectors, it is sometimes claimed that there is a sufficient inflow of migrant labor into the manufacturing sector to depress domestic wages and hold back the shift from labor-intensive to human capital- and technology-intensive manufacturing activities. Although it is likely that the influx of migrant labor would have affected structural adjustments through factor price changes that influence capital–labor ratios, the extent to which it affected the movement up the value chain is unclear. The absence of such upgrading within manufacturing may have as much to do with the continuing shortage of skilled local labor as it does with the increase in the supply of low-skilled migrant labor. Therefore, the solution to upgrading manufacturing may lie with improving the skill levels of domestic labor rather than simply restricting low-skilled migrant labor.7 While Malaysia is a net importer of labor, it is a net exporter of skills.
While the migrant labor explanation may not be totally persuasive, it does raise a
number of related questions that warrant consideration. For example, what is preventing greater domestic skills enhancement and the development of human capital? And, why is Malaysia a net exporter of skilled labor? We examine each of these two questions in turn below.
It would appear that a greater investment in education and training is required to address
the human capital deficit. But the deficit of skills in Malaysia is not due to any lack of spending; public and private universities and colleges have proliferated throughout Malaysia, and a number of foreign educational institutions have also established campuses in Malaysia. The problem lies with quality, on the one hand, and access on the other. The adage that quantity has its own quality is particularly fitting here. Not only has the rapid growth in the number of education and training institutions occurred at the expense of quality, there is also a mismatch between the skills generated in local vocational and higher education institutions, and labor market requirements.8 NEAC (2010, p. 6) notes that while “(t)he human capital situation in
7 There are also positive elements of labor migration that this critique ignores. As noted earlier, an important
implication of the significant inflow of foreign workers has been its effect in mitigating growth in real wages. The concentration of migrant workers in construction and other services has limited the increase in nontraded goods prices. Without migrant labor, the appreciation of the real exchange rate required to facilitate the transfer of labor from the traded to the nontraded sector and meet infrastructure development needs would have had to have been much higher (Athukorala and Menon 1999).
8 Concerns over the quality of education are not limited to post-secondary education, although this is where the deterioration has been most marked. The quality of education at primary and secondary levels has also dropped sharply (Lee and Nagaraj 2012). Addressing the skills shortage will need to look beyond post-secondary education and address underlying problems that begin much earlier in the school life of students.
14 І ADB Economics Working Paper Series No. 312 Malaysia is reaching a critical stage… the education system is not producing the skills demanded by firms.” This is evidenced by the fact that the highest level of unemployment in Malaysia is among graduates, accounting for about a quarter of the unemployed (Khaled 2009). In October 2009, for instance, there were 81,046 active graduate registrants (on the Labour Exchange) looking for work and another 70,747 active registrants who were diploma holders and also unemployed. Of these, about 90% were reported to be bumiputeras, despite about 80% of appointments in the civil service going to bumiputeras through ethnic quotas (Lee and Nagaraj 2012).
This leads us naturally to the issue of access. Race-based quotas that discriminate in
favor of bumiputeras at entry level ensure that access is no longer merit-based. As Woo (2011) puts it, the “education system is still more (of) a sociopolitical instrument than an economic instrument even though (the) nation-building goal has been achieved.” As a result, many (more) qualified candidates are denied access to post-secondary education purely on the basis of race. Or, to turn the argument around, a number of otherwise unqualified or ineligible applicants will gain entry to a post-secondary institution purely on the basis of race. In short, a lower quality of education quality is being provided to less qualified students than would otherwise be the case. It is therefore no surprise that domestic skills enhancement and human capital development have been curbed. This unholy union of mediocrity also accounts for both the high level of unemployment among graduates as well as their racial composition.
Next we turn to the second question: why is Malaysia a net exporter of skilled labor?
There are both push and pull factors at play. Although the two are related and observed outcomes are the result of a summation of the two, there is more that can be done domestically to affect the push rather than the pull. Starting with the pull, there are more countries today that are receptive to migrants than ever before. Industrialized countries such as Australia, Canada, Singapore, and the United States are favored destinations of professionals and other skilled workers from Malaysia and elsewhere. It is useful to illustrate the push factors by returning to the education system and its flaws. With access restricted and quality declining, an increasing number of non-bumiputera students with the financial wherewithal have been pursuing post-secondary qualifications in the aforementioned countries and the United Kingdom. Many never return. Those who do return quickly find that the restrictions that forced them offshore will continue to affect them, either in gaining employment or in career progression.
Quotas and any other types of selective quantitative restrictions are the most
distortionary instruments of protection and they apply not only at entry level to post-secondary education, but continue into the boardroom and can extend all the way to the factory floor, affecting almost every aspect of economic and social life. These and numerous other distortions that are either directly or indirectly attributable to the workings of the NEP or its reincarnates lie at the very heart of the problem.
Even though the architect of the affirmative action program was former Prime Minister
(PM) Tun Abdul Razak, most of its implementation occurred during the long reign of its main proponent, former PM Mahathir Mohamad. In his recently published memoirs, Mahathir (2011, p. 39) is now able to admit that the program “…created a disabling culture of entitlement,” and that “many more have been weakened by the privileges that come with positive discrimination”. He goes on to lament the failure of the many other discriminatory schemes, starting with the preferential allocation of public share offerings: “almost immediately after the bumiputera were allocated shares, they sold them,” and that “this sale of shares for upfront profits frustrated efforts to increase bumiputera ownership of corporate wealth. In fact, this practice increased the disparities in wealth ownership between the bumiputera and non-bumiputera” (p. 467–468).

Malaysia’s Investment Malaise: What Happened and Can It Be Fixed? І 15 Finally, there is acknowledgement of the well-known fact that almost all affirmative action programs tend to benefit the least worthy within the target group: “ … too much of the NEP’s benefits would accrue to too small a group of bumiputera investors. Most poor Malays would remain strangers to the benefits… ” (p. 471).
Mahathir (2011, p. 39) also sees a bleak future for bumiputeras because of what the
NEP has done to incentives, and the culture of dependency and entitlement that it has inculcated: “I fear for our coming generations. I worry that the children of those who have made it good will take the policy for granted and never learn to be intellectually and economically self-reliant.” But the future will be bleak not just for bumiputeras but for all Malaysians, unless the NEP and its distortions are relaxed, and the dominant role of GLCs curtailed. There is no more important policy change required to restore confidence and revive investment than addressing these two interrelated constraints. There is no doubt that there is an increased level of policy unpredictability and political uncertainty in Malaysia today. These factors are deterring foreign investors when once certainty and stability in these areas were hailed as major attractions. But these factors take on a further potency when piled on top of a distorted policy environment. Reducing these uncertainties alone is unlikely to restore the confidence of investors. The underlying system of distortions needs to be overhauled. While both the NEP and GLCs were present long before the AFC, their impacts may have been masked during the heady days of high economic growth leading up to the AFC. Many constraints appear invisible until economic conditions worsen, when they can resurface as binding constraints. The current global environment is also quite different post-AFC, where competition for FDI in the region has been heightened by the growing presence of the PRC and Viet Nam, for instance, and where migration options and the mobility of skilled labor are much greater.
V. POLICY CHANGES TO RETAIN AND REVIVE PRIVATE INVESTMENT There is widespread recognition in Malaysia of the challenges required to sustain growth, let alone to break out of the middle income trap by 2020. There is also increasing recognition that many of the country’s problems, including the slump in private investment, are rooted in the distortions resulting from the design and implementation of the NEP and its reincarnates. As noted earlier, this has even been acknowledged by the NEP’s greatest proponent in his recently released memoirs (Mahathir 2011). Since NEP targets were based on stock rather than flow measures, namely a redistribution of wealth rather than income, many GLCs were created in order to pursue this objective. Over the years, the number and influence of the GLCs have grown to such a point where they now dominate many sectors of the economy, creating an uneven playing field that deters the entry of new firms. Leveling the playing field by reducing the market dominance of these GLCs must go hand-in-hand with neutralizing the other distortions of the NEP if private investment is to return to levels projected in the TMP to sustain robust growth in the future.
Shortly after assuming office in April 2009, PM Najib Razak began introducing reforms in
an attempt to improve Malaysia’s competitiveness and investment climate. One of his earliest moves was to open up the financial services industry and some other sectors to foreign investment. In July 2009, the PM established the National Economic Advisory Committee (NAEC) and tasked it with designing a New Economic Model (NEM).
The NEAC produced two reports on the NEM. The first report, released in April 2010,
presents an overall framework for transforming Malaysia from a middle income economy into an advanced one by 2020. It provides a diagnosis of the challenges and opportunities facing the

16 І ADB Economics Working Paper Series No. 312 Malaysian economy, and recommends eight strategic reform initiatives (SRIs). The second report, released in December 2010, presents the specific policy measures supporting these eight SRIs.
The overall objectives, policy framework, and specific strategies of the NEM were
integrated into the Economic Transformation Program (ETP) and the TMP. The main macroeconomic objectives are to sustain 6% average annual GDP growth on the back of stronger domestic demand, increased private investment, and improved productivity. Gross national income (GNI) per capita is targeted to increase from $8,000 in 2012 to around $17,700 in 2020. Private sector participation is underscored as a main driver of growth.
Achieving the 6% annual GDP growth target will require private investment to grow by
more than 12% annually over the next 5 years, a significant and almost unimaginable increase from the 2% annual growth achieved in the Ninth Malaysia Plan. Private investment’s contribution to GDP is targeted to reach almost 20% by 2020, compared with about 10% in 2010. This would be yet another tremendous achievement. With private investment supposed to take center stage, the government’s role will be limited to improving the enabling environment through policy and regulatory changes, investing in areas such as education and infrastructure, and attracting investors through marketing campaigns and fiscal incentives.
The ETP estimates that around 92% of the country’s projected investment requirements
will need to come from the private sector. These investments will focus on the ETP’s 12 national key economic areas (NKEAs) identified as the engines of future growth: (i) oil, gas, and energy; (ii) palm oil; (iii) financial services; (iv) tourism; (v) business services; (vi) electronics and electrical; (vii) wholesale and retail; (viii) education; (ix) healthcare; (x) communications content and infrastructure; (xi) agriculture; and (xii) greater Kuala Lumpur and Klang Valley. Thus far, 113 projects with a total value of RM177 billion have been announced under the ETP, focused largely on infrastructure, commodity-related investments, and construction. RM10 billion of investment was realized through October 2011, or 64% of all investments committed for 2011 (IMF 2012). The reforms embedded in the NEM, ETP, and TMP appear, on the surface at least, to signal a departure from the previous government’s priorities and approach to development (Table 2). Nevertheless, many of the 12 NKEAs are currently dominated by GLCs. It remains to be seen how much of the investment projects will be truly private rather than government-linked.
The government has had a GLC transformation program in place since 2004. Under the
program, the government completed 36 major divestment transactions between 2004 and December 2010, with total proceeds of RM24 billion, generating some RM11.6 billion of gains upon divestment. In 2011, the government announced that it had identified 33 companies under six GLCs as ready for divestment. Under the plan to rationalize the portfolio of GLCs, the government announced that it would reduce its stake in five of the identified companies, list seven of them, and sell the remaining 21 companies. Of the 33 GLCs, 24 are expected to be divested by 2012. With all of these completed and planned divestments, the question has to be asked: why has Malaysia continued to struggle with ballooning budget deficits? While it is true that the direct cost of funding NEP-related programs is high, it also appears that the GLCs are still investing in new sectors during the divestment program. There has been a spate of acquisitions of late by GLCs in the areas of private sector finance and property development, for instance. Examples include Sime Darby’s 30% stake in Penang-based Easter & Oriental, and UEM Land’s acquisition of Sunrise to create the largest property development company by market capitalization. Jacobs (2011) highlights many more examples. Another view suggests that GLCs are coming in as a buyer of last resort and trying to prop up confidence as private businesses offload their Malaysian investments and look offshore to more conducive investment
Malaysia’s Investment Malaise: What Happened and Can It Be Fixed? І 17 environments. Whatever the reason, these developments suggest that the divestment program may more aptly be described as a diversification program.
Table 2. Industry Share of GLCs (in $ million)
Industry
Company Name
Market Capitalization
Total Assets
Operating Revenue/ Income
P/L Before
Tax Net
Income Accommodation and Food Services
Total 23,295 29,432 11,204 2,258 1,157
Faber Group Berhad 169 321 288 42 15
Share of GLCs (%) 0.7 1.1 2.6 1.9 1.3
Administrative and Support, Waste Management, and Remediation Services
Total 1,243 2,758 1,371 104 61
Pos Malaysia Berhad 458 446 331 32 22
Share of GLCs (%) 36.8 16.2 24.2 30.9 35.8
Agriculture, Forestry, Fishing, and Hunting
Total 54,676 42,413 33,739 5,127 3,690
Boustead Holdings Berhad 1,733 4,005 2,723 262 192
Sime Darby Berhad 19,314 14,192 14,497 1,824 1,213
Share of GLCs (%) 38.5 42.9 51.0 40.7 38.1
Banking Total 80,973 548,314 16,753 8,090 6,127
Affin Holdings Berhad 1,645 16,914 429 223 160
BIMB Holdings Berhad 1,037 12,040 434 179 128
CIMB Group Holdings Berhad 18,349 94,493 3,705 1,638 1,282
Malayan Banking Berhad–Maybank
21,881 136,388 4,443 2,076 1,529
RHB Capital Berhad 5,370 47,968 1,352 630 473
Share of GLCs (%) 59.6 56.1 61.9 58.7 58.3
Beverage and Tobacco Product Manufacturing
Total 10,192 3,312 3,870 654 491
JT International Berhad 572 170 379 52 39
Share of GLCs (%) 5.6 5.1 9.8 7.9 7.9
Chemical Manufacturing
Total 4,686 5,939 4,815 422 355
CCM Duopharma Biotech Berhad
102 64 43 11 9
Chemical Company Of Malaysia Berhad
195 652 532 19 5
Pharmaniaga Berhad 251 357 479 23 16
Share of GLCs (%) 11.7 18.1 21.9 12.7 8.6
Construction Total 29,453 48,044 17,739 2,664 1,640
Malaysian Resources Corporation Berhad
759 1,703 391 34 24
Share of GLCs (%) 2.6 3.5 2.2 1.3 1.5
Food Manufacturing Total 19,061 17,375 12,305 1,676 1,161
TH Plantations Berhad 369 392 138 58 39
Share of GLCs (%) 1.9 2.3 1.1 3.4 3.4

18 І ADB Economics Working Paper Series No. 312
Industry
Company Name
Market Capitalization
Total Assets
Operating Revenue/ Income
P/L Before
Tax Net
Income Information (Communications)
Total 50,516 29,845 14,963 3,121 2,404 Axiata Group Berhad 15,056 12,764 5,198 1,126 738 Telekom Malaysia Berhad 6,359 6,727 3,000 315 375* TIME Dotcom Berhad 564 466 105 29 35 TIME Engineering Berhad 81 58 50 30 28 Share of GLCs (%) 43.7 67.1 55.8 48.1 48.9
Management of Companies and Enterprises
Total 2,529 9,149 3,457 365 167 Boustead Heavy Industries Corporation Berhad
230 365 172 1 4
Share of GLCs (%) 9.1 4.0 5.0 0.1 2.4 Nonmetallic Mineral Product Manufacturing
Total 3,475 4,610 2,418 203 137 UAC Berhad 100 112 60 5 3 Share of GLCs (%) 2.9 2.4 2.5 2.2 2.3
Professional, Scientific and Technical Services
Total 4,878 4,787 4,083 239 198 Theta Edge Berhad 15 27 28 0 (1) Share of GLCs (%) 0.3 0.6 0.7 0.1 –0.7
Real Estate and Rental and Leasing
Total 18,060 34,611 8,912 2,159 1,745 UEM Land Holdings Berhad 2,768 1,288 166 67 63 United Malayan Land Berhad 194 382 109 24 17 Share of GLCs (%) 16.4 4.8 3.1 4.2 4.6
Retail Trade Total 9,304 5,615 11,353 668 478 PETRONAS Dagangan Berhad 6,803 2,804 7,730 400 287 Share of GLCs (%) 73.1 49.9 68.1 59.8 60.2
Transportation and Warehousing
Total 36,836 39,270 17,513 2,873 2,203 Malaysia Airports Holdings Berhad
2,302 2,338 900 181 126
Malaysian Airline System Berhad
1,260 4,031 4,406 91 76
MISC Berhad 5,665 12,663 4,686 742 618 NCB Holdings Berhad 662 610 303 60 50 PETRONAS Chemicals Group Berhad
16,739 8,951 3,770 1,227 825
Share of GLCs (%) 72.3 72.8 80.3 80.1 77.0 Transportation Equipment Manufacturing
Total 9,415 20,651 13,752 1,192 729 Proton Holdings Berhad 961 2,529 3,000 71 51 UMW Holdings Berhad 3,333 3,250 4,208 426 171 Share of GLCs (%) 45.6 28.0 52.4 41.7 30.5
Utilities Total 23,342 32,143 12,830 780 582 PETRONAS Gas Berhad 11,266 3,383 914 451 340 Tenaga Nasional Berhad 11,649 25,035 10,979 183 168 Share of GLCs (%) 98.2 88.4 92.7 81.4 87.2
Total Companies in Bursa (948) 424,615 956,820 248,220 36,145 25,741GLCs (34) 158,212 417,886 79,947 12,529 9,122Non-GLCs (914) 266,403 538,934 168,273 23,617 16,619Share of GLCs (%) 37.3 43.7 32.2 34.7 35.4
GLC = government-linked corporation, P/L = profit/loss. * Net income is higher than P/L before tax due to a negative tax. Sources: Oriana database, database updated 31/05/2012, and Bankscope database, database updated 13/06/2012.

Malaysia’s Investment Malaise: What Happened and Can It Be Fixed? І 19 A. The NEM and the NEP The reforms contained in this new approach appear to involve an attempt to roll back some of the distortions associated with the affirmative action policies established under the NEP. The NEM and TMP shifted the focus of affirmative action to the bottom 40% of the population, while aiming to raise the income levels of all disadvantaged groups, irrespective of race. This appeared to be a revival of the original intent of the NEP, which was the eradication of poverty among the entire population. The emphasis was on market-friendly and transparent affirmative action programs based on need and merit rather than ethnicity, and meaningful economic participation rather than quotas or targets. Capacity building and skills training were identified as the primary means of assistance.
Data on Malaysian GLCs were derived from the Oriana and Bankscope databases, both maintained by Bureau Van Dijk. Oriana and Bankscope provide the most comprehensive financial information on public and private financial companies in Asia. Both databases combine data from many sources and allow users to search companies based on criteria such as their location, status, and industry classification. Oriana and Bankscope also contain detailed ownership and shareholder information, including information on a company’s ultimate owner and controlling shareholder. All types of ownership are covered, including ownership by government entities or funds.
This development was welcome news indeed. The government appeared to have finally
realized that the most important policy change would be a revamping of the NEP, particularly since the goal of reducing inter-ethnic income inequalities had been largely achieved. In its place, intra-ethnic income disparities had worsened, much of which was attributable to the way the NEP was implemented, and a general approach that targeted the worst off was the only way to deal with inequality and the remaining pockets of poverty (Menon 2009). These changes also had the potential to improve the investment climate and stem the outflow of both capital and skilled labor. The question now was whether it could be faithfully implemented.
Things started off well with this new approach. As early as June 2009, the PM had
eased the requirement for companies to reserve 30% of their shares for ethnic Malays, one of the core policies of the NEP. The requirement was scrapped for companies already listed on the stock exchange and reduced to 12.5% for initial public offerings, but was retained for strategic industries such as telecommunications, water, and energy. In October 2011, the government announced that the equity requirement would be removed in phases in another 17 services subsectors in 2012 (EIU 2012).

20 І ADB Economics Working Paper Series No. 312
Table 3: Old versus New Approach to Economic Development in Malaysia
Old Approach New Approach Growth primarily through capital accumulation. Focus on investment in production and physical infrastructure in combination with low-skilled labor for low value-added exports.
Growth through productivity. Focus on innovative processes and cutting-edge technology, supported by healthy levels of private investment and talent, for high value added goods and services.
Dominant state participation in the economy. Large direct public investment, including through government-linked corporations in selected economic sectors.
Private sector-led growth. Promote competition across and within sectors to revive private investment and market dynamism.
Centralized strategic planning. Guidance and approval from federal authorities for economic decisions.
Localized autonomy in decisionmaking. Empower state and local authorities to develop and support growth initiatives, and encourage competition between localities.
Balanced regional growth. Disperse economic activities across states to spread benefits from development.
Cluster- and corridor-based economic activities. Concentration of economic activities for economies of scale and better provision of supporting services.
Favor specific industries and firms. Grant preferential treatment in the form of incentives and financing to selected entities.
Favor technologically capable industries and firms. Grant incentives to support innovation and risk-taking to enable entrepreneurs to develop higher value added products and services.
Export dependence on G-3 (United States, Europe, and Japan) markets. Part of production chain to supply consumer goods and components to traditional markets.
Asia and Middle East orientation. Develop and integrate actively into regional production and financial networks to leverage flows of investment, trade, and ideas.
Restrictions on foreign skilled workers. Fear that foreign talent would displace local workers.
Retain and attract skilled professionals. Embrace talent, both local and foreign, needed to spur an innovative, high value-added economy.
Source: New Economic Model 2010.
This is where the good news comes to an end, however. The government has been criticized for backtracking on its commitment to discontinue distortionary affirmative action policies, not just by the opposition parties (Lim 2010), but also by a wide range of commentators (Ahya, Tan, and Singh 2010a and 2010b; Woo 2009 and 2011; World Bank 2011). The World Bank (2011, p. 40), for instance, was forced to conclude that “limited headway has been made in the implementation of the NEM… and skepticism abounds with respect to the NEM measures.”
There were a number of policy moves that ostensibly contradicted the NEM’s intent to
focus on merit and need. The TMP itself includes several affirmative action measures that are still targeted at the bumiputera, although these are focused on small and medium-sized enterprises. However, the TMP stresses that these measures will now be achieved through more market-friendly approaches.
Although the NEM identifies the key challenges facing Malaysia with its eight SRIs, its
implementation and value will remain suspect for as long as the underlying distortions of the NEP remain intact. By failing to address them directly, one has to assume that they will be grandfathered to pacify vested interests, some of whom are already revolting, and the root causes of the malaise will remain unchecked. Therefore, one is forced to conclude that although appearing detailed and comprehensive, the NEM remains little more than a vision statement that pays lip service to addressing the core underlying problems facing the economy, while remaining unlikely to do so.

Malaysia’s Investment Malaise: What Happened and Can It Be Fixed? І 21
VI. CONCLUSION Malaysia is an outstanding model of how openness to trade and FDI can transform a poor, agrarian economy into a thriving, manufacturing-based, middle-income one in a generation. It is also a success story of how social harmony can be preserved in a multiracial society, relying on economic openness to sustain growth in the context of an expensive affirmative action program that also skews incentives. In this sense, the NEP has performed an important signaling role, and has played its part in delivering the peace and stability that has enabled Malaysia to sustain its growth. In the past, such openness resulted in massive inflows of FDI and high rates of economic growth that, when combined with revenues from large oil reserves, augmented the domestic resource base and facilitated a tax-transfer scheme that favored the majority. All that changed after the AFC, however. FDI flows dropped off sharply and continued to remain low even after recovery. Although some moderation in aggregate investment was to be expected post-AFC, private domestic investment has slumped sharply, as the flight of both capital and skills took hold. If the resource and other costs of the NEP were not a major drag on growth in the past, the trend decline in both domestic and foreign investment, combined with other ongoing adjustments such as out-migration and demographic change, suggests that reform is now critical for sustainability. Muddling through is no longer an option for Malaysia.
The NEP is now past its use-by date. There is increasing recognition that many of
Malaysia’s economic problems, including the slump in private investment, are rooted in the distortions resulting from the workings and implementation of the NEP and its reincarnates. Since the NEP had as its target a redistribution of wealth rather than income, many GLCs were spawned as vehicles to pursue this objective. There is therefore a clear link between the two. The problems that Malaysia is facing at the moment can also be traced to the workings of not just one or the other, but both. Therefore, any solution must address both constraints. There is little doubt that GLCs have crowded out private investment in a wide range of sectors. It is arguably more important to address the GLC problem for the revival of investment than it is the NEP. It remains to be seen if the plans announced for government divestment in some of these GLCs will progress in a way that removes all barriers that have prevented or discouraged new firms from entering what have been traditional strongholds. Whether divestment proceeds will be channeled back into government involvement in different sectors, as has been happening lately, is another concern. Although the reforms embedded in the NEM, ETP, and TMP signaled a departure from the previous government’s priorities and approach to development, implementation has been lackluster at best and mendacious at worst. The fact that the TMP itself includes several new affirmative action measures is telling.
Unless bold policy changes that neutralize the distortions of the NEP are implemented
faithfully and the overwhelming influence of GLCs in the marketplace is curtailed, it is unlikely that private investment will recover. In fact, it could even decline further in the future. The government will then be faced with either a case of slowing growth and rising unemployment, or it will again have to boost public spending in an attempt to offset these effects. If it pursues the latter course, this would further increase the fiscal deficit, probably quite substantially given dwindling domestic reserves. With the budget deficit already at critically high levels, and if the NEP continues to require substantial resources, then the proposed GLC divestment program may become a necessity if a crisis is to be averted.
Malaysia has always opted for economic expediency during times of impending crises
and hopefully this approach will once again prevail. Faced with crises in the past, governments have responded with pragmatism, even loosening some of the more distortionary aspects of the NEP when it was required, although admittedly more so for foreign investors that its own

22 І ADB Economics Working Paper Series No. 312 citizenry. Whether the changed political landscape and tighter electoral prospects that prevail today—in the context of a slowing world economy with negative impacts threatening to spill over domestically—will prevent such necessary but risky policy change remains to be seen.

REFERENCES ADB. 2012. Malaysia: Interim Country Partnership Strategy Paper. Manila: ADB. Asia Sentinel. 2010. Malaysia’s Disastrous Capital Flight. 11 January 2010. Athukorala, P., and J. Menon. 1995. Developing with Foreign Investment: Malaysia. Australian
Economic Review. 1st Quarter. 9–22. ―――. 1999. Outward Orientation and Economic Performance: The Malaysian Experience.
World Economy. 22(8). 1119–1140. Athukorala, P., and S. Wagle. 2011. Foreign Direct Investment in Southeast Asia: Is Malaysia
Falling Behind? ASEAN Economic Bulletin. 28 (2). 115–133. Bhaskaran, M. 2011. Investment Liberalization. Paper presented to the interim workshop on
Assessment of Impediments and Actions Required for Achieving an ASEAN Economic Community by 2015. 11 November. Singapore: ISEAS.
Bradsher, K. 2011. Taking a Risk for Rare Earths. New York Times. 8 March. Ahya, C., D. Tan, and S. Singh. 2010a. Malaysia's New Economic Model: Making the Right
Noise. Morgan Stanley Global Economic Forum. 14 June 2010. Ahya, C., D. Tan, and S. Singh. 2010b. 10th Malaysia Plan: Two Steps Forward, One Step
Backward? Morgan Stanley Global Economic Forum. 14 June 2010. Dev, Kar and Karly Curcio (2011), Illicit Financial Flows from Developing Countries: 2000-2009,
Global Financial Integrity, Washington, DC. Economic Intelligence Unit (EIU). 2012. Malaysia Country Report. March. Fuller, T. 2009. Malaysia Dilutes Its System of Ethnic Preferences. New York Times.
30 June 2009. Available at http://www.nytimes.com/2009/07/01/world/asia/01malaysia.html
Hill, H., T.S. Yean, and R.H.M Zin (eds.) Malaysia’s Development Challenges: Graduating from
the Middle. Oxon: Routledge. IMF. 2012. Malaysia 2011 Article IV Consultation. IMF Country Report No. 12/43. February.
Washington, DC: IMF. Jacobs, J. 2011. GLCs versus Private Developers? The Edge. 29 March. Available at
http://www.theedgemalaysia.com/highlights/193504-glcs-vs-private-developers.html Khaled, M. 2009. Opening speech at the Seminar on Enhancing Graduate Employability:
Issues, Concerns, and the Way Forward. Putrajaya. 21 July. Available at http://khalednordin.com/wp-content/uploads/2009/07/july-21st-2009-seminar-on -enhancing-graduate-employability-issues-concerns-and-the-way-forward.pdf

24 І ADB Economics Working Paper Series No. 312 Hock, L.K., and S. Nagaraj. The Crisis in Education in H. Hill, T.S. Yean, R.H.M Zin (eds.)
Malaysia’s Development Challenges: Graduating from the Middle. Oxon: Routledge. 213–232.
Lim, K.S. 2010. Tenth Malaysia Plan: Long Live NEP–RIP NEM. Speech Delivered to the
Malaysian Parliament on the 10th Malaysia Plan. 21 June 2010. Lee, K.H. and S. Nagaraj. 2012. The Crisis in Education in H. Hill, T.S. Yean, R.H.M Zin (eds.)
Malaysia’s Development Challenges: Graduating from the Middle. Oxon: Routledge. pp. 213–32.
Mohamad, Mahathir. 2011. A Doctor in the House: The Memoirs of Tun Dr Mahathir Mohamad.
Kuala Lumpur: MPH Publishing. Menon, J. 1998. Factor Productivity Growth in Foreign and Domestic Firms in Malaysian
Manufacturing. Journal of Asian Economics. 9(2). 251–280. Menon, J. 2000. How Open is Malaysia? An Analysis of Trade, Capital, and Labour Flows.
World Economy. 23 (2). 235–255. Menon, J. 2009. Macroeconomic Management Amid Ethnic Diversity: Fifty Years of Malaysian
Experience”, Journal of Asian Economics , 20 (1). pp. 25–33 National Economic Advisory Council (NEAC). 2010. New Economic Model for Malaysia Parts 1
and 2. Kuala Lumpur: NEAC. New Straits Times. 2012. Malaysia’s FDI up by 12.3% in 2011. 21 February. Star Online. 2011. After Seven Years of Change…. 25 June. United Nations Conference on Trade and Development (UNCTAD). 2009.World Investment
Report 2009: Transnational Corporations, Agricultural Production, and Development. Geneva: UNCTAD.
UNCTAD. 2011a. Global Investment Trends Monitor. 17 January. Geneva: UNCTAD. UNCTAD. 2011b.World Investment Report 2011: Non-Equity Modes of International Production
and Development. Geneva: UNCTAD. UNCTAD. 2012. Global Investment Trends Monitor. 12 April. Geneva: UNCTAD. Woo, W.T. 2009. Getting Malaysia Out of the Middle-Income Trap. Paper presented to the
Economic Council Working Group of the Economic Planning Unit of the Prime Minister’s Department in Kuala Lumpur, Malaysia. Available at http://www.econ.ucdavis.edu/ faculty/woo/woo.html
Woo, W.T. 2011. Understanding the Middle-Income Trap in Economic Development: The Case
of Malaysia. The 2011 World Economy Asia Lecture. Globalization and Economic Policy (GEP) conference at the University of Nottingham in Kuala Lumpur, Malaysia. 13 January. Available at http://www.econ.ucdavis.edu/faculty/woo/woo.html

References І 25
World Bank. 2010. Investing Across Borders 2010: Indicators of Foreign Direct Investment Regulation in 87 Economies. Washington, DC: World Bank.
World Bank. 2011. Malaysia Economic Monitor. April. Washington, DC: World Bank. Available
at www.worldbank.org/my

Malaysia’s Investment Malaise: What Happened and Can It Be Fixed?
Jayant Menon No. 312 | April 2012
ADB Economics Working Paper Series
Malaysia’s Investment Malaise: What Happened and Can It Be Fixed?Private investment in Malaysia has never fully recovered from the impact of the Asian financial crisis. Resolving the problem requires addressing the distortions in the New Economic Policy and curtailing the influence of government-linked corporations.
About the Asian Development BankADB’s vision is an Asia and Pacific region free of poverty. Its mission is to help its developing member countries reduce poverty and improve the quality of life of their people. Despite the region’s many successes, it remains home to two-thirds of the world’s poor: 1.8 billion people who live on less than $2 a day, with 903 million struggling on less than $1.25 a day. ADB is committed to reducing poverty through inclusive economic growth, environmentally sustainable growth, and regional integration. Based in Manila, ADB is owned by 67 members, including 48 from the region. Its main instruments for helping its developing member countries are policy dialogue, loans, equity investments, guarantees, grants, and technical assistance.
Asian Development Bank6 ADB Avenue, Mandaluyong City1550 Metro Manila, Philippineswww.adb.org/economics
Printed on recycled paper Printed in the Philippines


