+ All Categories
Home > Documents > Malt Drying Model Verification for Efficiency Improvement

Malt Drying Model Verification for Efficiency Improvement

Date post: 05-Dec-2021
Category:
Upload: others
View: 2 times
Download: 0 times
Share this document with a friend
172
Portland State University Portland State University PDXScholar PDXScholar Dissertations and Theses Dissertations and Theses 11-7-1995 Malt Drying Model Verification for Efficiency Malt Drying Model Verification for Efficiency Improvement Improvement John David Kribs Portland State University Follow this and additional works at: https://pdxscholar.library.pdx.edu/open_access_etds Part of the Mechanical Engineering Commons Let us know how access to this document benefits you. Recommended Citation Recommended Citation Kribs, John David, "Malt Drying Model Verification for Efficiency Improvement" (1995). Dissertations and Theses. Paper 5214. https://doi.org/10.15760/etd.7090 This Thesis is brought to you for free and open access. It has been accepted for inclusion in Dissertations and Theses by an authorized administrator of PDXScholar. Please contact us if we can make this document more accessible: [email protected].
Transcript

Portland State University Portland State University

PDXScholar PDXScholar

Dissertations and Theses Dissertations and Theses

11-7-1995

Malt Drying Model Verification for Efficiency Malt Drying Model Verification for Efficiency

Improvement Improvement

John David Kribs Portland State University

Follow this and additional works at: https://pdxscholar.library.pdx.edu/open_access_etds

Part of the Mechanical Engineering Commons

Let us know how access to this document benefits you.

Recommended Citation Recommended Citation Kribs, John David, "Malt Drying Model Verification for Efficiency Improvement" (1995). Dissertations and Theses. Paper 5214. https://doi.org/10.15760/etd.7090

This Thesis is brought to you for free and open access. It has been accepted for inclusion in Dissertations and Theses by an authorized administrator of PDXScholar. Please contact us if we can make this document more accessible: [email protected].

THESIS APPROVAL

The abstract and thesis of John David Kribs for the Master of Science in

Mechanical Engineering were presented November 7, 1995, and accepted by the

thesis committee and the department.

COMMITTEE APPROVALS: _ ____ _ Graig Chair

Gerald W. Recktenwald

man ·ve of the Office of Graduate Studies

DEPARTMENT APPROVAL: Herman J. Migliore, cl4ir Department of Mechanical Engineering

********************************************************

ACCEPTED FOR PORTLAND STATE UNIVERSITY BY THE LIBRARY

by on 19/J~e~ /9'95

ABSTRACT

An abstract of the thesis of John David Kribs for the Master of Science in Mechanical Engineering presented November 7, 1995.

Title: Malt Drying Model Verification for Efficiency Improvement.

The aim of this work has been to minimize the thermal energy required to dry malt

in deep beds while maintaining malt quality, and without increasing the drying time more

than one hour. Malt drying usually takes place in deep bed (. 7-1 m) driers by forcing hot

air through the bed.

Measurements of inlet and outlet relative humidity, temperature, and airflow at a

drier at Great Western Malting Company's Vancouver, Washington facility were made to

find average moisture content versus time. The measurements were used to develop a

wetted surface model of a malt bed. However, the model was not detailed enough to

accurately fit the drying data taken from the kiln. Thus it was necessary to consider a

more complex model.

A diffusion based mathematical model of malt drying was coded using malt

properties and drying equations found in the research of Bala (Ph.D. thesis, 1983). This

program calculates moisture content and malt temperature in horizontal layers of a malt

bed. Energy saving drying tests by airflow reduction methods were simulated with the

program. The methods were designed to take advantage of the malt's internal drying

mechanism, and they were effective at reducing energy consumption. However, model

verification was necessary, and maintaining malt quality was essential.

2

A deep bed experimental malt drier was built at Portland State University to allow malt

temperature and average moisture content data collection. Drying experiments were

performed at constant airflow, for several different drying temperature cases, and the

highest experimental temperature with acceptable malt quality was found to be 7 5 C.

Drying at 70 C (158 F) rather than at 63 C (145 F) was found to cause a 20% reduction in

the thermal energy consumption, but higher temperatures did not significantly improve

efficiency. The experimental moisture contents and grain temperatures generally

compared well with diffusion model simulations of the experiments. Airflow reduction

experiments decreased thermal consumption by 20% compared to typical drying

schedules. These experiments were based on the airflow reduction methods learned from

the diffusion model. However, diffusion model simulations using the experimental

conditions showed thermal energy reductions of 11 %.

MALT DRYING MODEL VERIFICATION FOR

EFFICIENCY IMPROVEMENT

by

JOHN DAVID KRIBS

A thesis submitted in partial fulfillment of the requirements for the degree of

MASTER OF SCIENCE in

MECHANICAL ENGINEERING

Portland State University 1995

ACKNOWLEDGEMENTS

I would like to give my thanks and appreciation to Dr. Graig Spolek, who

supervised my work and encouraged me at all times. I also thank the members

of my thesis committee, Dr. Gerry Recktenwald, Dr. C. William Savery, and Dr.

Stanley Hillman. Each has been very helpful to me. I appreciate the assistance

and ideas, for building my research malt drier, given to me by Mr. John Griffin

of Portland State University's Mechanical Engineering Department.

This research would not have been possible without the support of GWM

(Great Western Malting Company, of Vancouver, \Vashington). My special

thanks go to Mr. John Cuti, Process Research Manager at GWM, who helped me

learn a great deal about the malting process. Finally, I thank my wife Lourdes

for her unending interest in my research, and for her encouragement of my

personal advancement.

TABLE OF CONTENTS

ACKNOWLEDGEMENTS ..................................•................................................... ii

LIST OF TABLES ...................................................................................................... vi

LIST OF FIGURES .................................................................................................... vii

NOTATION .......................................................................................................... x

CHAPTER I INTRODUCTION ........................................................................... 1

HYPOTHESES FOR THERMAL ENERGY SAVING ............................... 1 Drying Temperature Increases Raise Thermal Efficiency ..... 1 Timed Airflow Reductions Save Energy Without

Impeding Drying ............................................................. 2 Malt Quality Can Be Maintained in Spite of

Temperature and Airflow Changes ............................... 4

HISTORY OF THE PROBLEM ............................................................. 6

THERMAL ENERGY-SAVING RESEARCH DIRECTION ...................... 6

QUALITY AND MOISTURE CONTENT DEFINITIONS AND DESCRIPTIONS ........................................................................ 7

THESIS PREVIEW ............................................................................. 9

CHAPTER II IN-PROCESS MOISTURE CONTENT ANALYSIS ..................... 10

OVERVIEW OF COMPARTMENT HOUSE KILN OPERATION ............. 10

METHOD OF MOISTURE CONTENT ESTIMATION ............................ 11

TYPICAL PROCESS THERMAL ENERGY CONSUMPTION ................... 14

CONCLUSIONS ................................................................................ 16

iv CHAPTER III WETTED-SURFACE MODEL. ...................................................... 17

DERIVATION OF MODEL PARAMETERS FROM COMPARTMENT HOUSE DATA ............................................... 18

WETIED-SURFACE MODEL SOLUTION SCHEME ............................. 21

MODEL SIMULATION RESULTS ....................................................... 23

CHAPTER IV ADSORBED-LIQUID DIFFUSION MODEL. ............................... 24

MODEL OVERVIEW ......................................................................... 24

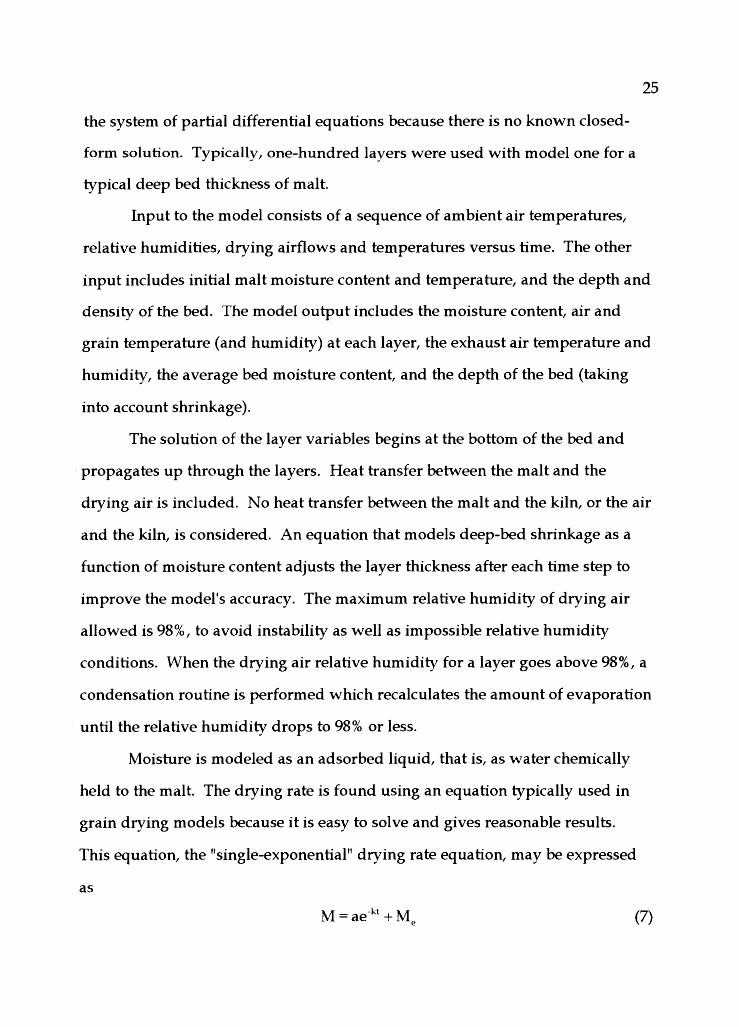
PARTIAL DIFFERENTIAL EQUATIONS .............................................. 26 Mass Balance Equation for a Control Volume ........................ 27 Drying Rate Equation ............................................................... 27 Heat Balance Equation .............................................................. 28 Heat Transfer Rate Equation .................................................... 29

MALT PROPERTIES AND DRYING RA TE EQUATION ........................ 30

MODEL ONE PROGRAM STRUCTURE .............................................. 31 Fan and Thermal Energy Calculations .................................... 32

THERMAL ENERGY STUDY AND RESULTS ....................................... 33

CHAPTER V RESEARCH MALT DRIER. ........................................................... 37

DRIER DESCRIPTION ....................................................................... 37 Drying Section ........................................................................... 38 Heating System .......................................................................... 40 Blower System ........................................................................... 41 Data Acquisition ........................................................................ 42 Drier Performance and Measurement Uncertainties ............. 44

CHAPTER VI MALT DRYING TESTS .................................................................. 48

DRYING TEST DESCRIPTION ........................................................... 49

DRYING TEST RESULTS ................................................................... 53 Energy per Ton .......................................................................... 53 Malt Qualicy ............................................................................... 57

MALT DRYING TEST SUMMARY ..................................................... 61

v

CHAPTER VII MODEL VERSUS EXPERIMENTAL DATA COMPARISON .... 62

COMPARISON RESUL1S .................................................................. 62 Constant-Temperature Crystal Malt. ....................................... 63 Constant-Temperature Harrington Malt.. ............................... 64 Drier Insulation Tests ................................................................ 64 Airflow Reduction Tests ........................................................... 65 Overall Comparisons ................................................................ 68

CHAPTER VIII RESULTS AND CONCLUSIONS ............................................... 70

FUTURE WORK ............................................................................... 71

REFERENCES .......................................................................................................... 72

APPENDICES

APPENDIX A DRYING AIR PROPERTY EQUATIONS ..................................... 74

APPENDIX B WETTED-SURFACE MODEL CODE ........................................... 78

APPENDIX C MODEL ONE CODE ...................................................................... 87

APPENDIX D DRIER CONTROL AND DATA ACQUISITION HARDWARE .................................................................................. 106

APPENDIX E DRIER OPERATION PROCEDURE ............................................. 108

APPENDIX F ORIFICE PLATE FLOW EQUATION .......................................... 118

APPENDIX G EXPERIMENTAL DRYING DATA .............................................. 123

APPENDIX H MODEL VERSUS EXPERIMENTAL DATA COMPARISON .... 140

TABLE I.

TABLE II.

LIST OF TABLES

AIR FLOW UNCERTAINTIES ...................................................... 46

EXPERIMENTAL MALT QUALITY RESULTS ........................... 58

Figure 1.

Figure 2.

Figure 3.

Figure 4.

Figure 5.

Figure 6.

Figure 7.

Figure 8.

Figure 9.

Figure 10.

Figure 11.

Figure 12.

Figure 13.

Figure 14.

Figure 15.

Figure 16.

Figure 17.

Figure 18.

Figure 19.

Figure 20.

LIST OF FIGURES

Drying Periods ................................................................................ 4

Compartment House Kiln Schematic. .......................................... 10

Control Volume of Malt and Air in Deep Bed Layer .................. 27

Model Batch A Thermal Energy to Dry ....................................... 34

Model Batch B Thermal Energy to Dry ........................................ 35

Model Batch C Thermal Energy to Dry ........................................ 35

Drier System Layout. ..................................................................... 37

Photo of the Drying Section of Malt Drier ................................... 39

Drying Section Sensor Location Schematic .................................. 39

Duct Heater Photo .......................................................................... 40

Blower and Damper Photo ............................................................ 42

Inter-Grain Air Thermocouple ...................................................... 43

Batch 20 Airflow And Temperature Schedule ............................. 51

Batch 21 Airflow And Temperature Schedule ............................. 51

Batch 22 Airflow And Temperature Schedule ............................. 52

Batch 24 Airflow And Temperature Schedule ............................. 52

Batch 25 Airflow And Temperature Schedule ............................. 52

Normalized Thermal Energy to Dry Crystal Malt from 80.1to5.7% M.c. D.b .................................................... 55

Normalized Thermal Energy to Dry Harrington Malt from 84.6 to 6.3% M.c. D.b .................................................... 55

Normalized Thermal Energy to Dry Harrington Malt from 78.6% to Terminal M.c. D.b. for Airflow Reduction .......... 56

Figure 21.

Figure 22.

Figure 23.

Figure 24.

Figure 25.

Figure 26.

Figure 27.

Figure 28.

Figure 29.

Figure 30.

Figure 31.

Figure 32.

Figure 33.

Figure 34.

Figure 35.

Figure 36.

Figure 37.

Figure 38.

Figure 39.

Figure 40.

Figure 41.

Figure 42.

viii

Crystal Malt Quality Indicators Versus Drying Temperature ... 59

Harrington Malt Quality Indicators Versus Drying Temperature .................................................................................... 59

Harrington Malt Color for Airflow Reduction Tests .................. 60

Harrington Malt Diastatic Power for Airflow Reduction Tests ............................................................................... 60

Batch 3 Model Versus Experimental Data for Crystal Malt. ...... 63

Batch 10 Model Versus Experimental Data for Harrington Malt ............................................................................. 64

Batch 14 Model Versus Experimental Data for Crystal Malt ..... 65

Batch 22 Model Versus Experimental Data for Harrington Malt ............................................................................. 66

Batch 24 Model Versus Experimental Data for Harrington Malt ............................................................................. 67

Normalized Thermal Energy to Dry Malt from 78.6% to Terminal Moisture Content for Model Airflow Reduction ........ 68

Drier Filling Schematic .................................................................. 110

Sensor Positions with Respect to the Drying Section .................. 111

Drierinp.dat File Format.. .............................................................. 112

Flowcon Display Format. .............................................................. 116

Drierinp.dat File Format. ............................................................... 116

Orifice Pia te Schema tic. ................................................................. 119

Experimental Batch 2 ..................................................................... 124

Experimental Batch 3 ..................................................................... 125

Experimental Batch 4 ..................................................................... 126

Experimental Batch 5 ..................................................................... 127

Experimental Batch 6 ..................................................................... 128

Experimental Batch 9 ..................................................................... 129

Figure 43.

Figure 44.

Figure 45.

Figure 46.

Figure 47.

Figure 48.

Figure 49.

Figure 50.

Figure 51.

Figure 52.

Figure 53.

Figure 54.

Figure 55.

Figure 56.

Figure 57.

Figure 58.

Figure 59.

Figure 60.

Figure 61.

Figure 62.

Figure 63.

Figure 64.

Figure 65.

Figure 66.

Figure 67.

Figure 68.

IX

Experimental Batch 10 ................................................................... 130

Experimental Batch 11 ................................................................... 131

Experimental Batch 12 ................................................................... 132

Experimental Batch 13 ................................................................... 133

Experimental Batch 14 ................................................................... 134

Experimental Batch 20 ................................................................... 135

Experimental Batch 21 ................................................................... 136

Experimental Batch 22 ................................................................... 137

Experimental Batch 24 ................................................................... 138

Experimental Batch 25 ................................................................... 139

Batch 2 Model Versus Experimental Data ................................... 141

Batch 3 Model Versus Experimental Data ................................... 142

Batch 4 Model Versus Experimental Data ................................... 143

Batch 5 Model Versus Experimental Data ................................... 144

Batch 6 Model Versus Experimental Data ................................... 145

Batch 9 Model Versus Experimental Data ................................... 146

Batch 10 Model Versus Experimental Data .................................. 147

Batch 11 Model Versus Experimental Data .................................. 148

Batch 12 Model Versus Experimental Data .................................. 149

Batch 13 Model Versus Experimental Data .................................. 150

Batch 14 Model Versus Experimental Data .................................. 151

Batch 20 Model Versus Experimental Data .................................. 152

Batch 21 Model Versus Experimental Data .................................. 153

Batch 22 Model Versus Experimental Data .................................. 154

Batch 24 Model Versus Experimental Data .................................. 155

Batch 25 Model Versus Experimental Data .................................. 156

Operators

~

d

8

ln

Lower case

a

cpa

cpg

cpl

cpv

d.b.

mair

f ()

g()

h

h ambient air

ha

hcv

hg

hm

hmoisture

k

mair

mwater

incremental

differential

NOTATION

partial differential

natural logarithm

constant

specific heat of air, kJ/kg/K

specific heat of malt grain, kJ/kg/K

specific heat of water liquid, kJ/kg/K

specific heat of water vapor, kJ/kg/K

dry basis, moisture per unit dry mass

total mass flow rate of air, kg/ s

ratio of fan input power to max. fan input power

search function for wetted-surface model

convective heat transfer coefficient, W / m 2 /K

specific enthalpy of ambient air, kJ/kg

specific enthalpy of air, kJ/kg

volumetric heat transfer coefficient, kJ/ m 3 /min./K

specific enthalpy of grain, kJ/kg

convective mass transfer coefficient, m/ s

specific enthalpy of moisture from grain, kJ /kg

drying constant, 1/time

mass flow rate of air, kg/ s

evaporation rate of water, kg/ s

m.c.

Pw,ex r

rh

t

w.b.

z

Upper case

A

DP G

Gmax H

La Lg M

Mcdb

Me

Mew MW Mwi pmax Q

Ro s S.E.

Ta Tg w wfaninput

moisture content

partial pressure of water vapor in exhaust air, atm

correlation coefficient

relative humidity of drying air, % or decimal

time

wet basis, moisture per unit wet mass

arbitrary height in bed, m

total surface area of malt in malt bed

effective grain diameter, m,

mass flow rate of air per unit area, kg/ m 2 /min.

maximum G for given fan and system

absolute humidity, kg water vapor/kg dry air

latent heat of water vapor from free water, kJ/kg

latent heat of water vapor from malt grain, kJ/kg

moisture content, % or ratio, d. b.

moisture content, d. b., %

dynamic equilibrium moisture content, d. b., %

dynamic equilibrium moisture content, w.b., %

moisture content, w.b., % or ratio

initial moisture content, w.b., %

input power to fan at Gmax

total thermal energy, J

universal gas constant (8.315 J/kmole/K)

bed shrinkage, %

standard error of estimate

temperature of air, C

temperature of grain, C

absolute humidity, kg water vapor/kg dry air

total fan input energy

xi

w /q/2){ 'ire JO Al~SO:)S~A

SlU~SUO:)

4~suap

ri

)l.'ro'J...'<t>'e d

CHAPTER I

INTRODUCTION

This study attempted to determine if simple changes in the operation of

deep-bed malt driers can reduce thermal energy consumed to heat air for

drying. In a local malting facility owned by GWM (Great Western Malting

Company, Vancouver, Washington), which sponsored this research, drier

airflow is typically reduced from its initial level for 33% or less of the total

drying time. Drying temperatures are often kept low until the last four hours of

drying time. However, airflow and temperature were considered changeable in

the effort to reduce energy consumption. Drying physics appeared to indicate

that airflow and drying temperature are strong factors in the efficient

consumption of thermal energy in malt drying. Malt chemistry showed that the

airflow changes could be made with no degradation of product quality.

Experience suggested that small changes in drying temperature were possible

without risk of unacceptable malt quality.

HYPOTHESES FOR THERMAL ENERGY SAVINGS

Drying Temperature Increases Raise Thermal Efficiency

It was hypothesized that higher malt drying temperature reduces thermal

energy consumption in malt drying during the constant-rate period. The

constant-rate drying period is characterized by drying surfaces being saturated

2

with moisture. Internal moisture movement in the substance brings moisture to

the surface rapidly enough that the surface remains saturated and the drying

rate (evaporation rate) is controlled by varying drying temperature, air

humidity, and airflow. The hypothesis was based on the fact that air drying

efficiency increases at higher drying temperatures (Bruce 1983). The principle

can be demonstrated by convective mass-transfer theory predictions for the

effect of increasing drying temperature. The increase in saturated water vapor

density at the drying surface with increasing temperature, and the change in

drying air vapor density (which is inversely proportional to drying temperature)

combine to make air drying more efficient at higher drying temperatures.

The controllable factors for the constant-rate drying period are formulated

in convective mass-transfer theory. This theory states that the mass transfer rate

from a body is proportional to the difference between the surface vapor density

and the vapor density of the surrounding air. Mass transfer rate is also

proportional to the surface area of the body and the mass transfer coefficient,

which is experimentally or analytically determined. Since the body's (malt's)

surface is saturated with moisture, increasing drying temperature causes the

surface vapor density to increase and the drying air vapor density to decrease,

inversely proportional to temperature. The effect is to increase the drying rate a

larger percentage than the increase in the rate of thermal energy input for

drying.

Timed Airflow Reductions Save Energy Without Impeding Drving

Employees at the local malting company typically feel airflow is crucial to

dry malt within a specified time period. They have increased blower size and

power to boost production. On one hand, convective mass transfer theory agrees

with the belief in high airflow during constant-rate drying. Conversely, after

constant-rate drying, high airflow not only does not boost production, it is

hypothesized to waste energy. This view is supported by the following

evidence:

3

1. Air drying includes a constant-rate period and one or more falling-rate

periods.

2. Many authors accept that during falling-rate drying, grains typically

dry by diffusion (Bruce 1985), or at least that the principal rate­

determining step is internal mass transfer (Chirife 1983).

3. Since internal mechanisms control drying during the falling-rate

period, the influence of external variables (temperature, humidity,

airflow, state of subdivision, etc.) diminishes (Perry 1984).

4. The thermal energy consumed in drying is directly proportional to the

level of airflow.

The falling-rate period begins with a transition from external to internal

control of drying rate. This transition marks the point when not all the surface of

the drying body is saturated. A hypothetical substance's drying curve

illustrating the constant and falling-rate drying periods is shown in Figure 1. As

the body becomes drier, the point when the entire surface is unsaturated marks

when the internal drying mechanisms dominate the drying rate.

120~~~~~~~~~~~~~~~~~~~~~~~~~~~

~ ~ 100 I · E Constant-rate period

~ 80 flJ flJ t"ll

E -:- 60 -:; ci:::

~ 40 ·e-0

20

Falling-rate period

o+--~--1-~~~~--..~~--~~~~--~~r----=~------~~

0 2 3 4 5 6 7 8 9 10

Time->

Figure 1. Drying Periods.

After the constant-rate drying period, the drying air typically no longer

becomes saturated with moisture. Since the amount of drying air no longer

dominates the drying rate, it is clearly wasting some thermal energy to use the

same amount of airflow as in the constant-rate period. The thermal energy

consumption of drying is proportional to the airflow rate. Thus, any reduction

in airflow rate that does not affect drying rate is pure thermal energy savings.

Malt Quality Can Be Maintained in Spite of Temperature and Airflow Changes

It was hypothesized that airflow level has a weak bearing on finished

malt quality, and that small temperature increases can be made without

damaging malt quality. No malt quality parameters mentioned in Briggs (1981)

are said to be dependent on airflow, although high airflow is said to increase the

evaporative cooling effect, which indirectly connects airflow to quality, through

malt temperature. Evaporative cooling occurs because the heat transferred from

air to grain is used in changing water from liquid to vapor. Thus, the high

temperature of the air is reduced as it becomes saturated with vapor near the

grain and the grain is heated only to the wet-bulb air temperature. Since the hot

4

5

air is typically very dry, the wet-bulb temperature is much lower than the hot air

temperature. This temperature difference is what is known as evaporative

cooling. Extremely high airflow may cause heat damage by rapid heat and

moisture transfer, but sharp airflow reductions are likely to have a weak effect

on quality, at least at lower malt moisture contents.

Increasing initial drying temperature and holding it constant until

roasting appeared to be possible. (Roasting is the high temperature final drying

stage that builds the color, flavor, and aroma of the malt). The following

observations relate to this view:

1. Enzymatic inactivation increases with increasing temperature (Briggs

1981).

2. Industrial drying schedules include several stages of drying at

successively higher temperatures before roasting.

Predictive malt quality models that consider industrial malt quality

requirements do not exist, to the author's knowledge. Tradition guided nearly

all malt drying schedules, but testing of tern perature effects on quality has not

been pursued in the effort to reduce thermal energy consumption. Even though

Briggs (1981) recognized that enzymatic inactivation rises with increasing

temperature, the rate or extent of the increase is unknown. Typical industrial

use of several temperature increases during the constant-rate drying period

suggest that the maximum of these temperatures could be used throughout

drying, up to the roasting stage.

6 HISTORY OF THE PROBLEM

To the author's knowledge, no experiments or model-based tests have

been published which show both airflow and temperature changes can reduce

thermal energy consumption for deep-bed malt driers. Kuntze (1994) developed

a deep-bed wetted-surface drying model. He used it with a drier model, which

included heat exchangers and drying air recirculation, in order to save thermal

energy. He also used his model to predict when the target moisture content (the

amount of water per wet or dry material) would be reached to avoid thermal

energy loss due to over drying. Bala (1983) developed an adsorbed-liquid

diffusion model and applied it to thermal energy comparisons between driers

using gas-fired heat, indirect steam heat, and gas-fired heat with drying air

recirculation. Bruce (1983) developed a complex moisture-dependent diffusion

model of barley drying in order to model driers that use high drying

temperature to increase thermal efficiency. However, he emphasized using new

driers (continuous counter-flow) rather than improving the process in existing

ones.

THERMAL ENERGY-SAVING RESEARCH DIRECTION

To approximately determine the maximum possible constant drying

temperature, drying tests were done with an experimental drier. Experiments

were also done, after making simulations with a diffusion-based drying model,

to find airflow schedules that would increase the thermal efficiency of drying.

Although higher drying temperature raises thermal efficiency (Bruce 1983), malt

enzyme levels decrease with increasing temperature (Briggs 1981). The enzyme

levels are required if the malt is to produce useful wort and, finally, acceptable

beer {pale ale, for the malt studied in this work). A balance between malt

quality changes and thermal energy reduction had to be found.

7

Industrial malting processes start out by alternately immersing and

draining barley in a tank for a total of 40 hours. The malt, at about 45% w.b.

moisture content, has begun germinating at this point, and it is then put through

a germination process lasting from 4-6 days. Since drying, or kilning, is the last

phase in the malt production sequence, it must fit in the time schedule of the

other operations. Changes in the airflow schedule for drying could not cause

drying delays of more than an hour, perhaps. Thus the effect of schedule

changes on the time required to dry from 45% w.b. to 4% w.b. had to be

determined.

Since malt drying schedules depend on the malt bed thickness, drying

airflow uniformity, and the ambient humidity, different industrial kilns and

different ambient weather conditions may require that different lengths of time

be used for drying. Rather than making in-process moisture content checks or

kiln-specific schedules, using drier control strategies based on exhaust air

conditions was considered.

QUALITY AND MOISTURE CONTENT DEFINITTONS AND DESCRIPTIONS

The quality parameters of interest in the finished malt are the moisture

content, soluble protein, alpha amylase, diastatic power, extracts, malt color,

clarity, viscosity, and beta glucan. Several of these parameters are described in

the following list:

• Alpha amylase, an enzyme, degrades starch to a complex mixture of sugars. Alpha amylase is degraded during kilning (Briggs 1981).

8

• Beta glucans, made up of glucose, may contribute to beer foam and palate fullness. However, they are, and must be, degraded during kilning (Briggs 1981).

• Clarity denotes the transparency of the resulting wort in brewing. Clear wort is desirable. Values of clarity: 1 is clear, ... , greater than 5 is unacceptable for pale ale malts (Cuti 1995).

• Color is created by Malliard reactions and Amadori rearrangements, and its formation rate is proportional to temperature and increases with increasing moisture content (Briggs 1981).

• Diastatic power, a mixture of barley enzymes (alpha-glucosidase and 'debranching enzyme(s)'), is degraded during kilning (Briggs 1981).

• Dry basis, d.b., describes the water mass of a substance as a ratio or percentage of the total dry mass of the substance.

• Enzymes are degraded during kilning, at a rate which increases with increasing moisture content and increasing temperature (Briggs 1981).

• Extracts are given by the percentage of the water soluble portion of dry malt that goes into solution (Cuti 1995).

• Moisture content, m.c., is the water content that can be removed without changing the chemical composition of the substance. It is given on a dry or wet basis.

• Soluble protein is given by the percentage of the total protein that is soluble in water (Cuti 1995).

• Viscosity refers to the viscosity of the wort. It is measured by the time required to pass 2 ml of wort through an orifice, and in units of centi­stokes (cs). Values less than 1.6 cs are acceptable for pale ale malts (Cuti 1995).

• Wet basis, w.b., describes the water mass of a substance as a ratio or percentage of the total mass of the dry substance and water.

9

THESIS PREVIEW

This thesis reviews the solution process of decreasing the thermal energy

consumption of malt drying. Its initial, unsuccessful efforts to it final

achievements are described. The hypotheses that spawned the productive

experimental work initially focused on temperature-based thermal energy

savings. The realization that the falling-rate drying period offers its own unique

mechanism, which can be exploited, came considerably later. In the spirit of

illuminating what worked as well as what did not work, Chapters II and III

consider the unfruitful attempts at energy saving. Chapter II summarizes an

attempt to estimate average malt moisture contents in-process at a GWM kiln.

The analysis is based on psychrometrics using temperature, and relative

humidity where necessary, measurements at single points in each level of the

kiln. Chapter III looks at the determination of parameters for a simple wetted­

surface drying model. The model calculates average moisture content as well as

temperature and humidity of the drying exhaust air. Chapter IV reviews the

development of an adsorbed-liquid diffusion model that was made by Bala

(1983). The model inspired the airflow schedules tested in malt drying

experiments. Chapter V describes the research malt drier used for drying

experiments. Drying temperature and airflow experiments are presented in

Chapter VI. Chapter VII compares the moisture content and grain temperature

results of diffusion model simulations with malt drying experiments. Finally,

Chapter VIII summarizes the results and conclusions of the thesis.

CHAPTER II

IN-PROCESS MOISTURE CONTENT ANALYSIS

OVERVIEW OF COMPARTMENT HOUSE KILN OPERATION

In-process malt drying measurements were made at a kiln at GWM. The

results were used to determine each bed's drying curve (a graph of a substance's

moisture content versus time) and to analyze whether the method was reliable

for in-process moisture content estimation. A two-deck kiln, called the

Compartment House, was used for the measurements because these kilns

produce the majority of the company's malt. Figure 2 shows the layout for a

two-deck kiln, with numbered points for future reference .

• #=Reference Location T=TemperaL1re

Sensor R=Relat1vp

Hurrndity Sensor ·---'-----,

• Direction ' of airflow

bl

i ----~---U _ ---i'- - - - ;/~Malt Bed i . . . -------+---

l T 3 _...-/

~ - - - - ----~-:::-- .~ :

_j_ ____ ~~~-1-~ • I • [

• I •

I

·"J / ---+-Hot -Air T ...., : Bypass

T l R

' ~Cold-Air

Bypass

L Heat Exchanger

Figure 2. Compartment House Kiln Schematic.

11

The two-level kiln draws air from the outside, point 1, into the heat

exchanger, and heated air at 2 is used to dry both beds, which are supported by

perforated floors. Hot-air bypasses (HABs) are opened to let heated air at 2

bypass the lower deck to concentrate drying on the upper deck. HABs are

usually open while cold-air bypasses (CABs) are shut, and vice versa. CABs are

opened to allow outside air to enter the kiln at 3 to limit the drying temperature

of the upper deck malt, so it, which is moister than the lower-deck malt, is not

heat damaged.

METHOD OF MOISTURE CONTENT ESTIMATION

Moisture content estimates were made with the temperature data taken

from single points at each level in the kiln and the relative humidity data taken

at the inlet to the heat exchanger and at the inlet to the roof blower. (See Figure

2). The air absolute humidity was calculated using psychrometric relations, and

the airflow was estimated through the lower and upper decks. These

calculations required several assumptions, which are listed below, to completely

determine all the necessary variables.

The assumptions used in the moisture content determination were as

follows:

1. No heat is transferred between the drying air, the malt, and the

kiln structure. Only moisture transfer is considered.

2. Each bed is at a uniform moisture content.

3. Air pressure changes between the numbered points in Figure 2

are negligible.

12

4. Outside air flowing through the CABs does not go through the

hot-air bypasses to point 2.

Using the above assumptions, the drying rates for the lower and upper

decks were estimated using the temperature and relative humidity sensors

shown in Figure 2 and knowledge of the airflow through the heat exchanger.

Then the malt drying rate was found by a simple mass balance on the airflow

moisture. Analyzing the drying rates was complicated by the CABs. However,

the assumptions allowed the conditions to be determined at all the numbered

points. Temperature, relative humidity, and absolute pressure at any point

determine the absolute humidity (referred to as 'humidity' in the rest of this

work) and all other properties of the air.

At point 1, the temperature and relative humidity were known. The air

humidity was constant from 1 to 2, thus allowing determination of the moisture

content of the air entering the lower bed. Two different methods, which depend

on the state of the HABs and CABs, were used to determine the humidity at 3.

The four possible states for the HABs and CABs are listed below.

Case A: HABs and CABs both closed.

Case B: HABs open and CABs closed.

Case C: HABs closed and CABs open.

Case D: HABs open and CABs open.

For cases A and B, the drying air enthalpy was assumed constant from 2

to 3, allowing the air humidity at 3 to be calculated from the enthalpy and

temperature of the air at 3.

For cases C and D, the drying air enthalpy is not constant from 1 to 2. It

was necessary to resort to the assumption that the drying air enthalpy remains

constant from 4 to 3. Then the air humidity at 3 was calculated from the

13

enthalpy and temperature of the air. Although outside air from 1 adds to the

airflow at 3, the only airflow that gains humidity is the airflow through the

lower bed, allowing one to ignore the airflow through the CABs and to calculate

the drying rate of the lower bed by a moisture mass balance on the airflow

through the heat exchanger. The method for cases C and D may also be used for

cases A and B to reduce the chance of using the wrong method.

Given the airflow through the heat exchanger, the airflow through the

upper deck was estimated. When the CABs are open and outside air bypasses

the lower deck, the amount of the bypass air can be calculated from an energy

balance using the enthalpy of the outside air, the enthalpy of the air from the

heat exchanger, and the enthalpy at 3 (which is equal to 4). When the CABs are

closed the airflow through the heat exchanger is the same as the airflow through

the upper deck. So, with the airflow through the upper deck known, the

enthalpy at point 3 was set equal to the enthalpy at 4, the humidity at 3 was

calculated, the humidity at 4 was calculated, and the upper-deck drying rate was

found. Equations (in English units) to calculate air conditions required for each

deck moisture content estimate are given in the Appendix.

The airflow through the heat exchanger was estimated by doing an

energy balance on the hot water and the airflow through the heat exchanger.

Since the energy input of water into the heat exchanger, and the temperature

difference of air through the heat exchanger, is measured, the mass flow of air

required to remove the energy from the water can be calculated. Airflow was

checked using a vane-anemometer to measure at the air inlets under the heat

exchanger, at the inlets to the roof fans, and at the leaky grain chutes in the roof.

The measurements were converted into mass flow rates, and they agreed within

14

1.7%. They also typically agreed within 8.6% with the airflows calculated from

the heat exchanger energy-balance method.

The lower and upper-deck moisture content estimates from the method

described above did not turn out to be accurate, with the lower-deck estimates

often going considerably into negative moisture contents. This may have been

partly due to the fact that all moisture content estimates depended on the initial

value of the bed moisture content, which was estimated by a one-point

measurement for the upper and lower decks. Accuracy may also have been

limited by using only one-point for each level of the kiln for the estimate of air

enthalpy and humidity. Since this method did not provide any good

information, it was not followed up with any large-scale energy tests.

TYPICAL PROCESS THERMAL ENERGY CONSUMPTION

The basis for comparison of drying thermal energy efficiency used in this

work is energy per mass of finished malt. The energy considered was the

thermal energy required to heat air from the ambient temperature to the drying

temperature. The total thermal energy consumption, Q, to dry malt can be

estimated by

t1

Q -fm ·C ·(T -T )·dt - air pa a ambient • (1)

0

Where

t1 = total drying time,

mair =airflow (mass/time),

Ta =drying air temperature,

and

15

Tambient = ambient air temperature.

Estimates for energy consumption were made from two-deck kiln data

that was available from June through September 1994, and which showed an

average of 3.2 MJ/kg of malt. This value is lower than the average of 3.9 MJ/kg

in the U.K., mentioned by Bala (1984). The difference in values may be

attributed to the fact that two-deck kilns are typically more efficient than one­

deck kilns, which were also included in the U.K. average. Also, the average for

the GWM kiln was only for summer months, which means the average thermal

energy input to the drying air was lower than that for the other seasons.

Calculations were made by the author that estimated the minimum

thermal energy to dry malt from 46% to 4%, w.b. to be 2.1 MJ/kg. The

minimum thermal energy can be considered to be the baseline case against

which all other drying energy requirements may be measured. It was calculated

assuming:

1. Water heat of vaporization from malt, Lm•lt' = 2370 :~,

2. An average malt temperature of 54.4 C during evaporation,

3. Malt is heated from 26.7 C to 82 Cat an average moisture content of

31% w.b.,

4. An average specific heat of malt, c , = 2.928 kJ . pg kg

The minimum thermal energy per mass of malt includes the latent and sensible

heat required to dry the malt and heat it from the initial to the final temperature.

16 CONCLUSIONS

Two-deck malt drying moisture content estimates made by measuring

temperature at one point per drier section and relative humidity at the drier inlet

and outlet are not accurate enough to use for drier control or dri.er efficiency

studies. The minimum estimated thermal energy to dry malt from 46 to 4% w.b.

moisture content is 2.1 MJ/kg. This estimate would never be achievable in

practice, though it shows that current drying efficiencies can be improved.

The drying moisture content data from the upper deck was used to

develop a wetted-surface drying model. It was hoped that the model would

closely predict the overall drying response of the kiln since the high initial

moisture content of the malt causes it to dry like pure water. The model

development is described in Chapter III.

CHAPTER III

WETTED-SURFACE MODEL

The wetted-surface drying model's development was motivated by the

desire to make a simple model of average malt moisture content as well as drier

exhaust air temperature and humidity. Using data directly from industrial malt · ·

drying in the local kiln, it was hoped that the model would closely predict the

average malt moisture content estimated as in Chapter II, at least for the upper

deck. Its use in this work was motivated by the need to estimate efficiency

improvement by changing drying temperature.

Only average properties of a malt bed were modeled. The malt bed was

assumed to be a point of malt that had the average moisture content and

temperature of the bed. Outside air temperature and humidity, drier airflow,

initial malt moisture content, and target moisture content were the inputs to the

model. The model was coded in Microsoft Excel 4.0 macro language and is

listed in the Appendix. Average malt moisture content, malt temperature, drier

exhaust air temperature and humidity, and cumulative thermal energy were

calculated. Heat transfer between the drying air and the malt was assumed

negligible, and only evaporation from the malt to the air was considered,

although the malt surface temperature was increased as necessary to be in

thermal equilibrium with the air at the malt surface.

A desorption isotherm for malt was the basis for determination of the

drying rate. Desorption isotherms, which are for a substance undergoing

18

dehydration, plot the equilibrium air relative humidity for the substance against

the moisture content of the substance. The isotherm data is found by fixing the

relative humidity and temperature of the air surrounding a sample of the

substance, then waiting for the substance's moisture content to come to

equilibrium with the surrounding air, and finally measuring the moisture

content of the substance. A desorption isotherm is made at a constant

temperature for a succession of decreasing air relative humidities. Several

graphs are made for a substance at various air temperatures. Equilibrium

relative humidity typically increases with increasing temperature. For the

wetted-surface model, however, only one desorption isotherm from Briggs

(1981), for malt at 36 C, was used.

DERIVATION OF MODEL PARAMETERS FROM COMPARTMENT HOUSE DATA

The model was developed using upper-deck drying-rate data from the

local kiln during the constant-rate drying period. The drying rate for the upper­

deck was found as in Chapter II. The drying air water vapor density was found

using the air's water vapor pressure, temperature, and the ideal gas law. Malt

surface water vapor density was found using the malt surface vapor pressure,

temperature, and the ideal gas law. The convection mass-transfer equation was

solved for the product of the mass-transfer coefficient and the total grain surface

area ( hmA ). The convection mass-transfer equation is given by

ID water = h m A(p surface - P w) (2)

where,

ritwater = rate of evaporation of water for the upper deck,

h = convection mass transfer coefficient, m

data:

A= total grain surface area of the upper deck,

Psurface = malt surface vapor density at the upper deck's average moisture

content,

p<XJ =drying air vapor density.

19

The following assumptions were used in developing the model from kiln

1. The malt temperature is assumed equal to the temperature of

the air at its surface, where the air has the malt equilibrium relative

humidity and has the enthalpy of the drying air

2. The malt equilibrium relative humidity is given by the malt's

desorption isotherm, for 36 C, as a function of the bed moisture

content.

3. The drying air vapor density is taken as the log-mean value of

the vapor density of the drying air into and out of the upper deck.

4. The entire upper deck of malt is assumed to be at the same

moisture content and the same temperature.

5. There is no heat transfer between the drying air, the malt, and

the kiln structure.

In assumption one, the thermal equilibrium statement is true to a close

approximation (Bala 1983). The second assumption is used in the calculation of

the malt surface vapor density. It states that the malt moisture content

instantaneously comes to equilibrium with the drying air, which is not likely,

though it is necessary for this crude model. The third assumption is reasonable,

though not well tested. The log-mean drying air vapor density mentioned in the

third assumption is given by

20 Pw2 -p,Pl

surface · In __J>urface

(p -Poo)LM = (p -Pw1J

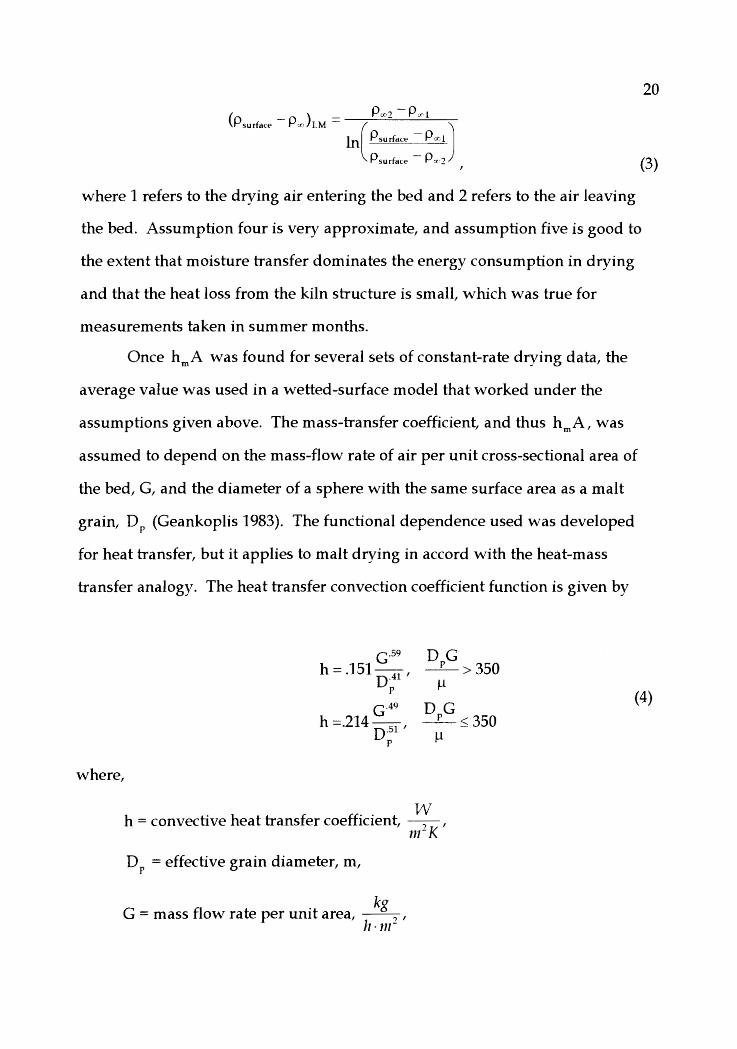
P -p:x.') surface - (3)

where 1 refers to the drying air entering the bed and 2 refers to the air leaving

the bed. Assumption four is very approximate, and assumption five is good to

the extent that moisture transfer dominates the energy consumption in drying

and that the heat loss from the kiln structure is small, which was true for

measurements taken in summer months.

Once hmA was found for several sets of constant-rate drying data, the

average value was used in a wetted-surface model that worked under the

assumptions given above. The mass-transfer coefficient, and thus hmA, was

assumed to depend on the mass-flow rate of air per unit cross-sectional area of

the bed, G, and the diameter of a sphere with the same surface area as a malt

grain, DP (Geankoplis 1983). The functional dependence used was developed

for heat transfer, but it applies to malt drying in accord with the heat-mass

transfer analogy. The heat transfer convection coefficient function is given by

where,

G.59 D G h=.151~, _P_>350

DP µ

G.49 D G h =.214-

51, _P_ ~ 350

D· µ p

h = convective heat transfer coefficient, v; , m-K

Dr = effective grain diameter, m,

G = mass flow rate per unit area, ~, h·nr

(4)

µ=viscosity of air, l!.8_. h·m

WEITED-SURFACE MODEL SOLUTION SCHEME

The model determines the malt bed's average moisture content, the malt

21

temperature, the drying air exhaust temperature, and the drying air humidity.

The solution process starts by calculation of the following drying air properties:

humidity, enthalpy, wet-bulb temperature, partial pressure of saturated water

vapor at the drying air temperature, and actual partial pressure of drying air

water vapor. Exhaust air temperature is initially assumed to be the wet-bulb

temperature of the drying air. The malt equilibrium relative humidity, rhmalt, is

found from a curve-fit equation of the desorption isotherm. The equation, a

curve-fit with a third-order polynomial to a desorption isotherm (at 36 C) from

Briggs (1981), is given by

rh __ -0_._02_7_2_· M_:_+_0_.7_5_6 l_·_M_~_+_0._3_73_5_· _M_w + 0.9431 malt - 100 (5)

where Mw is given as a percentage and rhmalt is given as a decimal. The malt

equilibrium relative humidity actually is scaled such that it declines from 100%

relative humidity when the moisture content falls below 30% w.b. Using the

desorption isotherm, however, the equilibrium relative humidity remains at

100% until the moisture content falls below 19% w.b. The scaling is necessary to

make the model agree with kiln data, at least down to the 30% w.b. moisture

content range.

For the first time step, the partial pressure of the exhaust air water vapor

is initially guessed equal to 98% of the drying air's saturated partial pressure of

22

water vapor. For subsequent time steps, it is initially guessed equal its

previously calculated value. For each time step, the new malt temperature is

guessed, using assumption 1. The new partial vapor pressure at the surface of

the malt, and the new partial saturated-vapor pressure (at the malt temperature)

are calculated with the malt temperature guess. Then an iterative routine, which

seeks the new value of the malt surface vapor pressure and the new exhaust air

temperature, is performed.

The two primary unknowns in the iterative routine are the exhaust air

humidity (given by the partial pressure of the exhaust air water vapor) and the

drying rate of the malt bed. Each must be solved in order to find the other, since

the partial pressure of water vapor in the exhaust air, Pw,ex, is required to solve

eq. (3) and it is required to find the exhaust air humidity. A Newton-Raphson

root-finding search is made for Pw,ex such that the drying rate given by the

convection mass transfer equation equals the drying rate given by a moisture

mass balance on the airflow into and out of the malt. The function, g, for which

the search seeks a zero, is expressed as

g(pw,eJ = hmA· (Psurface -PwhM - mair · (H2 -Hi), (6)

After Pw,ex is found, the exhaust temperature and humidity are

calculated, and the malt moisture content is updated. The updated malt

equilibrium relative humidity is found. Malt temperature is calculated, using

assumption 1. The iterative routine is repeated until the iteration updates for

malt surface vapor pressure and exhaust air temperature converge to a set

criterion.

After the iterative routine succeeds, the exhaust air humidity is found, the

new moisture content of the malt is calculated using the amount of moisture

evaporated, the thermal energy consumption is solved, and the new equilibrium

relative humidity of the malt is found using the malt moisture content and the

desorption isotherm. The solution process is repeated until the target moisture

content is reached.

MODEL SIMULATION RESULTS

23

The model indicated higher thermal efficiency for drying during the

constant-rate period using increased temperatures. Thermal energy savings up

to 50% were realized when drying at a constant 99 C as opposed to typical

industrial drying schedules that only reach 83 C for several hours. The model

did not fit the drying data taken from the local malting company well, and it

tended to predict drying rates at low moisture contents that were much higher

than found in typical kilns. Although efficiency improvements from higher

drying temperatures were possible, the model did not reveal the maximum

possible constant drying temperature that would produce malt of an acceptable

quality. Since the model also did not include an internal malt drying

mechanism, it was necessary to consider a more sophisticated model, which led

to the use of the model described in Chapter IV.

CHAPTERN

ADSORBED-LIQUID DIFFUSION MODEL

In order to develop potential energy saving methods in an efficient and

direct fashion, a mathematical model of malt drying based on internal moisture

diffusion was coded and developed for this study. The model was derived by

Bala (1983), and reported in Bala (1984), from thin-layer drying experiments in

which a layer of malt less than two kernels deep was dried on a scale. The

drying air temperature was assumed equal to the malt temperature in the thin­

layer experiments, and the drying model equations were fitted to the data. The

program's algorithm is in the form of Bala's "model one," which uses a style of

grain drying simulation developed at the University of Michigan. The

properties of the malt varieties Triumph and Sonja were used to develop the

model. These malts are classified as two-row, as opposed to six-row, in

reference to the way they grow on the stalk of the barley plant.

MODEL OVERVIEW

Model one uses the solution sequence of Bala (1983). The Turbo C version

3.0 source code of model one is listed in the Appendix. A system of partial

differential equations model changes in malt temperature, moisture content, and

drying air temperature and humidity through the depth of a bed. A finite

difference scheme using a number of horizontal layers is used for the solution of

the system of partial differential equations because there is no known closed­

form solution. Typically, one-hundred layers were used with model one for a

typical deep bed thickness of malt.

25

Input to the model consists of a sequence of ambient air temperatures,

relative humidities, drying airflows and temperatures versus time. The other

input includes initial malt moisture content and temperature, and the depth and

density of the bed. The model output includes the moisture content, air and

grain temperature (and humidity) at each layer, the exhaust air temperature and

humidity, the average bed moisture content, and the depth of the bed (taking

into account shrinkage).

The solution of the layer variables begins at the bottom of the bed and

propagates up through the layers. Heat transfer between the malt and the

drying air is included. No heat transfer between the malt and the kiln, or the air

and the kiln, is considered. An equation that models deep-bed shrinkage as a

function of moisture content adjusts the layer thickness after each time step to

improve the model's accuracy. The maximum relative humidity of drying air

allowed is 98%, to avoid instability as well as impossible relative humidity

conditions. When the drying air relative humidity for a layer goes above 98%, a

condensation routine is performed which recalculates the amount of evaporation

until the relative humidity drops to 98% or less.

Moisture is modeled as an adsorbed liquid, that is, as water chemically

held to the malt. The drying rate is found using an equation typically used in

grain drying models because it is easy to solve and gives reasonable results.

This equation, the "single-exponential" drying rate equation, may be expressed

as

M =ae-kt +M e (7)

26

where,

M = moisture content, % ,

a = constant,

k = drying constant,

Me= dynamic equilibrium moisture content, % .

An equivalent expression is

dM = -k(M-Me). dt

(8)

Equations (7) and (8) implicitly assume that the moisture within each grain of

malt is uniformly distributed. The dynamic equilibrium moisture content differs

from the equilibrium moisture content described in Chapter II in connection

with the malt desorption isotherm. Since there is not enough time for the malt to

come to equilibrium with the drying air because the malt moisture content is

changing relatively quickly, the dynamic equilibrium moisture content was

hypothesized by McEwen (1954) to make the drying rate equation fit thin-layer

drying experiments better.

PARTIAL DIFFERENTIAL EQUATIONS

The equations of this section are as derived by Bala (1983). Using the

variables for updated values of drying air temperature, drying air humidity,

malt temperature, and malt moisture content, the equations consider a thin

horizontal layer in a malt bed. A schematic diagram of the malt layer is shown

in Figure 3.

Air cond1t1ons from current L:iver

l _L_~I ---.--' dz _J •

r Au conditions from

z prev1ous L:1yer

Figure 3. Control Volume of Malt and Air in Deep Bed Layer.

Mass Balance Equation for a Control Volume

27

The statement of conservation of moisture mass for the control volume

with air flowing vertically through it is

moisture loss of malt = moisture gain of air.

This is given as an equation by

pdh ·dz{- a:J.dt =G·dte~}dz,

or in finite difference form,

Drving Rate Equation

aH - Pdb ( aMJ ---• -- I az G at

Liz LiM LiH = -pdb. G . Lit .

The drying rate is given by eq. (8), and in finite difference form, by

(9)

(10)

28 ~M=-k·(M -M )·~t flt e

t+-2

= -k.((M+ ~)-M.)-At k

~M·(1+ 2 ·~t) = -k·(M-Me)-~t

where the subscript t+ ~t indicates the average value of the variable over ~t. 2

The final form is

Heat Balance Equation

~M = -k-(M- Me)- ~t k

1+-·~t 2

The statement for energy conservation for a control volume with air

flowing vertically through it is

(11)

change in enthalpy of air flowing through control volume = - change in grain enthalpy.

This analysis neglects the change in enthalpy of air stored in the control volume.

The equation form of the heat balance equation is given by

G-dt·dh =-p ·dz·dh a db g I

or in finite difference form, by

G · ~ t · [ (ha + flh a) - ha ] = -[ P db · ~z · ( ( h g + flhg ) - h g)] ;

G·~t-[(cpa ·(Ta +~TJ+cpv ·(H+~H)·(Ta +~TJ+La ·(H+~H))­

( C pa · Ta + C pv · H · Ta + La · H] =

(12)

-pdb ·~·[(Tg +~Tg)·(cpg +cP1 ·(M+~M))-Tg ·(cpg +cr1 ·M)]. (13)

Substituting for LlH from eq. (10) into eq. (13), rearranging, and then solving for

fl Ta /

29 -p · flz [ ] db . ~ T . (c + c · (M + ~M)) - ~M · (T · c + L - T · c ) G . i'.l t g pg pl a pv a g pl

Ll Ta = Llz LlM c +c ·(H-p ·-·-)

pa pv db G dt (14)

Heat Transfer Rate Equation

The statement for the heat transfer rate to a control volume around a thin

horizontal slab of air and grain is

heat loss from air to grain = gain in sensible heat of grain + gain in enthalpy of

evaporated moisture.

This is given in equation form as

hcv ·dz· (Ta - Tg) · dt = Pdb ·dz· dhg + Pdb ·dz· (-dM) · dhmoisture. (15)

In finite difference form, we have

h ·flz·[(T + ilTa)-(T + ~TgJl.ilt = p ·Llz·LlT ·(c +c ·M)+ CV a 2 g 2 J db g pg pl (16)

P ·Llz·(-LlM)·(L +c ·T -c ·T )· db g pv a pl g '

2-(Ta -Tg)+(ilTa -ilTg) 2· Pdb [ = · ilTg -(cpg +cP1 • M)-hcv. ~t

~M-(Lg +cpv ·Ta -Cpl· Tg)].

Setting

e = 2-(Ta -Tg),

<f> = c pg +cpl · M,

y =Lg + crv ·Ta - cP1 • Tg,

then

ilTa = -e+~Tg -(1+ 2·pdb ·<f>)- 2·pdb ·ilM·y. h . Llt h . Llt

CV CV (17)

30

Setting

m =c +c ·(H- Pdb ·'1.z '1.M pa pv G ·Af)'

K-c T L - pv · a+ -T ·C a g pl I

and substituting into eq. (14),

-p . L1z [ ] L\Ta = db · .1.Tg -(<j>+cP1 ·L\M)-'1.M·K. G ·co· Lit

(18)

Equating eqs. (17) and (18) and solving for i1. Tg,

L\Tg

P db • L\M ( 2 · y L\z · K) 8+ . -+--L\t hcv G · (J)

- 1 + P db J 2. 4> + L1z -( 4> + c . L\M)] L\t l hcv G. (J) pl

(19)

MALT PROPERTIES AND DRYING RA TE EQUATION

Equations for malt properties and drying rate are based on Triumph and

Sonja varieties, as determined by Bala (1983). The specific heat capacity of malt

is given by

cpg = 1.651+0.04116 · Mw, r 2 = 0.99, (20)

where Mw is set as a percentage and r is the correlation coefficient for the

equation.

The volumetric heat transfer coefficient equation is

hcv = 4.932x10⁴ ·G6906 I r 2 = 0.9. (21)

The deep bed malt depth percent shrinkage is

S = 15.91 · {1-exp[-0.0996·(Mwi -Mw)J}, S.E.= 0.6871, (22)

31

where Mwi and Mw are set as percentages. S.E. is the standard error of

estimate.

The heat of vaporization of water evaporating from the malt, L malt, is given by

Lmalt = 1+0.5904 · exp(-0.1367 · M), r2 = 0.99, Lwater

(23)

where Lwater is the heat of vaporization of water evaporating from pure water

and M is set as a percentage.

The drying constant, used in the single exponential equation, is

[ -6820 J r2 = 0.96. k = 1.196x10

7 ·exp Ta +273.15 '

Dynamic equilibrium moisture content, Me, is found from

[ -37360 ] ? In (rh) = ·exp(-0.2999·M ) , r = 0.84,

R0 ·(Ta + 273.15) ew

or, equivalently' 10. 47 In ( _8_315 . (T, + 273.15) · In ( rh))

Mew= 0.2999

where Mew is given as a percentage and rh is given as a decimal value.

MODEL ONE PROGRAM STRUCTURE

(24)

(25)

For each layer, the solution process starts by calculating k (drying

constant) and Me (dynamic equilibrium moisture content) for the given Ta

(drying air temperature) and rh (drying air relative humidity). ~M (moisture

content change) of the malt is calculated using the old moisture content (M), Me,

and k. ~Tg (grain temperature change) of a layer is calculated using the old

moisture content (M), the old drying air temperature (Ta), the old grain

temperature (Tg ), and ~M. ~Ta (air temperature change) for the layer is

32

calculated using the old grain temperature (Tg ), ~Tg, the old air temperature

(Ta), the old moisture content (M), and ~M. H (drying air humidity) is updated

using ~M. If rh (drying air relative humidity) is above 98%, the condensation

procedure is performed. In the condensation procedure, ~M is incrementally

reduced until the updated rh is less than 98%.

When the calculations are complete, layer variables for H, rh, Ta, Tg, and

M are saved. The solution process is repeated for the next layer up, and after the

last layer is solved, the program calculates the average bed moisture content and

the new bed depth after shrinkage. Time is incremented and the layer solution

process continues until the program end criterion is met. The end criterion is

always met when the simulated drying time exceeds the maximum set point

time in the array of ambient air temperature and relative humidity. Also, the

end criterion will either stop the program when a particular target moisture

content is reached or when a minimum moisture content change limit is not

achieved, depending on the user's preference.

Fan and Thermal Energv Calculations

Fan input energy is estimated for a kiln with a variable-speed fan drive.

The estimate is made using data from the BP A (1992) for the ratio of fan power

input to maximum fan power input, as a function of the ratio of airflow to the

maximum airflow. The maximum fan power input was taken from in-process

electrical measurements at GWM and checked against fan data tables. A fourth­

order polynomial was fitted to the fan input power ratio (P / P max ) versus the

airflow ratio (G/ Gmax ). The total fan input energy, Wfaninput (kWh), is found

from

where

t1 ( G J wfaninput = Z: f -- · Pmax · l1t, t=O Gmax

f( ) = fan input power ratio function (PI p max),

G = mass flow rate/ unit area,

Gmax =maximum G for given fan and system,

P = input power to fan at an airflow of G,

Pmax =input power to fan at Gmax,

.L1t = time increment,

tl = time at which wfan input is calculated.

The total thermal energy Q is calculated by an energy balance on the

drying air. This is given by

where

t1

Q = L rilair ·(ha - hambient air)· .L1t' t=O

rilair =total mass flow rate of air through the drier,

ha= enthalpy of drying air before entering the bed,

hambientair =enthalpy of ambient air.

THERMAL ENERGY STUDY AND RESULTS

33

(26)

(27)

Different drying schedules that decreased airflow following the

completion of the constant-rate drying period were tested and the energy

consumption was evaluated. The airflow reduction strategy was chosen to take

advantage of the malt's internal drying mechanism, which dominates the drying

process during the falling-rate drying period. Several tests were made with

34

model one to show the potential for thermal energy savings. Model batch A,

shown in Figure 4, is the baseline case that simulates constant-temperature,

constant-airflow drying. The airflow and the ambient conditions for Model

batch A were taken from the experimental batch 3 (discussed in Chapter VI).

'Heat' refers to the cumulative thermal energy per kg (finished malt) to dry the

malt. The simulated energy consumption per kg of finished malt was 3.4 MJ/kg.

90~~~--.-~~~~~~-r-~~~~~~~~~~~~--..~~~~~~~~~--.-

SO+""lk--~-'-~~~~~~-+-~~-+-~-

70+-~~--l'Ollc--~-----t-~~~~~~+--~~--~~-----t-~~--+~~~+--~~--'---~~-j

5 -bO

$ ;:

~ 4i "O 60 .::

~ -~ -~ 0 f 50 3 ;; c: 0 -

~~ ffe ~ E ~ 2~ ·::: '.'lO -" ~ . ;

0 ti:

201 ~ ~

10 I ~ ............... I

3 4 5 7 9

Time (Hours)

Figure 4. Model Batch A Thermal Energy to Dry.

The next tests used some form of airflow reduction after the constant-rate drying

period. Model batch B, Figure 5, had a linear airflow reduction from 0.57 to 0.24

kg/ m 2 /s, starting at hour 3 and ending at hour 6, and its energy consumption

was 2.78 MJ/kg. Model batch B took 13 hours to reach the minimum moisture

content change limit, whereas A took 10 hours. The 'Heat' curve for B changed

slope from hour 3 to hour 6 due to the linear airflow reduction.

Drying Temp: 71.1 C 90 6

80

70

5 till s.

:E' ~ "O 60

~ 4 ]

f 50

= .......

0

0

3 ; v 40 ~ ~ E ·5 30

< e 2 tit

~ ~ ~

20 0 i::

1

10

4 8 10 12 14

Time (Hours)

Figure 5. Model Batch B Thermal Energy to Dry.

Model batch C, seen in Figure 6, used a more aggressive airflow reduction,

going from 0.57 to 0.2 kg/ m 1 / s between hours 3 and 6, and from 0.2 to 0.08

between hours 6 and 13. The energy consumption for model batch C was 2.37

MJ/kg. Batch C required 14 hours to reach the minimum moisture content

change limit. Compared to A and B, C's 'Heat' curve ended up with a very

shallow slope.

90 Drying Temp: 71.1 C

80+-"'k-~~~~~~Olt--+~~~~-t-~~~~--r-~~~~-.-~~~~;---~~~--j

70 -----l

:E' "O 60

~

6

5 -bC

$ ~

4 '.; ~

f~I ~, = : 0 ~40 !

3 ~ ~ I He"' ffe ·5 30 I S ~ 2 tit

~ ~ 0 i::

201 ~ ~ I

1or-~~~flll'-~~~~~~~___:_

4 10 12 14

Time (Hours)

Figure 6. Model Batch C Thermal Energy to Dry.

""

35

36

The model-based tests show an energy savings trend with larger amounts

of airflow reduction. They unfortunately also show a considerable increase in

time required to reach the minimum moisture content change limit as the airflow

reduction becomes more marked. Model verification required comparison with

other malts and drying conditions than those used in the model's development.

Bala's verification of his model was limited to constant airflow experimental

tests. He compared data from experiments with model simulations, and the

comparison was very good, probably within 2 to 3% for the average moisture

content and the grain temperature.

Energy saving methods also required experimental tests to check the

finished malt for quality before attempting any industrial-scale trials. Thus malt

drying tests were performed to investigate the effects of temperature and airflow

changes on the thermal energy consumption required to dry malt, as well as to

determine if changes in the drying process would produce acceptable malt

quality. Chapter V describes the research malt drier setup used in the next

phase of this thermal energy investigation.

CHAPTERV

RESEARCH MALT DRIER

Quality concerns and verification of model one required the design and

construction of a research malt drier. Its function is to perform energy savings

tests on a small-scale that mimic the performance of a large-scale industrial

drier.

DRIER DESCRIPTION

A layout of the whole drier system is shown in Figure 7. Not all sensors

are shown.

Duct hPl:llPr

Differer:trnl pressure transducer -

Dan;pPr /Mot or ~

Blowe1 ~. '. ~~~

Orifice plate flow meter -

SCR Power Controller

D f

FanhoL _____, l

I

,-- Flexible connector

,I L/1

I I I I I J

Figure 7. Drier System Layout.

Orvin~ Secl1on

38 Drying Section

The malt is supported in a 0.3 m diameter, 0. 92 m long PVC pipe by a

perforated aluminum plate. This section, the drier chamber, is shown in Figure

8. The drier section is insulated with 2.5 cm thick Armaflex AP insulation to

minimize thermal loss. The drier chamber is attached by a flange at the bottom

to the drier plenum, and at the top to the exhaust tube. The exhaust tube, 0.53 m

long, forms a controlled space for measuring exhaust air temperature and

relative humidity. Heat loss, however, causes air temperature measurements in

the exhaust tube to be 5 C or more below the reading of the 0.7 m grain

thermocouple (see Figure 9) when the malt bed temperature has approximately

reached the drying air temperature. The source of the heat loss was not

determined, so the drier exhaust temperature could not be used for drying

schedule optimization with respect to thermal energy consumption.

Thermocouple and relative humidity sensor positions are shown in Figure 9.

The drying air temperature is measured just below the malt in the drier plenum.

The drier plenum functions to mix the drying air and ensure that it is all close to

the same temperature for accurate control of the drying temperature.

r~I

Figure 8. Photo of the Drying Section of Malt Drier.

0.7m r 0.3m

I 0.5m O.lm

!

T ai RHai

- Malt bed

z

• I

E;::=:=:===~ ·. - Perforaled plale

0 Sensor locator T=Thermocouple RH=Relative

humidity sensor

Figure 9. Drying Section Sensor Location Schematic.

39

40

The drier plenum is supported by an AND FG-150K digital scale, which is

used to sample the weight change of the malt for moisture content estimates.

Drier exhaust air is removed from the lab through a fan hood, which also

supports wires for thermocouples. The thermocouples measure malt

temperature and drier exhaust temperature.

Heating System

Air is heated through a bank of resistance heating elements in a

removable 4100 W, 480 V, 3-phase duct heater. The heater is powered by an

Athena SCR power controller, which varies power input to the duct heater by

the zero-voltage switching method. Figure 10 shows the duct heater section.

Figure 10. Duct Heater Photo.

41 Blower System

Air is taken from the room through a centrifugal blower, which produces

a maximum pressure difference of 25 kPa. Refer to Figure 11 for a photo of the

blower. A square damper and a damper motor regulate the airflow. A 7.62 cm

(3 in.) schedule 80 pipe, which is 1.47 m long, with a 7.27 cm (2.864 in.) internal

diameter follows the damper. The pipe connects to a sharp-edge orifice plate by

means of a Van-Stone flange. In this discussion, 1-D refers to 7.27 cm (2.864 in.),

which is the internal diameter of the 7.62 cm (3 in.) schedule 80 pipe. A flow

straightener made of a bundle of 1.27 cm (0.5 in.) copper tubing that is 2-D long

is positioned a minimum distance of 8-D from the upstream face of the orifice

plate. This straightener installation is recommended by ASME (1971) for

flowmeter installations downstream of a pump. The orifice plate flowmeter has

pressure taps located 1-D upstream, and 0.5-D downstream, of the upstream face

of the orifice plate. The taps are connected to a differential pressure transducer.

The equation, used in the control system, to calculate the mass flow rate of air as

a function of the differential pressure measured across the orifice plate is

developed in the Appendix. A 5-D length of the 7.62 cm pipe is located

downstream from the orifice plate, as suggested by ASME (1971). Following the

pipe are a duct heater enclosure, a 15.2 cm (6 in.) diameter flexible connector,

and a sheet metal duct. Another flexible connector is used to connect the sheet

metal duct to the drier plenum inlet in order to isolate the duct from the drying

section and minimize its effect on measurement of the malt weight.

42

Figure 11. Blower and Damper Photo.

Data Acquisition

The data acquisition system consists of an 80286 PC-compatible computer

and a Keithley Series 500 Data Acquisition System. The computer samples the

malt weight from the AND scale, at a 0.05 kg resolution, using a serial

communication code (Grofton 1986). Inter-grain air temperature is measured in

the malt bed at the centerline of the drier chamber at 0.1 m, 0.3 m, 0.5 m, and 0.7

m above the perforated floor (refer to Figure 9). These measurements are made

with J-type thermocouple wire that is welded to form a thermocouple. The

thermocouple, seen in Figure 12, is covered with a perforated 2.5 cm length of

3.2 mm inner diameter PVC tubing, which was made to isolate the thermocouple

from the grain surrounding it. Up to experimental batch 14, grain temperature

was measured in the drier chamber with hypodermic needle thermocouples.

Due to failure of those thermocouples, inter-grain air temperature was measured

43

instead. Deep-bed experiments showed no temperature difference greater than

3.5 C between the internal grain temperature and the inter-grain air temperature

measurements at the same heights in the drier. Some results showed the air

temperature greater than the grain temperature, while other results showed the

opposite. The PVC shielded thermocouples were used to measure inter-grain air

temperature. The hypodermic needle thermocouples, with about six grains of

malt laced on the tips, were used to measure grain temperature. Temperatures

were sampled at two minute intervals. Positioning the two sensors at exactly the

same bed height was difficult, and the sensors were not at exactly the same

cross-sectional position, but the closeness of their measurements indicates that

the positions were not significantly different. Bala (1983) noted that grain and

air temperature are approximately equal after a warm-up period of three to four

minutes, which agrees with the thermocouple comparison. Grain temperature

and inter-grain air temperature will be considered synonymous for the

remainder of this work. Finally, air temperature and relative humidity are

measured at the inlet to the blower and in the exhaust tube just above the top of

the malt column.

.\

\

\ ~- --

I I

/

Perforated tubing

,~Thermocouple I

t. /I l I _____ ~ J ! •

I 3.2mm ID __J

--1 L_ •) -r-- ,__,,0 cm

Figure 12. Inter-Grain Air Thermocouple.

44

The control system, using the same computer and Keithley hardware as

the data acquisition system, controls the mass flow rate of air into the drier and

the air-on temperature (drying-air temperature) under the malt. The control

system software allows programmable drying schedules that can follow any

path of drying conditions desired, within the drier's limits. Proportional­

integral feedback control parameters for drying temperature and airflow were

experimentally determined (Smith 1985), using the Chien-Hroncs-Rcslvick

tuning procedure (Stefani 1994), and then fine tuned by trial-and-error.

Approximately a 4 C drying air temperature overshoot occurs at full airflow

when the drier is cold-started with a 0.57 kg/ m 2 /s air flow and a 70 C drying

temperature set point. The airflow into the drier plenum is split with a wedge at

the plenum inlet. Although the swirl induced by the wedge is meant to mix the

air for a uniform temperature throughout the plenum, the grain temperature

along the centerline of the drier chamber is typically 1-2 C above the set point.

No attempt is made to control the inlet humidity of the drying air, which

normally changes when the building ventilation system starts or stops in the

morning and evening, respectively.

DRIER PERFORMANCE AND MEASUREMENT UNCERTAINTIES

The design goals of the drier were intended to make it perform as closely

as possible to an industrial kiln. The airflow desired, with a 0.8 m deep bed of

malt at 47% w.b. moisture content and at an initial density of 638 kg/ m 3, was

about 0.7 kg/ m 2 / s. The airflow achieved in the test drier under the design

conditions was 0.57 kg/ m 2 / s. A maximum drying air temperature of 93 C at

the maximum airflow was desired. The PVC pipe used for the drier plenum,

45

chamber, and exhaust tube limited the maximum to 88 C. Moisture content

sensitivity of the scale due to the malt weight change was designed for 0.2% d.b.,

and the actual value was 0.2% d.b.

The measurement uncertainties are estimated where bias and offset errors

are known. Precision errors are not considered unless specifically noted. A total

malt temperature variation of 2 C is estimated for the malt cross-section at the

top of the bed ·when the drying temperature is 80 C. Malt temperature is

measured within ± 0.5 C using either the T-type hypodermic probes or the J-type

PVC covered probes. Thermocouple voltages were converted to temperatures

using built-in functions of the data acquisition system's software.

The moisture content error estimate during drying was made by

considering the weight offset added by the flexible connector to the drying

section. The difference in weight offset between the beginning and end of an

experimental batch was taken as the uncertainty in the weight measurement for

the batch. This error was considered a precision error. Weight offset from the

flexible connector was due to the position in which it connected to the drier

plenum and to the force exerted upon its walls by the airflow. Moisture content

estimates for batches 2-14 are estimated to be within ± 0.5% d.b., estimates for

batches 20-22 are estimated to be within ± 1.0% d.b. (due to a longer flexible

connector), and estimates for batches 24 and 25 are estimated to be within

± 0.15% d.b. (due to a shorter, straighter flexible connector).

Airflow readings were checked with a venturi flow meter, which was

calibrated by a Roots Meter. The Roots Meter calibration is NIST traceable. The

percentage differences between the airflows measured and the estimated values

are given in Table I.

TABLE I

AIR FLOW UNCERTAINTIES

Flow Set Point (kg/ m 2 /s) Estimated Percent Error(±%)

0.61 0.40 0.57 0.10 0.49 0.20 0.41 0.40 0.33 0.70 0.24 0.01

Ambient and exhaust temperatures are measured within ± 0.5 C, while

the ambient and exhaust relative humidities are estimated within ± 3% even

46

though the relative humidity sensors were calibrated and the estimated values

were fit to linear functions of the measured values. The absolute humidity

values depend on the measured temperature and relative humidity, and they are

estimated to be within ± 7%.

Thermal energy consumption estimates depend on the enthalpy

difference of the drying air and the ambient air, the mass flow rate of the drying

air, the sampling time measurement, and the mass of the malt. The main source

of uncertainty in the energy estimate was the resolution of the scale when the

malt was at low moisture contents, since at low moisture contents it took about

20 minutes for a change in the scale's weight reading to occur. This made a

significant moisture content uncertainty, causing the energy estimate uncertainty

to typically be about 2.5%, or .056 MJ/kg. The thermal energy consumption due

to drier heat loss appears to be about 6% of the total consumption for each of the

airflow reduction experimental tests. The loss levels were calculated considering

the difference between the thermal energy of the heated drying air and of the

drier exhaust air. Since the loss level appears to be a fixed percentage of the total

thermal energy used for drying, the experimental energy comparisons in

Chapter VI are not affected by drier heat loss.

The next chapter considers the malt drying experimental procedure and

the quality and thermal energy consumption results. All tests described were

run with the experimental drier considered in this chapter.

47

CHAPTER VI

MALT DRYING TESTS

To demonstrate that changes in typical airflow and temperature drying

schedules result in thermal energy savings, deep-bed malt drying experiments

were made. These experiments were performed at a laboratory in the

Mechanical Engineering Department of Portland State University. Various

drying temperatures were used for successive experimental batches. Two

varieties of two-row malt, Crystal and Harrington, were used. Barley grows

either in stalks of two or six rows, and the two-row varieties are generally larger

than the six-row ones. It is suspected that two-row barley-malts dry differently

than six-rows due to the size difference. Two-rows were preferred, since "model

one," Bala's (1983) model, is based on two-row malts. Malt quality test results

determined the maximum experimental drying temperature that produced

acceptable quality.

The maximum drying temperature, previously determined, was used

with model one to obtain drying schedule ideas for thermal energy savings (see

Chapter N). Model one approximated diffusion-controlled drying, which made

it useful in estimating the relative thermal-energy saving potential of various

airflow reduction methods. The simplest successful airflow reduction

techniques learned from model one were performed experimentally using the

maximum experimental drying temperature.

49 DRYING TEST DESCRIPTION

Both Harrington and Crystal malts were obtained from GWM, and drying

tests were started within seven hours of removal from the germination facilities.

Malt was transported in plastic bags to minimize moisture loss after the initial

moisture content estimates were made. The malt was dried in batches initially

weighing 36.3 kg, with a bed depth of 0.81 m, using the research malt drier.

While the drier was being filled, the malt was compressed to achieve the same

initial density of wet malt in each batch. The first sets of drying tests were run at

the same, constant, airflow rate and at constant temperatures. Drying

temperatures varied from 63.3 C to 86.7 C for the successive tests in each set.

The equilibrium moisture content of the malt at the various drying

temperatures and ambient humidities was unknown. Equilibrium moisture

content is the moisture content a substance reaches after it is dried at constant

temperature and humidity for an infinite (or very long) time. Practically, after a

certain drying time, the moisture content change in a substance occurs at a very

slow rate. In order to achieve a final moisture content that was close to the

equilibrium moisture content, it was decided to dry each batch until a minimum

moisture content change of 0.2% d.b. per hour was not achieved. This criterion

for drying termination was also used with the drying model, to be consistent

with the experiments. The fact that the ambient air humidity was not controlled

did not affect the comparison of the experimental results with the model results,

since each model test was run, after the experiment, using the same ambient air

relative humidity and temperature as the experiment.

All drying tests using the research drier were done without mixing the

malt during drying, although mixing is typically done in industry. Initial

50

moisture content estimates of the 'green,' or wet, malt in almost every

experiment proved inconsistent with the final moisture content given the

amount of water evaporated from the malt. This problem occurred when the

green malt and the dried malt were thoroughly mixed before sampling for

moisture content analysis, and it was always such that the initial moisture

content estimate was above (typically by 1-2% w.b.) what the final moisture

content estimate and the total evaporated mass of water would have indicated.

Final moisture content measurements were made at GWM's laboratory using a

standard oven drying method. It was assumed that the final moisture content

was more accurate than the initial moisture content, since the final value is used

when selling the malt to a customer. Thus, the final moisture content was used

as the reference point in all the estimated moisture content data, and the

moisture content at a particular time was estimated using the weight of water

evaporated from that lime until the end of the experiment.

Drying data graphs for the experimental batches are included in the

Appendix. Experimental batches 1, 7, 8, 16-19, and 23 were not included in the

data due to drier problems and atypical malt samples. Each graph contains a

moisture content estimate ('Mcdb'), grain temperatures (at '.1 m', '.3 m', '.5 m',

and '.7 m' height in the bed), and ambient air temperature ('Tamb') and absolute

humidity ('Wamb') where the descriptions shown in single quotes are the labels

used in the graphs.

Energy saving tests were performed after the constant temperature and

airflow tests. Batch 20 was a baseline test for comparison with batches 21 and 22.

It used a drying schedule with an airflow of 0.57 kg/ m 2 /sat 71 C for eight

hours, and 0.29 kg/ m 2 /s at 82 C for the remaining 7 hours. Batches 21and22

reduced airflow after the constant-rate period ended in order to save energy.

51

The duration of the constant-rate period was estimated from previous

experiments. In batch 21, airflow was reduced from 0.57 to 0.24 kg/ m 2 / s over a

four hour period, and in batch 22 the same airflow reduction was made over a

one hour period. The temperature schedule for batches 21and22 was 71 C for

10 hours, and 82 C for the final 6 hours. Figures 13 to 17 show the airflow and

temperature schedules used in batches 20-22, 23 and 24. Batches 20-22 did not

produce acceptable malt qualities. Thus, batches 24 and 25 were run with less

drying time at 82 C. Batch 24 had the same airflow reduction as batch 21. Batch

25, the baseline case for batch 24, had an abrupt reduction from 0.57 kg/ m 2 / s to

75% of that after eight hours, which is one method used in industry. 120 0.6

l:: I t 0.5 100

c 80-+ I I -----· 9 ---+ 0.4 7 ~ < e

~ 60 ~-- 0.3 ~ c... e ~

~ 40 .. 0

0.2 i:;::

20 - - ---- ----------- ----- ---- 0.1

I 0 Oj__~-,--~---.,--~----,-~~r--~,-~-::~-:~--:16 4 10 12 14

Time (Hours)

Figure 13. Batch 20 Airflow And Temperature Schedule.

lW Q6

100-+ -----------+ 0.5

1 ''J ··~· mr·~ ~ 60 .. . - - .. ·-·- ------ ----- -----r 0.3 ~

e - , -~ ~

..... I 0 ' 40 +- -+ 0.2 ti:

20-+ - 0.1

0 o~~~~~~~~~---,-~~~~~~--:-:----:16

4 10 12 14

Time (Hours)

Figure 14. Batch 21 Airflow And Temperature Schedule.

120 0.6

100

2. 80 -+ ~ ..,..___ E ~ 60 -~ c.. E !: 40 _;

20

0 4 6 10 12 14

Time (Hours)

-~ 0.5 I

0.4 ~ < E

0.3 ~ ~ ~

-+ 0.2 £

········-'- 0.1

16

Figure 15. Batch 22 Airflow And Temperature Schedule.

120 0.6

100 - .

80 _;.

··-··· ··········-'- 0.5

. -- 0.4 '"(;' ;:;i-< E

l: .2 ~ 60 - . 0.3 ~ ~ c.. E 5

. _ _;_ 0.2 u: ;: 40 +

20 -t .................. ...i 0.1

0 0+-~~~~-,-~~~~~~~~~--:~~~14 6 10 12

Time (Hours)

Figure 16. Batch 24 Airflow And Temperature Schedule.

Q ~

E ~ ~ c.. E ~

f-

120 ~~~~~~~~~~~~~~~~~~~~-~~~~~0.6

100

I 80 -i ____________ t;_._ ••. _ •. _ .•• _y: :: ~ 60 -t··

40

20 ~

0 ...

0 6

Time (Hours)

10 12

E 0.3 ~

~ 0

.. .i 0.2 :.::

·-'- 0.1

14

Figure 17. Batch 25 Airflow And Temperature Schedule.

52

DRYING TEST RESULTS

The energy and quality results for the drying tests are given here as a

means of measuring the benefits of, and disadvantages to, the various methods

of energy efficiency improvements. Experimental energy consumption in the

energy saving tests is greater than the average energy consumption measured

for the two-deck kiln at GWM. However, it is not possible to make a direct

53

comparison between the two energy estimates, because two-deck driers are

typically more thermally efficient than one-deck driers such as the one used in

this research. It is possible that the thermal efficiency of a two-deck drier may be

improved using the same method as in this work.

Energv per Ton

The thermal energy consumption refers to the thermal energy used in

heating the ambient air to the drying air temperature. It was calculated using

eq. (27) from Chapter N, which is repeated here.

t1

Q = L mair ·(ha - hambient air)· .8t · t=O

Thermal energy efficiency comparisons were made among the tests in

batches 2-6 and batches 9-12. The comparisons were set on an equal basis by

considering only the thermal energy required to dry from the minimum initial to

the maximum final moisture content found in each set of batches. This

comparison method was necessary because higher drying temperatures result in

lower final moisture contents. The resulting thermal energy per batch was

54

normalized by dividing by the weight of the batch at the maximum final

moisture content of the set. This method may err due to transient heating of the

malt bed and drier at the start-up time for the batch with the minimum initial

moisture content. This is because the batches with higher initial moisture

content already had passed some of the transient stage by the time they reached

the minimum initial moisture content of the set. However, evaporation was

occurring even during start-up, and thus the effect of the start-up period was

disregarded in the energy analysis.

Normalized results for thermal energy usage for Crystal and Harrington

malts are shown in Figures 18 and 19, respectively. It is very clear that energy

consumption drops about 20% by drying at 70 C rather than 63 C. Increasing

Crystal or Harrington drying temperatures above 70 C does not show much

efficiency gain.

Thermal energy usage for batches dried with airflow reduction was

normalized based on the final weight of the finished malt. Final moisture

contents were all within 0.27% d.b., which makes the normalization technique

reasonable. The final weight technique is more accurate than using the

maximum final moisture content method, because the moisture content estimates

for batches 20-22 were accurate only to within 0.5% d.b. Total thermal energy

was calculated for the drying time between 78.6% d.b. and the finished moisture

content.

4.5

4.0

-3.5 bO

~3.0 6. £o2.s Q,I = i;.a 2.0 -" s 1.s Q,I

..c: ~ 1.0

0.5

0.0

4.5

4.0

_3.5 bO

~3.0 £o2.5 Q,I

c: i;.a 2.0 -" e 1.s

Q,I

..c: ~ 1.0

0.5

0.0

-----

60 65 70

---~~--~~~-~~==~~~

75

Temperature (C)

80 85

Figure 18. Normalized Thermal Energy to Dry Crystal Malt from 80.1to5.7% M.c. D.b.

60 65 70 75

Temperature (C)

80 85

Figure 19. Normalized Thermal Energy to Dry Harrington Malt from 84.6 to 6.3% M.c. D.b.

55

90

90

56

Normalized results for the thermal energy for batches 20-22, 24 and 25

are shown in Figure 20. The thermal energies shown are higher than those from

the other sets because these energies were based on final moisture contents

around 4% w.b., which require much more energy to achieve than final moisture

contents around 6% w.b. Batches 20, 21, and 22 show a clear trend of thermal

energy reduction for schemes with airflow reduction. Batches 24 and 25 show

thermal energy savings that would be more realistic for an industrial one-deck

kiln (about 20% ), since the final moisture contents of the malt are very close to

the typical production goal of 4% w.b., and the final malt quality was very close

to commercial requirements.

5.0

4.5

4.0 bO ~ 3.5 ........

~ 3.0

£D -~ 2.!> = r.tl

- 2.0

E 1.5 ..c: ~ 1.0

0.5

0.0

20 21 22 24

Batch Number

Figure 20. Normalized Thermal Energy to Dry Harrington Malt from 78.6% to Terminal M.c. D.b. for Airflow Reduction.

25

57 Malt Quality

Quality results for diastatic power and malt color are emphasized here

because they show marked trends with temperature, whereas some other quality

factors do not. Table II lists experimental malt quality results, which were

measured in GWM's Vancouver laboratory using standard malt analysis

techniques. Figure 21 shows quality results for batches 2-6. Diastatic power

shows a monotonic decrease with temperature, with 75 C being the highest

constant drying temperature for an acceptable value. Acceptable diastatic power

values range from about 130 to 150 degrees Lintner. Color increases with

temperature, and 75 C also is the highest constant drying temperature with an

acceptable value. Acceptable color values are 2 degrees Lovibond, or less.

The diastatic power for batches 9-12 has an undefined trend, with 64 C

the highest temperature with an acceptable value. The malt color definitely

increases with temperature (Figure 22). The experimentally determined

maximum constant-drying temperature for Crystal and Harrington malts

appears to be 75 C (167 F). This is the highest drying temperature that

produced acceptable malt quality, disregarding the diastatic power for batches

9-12, However, 70 C was considered a safer temperature for tests with a final

roasting stage, since the enzyme levels fall and the malt color rises at a faster rate

at higher temperatures.

Figures 23 and 24 show no notable trends for color and diastatic power

since batches 20-22, 24 and 25 all vary in their temperature and airflow schedules

with no particular sequence. Batches 24 and 25 were dried at 82 C for shorter

times than batches 20-22. Thus batches 24 and 25 ended with higher diastatic

power and lower malt color than batches 20-22, and batches 24 and 25 met all

industrial pale ale malt quality requirements. Sulfur dioxide, often used in

TABLE II

EXPERIMENTAL MALT QUALITY RESULTS

Batch Variety Drying Total Initial Final Soluble Dias ta lie Alpha- Extract Color Clarity Viscosity

No. Temperature Dry Time MC MC Prot0in Power Amalyse Fine Grind (Degrees (cs) (C) (Hr) (% w.b) (% w.b.) (%) Deg. Lintner % Dry Base Lovibond)

2 I_!? <==_ry~tal _ 63.3 14.5 44.47 5.46 5.35 180 57.2 79.5 1.26 3 1.43 - - ------- -- ------- - ----- - --- --- --- - -- - ---- --- -- -------

3 ID Crysta! 71.1 14 45.18 4.72 5.98 158 43.9 79.8 1.87 5 1.45 - --- ---- --- 1---·------· - --- - ---- ---- - -·---- - --------- - -~-----·--- - - - ---- - -------------

4 !!? ~I}'~t~! 75.0 13 46.16 4.32 5.69 148 48.9 79.9 1.90 3 1.45 -- ·-·-------··-- -- --- -- ---- - ----- - ------------------ ~--------·----- -

5 !!2 ~~yst~! ___ 81.l 14 45.96 3.84 5.92 106 50.3 80.2 3.51 3 1.43 ---- --- ---- -------- ---··- - - - --------- - - ------- -- -- --- --- ---- -- ----- -·-- --------------- ------- -- --------------- - "·- _______ .. __

6 ~!2_<==~y-~t~l ___ - 86.7 13 45.90 3.29 5.93 54 40.8 79.4 7.66 2 1.47 - - ---- ------- ----------- - - - --- --- - --- -- ,___ _____ --- -----·----r--------------- --- - -~~-- - - ---------- --

9 ___ !'J:~ !"forr!~&ton 63.9 13 46.31 5.87 5.03 130 58.4 78.8 1.23 4 1.42 --·-- --------··---·--- --------- ----- ··------ -------------- --- - --- ----------- ------- --------~------·-··---- -~------ ~----------

10 _ _!'J\'Y _ Har~!ngt?~ 70.0 13 45.83 5.01 5.13 109 50.8 79.0 1.32 4 1.47 -- - -· ------ - - -~-- -------· -- ----- -- --- ~-- ---··-- --- ----------·- - ------·-------- ---------·---·---

11 S:~ _!=la rr~ng ton 75.0 13 46.35 5.78 4.99 116 45.3 79.3 1.54 3 1.40 -------- - - - --- ---·--·- ---·-· --·------ - ----- ---- ------------- -- ~--- ---~·-------- - ------

12 CN Harrington 81.1 12 46.22 4.25 5.87 117 53.8 78.2 2.59 3 1.39 - ----·- ·-· - -· - - ------- t--·----·-----·--- --- - -------- - -- ---.-- ------ - - ---- --- ------ -------

20 ID Harrington 71.1 (8hr) 82.2 15 44.96 3.56 6.95 105 58.8 80.6 5.27 2 1.40 (7hr)

- -··-·- -- -

73-.3(1 Ohr)83.3 -- -------- ------------I---~---- - -- --- ------· --·-- - --- ------- ~--·-·----·------ --------- --- -- ---------·---

21 NW Harrington 16 46.48 3.78 6.58 106 55.4 80.4 3.71 2 1.38 (6hr) ----- ---- ·---·-- ··-- -- - ·-- - ---- - --·· - - - -

22 CN Harrington 72.2 (10hr) 83.3 16 47.75 3.90 5.92 124 60.0 79.5 2.55 2 1.33 (6hr)

-- - -- - -------- - ------------ ------ -- - ------ --- t-----~----------- --- ------- ---- ----···------ -------->---·------- ·----24 MT Harrington 72.8 (lOhr) 83.3 14 45.08 4.07 5.50 133 58.0 81.9 2.12 3 1.43

(4hr) ---··----····---- ·- - ---·--- - ---- ---- ----- - - -- _ _. _________

25 MT Harrington 72.8 (10hr) 84.4 14 43.99 3.84 5.59 132 58.3 81.8 2.03 2 1.44 (4hr)

Abbreviations: CN =Canadian, ID = Idaho, MT= Montana, NW= Northwest.

Ul 00

59

industrial malt drying, was not used in the experiments. It is often added to kiln

air to bleach malt, and to reduce the pH and increase the levels of soluble

nitrogen in worts made from the malt.

8 180

_7

"" § 6

·- • 160

Cl}

140 (IJ (IJ

b'o ,.Q

·~ j 5

120 e. -Cl}

t 4 th e_ 3

100 """ """ (IJ (IJ

~ = 80 0 = ~ ....

-~ ~ 60 iU

""" ..8 2 0

u 1

-Cl}

40 ta .... 0

20

---c:i- - - --c- -

0 0

60 65 70 75 80 85 90

Temperature (C)

• a Color • Diastatic Power

Figure 21. Crystal Malt Quality Indicators Versus Drying Temperature.

3.0,...----------------------~ 140

a -----+ 120 -· ] 2.5 0

,.Q

·;: 2 0 4 0 . ~

Cl}

t 1.5 th GI

8- 1.0 _; """ 0

0 -U O.::>

___ p __

a

0.0 --+-------..-----------.,.----------+-60 65 70 75 80 85

Temperature (C)

: a Color • Diastatic Power i

100

80

60

40

20

0

Cl} (IJ (IJ

b'o (IJ

~ t i' ~ = 0 = ~ .... (.J ~ .... -ta .... Cl}

ta

0

Figure 22. Harrington Malt Quality Indicators Versus Drying Temperature.

60

6

5 ~ = 0

:S 4 j;;;o 0 ~

~ 3 ~ bC Q.I

8.. 2 .. 0 -0 u

1

0

20 21 22 24 25

Batch Number

Figure 23. Harrington Malt Color for Airflow Reduction Tests.

140

t' 120 .s = ::3 100 {fJ Q.I

~ 80 bC

Q.I

~ .. Q.I 60 ~ 0 ~ v 40 .• .. !U .. flJ !U .. 20 0

0

20 21 22 24 25

Batch Number

Figure 24. Harrington Malt Diastatic Power for Airflow Reduction Tests.

61 MALT DRYING TEST SUMMARY

It was determined that the maximum constant drying temperature among

the several temperatures tested for Crystal and Harrington malts is 75 C (160 F).

This limit is due to malt quality requirements. Thermal energy consumption

values for the total energy required to heat the drying airflow were estimated.

Thermal energy consumption drops about 20% by increasing drying

temperature from 63 C (145 F) to 70 C (160 F). However, it is necessary to do

final drying above 75 C (167 F), at least for several hours, to reach a final

moisture content close to 4% w.b.

Experimental tests using airflow reduction methods were performed.

These tests included at least four hours of 83 C (180 F) drying to achieve final

moisture contents around 4% w.b. Results indicate that thermal energy savings

of 20% can be achieved by using more aggressive airflow reduction techniques

than industry typically uses. Malt quality tests show that the energy saving

schedules can produce perfectly acceptable malt.

Chapter VII compares the experiments of Chapter VI with simulations of

the experiments using Bala's model one (1983). The validity of the model for

testing thermal energy reduction methods is explored.

CHAPTER VII

MODEL VERSUS EXPERIMENTAL DATA COMPARISON

Each experimental batch was simulated with model one for comparison of

the results. The model batches were run after the experimental batches with the

same initial values for moisture content, average malt temperature, dry bulk

density (the bone dry malt weight divided by the total volume of moist malt),

and bed depth. The ambient temperature, relative humidity, and airflow values

recorded in the experiment were used with the model. The model drying air

temperature was taken from the maximum grain temperature levels recorded in

the experiment, since the actual drying air temperature sometimes differed up to

2 C from the set point. The experimental drying termination criterion, the

minimum moisture content change limit, was also used with the model.

COMPARISON RESULTS

Figures for the model versus experimental data that are not cited in the

text are in the Appendix. The data show the model and experimental estimates

for the average bed moisture content and grain temperature (denoted by height

in the bed, '.1 m', etc.). 'Exp' and 'mod' are abbreviations for experimental and

model, respectively.

63 Constant-Temperature Crystal Malt

A representative example for the first set of data of Crystal malt, batches

2-6, is shown in Figure 25. For batches 2-6, average moisture content values fit

well at the higher moisture contents, but the model average moisture content

dropped at a higher rate than the experimental values. The faster decrease in the

model moisture content compared to the experiment caused all model tests to

end earlier than the experiments ended. Grain temperature agreement is better

at the bottom of the bed, and becomes poorer in each case as the height of the

measurement increases. The shape of the grain temperature curves is very close,

except during the initial temperature rise above the wet-bulb temperature of the

drying air.

Drying Temp.: 71.1 C Air flow rate: 0.57kg/mA2/s

90~~~~--,..-~~~~~~~~~~~~..--~~~-.-~~~--,-~~~-,

80+--""~~~---~~~--+-~~~-+~~~~+--~~~--+---~~~-+-~~~---t

70 I ~ I - * / *:lli"•*"•--.il'IFllnftllAIWHflHUIH•IHIHH ... I _ , _.._llfMi'=tJC:R&X XI¥._ W . ~ • ....

z "ti

- o~ 60 ~~ Qi -~ f50 - - -l ~ c ""' 0 Qi u 40 - , e f: Qi :I

r-;., ]i 30 11111 --- .. ,._.,. ___ .. .;· __ ,._,._~...,,l!l I

0 :; 20-+-~~~~~~~~---<,.._~~---........ ~~~~-t-~~~~-+--~~~~-t-~~~--t

10+-~~~-+-~~~-t-~~~--t--_,.,,,,,,,,~~t--~-~~~~~-;----~~---t

-i--- ---~~~~Pw~m~~E~mEEOEIE~mE~E~m

2 4 6 8 10 12 14

Time (Hours)

m Mcdb exp

llC .1 mexp

• .3mexp

• .Sm exp

a .7mexp

--Mcdbmod:

--.lmmod

- .3mmod

·- - .5mmod

: • ~ • .7mmod

Figure 25. Batch 3 Model Versus Experimental Data for Crystal Malt.

64 Constant-Temperature Harrington Malt

Model and experimental moisture contents for the second set of data

(Harrington malt) in batches 9-12 are in better agreement than they were in

batches 2-6. However, the model moisture content still dipped below the

experimental value at lower moisture contents. The comparison worsens for

each case as the drying temperature increases. Figure 26 is a representative

example of the second set of data. Grain temperatures for the model versus

experiment exhibit the same trend as with the Crystal set; they fit better at lower

heights. The shape of the grain temperature curves is not as close as it is in the

Crystal comparisons.

Drying Temp.: 70.0 C Air flow rate: 0.57 kg/ m" 2/ s

90.,--~~,--~~~~-,~~--i-~~-----:~~-r~~l

so--------+------f--------+----+-------1----~---+-----~

;Q' ,10

0° s ¢aau 70 I ~ -a ~ • •• i1i1HH1fl•lh•=t ft - ' 60 ' • , ' • •• H P!!l1llt ill u 'of, • _,. , •• : • • ....... r .. •• -- . . .,. I

IOI -a.. c .E~SOj/o . ~ 6 :"i. . .". / ... - " ~u 40 " E ~ I

~; ·6 30 11 ............... ' ~ ••• , .. ~~· i i I

20 ..

10+----r---------+--~~----+-------,----~ 6.iL(' C_J f~ ,"'· 0 ,'",,1, {) rl .·, o.-·· :)!_.~ ~ ~4.:. !'JC~

O+-~~~....__~~~-;--~~~-;--~~~~~~~-+-~~~-+-~~~

0 2 4 6 8 10 12 14

Time (Hours)

c Mcdbexp

o .1 mexp

• .3mexp

• .5mexp

• .7mexp

--Mcdbmod

--.lmmod

········· .3mmod

- - .Sm mod

- - - .7mmod

Figure 26. Batch 10 Model Versus Experimental Data for Harrington Malt.

Drier Insulation Tests

Batches 13 and 14, tests for drier improvement due to better insulation,

clearly show better moisture content agreement than is seen in their

65

counterparts, batches 2 and 3. Figure 27 shows the typical temperature and

moisture content comparison for batches 13 and 14. Not all of the grain

temperature data are available for 13 and 14 due to faulty thermocouple wires.

The grain temperature agreement appears very similar to batches 2 and 3. It is

not inconsistent that the average bed moisture content curves agree better and

the grain temperature curves show the same agreement after adding insulation,

since the insulation most affects the grain temperature close to the drier

chamber's inside wall. The drying rate of malt close to the inside wall increases

with the increase in grain temperature, while the grain temperature

measurements along the drier chamber's centerline are affected to a much lesser

extent.

Drying Temp.: 70.2 C

100

90

80

z 70 "'C

Q~ 60

QI -- c: :s QI

'iU 'E 50 - 0 QI u ~ ~ 40 QI :s

f--. iii ·s 30 ::;; 20

10

0

0 2 4

:, .... ,A •

/ . Bi

6 8

Time (Hours)

Air flow rate: 0.57kg/m"2/s

I

i I

I - cc 004occ::i

10 12 14

u Mcdb exp

a .3mexp

• .Smexp

--Mcdbmod!

... 3mmod

- • .5mmod i

Figure 27. Batch 14 Model Versus Experimental Data for Crystal Malt.

Airflow Reduction Tests

Batches 20-22 and model batches 20-22 show moisture content and

temperature agreement similar to the agreement between batches 13 and 14 and

model batches 13 and 14. Apparently the model again over predicted drying

rates compared to the experiment. The model terminated at the minimum

moisture content change limit after only 2-3 hours, once the temperature went

up to 82-83 C. The experiment required 6-7 hours under the same conditions.

Typical results for batches 20-22 are seen in Figure 28. In batch 22, the model

inter-grain air temperature prediction at 0.7 m height accurately exhibited a

plateau between hours 6 and 7, although there is a large difference in the

temperatures at 0.7 m between the model and experiment.

100

90

Drying Temp.: 72.2 C, 10 hr; 8...1.3 C, 6 hr Air flow rate: 0.57 kg/mA2/s, 6 hr; 0.57->0.24 kg/mA2/s, 1 hr

0.24 kg/mA2/s, 7 hr.

66

;o "'ti

80

70

* Mcdb exp

o .1 mexp

- =~ ~~ GI -.. c ::l GI

~ c .. 0 ~u E ~ ~ .E Ill ·a ~

60

50

40

30

20

10

0

0 ....!"' ~

0 2

Oi 0

4

/1

6

,! , ~

8

0 0

0

Time (Hours)

10

,•••••••••t••ooooooa

12 14 16

:: .3mexp

"" .5mexp o .7mexp

i--Mcdbmod

i--.lmmod

········ .3mmod

;_ - .Smmod

·• ~ - .7mmod

Figure 28. Batch 22 Model Versus Experimental Data for Harrington Malt.

Batches 24 and 25 are also very similar to batches 13 and 14 in their

moisture content agreement. Inter-grain air temperature agreement appears

better than average compared to all other batches, as seen in Figure 29, which is

representative of batches 24 and 25. The model's tendency to over predict

67

drying rate compared to the experiment is apparent, and it resulted in the model

reaching the end criterion even before the drying temperature set point went

from 72.8 to 83-84 C.

To check how well model one predicts thermal energy savings due to

airflow reduction, the thermal energy was calculated and normalized for model

batches 20-25, just as in experimental batches 20-25. The relative changes in the

energy consumption appear similar, as seen in Figure 30.

90

80

70 ;o ~ 60

Q~ ~ c: 50 ;:I~ - c ~ 0 t_U 40 E ~ ~ i 30 ·c;

:::; 20

10

0

0

Drying Temp.: 72.8 C, 10 hr; 83.3 C, 4 hr.

•' .. 0 0 • 0

Air flow rate: 0.57 kg/ m" 2/ s, 6 hr; 0.57->0.24 kg/m"2/s, 4 hr;

0.24 kg/m"2/s, 4 hr.

! 0 8~~i

0 6 0

60

0

i I

liiiiiUii

·--~~~vv11t8~~eo~eee+••e6~eo=o I ,

2 4 6 8 10 12 14

Time (Hours)

• Mcdbexp

o .1 mexp

.3mexp

t. .5mexp

o .7mexp ,

--Mcdbmodi

--.lmmod

-- .3mmod

- · .5mmod 6 ~ • .7mmod

Figure 29. Batch 24 Model Versus Experimental Data for Harrington Malt.

4.0 r--===---------------------~ 3.5

be 3.0

s 6 2.5

~ ~ 2.0

W-l ;; § 1.5 a.i

.c: f- 1.0

0.5

0.0

20 21 22 24 25

Batch Number

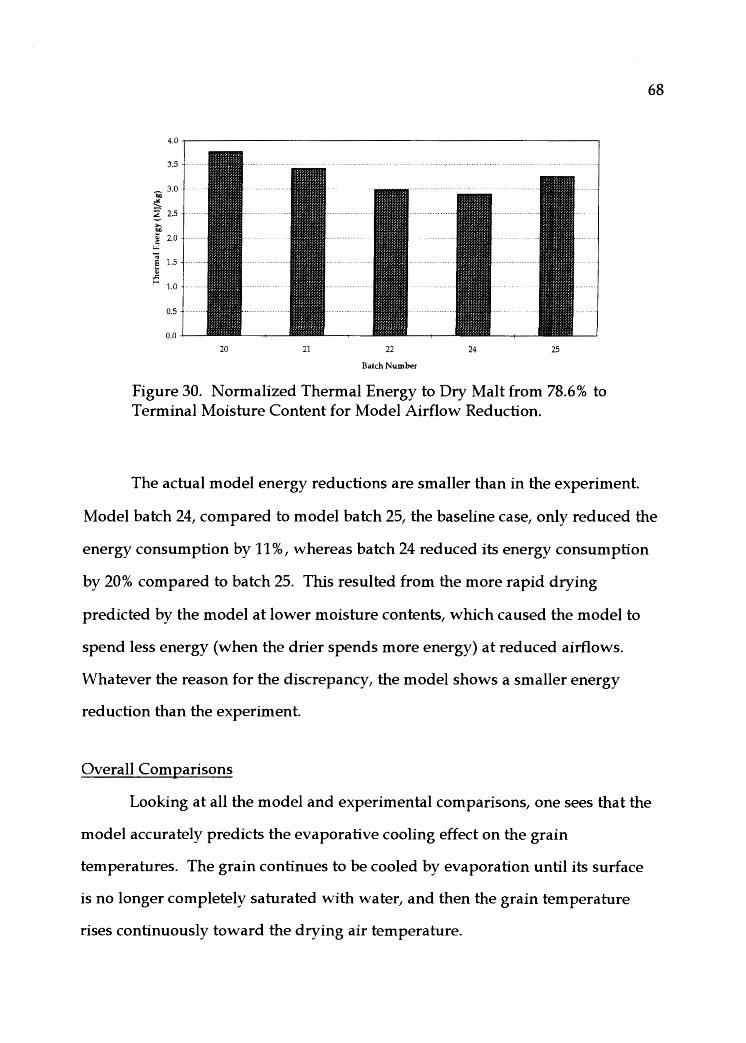
Figure 30. Normalized Thermal Energy to Dry Malt from 78.6% to Terminal Moisture Content for Model Airflow Reduction.

The actual model energy reductions are smaller than in the experiment.

68

Model batch 24, compared to model batch 25, the baseline case, only reduced the

energy consumption by 11%, whereas batch 24 reduced its energy consumption

by 20% compared to batch 25. This resulted from the more rapid drying

predicted by the model at lower moisture contents, which caused the model to

spend less energy (when the drier spends more energy) at reduced airflows.

Whatever the reason for the discrepancy, the model shows a smaller energy

reduction than the experiment.

Overall Comparisons

Looking at all the model and experimental comparisons, one sees that the

model accurately predicts the evaporative cooling effect on the grain

temperatures. The grain continues to be cooled by evaporation until its surface

is no longer completely saturated with water, and then the grain temperature

rises continuously toward the drying air temperature.

69

The model's moisture content and temperature curves have very similar

shapes to the experimental ones. The model's exhaust air temperature starts

rising (typically more than one hour) before the experimental measurement.

This time difference indicates that the model's prediction of the exhaust air

temperature may not be good for model-based control scheme tests that apply to

industrial driers. The airflow reduction experimental data shows a larger

temperature difference between the top and bottom of the bed than the tests

with no airflow reduction. This indicates that the heat loss from the drier

chamber walls has a greater effect on malt temperature uniformity at lower

airflows, and drier insulation becomes increasingly important for the success of

airflow reduction schemes.

CHAPTER VIII

RESULTS AND CONCLUSIONS

The thermal efficiency improvements found in this thesis apply to one­

deck malt driers, though similar improvements may occur in two-deck driers. A

20% thermal efficiency improvement was experimentally found in constant­

temperature drying tests at 70 C (160 F) rather than 63 C (145 F). The quality of

the resulting malt was acceptable by industry standards. Drying temperatures

above 70 C did not show significant efficiency improvements. The highest

constant drying temperature, found experimentally, with acceptable final malt

quality was 75 C. However, an initial drying temperature of 70 C is

recommended to avoid damaging quality during the high temperature stage

typically used at the end of drying.

More aggressive airflow reduction schedules were experimentally found

to save about 20% of the thermal energy to heat drying air. Diffusion-based

drying model (Bala 1983) simulations of the same airflow reduction schedules

showed about an 11 % reduction in thermal energy consumption. These results

are based on comparisons with airflow schedules similar to those typically used

in industry. The temperature schedules were the same for each schedule in the

comparisons. The source of the energy saving discrepancy between the

experiments and the simulations has not been determined. Final malt quality for

the energy saving experiments was perfect, and the drying time was one hour, at

the most, greater than the typical industrial airflow schedules. These energy

savings can be made with no heat recovery equipment additions to typical

71

industrial malt kilns. Heat loss may cause more thermal non-uniformity in the

drier cross-section at low airflows compared to higher airflows, thus requiring

better drier insulation. Drier control by exhaust humidity measurements may be

useful to reduce the testing required to implement the airflow reduction

schedules. FUTURE WORK

Improvements to the experimental drier used in this research are

suggested to make the exhaust air temperature and relative humidity

measurements more accurate. The suggestions include adding a constriction at

the top of the drier exhaust tube. This would keep outside air from falling into

the tube by increasing the exhaust velocity out of the drier. Adding an

aluminum foil lining to the inside walls of the exhaust tube would also improve

the temperature measurement by reducing the radiation heat loss from the

exhaust thermocouple to the walls. Drier heat loss through the walls by radial

conduction could be thoroughly investigated, once the exhaust air measurements

are improved, by com paring the energy of the drying air going into the malt

with the energy of the drier exhaust air plus the sensible heat change of the malt

itself.

More research to develop a more accurate grain drying model would be

useful. Complex diffusion-based models, such as the one developed by Bruce

(1985), might allow use of direct simulation methods to minimize the thermal

energy consumed in drying. This could improve on the trial-and-error

simulation methods used in this research. The model could be used for further

improvements in deep-bed drier operation. It could also be used to investigate

counter-flow driers and other drying methods that push the thermal efficiency

limit higher than possible with deep-bed driers.

REFERENCES

American Society of Mechanical Engineers (A.S.M.E.). Fluid Meters, Their Theory and Applications. 6th ed. NY., NY.: A.S.M.E., 1971.

Bala, B. K. "Deep Bed Drying of Malt." Diss. U. of Newcastle upon Tyne, U. K., 1983.

Bala, B. K. "Simulation of Deep Bed Malt Drying." Journal of Agricultural Engineering Research 30 (1984): 235-244.

Bonneville Power Administration (B.P.A.) Adjustable Speed Drives Workshop, Jantzen Beach, OR, 4 March 1992.

Briggs, D. E., Hough, J. S., Stevens, R., and Young, T. W. Malting and Brewing Science. Vol. 1. NY., NY.: Chapman and Hall Ltd., 1981.

Bruce, David M., and Sykes, R. A. "Apparatus for Determining Mass Transfer Coefficients at High Temperatures for Exposed Particulate Crops, with Initial Results for Wheat and Hops." Journal of Agricultural Engineering Research 28 (1983): 385-400.

Bruce, David M. "Exposed-Layer Barley Drying: Three Models Fitted to New Data up to 150 C." Journal of Agricultural Engineering Research 32 (1985): 337-347.

Chirife, Jorge. "Fundamentals of the Drying Mechanism During Air Dehydration of Foods." Advances in drying. Ed. Mujumdar, Arun S. Washington, D.C.: Hemisphere Publishing Corporation; 1983: 73-102. 2nd v.

Cuti, John G. Private conversation. Great Western Malting Company, Vancouver, WA. October 31, 1995.

Geankoplis, Christie J. Transport Processes and Unit Operations. Newton, MA: Allyn and Bacon, 1983.

Grofton, Peter. Mastering Serial Communications. Berkeley, CA: Sybex, 1986.

Kuntze, Tomi M., Saxen, Henrik. "Simulation of Deep-Bed Kilning of Malt." Industrial and Engineering Chemistry Research 33 (2) (1994): 321-328.

McEwen, E., Simmonds, W. H. C., Ward, G. T. "The Drying of Wheat Grain. Part III: Interpretation in Terms of Biological Structure." Trans. Instn. Chem. Engrs. 32 (1954): 115-120.

Miller, Richard W. Flow Measurement Engineering Handbook. NY., NY.: McGraw-Hill, 1983.

Perry, Robert, and Green, Don. Eds. Perry's Chemical Engineer's Handbook. 6th ed. NY., NY.: McGraw-Hill Book Co., 1984.

Smith, Carlos A., and Corripio, Armando B. Principles and Practice of Automatic Process Control. NY., NY.: John Wiley, 1985.

73

Stefani, Raymond T., Savant, C. J., Shahian, B., and Hostetter, G. Design of Feedback Control Systems. NY., NY.: Saunders College Publishing, 1994.

SNOll.\fI103: Al.N3:d0Nd NI\f 9Nl.\NQ

\f XIQN3:dd\f

75

The goal of this section is to estimate the drying rate of each bed in a two-

deck kiln. Calculations are necessary to approximate the drying air conditions at

each level of the two-deck kiln, shown in Figure 1 in the text. Data, from the

Compartment House PLC control system at Great Western Malting Company,

for the thermal consumption of the heat exchanger, and the temperature and

relative humidity at the positions shown in Figure 1, is also necessary.

LOWER DECK DRYING RA TE

To calculate the lower deck drying rate, it is necessary to find the

humidity at points 2 and 3 in Figure 1. The mass·flow rate of air through the

heat exchanger is also needed. Then a mass balance on the moisture in the air

flowing through the lower deck is made, which yields the lower deck's drying

rate.

Humidity Calculation at Point 2

Given T, air temperature (F), and rh, relative humidity (% }, at 1, H,

humidity (lbm water/lbm dry air), can be found at point 2 because it is equal to

Hat point 1. To find Hat 1, first calculate Pwsat ,the saturated water vapor

pressure (atm), at 1. Setting

and

• 5

Tk 1 = --(T1 - 32) + 273.16 9

81 = 273.16

Tkl

Pwsan can be found from the equation

(27)

(28)

76

log 10 (Pwsatl) = 10.80 · (1-81 ) + 5.028 · log 10 (81 ) + 1 (29)

-8.297-[--l]

1.505x10⁻⁴. (1-10 81 ) + 4.287 x 10⁻⁴

. (104·770

·<1- 91

> -1)-2.220.

The actual vapor pressure, Pw (atm), is given by

and Hat 1 is found from

Humidity Calculation at Point 3

rh1 · Pwsan Pw1 = 100

H1

==0.6219· Pwl . 1-p wl

Given T and rh at 4, h 3 , air enthalpy at 3, can be found by assuming it

equals h 4 , where h 4 is given by

h 4 = 0.24 · T4 + H 4 · (1061+0.444 · T4 ).

(30)

(31)

(32)

To find H 4 , follow the steps for the Humidity Calculation at Point 2, replacing

the subscript 1 with 4. Then H 3 is given by

H = h 3 ·- 0.24 · T 3 3 1061+0.444 · T

3•

(33)

Air Flow Rate Through Heat Exchanr£!:

The air mass flow rate through the heat exchanger is found from an

energy balance on the heat exchanger air and water. Given q, the heat

exchanger thermal usage rate (therm/minute), and h 2 and h 11 the enthalpy of

the air downstream and upstream of the heat exchanger (Btu/lbm dry air),

mair,htx' the mass flow rate of air (Ihm/minute) can be found by

77

q · 105

mair,htx = h2 - hl (34)

h 1 and h 2 are found with eq. (32), by replacing 4 with 1and2, respectively.

Moisture Mass Balance on the Drying Air

The actual drying rate of the lower deck is estimated by a simple moisture

mass balance on the air through the lower deck. Since any airflow around the

lower deck has no change in H, humidity, that airflow does not show up in the

calculation. The drying rate, mwater (lbm water/minute), is given by

mwater = rilair,htx · (H2 - H1) · (35)

UPPER DECK DRYING RATE

The upper deck drying rate is found similarly to the lower deck. Since H

at 3 and Hat 4 are already known from equations (33) and (31) using the

analysis described above, it is only necessary to find mair,upper, the mass flow rate

of air through the upper bed (Ihm dry air/minute). Then a moisture mass

balance may be used to find the upper deck drying rate.

mair,upper is found by doing an energy balance on the airflow through the

heat exchanger, through the cold-air bypasses, and through the upper deck. The

analysis results in the equation . . h,, - hl m . = m . · --"'--~ _ _;;_

au, upper au ,htx h _ h 3 1 (36)

Then mwater,upper I the upper deck drying rate (Ihm water/minute) is found by the

equation

ril = ril · (H - H ) water ,upper air ,upper 4 3 • (37)

t[QQ:) 1tlGOW tl:JV .fMrrs-atcJ.1.tlM

H XIGNtlddV

1. Variable definitions

dmair, dmairini: mass flow of air, lb/min

dmevap: increment of water evaporated, lb/min

energy: energy supplied to heat drying air, Btu

flowred: reduction factor for air flow

HABop: % opening of hot air bypasses

hamb: enthalpy of ambient air, Btu/lb

hmA: mass transfer coefficient * grain surface area, cfm

hon: enthalpy of air on, Btu/lb

invsolid: !/(solid percentage, dee., green malt) m: Jb dry grajn

mcin: initial moisture content of green malt % wb

mdiff: difference in dmevap: dmair(Wex-Wao)- hmA(den,w,surf - den,w, air)

mevap: total mass of water evaporated, lb

psatTsurf: saturated vapor pressure for Tsurf of mal1

psatwb: partial saturation pressure of water at wet bulb temp, atm

psurf: grain surface vapor pressure, atm

pwexold, pwex: partial pressure of water in exhaust air, atm

rhamb: ambient relative humidity, %

rhamb: relative humidity of ambient air, %

rhave: average relative humidity in equilibrium with average malt me

rhs: equilibrium relative humidity at grain surface, decimal

Tamb: ambient air temp, F

Tex: temperature of exhaust air, F

Texold, Tex: exhaust air temperature, F

time: time, minutes

Ton: air on temperature, F

Tsold, Ts: grain surface temperature, F

tstep: time step for drying analysis

Twboldk, Twbk, Twb: wet bulb temperature, (K, K, & F)

wdenex: water vapor density of exhaust air

wdenon: water vapor density of air on

wdens: water vapor density of malt surface

wdifflm: log-mean vapor density difference between air on and air off and bed

Wex: absolute humidity of exhaust air

Won: absolute humidity of air on

2. Excel 4.0 Macro Code for Mass Transfer Model

mod2

Tonl = 145

Tonl 2=155

Tonl 3=180

time 1=230

time 2=470

Tamb= 63

rhamb= 70

input variables

79

hmAini = 1417383

m=320616

mcinil= 13 mcini2= 47 HABop= 0.75 dmairini =34294 flowred= 0.61 tstep= 10

mcl= mcinil

mc2= mcini2

dmairl =(1- HABop)*dmairini

dmair2 = dmairini hmAl= (1- HABop)A0.49*hmAini

hmA2= hmAini invsolidl = l/(1-mcinil/100) invsolid2 = l/(1-mcini2/100)

mevapl= 0

mevap2= 0

time=O

energy= 0

pwamb= 'C:\CHKILN\MACR02.XLM'!pwrh(Tamb,rhamb)

Wamb= 0.6219* pwamb/(1- pwamb) hamb= 0.24*Tamb + Wamb*(l061 + 0.444*Tamb)

Wonl= Wamb

honl = 0.24*Tonl + Wonl *(1061 + 0.444*Tonl)

Twb= 'C:\CHKILN\MACR02.XLM'!twb(honl)

psatwb=(honl-0.24*Twb)/(659.83+0.036124*Twb+honl)

pwonl = Wonl/(0.6219 + Wonl)

Texl=Twb

Tex2=Twb

=IF( mcl < 30)

x= 19.2/30

mcx= mcl *x rhavel = (-0.0272*(mcx)A3 + 0.7561 *(mcxf2 + 0.3735*(mcx)

+ 0.9431)/100 rhsl = (mcl/40+ 0.25)*rhavel

=ELSEO rhsl =l

=END.IFO =IF( mc2 < 30)

x= 19.2/30

mcx= mc2*x

rhave2= (-0.0272*(mcxf3 + 0.7561 *(mcxf2 + 0.3735*(mcx) + 0.9431)/100

rhs2=(mc2/40+0.25)*rhave2

=ELSEO

initialize variables

calculate Wamb and hamb

iterate to find Twbonl

psat at Twb, atm

pw, air on, atm

initial exhaust and surface conditions

initialize equilibrium rh of surfaces

me mapped from 6.3 to 30 to 6.3 to 19.2

me mapped from 6.3 to 30 to 6.3 to 19.2

80

rhs2= 1

=END.IFO pwex 1 = 0. 98 *psatwb pwex2= 0.98*psatwb

=WHILE(mcl >4)

Texllast= 0

psurfllast= 1

iterl=O

iter2=0

Tsl = 'C:\CHKILN\MACR02.XLM'!Tsurf(honl ,rhsl)

initial pwexl guess at t=O initial pwex2 guess at t=O

psurfl = (honl-0.24*Tsl)/(659.83+0.036124*Tsl +honl) pw

psatTsl = psurfl/rhsl

= WHILE(AND(OR(ABS(Texllast-Texl) > 0.5, ABS((psurfllast- iterate to find psurf and Tex at time t psurfl)/psurfllast) > 0.002), iterl < 100))

=

mevapllast= mevapl

Texllast= Texl

psurfllast = psurfl

iterpl = 0

pwexold= 1

x= 0.24 + 0.036124* pwexl

TexlR= (honl - (honl + 659.836)*pwexl)/x + 459.7

wdenexl = pwexl *24.676/Te~lR

wdensl = psurfl *24.676/(Tsl + 459.7)

IF(wdenexl > wdensl)

pwexl = 0.98*TexlR*psurfl/(Tsl + 459.7) x = 0.24 + 0.036124* pwexl

TexlR= (honl - (honl + 659.836)*pwexl)/x + 459. 7

wdenexl = pwexl *24.676/TexlR

END.IF()

density of water vapor, exhaust

density of water vapor, grain surface

density of water vapor, exhaust

81

= WHILE(AND( ABS(pwexold-pwexl)>0.00000001, iterate to find pwex using Newton-Raphson iterpl < 100))

=

459.7

=

x= 0.24 + 0.036124* pwexl

TexlR= (honl - (honl + 659.836)*pwexl)/x + 459. 7

wdenexl = pwexl *24.676/TexlR

WHILE(wdenexl > wdensl)

pwexl =(pwexl + pwexold)/2

x= 0.24 + 0.036124* pwexl

TexlR= (honl - (honl + 659.836)*pwexl)/x +

wdenexl = pwexl *24.676/TexlR

NEXT()

pwexold = pwex 1

wdenonl = pwonl *24.676/(Tonl + 459.7)

wdensl = psurfl *24.676/(Tsl + 459. 7)

wdiffl = wdenexl - wdenonl

wdiff2= LN( (wdensl - wdenonl)/(wdensl - wdenexl))

density of water vapor, exhaust

density of water vapor. exhaust

density of water vapor, air on

density of water vapor, grain surface

difrA2

wdifflm = wdiffl/wdiff2

hevapl = hmAl *wdiftlm wevapl = dmairl *( 0.6219*pwexl/(1- pwexl) - Wonl)

f= wevapl - hevapl

difr= LN( (wdensl -wdenonl)/(wdensl - wdenexl)) dTexlR= (-0.276124*honl - 158.361)/xA2

dwdenexl = (TexlR - pwexl *dTexlR)*24. 676/TexlR A2

ddifr= dwdenexl/( wdensl - wdenexl)

ddiflm= (dwdenexl *difr -(wdenexl -wdenonl)* ddifr)/

df= 0.6219*dmairl/(1 -pwexl)A2 - hmAl *ddiflm pwexl = pwexl - f/df

iterpl =iterpl + 1

= NEXTO

= IF(iterpl = 100)

= FORMULA("Didn 't converge on pwexl ")

= RETURNO

= END.IFO

Texl = (honl - (honl + 659.836)*pwexl)/(0.24 + 0.036124*pwexl)

Wexl =0.6219*pwexl/(1-pwexl)

dmevapl = dmairl *(Wexl- Wonl)

mevapllast= mevapllast+ dmevapl *tstep

mcl = (m*(invsolidl- 1) -mevapllast)/(m*invsolidl­mevapllast)* 100

IF(mcl < 30)

iterl = 1 iter2= iter2 + 1

x= 19.2/30

mcx= mcl *x

rhavel = (-0.0272*(mcx)A3 + 0.7561 *(mcxr2 + 0.3735*(mcx) + 0.9431)/100

=iter2

rhsl = (mcl/40+ 0.25)*rhavel

END.IFO

= IF(iter2=100) = FORMULA("Didn't converge on rhsl recalculations")

= RETURNO

= END.IFO

82 log-mean water vapor density difference doesn't work because data from 6/25/94 grave has pwex > psurf, so log-mean gives an infinite result

Tex, F

Wex

me% wb

me contracted from 0 - 30 to 0 - 19.2

Tsl = 'C:\CHKILN\MACR02.XLM' !Tsurf(honl,rhsl)

psurfl= (honl-0.24*Tsl)/(659.83+0.036124*Tsl+honl) pw psatTsl = psurfl/rhsl

iterl = iterl + 1

== NEXTO

== IF(iterl == 100) FORMULA("Didn't converge on abs(Texl-Tex) and

abs((psurfl- psurf)/psurf)") RETURNO

== END.IFO

Wexl =0.6219*pwexl/(1-pwexl)

dmevapl == dmairl *(Wexl- Wonl)

mevapl == mevapl + dmevapl *tstep

mcl == (m*(invsolidl- 1) -mevapl)/(m*invsolidl-mevapl)* 100

rhex 1 == 'C: \CHKILN\MACR02 .XLM' ! calcrh(Tex 1, Wex 1) mdiffl= f

time== time+ tstep

hexl == 0.24*Texl + 0.6219*pwexl/(1-pwexl)*(l061 + 0.444*Texl)

energy= energy + dmair2*(honl- hamb)*tstep hsurfl == 0.24*Tsl + 0.6219*psurf1/(1-psurt1)*(1061 +

0.444*Tsl)

coll== COLUMN(ACTIVE.CELLO) ::;;; FORMULA(time)

SELECT(OFFSET(ACTIVE.CELLQ,0,1)) ::;;; FORMULA(Tonl) ::;;; SELECT(OFFSET(ACTIVE. CELL{),O, 1 )) ::;;; FORMULA(Wonl) ::;;; SELECT(OFFSET(ACTIVE.CELLQ,0,1)) ::;;; FORMULA(honl) ::;;; SELECT(OFFSET(ACTIVE. CELL(),O, l )) ::;;; FORMULA(psurfl/(Tsl +459. 7)*24.676) ::;;; SELECT(OFFSET(ACTIVE.CELLQ,0,1)) ::;;; FORMULA(Tsl) ::;;; SELECT(OFFSET(ACTIVE. CELL(),O, 1 )) ::;;; FORMULA(Texl) ::;;; SELECT(OFFSET(ACTIVE.CELLQ,0,1)) ::;;; FORMULA(Wexl)

SELECT(OFFSET(ACTIVE. CELLQ,O, 1)) FORMULA(rhexl)

::;;; SELECT(OFFSET(ACTIVE.CELLQ,0,1)) ::;;; FORMULA(rhsl *100) ::;;; SELECT(OFFSET(ACTIVE.CELL(),O, l)) ::;;; FORMULA(pwexl/(Texl + 459. 7)*24.676) ::;;; SELECT(OFFSET(ACTIVE.CELL(),0,1)) ::;;; FORMULA(hexl) ::;;; SELECT(OFFSET(ACTIVE. CELLQ,O, l )) ::;;; FORMULA( dmevapl) ::;;; SELECT(OFFSET(ACTIVE. CELLQ,O, l)) ::;;; FORMULA(mcl)

SELECT(OFFSET(ACTIVE.CELL(),0,1)) ::;;; FORMULA(mdiffl)

end of iterate for Ts & Tex loop

Wex

mc%wb

calculate rh exhaust check dmair(Wex-Wao)= hmA(den,s­den,air)

print out values on active sheet

water vapor density. surface of grain

water vapor density, exhaust air

83

= SELECT(OFFSET(ACTIVE. CELLQ,0.1))

= FORMULA(hsurfl) SELECT(OFFSET(ACTIVE.CELL(),0,1)) FORMULA(eoergy/10A5)

= SELECT(OFFSET(ACTIVE. CELL(), I, col 1-COLUMN(ACTIVE. CELL())))

= IF(time = time_2) Tonl= Tonl 3 dmairl = flowred* dmairini hmAl = (flowredA0.49)*hmAini

pwonl = Wonl/(0.6219 + Wonl)

= ELSE.IF(time = time_l) Tool= Tool 2

pwonl = Wonl/(0.6219 + Wonl) = END.IF()

honl = 0.24*Tonl + Wonl *(1061 + 0.444*Tonl)

= IF(mcl < 30)

x= 19.2/30

mcx= mcl*x

rhavel = (-0.0272*(mcxf3 + 0.7561 *(mcx)"2 + 0.3735*(mcx) + 0.9431)/100

rhsl = (mcl/40+ 0.25)*rhavel

psurfl = rhsl *psatTsl

= END.IF()

=NEXT()

=RETURN()

3. Macro functions used in Excel code

84

Calculate increased air on temperature

me mapped from 6.3 to 30 to 6.3 to 19.2

a. Calculate relative humidity given absolute humidity and temperature

Function to calculate relative humidity given W and T calcrh =RESULT(l) =ARGUMENT("tf" ,1) =ARGUMENT("w", 1) =IF(tf=O, RETURN(Hl 7)) =IF(w=O, RETURN(Hl 7)) =(tf-32)*5/9+273.16 =w/(0.6219 +w) =273.16/08 = 10. 796*(1-GlO) =5.0281 *LOGlO(GlO) =-8. 2969*((1/G 10)-1) =0.00015047*(l-10AG13) =4. 7696*(1-GlO) =0.0004287*(1QAQ15-1) =Gll +G12+G14+Gl6-2.2196

return number argument for fahrenheit temperature argument for absolute humidity

calculate tf in kelvin pw z=273.16/T pl p2 al p3 a2 p4 Ip

=1QAQ17

=G9/G18*100 =RETURN(G19)

b. Calculate partial pressure of water vapor given temperature and relative humidity

Function to calculate pw given T and rh pwrh =RESULT(l) =ARGUMENT("tf',l) =ARGUMENT("rh" ,1) =IF(tf=O, RETURN(H39)) =IF(rh=O, RETURN(H39)) Tk =(tf-32)*5/9+273.16 z=273.16(fk pa=l0.796*(1-z) pb=5.0281 *LOGlO(z) aa = -8 .2969*((1/z)-1) pc =0.00015047*(1-lOA aa) ab=4.7696*(1-z) pd= 0 o 0004287*(10 A ab-1) Ip= pa+ pb +pc+ pd-2.2196 psat=lOAlp pw=psat*rh/100 =RETURN(pw)

c. Calculate wet bulb temperature given enthalpy

function to calculate wet bulb temperature given h twb =RESULT(l) =ARGUMENT("hao",1) =IF(hao=O, RETURN(O)) iter= 1 Twbold= 0 Twbnew= 60 =WHILE(AND( ABS(fwbold-Twbnew) > 0.5, iter < 100))

Twbold = Twbnew Twboldk= (fwbold-32)*0.555555 + 273.16 pw= (hao-0.24*Twbold)/(659.83+0.036124*Twbold+hao) aa= 5.02808*LOG10(273.16(fwboldk) b = 0.000150474*(1-10A(-8.29692*(fwboldk/273 .16-1))) d= 0.00042873*(10A(4.76955*(1-273.16(fwboldk)) -1) Twbk= 10.79586*273.16*(10.79586-LOGlO(pw) +aa +b + d -

2.2195983r<-l) Twbnew= (fwbk-273.16)*1.8+32 iter= iter+ 1

=NEXTO =RETURN(fwbnew)

ps rh

return number

85

argument for fahrenheit temperature argument for relative humidity

calculate tf in kelvin z=273.16(f pa pb aa pc ab pd Ip ps

iterate to find twb

twbold (K) pw

twbnew K

twbnew F

86 d. Calculate grain surface temperature given enthalpy and relative humidity at grain surface

function to calculate grain surface temperature using Newton-Raphson given hon and rhs

Tsurf =RESULT(!) =ARGUMENT("hao" ,1) =ARGUMENT("rhs" ,1) =IF(hao=O, RETURN(O)) =IF(rhs=O, RETURN(O)) iter= 1 Tsurfold= 1 Tsurf= -90.9091 *rhs + 170.9

=WHILE(AND( ABS((Tsurfold-Tsurf)n'surfold) > 0.001, iter < 100))

Tsurfold = Tsurf Tsurfk= (Tsurf-32)*5/9 + 273.16 pw= (hao-0.24*Tsurf)/{659 .83 +0.036124*Tsurf+hao) aa= 5.02808*LOG10(273.16n'surtk) b = 0.000150474*(1-1W(-8.29692*(Tsurfk/273.16-1))) d= 0.00042873*(1W(4.76955*(1-273.16n'surfk)) -1)

psatTsurf= pw/rhs x= (10.79586-LOGlO(psatTsurf) +aa +b + d -2.2195983) f= Tsurfk- 10.79586*273.16/x aa= 9/5*(0.24*(659.83+ 0.036124*Tsurf + hao) + 0.036124*(hao-

0.24*Tsurf))/{2.30259*(hao- 0.24*Tsurt)*(659.83+ 0.036124*Tsurf +hao)) bb= -5.02808/2.30259n'surfk cc= -0.000150474*10A(-8.29692*(Tsurfk/273.16 -1))*(-8.29692/273.16)*2.30259 dd = 0.00042873*4. 76955*273 .16*2.30259n'surtk A2*10A(4. 76955*(1- 273 .16n'surfk)) df= 1 + 10. 79586*273.16/xA2*(aa+ bb+ cc+ dd) Tsurfk = Tsurtk - f/df Tsurf= (Tsurfk-273 .16)* l.8+32

iter= iter+ 1

=NEXTO = RETURN(Tsurt)

iterate to find twh

twbold (K)

pw

twbnew K

twbnew F

aao:> aNo 1:aaow

:J XIGN3:cldV

/* Program name: /*Purpose: /*File: /*Date:

Modell header file Consolidab~s function prototypes modell.h 17/3/95

int airinit(double *, double*, double*, double*, double*, int *, float *);

*/ */ */ */

void arrayinit( double *, float, float, double "", double *, double *, double *, double *, int, float);

double *dvector(int, int);

float equilrh(float, float);

float frhcalc(float, float, float, float, float, float, float, float, double, float, float, float, float, float, float, float, float *, float *, float *, float, float *);

int getvalues(float *, float *, float *, float *, float *, double *, double *, float *, double *, float *, float *, float *, float *, float *, int *, int *, float *, float *, int *, int *, float *);

int htxinput(float, float *, float *, float*, float *, int, double *, double *, double *, double *, double*);

int liter( double *, double *, double *, double *, double *, double *, double, int, float, float, float, float*, float, float, float, float, float, float, float, float, float, float, int);

FILE *openout( char *);

void prlaydat(float, float, float, float, int, double *, double *, double *, double *, FILE *, int);

void prtimdat(float, float, float, float, float, double *, double *, float, FILE *, int, double *, float);

int rootfind(float, float *, float, float *, float, float, float, float, float *, float, float, float, double, float, float, float, float, float, float, float, float *, float *, float, int);

float satpr(float);

int titer(float, double *, double *, double *, double *, double *, double *, float, float, double, int, float, double, double, double *, double *, double *, double *, int, double *, float, float, float, float, float, float, float, int, float, float, int, int, float);

f* Purpose:

/*File: /*Date:

Initializes drier input airflow properties * / airinit.cpp * / 17/3/95 */

/* Inputair.dat file format (include at least everything shown!):

The first line must start with time = 0 min 0 72 0.38 161 7.1 2 72 0.38 161 7.1

*/

88

#include <stdio.h> #include <stdhb.h> #include "modell .h"

int airinit(double *time, double *tatm, double *rhat, double *htxtemp, double *G, int *N, float *tml)

double *temp; int check=S, i=l; FILE *fin;

fin=fopen("inputair .dat", "r"); if (fin==NULL) {

printf("\n\nCouldn't open inputair.dat for reading" "\n");

return -1;

fscanf(fin, "% *s % *s % *s % *s % *s % *s % *s % *s % *s % *s");

while ((i<=*N) && (check==S)) {

}

check=fscanf(fin, "%1£ %If %1£ %1£ %If", time+i, tatm+i, rhat+i, htxtemp+i, G+i);

tatm[i)=.55556*(tatm[i)-32.0); htxtemp[i]=.55556*{htxtemp[i]-32.); G[i]=4.8824*G[i]; i++;

if {i==*N+l) {

check =fscanf(fin, "%1£", temp); if (check!=EOF) {

printf("\nNumber of air input data exceeds" "maximum limit set in modell.dat.\n" "Increase the maximum in modell.dat to the" "number of air input\ndata time steps");

fdose(fin); i-=2; *tml=time[i]; *N=i;

return 1;

/* Program name:

return -1;

Malt propeirty initializer */

89

/*Purpose: /*File: /*Date:

Sets initial values of malt arrays*/ arrayini.cpp * / 20/3/95 */

#include <stdio.h> #include <stdhb.h> #include <math.h> #include "model1.h"

void arrayinit(double *rh, float mcini, float tgini, double *mcdb, double *tg, double *ta, double *rt, double *hum, int nz, float apr)

inti; float rhtemp, pvs, pv, humtemp;

rhtemp=equilrh(mcini, tgini); pvs=satpr(tgini); pv=rhtemp*pvs; humtemp=.622*pv / (apr-pv); for(i=1; i<=nz; i++) {

rh[i]=rhtemp; mcdb[i]=mcini; tg[i]=tgini; ta[i]=tgini; rt[i]=O.O; hum[i]=humtemp;

/* Program name: /*Purpose: /*File:

Vector allocator * / Allocates double type arrays * / dvector.cpp * /

/*Date:

#include <stdio.h> #include <stdlib.h> #include "model1.h"

double *dvector(int nl, int nh) {

int j; double *v;

17/3/95 */

v=(double *)malloc((unsigned)(nh-nl+1)*sizeof(double)); if(!v) { printf("Allocation failure in dvector()");

exit(l);

v-=nl;

for(j=nl; j<=nh; j++)

90

v[j]=0.0;

return v;

/* Program name: /*Purpose: /*File: /*Date:

Equilibrium relative humidity function Find malt's equilibri1.tm rh=f(mc,tg) arrayini.cpp 20/3/95

float equilrh(float me, float tg) {

float mcwb, rh;

mcwb=mc/ (me+ 1 ); rh=exp((-37357.912/(8.315*(tg+273.15)))*exp(-29.9857*

mcwb)); return rh;

/*Program name: /*Purpose: /*File: /*Date:

#include <stdio.h> #include <stdlib.h> #include "modell.h"

RH Function Calculator Finds value of rh-rhmax frhcak.cpp 25/3/95

*/ */ */ */

*/ */ */ */

float frhcak(float cpa, float cpv, float cpl, float huma, float dm, float dendry, float dz, float Gx, double dt, float a, float yy, float ht, float f, float b, float tda, float apr, float *dtg, float *dta, float *h, float rhmax, float *rha)

float e, ge, top, bb, bot, t, ps, p, frh;

e=cpa+cpv*(huma-( dm *dendry*dz/ (Gx*dt))); ge=Gx*e; top=dendry/ dt*dm; top=a+top*((2.*yy /ht)+f*dz/ ge); bb=b+cpl*dm; bot=l.+dendry / dt*(2.*b/ht+dz*bb/ ge); *dtg=top /bot; *dta=-dendry*dz/ (Gx*dt*e )*((*dtg)*bb-dm *f); t=tda+(*dta); ps=satpr(t); *h=huma-dm *dendry*dz/ (Gx*dt); p=(*h)*apr / (.622+(*h)); *rha=p/ps; frh=(*rha)-rhmax;

retumfrh;

91

/* Program name: /*Purpose: /*File: /*Date:

Data scanner Scans input from modell.dat getvalue .cpp 17 /3/95

/* Modell.dat file format:

Leave a space on both sides of each value after the=

Specific heat of grain= .39466 Btu/lbm/F Specific heal uf waler vapor= .444 Blu/lbm/F Specific heat of water liquid= 1.0 Btu/lbm/F Specific heat of air= .24 Btu/lbm/F Moisture content hmiter (0 =goal, 1 =change hmit)= 0 Moisture content goal= .1 dry basis, ratio Moisture content change hmit (>=.1, <=10%,. d.b.)= .2 Moisture content change period (>= 5, <=6Clmin)= 60 Density of dry grain= 21.12 lbm/ftA3 Dry wt./ area= 56.31 lbm/ftA2 Bed depth= 32 in Time step= 2 min Time hmit criterion= 1.667e-4 min RH root criterion= 1.0e-4 rh, decimal Max airoff rh= .98 decimal Grain temperature, initial= 86.0 F Moisture content, initial= .8868 dry basis, decimal Max No. of ambient input steps= 5 No. of layers= 150 Print layer results each 3 time steps Print layer results each 1 layers Kiln bed surface area= 5760 ftA2 Total inlet area of fans= 143.1 ftA2 Fan efficiency= .638 ratio Cost per kWhr= .03 $ Cost per therm= .34 $

*/

#include <stdio.h> #include <stdlib.h> #include "modell .h"

*/ */ */ */

int getvalues(float *cpg, float *cpv, float *cpl, float *cpa, float *mcgol, double *dendry, double *dwa, float *z, double *dt, float *epsi, float *eps, float *rhmax, float *tgini, float *mcini, int *N, int *nz, float *kwhcost, float *therm.cost, int *endcrit, int *mcchamin, float *mcchahm)

int check; FILE *fin;

92

fin=fopen("modell.dat", "r"); if(fin== NULL)

printf("\n\nCouldn't open file for reading\n");

fscanf(fin, "%*s %*s %*s %*s %*s %*s %*s %*s %*s %*s %*s" II % *s");

check=fscanf(fin, "% *s % *s % *s % *s %f % *s", cpg); check+=fscanf(fin, "% *s % *s % *s % *s % *s %f % *s", cpv); check+=fscanf(fin, "% *s % *s % *s % *s % *s %f % *s", cpl); check+=fscanf(fin, "% *s % *s % *s % *s %f % *s", cpa); check+=fscanf(fin, "% *s % *s % *s % *s % *s % *s % *s % *s % *s" " % *s %i", endcrit);

check+=fscanf(fin, "%*s %*s %*s %f %*s %*s %*s", mcgol); check+=fscanf(fin, "% *s % *s % *s % *s % *s % *s % *s %f", mcchalim);

check+=fscanf(fin, "% *s % *s % *s % *s % *s % *s % *s %i", mcchamin);

check+=fscanf(fin, "% *s % *s % *s % *s %If% *s", dendry); check+=fscanf(fin, "% *s % *s %If % *s", dwa); check+=fscanf(fin, "% *s % *s %f % *s", z); check+=fscanf(fin, "% *s % *s %If% *s", dt); check+=fscanf(fin, "%*s %*s %*s %f %*s", epsi); check+=fscanf(fin, "% *s % *s % *s %f % *s % *s", eps); check+=fscanf(fin, "% *s % *s % *s %f ~~ *s", rhmax); check+=fscanf(fin, "% *s % *s % *s %f % *s", tgini); check+=fscanf(fin, "% *s % *s % *s %f % *s % *s % *s ", mcini); check+=fscanf(fin, "% *s % *s % *s % *s % *s % *s %i", N); check+=fscanf(fin, "% *s % *s % *s %i", nz); check+=fscanf(fin, "% *s % *s % *s %f % *s", kwhcost); check+=fscanf(fin, "% *s % *s % *s %f ~Y.1 *s", therm.cost);

fclose(fin);

if( check! =21) { printf("\nData not read in properly\n");

return O;

printf("\n\ncpg= %6.3f\t\tcpv= %6.3f", *cpg, *c1w); printf("\ncpl= %6.3f\ t\ tcpa= %6.3f\ t\ tend criterion= %s", *cpl, *cpa, ((*endcrit==O) ? "goal":"change limit"));

if (*endcrit==O) printf("\nmcgol = %5.3f ratio, d.b.", *mcgol);

else printf("\nm.c. change limit= %5.2f % % d.b.\nm.c." "change time= %i min", *mcchalim, *mcchamin);

printf("\ndendry= %6.3lf\t\tdwa= %6.3lf", *dendry, *dwa);

printf("\nz= %6.3f\t\tdt= %6.3lf\t\tepsi= %g", *z, *dt, *epsi);

printf("\neps= %g\t\trhmax= %6.3f\t\ttgini= %6.3f", *eps, *rhmax, *tgini);

printf("\nmcini= %6.3f\ t\ tN= %3i\ t\ t\ tnz= %3i", *mcini,

93

*N, *nz);

*cpg=4.1868*(*cpg); *cpv=4.1868*(*cpv); *cpl=4.1868*(*cpl); *cpa =4.1868*(*cpa); *mcchahm / = 100.; *dendry=16.0184*(*dendry); *dwa=4.8824*(*dwa); *z= .0254 *(*z); *tgini= .55556*(*tgini-32.0);

return 1;

/* Program name: /*Purpose: /*File: /*Date:

#include <stdio.h> #include <stdlib.h> #include <math.h> #include "modell.h"

Heat exchanger i/ o properties Interpolates air properties for htx htxinput.cpp 20/3/95

*/ */ */ */

int htxinput(float et, float *Tat, float *rha, float *htxair, float *Gx, int N, double *time, double *tatm, double *rhat, double *htxtemp, double *G)

int i=l; float frac; /* weight fraction for inte,rpolation * /

while (i<=N && et>(time[i]-.0001)) i++;

if(i==N) if(et > time[i]) {

printf("\n\nDrying time exceeds drying input" "time data.\nShorten run time/increase input" " time steps."); return -1;

if(fabs(et-time[i]) < 1.0e-3) {

else

*Tat=tatm[i]; *rha=rhat[i]; *htxair=htxtemp[i]; *Gx=G[i];

94

frac={ et-time[i-1 ])/ {time[i]-time[i-1 ]); *T at=tatm[i-1 ]+frac*(tatm[i]-tatm[i-1 ]); *rha=rhat[i-1 ]+frac*(rhat[i]-rhat[i-1 ]); *htxair=htxtemp[i-l]+frac*(htxtemp[i]-htxtemp[i-1]); *Gx=G[i-1 ]+frac*(G[i]-G[i-1 ]);

return 1;

/* Program name: /*Purpose: /*File: /*Date:

#include <stdio.h> #include <stdhb.h> #include <math.h> #include "model1.h"

Malt drying layer solver module Executes sequence of layer steps hter.cpp 23/3/95

*/ */ */ */

int liter(double *rh, double *mcdb, double *tg, double> *ta, double *rt, double *hum, double dt, int nz, float apr, float htxair, float Gx, float *mcmean, float rhda, float huma, float dz, float rhmax, float cpg, float cpv, float cpl, float cpa, float dendry, float eps, int maxit)

inti; float a, b, f, e, ge, yy,

top, bot, bb, /* intermediate calculation values * / dk, /* drying constant * / dm, /*water mass change at step * / dta, /*air temperature change * / dtg, /*grain temperature change*/ eqmcwb, /* equilibrium me, wb, ratio * / eqmcdb, /* equilibrium me, db, ratio * / frh, /*function to hmit rha to rhmax * / h, /* humidity variable for search functions * / ht,/* heat transfer coefficient:*/ lmv, /*latent heat of malt moisture*/ p, /*water vapor pressure, atm */ ps, /*water vapor sat. pr., atm * / tda=htxair; /* drying air temperature * /

ht=175.07*pow(Gx,.6906);

for{i=l;i<=nz;i++) {

dk=11961456.*exp{-6819.5249/{273.16+tda)); if(rhda>rhmax)

rhda=rhmax; eqmcwb={10.5283-log(-8.315*(tda+273.16 )*log(

rhda)))/29.9957;

95

eqmcdb=eqmcwb / (1.-eqmcwb ); dm=-dk*dt*(mcdb[i]-eqmcdb)/(1.+dk*dt*.5); a=2. *(tda-tg[i]); b=cpg+cpl*mcdb[i]; f=cpv*tda+2501.61-tg[i]*cpl;

lmv=2501.61*(1.+.5704*exp(-13.67*mcdb[i])); yy=cpv*tda+lmv-cpl*tg[i]; frh= frhcalc(cpa, cpv, cpl, huma, dm, dendry,

dz, Gx, dt, a, yy, ht, f, b, tda, apr, &dtg, &dta, &h, rhmax, &rhda);

if (frh>eps) if(rootfind(frh, &dm, rhmax, &rhda, cpa, cpl,

cpv, huma, &h, dendry, dz, Gx, dt, yy, ht, f, b, a, tda, apr, &dtg, &dta, eps, maxit) ==-1)

tg[i]+=dtg; tda+=dta;

printf("\n\nJayer= %i", i); printf(11\nHit enter to end"); getchar(); return -1;

ta[i]=tda; mcdb[i]+=dm; rh[i]=rhda; hum[i)=huma=h; rt(i)=dm/ dt; *mcmean+=mcdb[i];

*mcmean/ =nz;

return 1;

/* Program name: /*Purpose: /*File:

Output file opener Opens an output file for program results Openout.cpp

/*Date:

#include <stdio.h> #include <stdlib.h> #include "modell.h"

FILE *openout(char *xx) {

int i=l, c;

17/3/93

char *f= "layerout.01 ";

*/ */ */ */

96

FILE *fp, *fpin;

fp=fopen(f, "r");

while ((i<10) && (fp !=NULL)) {

fclose(fp ); f[lO] = (char)(i+48); fp=fopen(f, "r"); i++;

while ({i>=lO) && (i<100) && (fp !=NULL)) {

fclose(fp ); f[9]=( char )(i/10+48); f[10]=(char)(i% 10+48); fp=fopen(f, "r"); i++;

if (fp!=NULL) {

else

printf("\nAll timeout.* (1-99) are used. Change" "directories!");

return NULL;

fdose(fp); fp=fopen(f, "w"); xx[8]=f[9]; xx[9]=f[10]; printf("\n\nOutput file: %s", xx);

fpin=fopen("modell.dat", "r"); if (fpin==NULL) {

printf("\n\nModell.dat can't be opened in openout"); return NULL;

return fp;

/* Program name: /*Purpose: /*File:

Results printint module Prints time and layer results prtimdat.cpp

*/ */ */ */ /*Date: 23/3/95

97

void prlaydat(float et, float mcmean, float Gx, float htxair, int nz, double *mcdb, double *ta, double *tg, double *hum, FILE *flayer, int layint)

inti;

fprintf(flayer, "\n\n\nTime= %3.0f min\tAve M.C.= %4.lf %" "w.b. ",et, mcmean*100);

fprintf(flayer, 11\nG= %5.2f lbm/(ft'12*min)\tHtxair= %3.0f" 11 F11

, Gx/4.8824, htxair*1.8+32.);

fprintf(flayer, 11\n\nMalt M.C. Air Grain 11

"Air\nLayer D.B. Temp. Temp. Humidity\nNo." " % F F lbm/lbm"); fprintf(flayer, "\n ______________ _

" __ "); for(i=layint;i<=nz;i+=layint)

fprintf(flayer,"\n%3i %4.1f %5.2f %5.2f"

/*Program name: /*Purpose: /*File: /*Date:

#include <stdio.h> #include 11model1.h11

" %6.5f", i, mcdb[i]*100, ta[i]*1.8+32, tg[i]*1.8+32, hum[i]);

Results printint module Prints time and laye·r results prtimdat.cpp 23/3/95

*/ */ */ */

void prtimdat(float et, float Tat, float hum.a, float htxair, float Gx, double *ta, double *hum, float mcmean, FILE *ftime, int nz, double *tg, float htxen)

fprintf(ftime, "\n%-4.0f %5.3f %5.H %5.lf" " %8.6f %5.H %8.6f %5.H %6.2f %5.H %5.H %5.lf II

11 %S.1f11, et, Gx/60, htxair, Tat, huma, ta[nz],

hum[nz], mcmean*100, htxen, tg[nz/8], tg[nz*3/8], tg[nz*5/8], tg[nz*7 /8]);

/* Program name: /*Purpose: /*File: /*Date:

#include <stdio.h> #include <stdlib.h> #include <math.h> #include "model1.h11

Condensation procedure solver Finds value of dm for rha=rhmax rootfind.cpp 23/3/95

*/ */ */ */

98

99

int rootfind(float frh, float *dm, float rhmax, float *rha, float cpa, float cpl, float cpv, float huma, float *h, float dendry, float dz, float Gx, double dt, float yy, float ht, float f, float b, float a, float tda, float apr, float *dtg, float *dta, float eps, int maxit)

int i=l; float xl, xh, xav, fl, fh, fx, dx, rts;

/* bracketing * / xl= *dm; fl=frh; xh=xl+ .0006; fh=frhcalc(cpa, cpv, cpl, huma, xh, dendry, dz, Gx, dt,

a, yy, ht, f, b, tda, apr, dtg, dta, h, rhmax, rha);

while(fl*fh>0.0 && {i++}<=100) {

xl=xh; fl=fh; xh+=.0006; fh=frhcalc(cpa, cpv, cpl, huma, xh, dendry, dz, Gx, dt,

a, yy, ht, f, b, tda, apr, dtg, dta, h, rhmax, rha};

if (fl*fh>O.O) {

printf("\n\nrh= %4.3f root not bracketed in ROOTFIND", rhmax);

printf("\ni= %i", i); printf("\nfrhfin= %f", fh); printf("\ndmini= %f", *dm); printf("\ndmfin= %f", xh); return -1;

for{i=l;i<=S;i++) {

xav={xl+xh) / 2.; frh=frhcalc{cpa, cpv, cpl, huma, xav, dendry, dz, Gx, dt, a, yy, ht, f, b, tda, apr, dtg, dta, h, rhmax, rha); if(fl*frh>O.) {

xl=xav; fl=frh;

else if(fl*frh<O.O) {

} else {

xh=xav; fh=frh;

*dm=xav; return 1;

/*SECANT METHOD * /

if (fabs(fl)<fabs(fh)) {

else

rts=xl; xl=xh; fx=fl; fl=fh;

rts=xh; fx=fh;

for(i=l;i<=maxit;i++) {

dx=(xl-rts )*fx/ (fx-fl); xl=rts; fl=fx; rts+=dx; fx=frhcak(cpa, cpv, cpl, huma, rts, dendry, dz, Gx,

dt, a, yy, ht, f, b, tda, apr, dtg, dta, h, rhmax, rha);

if((fabs(dx)<eps) I I (fx==O.O)) {

*dm=rts; return 1;

printf("\n\nMaximum number of iterations exceeded in" "Rootfind ");

return -1;

/*Program name: /*Purpose:

/*File: /*Date:

float satpr(float tg) {

Saturation Pressure Calculate water saturation

pressure, atm arrayini.cpp 20/3/95

float a, b, c, d, /*constants for sat. press. curve-fit equ's */

*/

*/ */ */

100

t, /*inverse of abs. temp (K) * 273.16 * / s; /*saturated vapor pressure*/

t=273.16/ (273.16+tg); a;;:l0.79586*(1-t); b=S .02808*log 1 O(t ); c=l .5047 4e-4 *(1-pow(l0,-8.29692*(1 / t-1.)) ); d=4.2873e-4*(pow(10,4.76955*(1.-t))-1); s=pow(lO, a+b+c+d-2.2195983);

returns;

/* Program name: /*Purpose: /*File: /*Date:

#include <stdio.h> #include <stdhb.h> #include <math.h> #include <conio.h> #include "modell.h"

Malt drying time solver module*/ Executes sequence of time steps*/ titer .cpp * / 17/3/95 */

101

int titer(float mcin, double *rh, double *mcdb, double *tg, double *ta, double *rt, double *hum, float z, float tml, double dt, int nz, float mcgol, double dendry, double dwa, double *timein, double *tatm, double *rhat, double *htxtemp, int N, double *G, float apr, float rhmax, float cpg, float cpv, float cpl, float cpa, float eps, int maxit, float kwhcost, float thermcost, int endcrit, int mcchamin" float mcchahm)

float airflow, /* htx airflow, cfm */ dz=z/ nz, /* length of depth increment, m * / dp, /*pressure drop through bed * / et=O.O, /* elapsed time * / fancost, /* cost of energy usE:~d by fans, $ * / fanenergy=O, /* kwh used by fans * / Gx, /* htx airflow at et * / htxair, /*air temp after htx at et*/ htxcost, /* cost of energy usf~d by htx, $ * / htxen=O.O, /*cumulative heat energy to dry malt, MJ/mA2 * / huma, /* atmospheric humidity ratio at et * / iamb, /* enthalpy of ambient air * / ihtxair, /*enthalpy of air afb>.r htx * / mciniwb, /*initial me, wb, ratio * / mcmean=mcin, /*average hied me at et, ratio, D.B. * / mcmeanlast=mcin, /* mcmean at mcchamin minutes before

mcmeanwb, mccha=lOO.,

current mcmean * / /* mean me, wb, ratio * / /*percent change in moisture content over mcchamin * /

pv, /* water vapor press., atm * / rha, /* atmospheric rh at et, ratio * / rhda, /* drying air rh, ratio * /

Tat, /* atmosphf~ric temp at et*/ totcost, /* total fan and htx costs * / vbed, /* velocity of air through bed, ft/ min * / vex, /* specific air volume of exhaust, Ihm/ ft"3 * / vfan, /*velocity of air through fan, ft/min*/ vhtx, /* specific air volume htx, Ihm/ ft"3 * / zini=z; /*initial bed depth, m * /

int j; FILE *flayer, *ftime, *fpin; char *xx="timeout.1 ",/*time step output file string*/

c; /*copy char for inputair.dat * /

clrscr(); flayer=openout( xx); if (flayer==NULL) return -1;

ftime=fopen(xx, "w"); if (ftime==NULL) {

printf("\n\nCouldn't open %s for output", xx); return -1;

/*Print inputair.dat and model1.dat to timeout.xx*/

fprintf(ftime, "INPUTAIR.DAT\n\n"); fpin=fopen("inputair .dat", "r"); while((c=fgetc(fpin))!=EOF)

fputc(c, ftime); fdose(fpin); fpin=fopen("model1.dat", "r"); fprintf(ftime, "\ n \ nMODEL1. DAT\ n\ n "); while( ( c=fgetc(fpin) )! = EOF)

fputc(c, ftime); fdose(fpin);

mciniwb=mcmean/ (1. +mcmean)*100;

fprintf(ftime, "\n\nMin Flow (kg/m"2/s) Aotemp Tamb " "Humamh Tex Humex Mcdh Htxen (MJ/m"2) Tel Tc2 Tc3 " "Tc4");

printf("\ n Working ... ");

_setcursortype(_NOCURSOR); gotoxy(1, 15); printf("Elaptime = ");

while (((endcrit)? (mccha > mcchahm): (mcmean > mcgol)) && et<= tml)

{ gotoxy(12, 15); printf("%4.0f", et);

102

if (htxinput(et, &Tat, &rha, &:htxair, &Gx, N, timein, tatm, rhat, htxtemp, G)==-1) return -1;

pv=rha*satpr(Tat); huma=.622*pv / (apr-pv); rhda=pv / satpr(htxair);

htxen+=Gx*(htxair-Tat+huma*l.805*(htxair-Tat))*dt /1000.;

fanenergy+=600.*dt/60.*(1.4:07e-6*Gx*Gx*Gx*Gx-1.272e-4 *Gx*Gx*Gx+4.64e-3;'Gx*Gx-5.626e-2*Gx+ .2684);

mcmean=O.O; j=hter(rh, mcdb, tg, ta, rt, hum, dt, nz, apr,

htxair, Gx, &mcmean, rhda, huma, dz, rhmax, cpg, cpv, cpl, cpa, dendry, eps, maxit);

if(j==-1) return -1;

mcmeanwb=mcmean/ (1. +mcmean)*lOO.; z=zini*(l .-.1591 *(1.-exp(-.0966*(mciniwb-

mcmeanwb )))); dendry=dwa/ z; dz=z/nz; et+=dt; if (!(((int)(et +mcchamin)) % mcchamin)) {

mccha = mcmeanlast - mcmean; mcmeanlast = mcmean;

prtimdat(et, Tat, huma, htxair, Gx, ta, hum, mcmean, ftime·, nz, tg, htxen);

_setcursortype(_NORMALCURSOR); /* 145.43 metric tons dry malt per batch*/ fancost=fanenergy*kwhcost/145.43 / (1. +mcmean); htxcost=htxen*thermcost/ dwa/ (1. +mcmean); totcost=fancost+ htxcost; fprintf(ftime,"\n\nHeat energy (GJ/ton): %5.3f", htxen/

dwa/ (1. +mcmean) ); printf("\n\nHeat energy (GJ/ton): %5.3f", htxen/ dwa/(1.

+mcmean)); fprintf(ftime,"\n\nFan cost ($/ton)= $%4.2f\nHtx cost"

"($/ton)= $%5.2f\nTotal cost ($/ton)= $%5.2f", fancost, htxcost, totcost);

printf("\n\nFan cost ($/ton)= $%4.2J\nHtx cost" "(S/ton)= $%5.2f\nTotal cost. ($/ton)= $%5.2f", fancost, htxcost, totcost);

fprintf(ftime,"\n\nFinal bed depth: %5.2f in", z*39.37); printf("\nFinal bed depth: %5.2£ in", z*39.37);

103

if(mcmean<=mcgol) printf("\n\nMoisture content goal reached");

if (mccha < mcchalim) printf("\n\nMoisture content change limit reached");

if (et>tml) printf("\n\nTime limit reached");

return 1;

/* Program name: /*Purpose: /*File:

Deep bed malt drying U. Michigan Executes sequence of program steps Modell.cpp

*/ */ */ */ /*Date: 17 /3/95

#include <stdio.h> #include <stdhb.h> #include <conio.h> #include "MODELl.H"

main() {

/* N no of ambient temp input values * / int N, nz, i,

maxit=50, /*max iterations for secant condensation procedure*/

endcrit, /* end criterion: O= m.c. goal, 1 = m.c. change limit * /

mcchamin; /* period of minutes for checking m.c. change percent * /

double dendry, dwa, dt, dz, mcmean, *timein, *tatm, *rhat, *mcdb, *ta, *tg, *rt, *hum, *rh, *p /* pointer for array malloc * /, *G, *htxtemp;

104

float apr=l.O, cpg, cpv, cpl, cpa, mcgol, tml, z, epsi, eps, rhmax, tgini, mcini, thermcost, kwhcost, mcchalim; /* m.c. change % limit * /

printf("\n\nModell.c Grain Drying Model\n\n");

if(!getvalues(&cpg, &cpv, &cpl, &cpa, &mcgol, &dendry, &dwa, &z, &dt, &epsi, &eps, &rhmax, &tgini, &mcini, &N, &nz, &kwhcost, &thermcost, &endcrit, &mcchamin, &mcchalim))

getch(); exit(-1);

printf("\nHit any key to continue"); getch();

p=dvector(l,5*N + 7*nz);

timein=p;

tatm=p+N; G=tatm+N; rhat=G+N; htxtemp=rhat+N; mcdb=htxtemp+N; rt=mcdb+nz; ta=rt+nz; tg=ta+nz; rt=tg+nz; hum=rt+nz; rh=hum+nz;

if (airinit(timein, tatm, rhat, htxtemp., G, &N, &tml)==-1) exit (-1);

arrayinit(rh, mcini, tgini, mcdb, tg, ta, rt, hum, nz, apr);

105

i=titer(mcini, rh, mcdb, tg, ta, rt, hum, z, tml, dt, nz, mcgol, dendry, dwa, timein, tatm, rhat, htxtemp, N, G, apr, rhmax, cpg, cpv, cpl, cpa, eps, maxit, kwhcost, thermcost, endcrit, mcchamin, mcchalim);

if (i==-1) exit (-1);

return 1;

ffMV MGNVH NOil..ISiilO=>V V .L \1(] GNV '10N.LNO=> N3:INQ

a XIGNtldclV

107 1. Neptronic Baby Blue Damper Motor, Model BBM2000.

2. Schaevitz Pressure Transducer, Model P3061.

3. Omega Type-T Hypodermic Needle Thermocouple Probes, Model HYP-0.

4. Kapton 28-gauge Type-J Thermocouple Wires, custom-made at Grant Edgel in Portland, OR.

5. Athena SCR Controller, Model 932-48030-AO.

6. Vaisala Relative Humidity Sensor, Model HMP 135Y.

7. Vaisala Relative Humidity Sensor, Model HMW SOU.

8. AND Digital Scale, Model FG-150K.

9. Keithley Series 500 Data Acquisition and Control System.

10. AST 80286 PC-Compatible Computer, Model AST 286.

tUH1Gtl:)0Nd NOI1.\1113d0 NHING

3: XIGN3ddV

Drier Operation and Setup

71zis procedure covers filling the deep-bed malt drier, running the drying program FLOWCON, emptying the drier, sampling the finished malt, and program operation.

A. FILLING THE DEEP-BED MALT DRIER

·Remove any malt left over in the plenum or in the drying chamber.

109

•Turn the scale on with only the drier plenum resting on it and wait till 0.0 lb. or

kg shows on the scale. If 0.0 lb./kg does not show up, the weight on the scale is

above the tare limit. Remove the weight and turn the scale off and on again.

·Disconnect the flexible connector, if necessary, from the drier plenum inlet and

rotate the plenum so the flexible connector is not contacting it.

•Put the support bar and aluminum screen on the supports in the drying

chamber.

•Put the clean middle gasket on top of the plenum's flange and align the mark on

the gasket, facing up, with the flange mark, keeping the bolt holes aligned.

•Wipe the bottom flange of the drying chamber and align the marks on the side

of the bottom flange and the mating flange while keeping the bolt holes aligned

as you put the drying chamber on the plenum. Bolt the flanges together with the

114" 1112" long hex-head bolts, washers and wing nuts. Tighten finger-tight.

•Put the top red-rubber gasket on the drier chamber's top flange without

aligning it (just to tare the scale), and put the exhaust tube on the flange, resting

the bolts in the holes and putting the wing nuts and washers on exhaust tube's

flange.

•Without any external connections, push the tare button on the scale.

•Remove the bolts, washers, wing nuts, exhaust tube, and the gasket.

•Technique for filling the drying cham her:

•Note the weight, before filling the drying chamber with malt, for reference.

•Refer to Figure 31 for a cut-away side view of the drier when filled with

malt.

•Add 10 lb. of malt and place a grain thermocouple on top of the malt. This

type of thermocouple has a perforated pvc cover and measures air

temperature between the grains. Bury it just enough so it stays in position in

110

the center of the drying chamber, and push the wire into the malt, guiding it

to the side of the drier closest to the point where the wire will connect above

the drier.

•Use a wire twist-tie to keep the thermocouple wire at the side of the drier

and connect the wire to the plug above the drier.

·Add enough malt for a 30 lb. total, and pack it down to the 12 in mark,

which is on the inside drier wall.

•Repeat the method of adding a thermocouple for the second thermocouple.

•Add enough malt for a 50 lb. total and pack it down to the 20 in mark.

·Repeat the method of adding a thermocouple for the third thermocouple.

•Add enough malt for a 70 lb. total and pack it down to the 28 in mark.

·Repeat the method of adding a thermocouple for the fourth thermocouple.

•Add enough malt for an 80 lb. total and pack it down to the 32 in mark.

z 4

,~ Mall bed

Perforated plate

0 Sensor locator T=Thermocouple

Figure 31. Drier Filling Schematic.

•Record the initial depth of the malt. ·Disconnect each thermocouple's connector above the drier starting with the

first, or lowest, initially, and place each successively on top of the malt. Use

labels on the thermocouple wires to organize them. The order helps avoid

entangling the wires .

• Wipe the top flange of the drying chamber.

•Wipe the top red-rubber gasket and put it on the top flange, aligning the

marks and then the bolt holes.

111

•Wipe the bottom of the exhaust tube, align the exhaust tube's mating mark

with the mark on the top gasket, and put the flanges together, with the bolt

holes in alignment.

•Bolt the flanges together with the 114" 1112" long hex-head bolts, washers and

wing nuts and tighten.

•Reattach the grain thermocouples above the drier, starting with the last, or

highest thermocouple.

•Record the initial weight of the malt.

•Rotate the whole drier so the drier plenum air inlet is aligned with the inlet

air duct and attach the flexible connector, adjusting it as necessary to

minimize its effect on the scale's reading of the malt's initial weight, and

tighten the hose clamp to fix the flexible connector to the inlet duct.

•Record the weight with the flexible connector attached.

•Insert the Vaisala exhaust relative humidity probe in the bottom hole in the

exhaust tube and put the small red-rubber gasket on the end of the probe

inside the drier, sliding it against the inside drier wall. The general position

of the probe is shown in Figure 32. Position the relative humidity probe so

its tip is mid-way between the centerline and the wall of the exhaust tube.

-, RH ..,----

!\

"'"~ '~ Sample thermo-

couple wire position

/- Malt bed

£;:=:=:;::==:=:~~- Perforated plate

~Sensor locator T=Thermocouple RH=Relative

humidity sensor

Figure 32. Sensor Positions with Respect to the Drying Section.

·Record the weight with the flexible connector and the exhaust relative

humidity probe attached.

•Hang the six inch type-J thermocouple probe from above the drier and

position its tip close to the exhaust relative humidity probe's tip.

112

•Fold the cardboard flap, on the exhaust hood, down and attach it to the flap

on the left side of the exhaust hood with a piece of duct tape. The flaps

channel the drier exhaust air into the exhaust hood, and the tape holding the

front and left flaps together stops the flaps from being sucked against the

exhaust tube, which might affect the scale reading.

•Setup the drier control program by deleting or renaming any old 'flow.dat'

file. This file contains the drying measurements taken during a batch. All

new drying measurements are appended to the 'flow.dat' file, so nothing will

be lost. The 'drierinp.dat' file contains the drying schedule data for drier

control. Modify it for the drying schedule desired, using 25 or less lines of

input. See Figure 33 for an example of the drierinp.dat format. Note that the

first time value must be 0. Drying with the target-moisture-content

termination option is not recommended, since the moisture content estimate

is dependent on the initial moisture content, which is difficult to accurately

predict.

Time (min) Flow (lbm total air/ftA2 bed/min) Temp (F)

0 3 160

120 3 160

180 3 160

240 3 160

300 3 180

420 3 180

480 7 180

Figure 33. Drierinp.dat File Format.

•Try the flowcon program without the blower and heater on to see that all the

sensors work (use a 10 second save interval).

B. RUNNING FLOWCON

•Steps to run the drier control program after typing 'krun flowcon' at the DOS prompt in the directory with the flowcon.exe program.

1. Check the input data (from 'drierinp.dat') displayed on the screen

for errors. Ifthe drying schedule is not what you want, change the

'drierinp.dat' file, and re-run flowcon.

2. If you enter a number incorrectly, the program may crash. Hit <cntr­

break> and re-run the program.

113

3. Controller gains are tuned for the experimental drier as described in the

Research Malt Drier chapter of the thesis. They may be re-tuned for better

operation or different control equipment so the gains given here are just

suggestions. At the prompt "Input flow control proportional gain (>O):"

enter '1'.

4. At "Input flow control integral gain (>=O):" enter '0.2'.

5. At "Input heater control proportional gain (>O):" enter '0.5'.

6. At "Input heater integral gain (>=O):" enter '0.01'.

7. At "Input total run time (>O, < 4.29e6) sec:" enter a number of seconds for

the maximum drier run time (e.g. enter '54000' for 54000 seconds= 15

hours).

8. At "Input seconds per save data (>O, <65535) sec:" enter the sampling

interval for the malt temperature, weight, and inlet and exhaust air

conditions, which will be saved as data in 'flow.dat'. Typically, 120

seconds was used.

9. At "Input seconds per print data (>O, <65535) sec:" enter the interval at

which flow, heater temperature, and air-on temperature will be printed to

the screen. Typically, 5 seconds was used.

10. At "Input initial moisture content (>O, <1.0) wet basis, decimal:" enter the

initial moisture content of the malt as estimated from a moisture balance

or NIR test, both of which may be available at Great Western Malting

Company.

11. At "Input 0 to terminate at a target moisture content, or 1 to terminate at

minimum-moisture-content-change limit (0 or 1):" enter the method by

which drying will be stopped by the computer.

114

a. For the target moisture content:

1. At "Input moisture content goal (>O, <1.0) wet basis, decimal:"

enter the final moisture content desired.

b. For the minimum-moisture-content-change limit:

1. At "Input time for moisture-content-change-limit check (sec,

>=30,<=7200):" enter the sampling period over which the change in

moisture content will be calculated.

2. At "Input moisture content change for dryness check (% d.b., >O,

<=10):" enter the threshold of change in moisture content at which

drying should stop.

3. At "Input time for preheat before moisture content change limit

check (sec, >=5, <=3600):" enter the time required to start drying at

a rate which will not cause the moisture content change limit to

prematurely stop the drier. This may only be critical when drying

malt with a low initial moisture content.

12. At "Input initial weight of malt with no attachments and fan off (lb./kg,

>O, <=200):" enter the weight of malt, which you previously recorded,

with no attachments to the drier, except the air-on temperature

thermocouple.

13. "Weight test= ... " is just a check to ensure the computer and scale are

communicating properly. H "Check if scale is on and properly connected"

appears, there is a problem with the scale, and the program will

terminate. The scale must be connected to COM 1 on the computer with

the RS-232 cable. The cable also connects to the side of the scale display

console.

14. Turn on the fan, the heater power, and the exhaust fan. As soon as

possible, at "Hit 'y' to begin or 'n' to quit:", hit 'y' to begin.

•Record the initial weight with the fan on after about 20 seconds, so the air flow

is stable.

C. EMPTYING THE DRIER AND SAMPLING THE FINISHED MALT

•At the termination of drying, the blower should be turned off as soon as possible, because a small airflow leaks past the closed damper, which eventually adds moisture to the malt.

•Record the weight of the drier assembly with the blower off before

disconnecting anything.

•Disconnect the exhaust relative humidity probe, and before disconnecting

anything else, record the weight of the drier assembly.

115

·Disconnect the flexible connector from the drier plenum inlet duct. Record the

weight, which should be the final weight of the malt.

•Remove the exhaust thermocouple from inside the exhaust tube.

•Disconnect the grain thermocouples from above the drier, starting with the first,

or lowest, and proceed in order, dropping each thermocouple connector into the

malt.

•Remove the exhaust tube and red-rubber gasket.

•Record the final depth of the malt.

•Unbolt the drying chamber. It may be necessary to rock it from side-to-side to

loosen it from the drier-plenum flange.

•Attach the loose ends of the thermcouple wires to the top flange of the drier

chamber with a twist-tie.

·Pick up the drier chamber and hold it close to the surface on which you dump

the malt. This avoids stretching the thermocouple wires when the malt spills

out.

•Remove the twist-tie from the wires, put the drier chamber aside, and gently

remove the thermocouples and wires from the malt pile.

•Before sampling the malt for moisture or quality tests, dump it in the middle of

a large flat surface, split the pile into quarters, mix the opposite piles together,

combine the halves, and repeat the mixing and combining once more to

uniformly mix the malt.

D. FLOWCON PROGRAM OPERATION AND KNOWN BUGS

•For the target-moisture-content option, the computer displays the current

elapsed drying time (sec), the airflow (lbm total air/ft2 bed/min.), the airflow

set point, the air-on (drying air) temperature (F), the air-on temperature set

point, the scale's weight reading (lb./kg), the ambient air temperature (F), the

ambient relative humidity (% ), the drier exhaust air temperature (F), the exhaust

relative humidity (% ), the inter-grain air temperature (F) at 4, 12, 20, and 28 in.,

the moisture content(% dry basis) corrected for the weight due to attachments

116

and airflow, and the heater surface temperature (F), in this order. Figure 34

shows the display.

Sec 33360

Flow FlowSP Airontemp AirSP Weight Tamb 5.3 5.2 160.3 160.0 48.0 76.5

Talow Tamed Tahi Tahir Mcdb Htrtemp 163 163 162 161 10.41 270

Figure 34. Flowcon Display Format.

Rhamb Tex Rhex 38.7 154.6 3.9

·The minimum-moisture-content-change-limit-option display is the same as in

Figure 34, with the addition of 'Mcchange dee.' after 'Htrtemp.' This shows the

moisture content change as a decimal number over the last moisture-content­

change interval.

·Drying may be paused such that the heater is turned off and the damper is

closed by hitting the <esc> key at any time. The elapsed-drying-time timer stops

until the user hits 'y' at the prompt "Pausing ... Continue drying? (y or n):".

Hitting 'n' will cause the drying data collected prior to the pause to be saved to

'flow.dat', and the program will stop the current drying run.

•The 'drierinp.dat' file has the format shown in Figure 35.

Time (min) Flow (lbm total air/ftA2 bed/min) Temperature (F)

0 7.5 160

479.98 7. 5 160

480 5.25 160

719. 98 5.25 160

720 5.25 180

Figure 35. Drierinp.dat File Format.

The first line of headings is required for flowcon to read the data. Time is the

elapsed drying time. The first line of data must start with a time of 0 minutes.

Flow set point follows time (spacing is arbitrary) and temperature indicates the

117

desired drying temperature set point. Flowcon interpolates the flow and

temperature set points for elapsed drying times between the times entered in

'drierinp.dat'. If the drying time exceeds the last time point in 'drierinp.dat', the

last line in 'drierinp.dat' is used until drying ends. The maximum number of

input time points in 'drierinp.dat' is 25. More input can be accommodated by

increasing the MAXSET variable inflowcon.c and recompiling 'flowcon'.

•The screen displays values, for data, which randomly look erroneous or have

characters and symbols in place of numbers. There is nothing wrong with the

sensors or the actual data values in the computer. It seems there is a

programming deficiency, or the computer has difficulty with printing and doing

timer interrupts simultaneously. The flowcon display sometimes shows two

lines of data beneath the heading rows, which is another bug, but nothing is

wrong. The line of data directly below a heading is the most current one.

•For program comments, sensor-to-Keithley connection instructions, and more

detailed program explanations, refer to the source code files flowcon.c,

interrup.c, function.c, fvector.c, ivector.c, readscal.c, and setupcom.c.

NOl.L\!1103: MO!tl 3:.LV!d 3::)BINO

tl XIQN3:dd\f

119

This section develops the airflow measurement equation used to control

the airflow rate in the research malt drier. The sharp-edge orifice plate used in

the research drier has a 1.55 in diameter orifice. Referring to Figure 36 and the

list below for the nomenclature of the equation, the equation used to calculate

the mass flow rate of air, given by Miller (1989), is

where

Y .d2 ·C·J~hw ·Pn

1 I q = 0.09970190. ~1- 11-•

q = mass flow rate of air, lbm/ s,

Y1 = adiabatic gas expansion factor,

d =orifice diameter, in. (=1.55 in.),

C = discharge coefficient (true flow rate/ theoretical flow rate),

~w =differential pressure, in. w.g.,

Pn = density of air at 1, lbm / ft3,

B = d/D (=.55),

D =internal pipe diameter of 3 in. schedule 80 pipe(= 2.864 in.).

Note that a thermal expansion factor was not used in eq. (38), since all flow

measurements are assumed to be taken at room temperature (70 F).

q

(IJ ~1-D D/2~0 I I

-----11 ! I , I:~-

.. D

d I d _J

~/ Orifice Plate

Figure 36. Orifice Plate Schematic.

(38)

120

The adiabatic expansion factor is given by

Y1 =1-(0.4l+0.35·P4 )·~ (39) K

for downstream pressure taps less than D / 2 from the upstream face of the orifice

plate. The other variables are given by

Also,

x1=1- Pn

I

Pn

pfa =fluid static pressure at a (a= 1 or 2),

and

K = isentropic exponent (=1.4 for air).

Assuming Pn = 5 in. w.g., then

. . 1 psi Pn = 14.696 psi+ 5 m. w. g.x -----

27.6807 in w. g ..

= 14.8766 psia = 411.7956 in. water

~hw X1 = 411.796

~= ~hw K 576.514

4 ~hw yl = 1-(0.41+0.35. (0.55) ) . 576.514

= 1-7.667X10⁻⁴ • ~w·

~hw ~ 5 in. w. g., under typical experimental conditions, so

7.667 X 10⁻⁴ · ~hw ~ 3.83 X 10⁻³

Thus the term 7.667 x 10⁻⁴ · ~hw is negligible compared to 1.0, and we will

assume Y1 = 1.0.

The discharge coefficient is given by

b C = C 00 + Rn / RD > 4000 /

D

where RD is the Reynolds number based on the internal pipe diameter.

For D and D /2 pressure taps,

C00

= 0.5959+0.0312.p 2·1 -o.1s4.ps +0.0391·~-0.0158·P3 ,

1-p

b = 91.71 · p2·5

'

n = 0.75.

Assuming Pairflow = 0.0741 lbm / ft3 (at 70 F and 50% relative humidity),

4q = 426153·q, RD= nDvp

where q is given in lbm/s.

C00W = 0.55) = 0.604549 1 SO

c = c~ + :n = 0.604549 + 1.23353 x 10⁻³

D qQ

The average value of q for the experimental conditions is about 0.1062

lbm/s, so

1.23353 x 10⁻³ ~ 6.632 x 10⁻³ •

0.7t:;

q

Thus ~ is only 1.1 % of the C term, and it will be neglected. This Rn oo D

leaves us with C = 0.604549.

121

(40)

Assuming pfl = 0.0741 lbm / ft3,

q = 4.2705 X 10⁻² .J Ahw .

Equation (41) errs from the result given by eq. (38) by -1.8%, if pfl = 0.0714

lbm / ft3, and by 1. 9%, if pfl = 0.0769 lbm / ft3

122

(41)

viva 8NliUIQ 1VlN3:WHE£dX3:

8 XIQN3:ddV

Z' "tS

Qt ~ = ~ ~ i! 0 QJ u a QJ ~ ~ ~

Cl.) •"'4 0

:s

100

90

80

70

60

50

40

30

20

10

GWM piece #: C1272 Variety: Idaho Crystal

Dry date: 11 July 1995

Airon Temp: 63.3 C Air flow rate: .594 kg/m"2/s

----------------------~--------~-----, 0.014

- 0.012

0.01 s ~

~ "tS bO

0.008 t QJ

tU ~ bO

0.006 e E "tS •"'4 a = 0.004 ==

0.002

0 0 0 2 4 6 8 10 12 14 16

Time (Hours)

Figure 37. Experimental Batch 2. ~

~

100

90

80

70 ~ "'C

- -:f. 60 u 0 --t: = .e ~

50 &! = Q.I 0 ~u a t: Q.I .e ~ rJ'j

40 .... 0

:E 30

20

10

0

GWM piece#: C1275 Airon Temp: 71.1 C Variety: Idaho Crysta) Air flow rate: .57 kg/m"2/s

Dry dale: 12 July 1995

0.014

0.012

0.01 :s IU

t' "'C bl)

0.008 t Q.I

1; ~ bl)

0.006 e. £' "'C .... a = 0.004 ::I:

0.002

0 2 r;--~~~~~~:--~~~_j---===:t===j_~_Jo

4 6 8 10 12 14 16 Time (Hours)

Figure 38. Experimental Batch 3. ~ N Ul

:Q" ~

- o' ~~

t = .e ~ t! = Q,I 0 f:i.iu a t Q,I .e ~Cl.)

•"'4 0

~

Airon Temp: 75 C GWt\,1 piece #: C1276

Variety: Idaho Crystal

Dry date: 13 July 1995

Air flow rate: .57 kg/m"2/s

100 .-~~~--,-~~~~-,--~~~~r--~~~-r~~~~..,..-~~~---,.~~~~--.-~~~--- 0.014

90

0.012

80

_ _...,_ ___ ~·---·--~ ----·. --- ---..11 O.D1 :s 70

~

e-~ bD 60

0.008 ~ Q,I

1; ~

50

bD

0.006 ~ :S 40

~ '""" a = 0.004 ::i:::

30

20

0.002 10

L~~~~L~~~-J~~~~-t-~~~~+---~~~~~~~~;,:-~~~-:-:-~~~~ o 0 16 0 2 4 6 8 10 12 14

Time (Hours)

Figure 39. Experimental Batch 4. ~

N a--

;Q' "T::S

- Q' ~~

~ = .e ~ &! c:: QJ 0 ~u El ~ QJ .e

fo-4 (/j .... 0

~

GWM pi<'ce #: C1277 Variety: Idaho Crystal

Dry dale: 14 July 1995

Airon Temp: 81.1 C Air flow rate: .57 kg/m"2/s

100 .-~~~-,--~~~~r-~~~-,-~~~~,--~~~-,-~~~~,--~--~--~~~--- 0.014

90

80 -

70

60

50

40

30 Tamh

20

10

0.012

0.01 :s rU

~ ~

0.008 t i ~

0.006 ~ £ "T::S ·a :s

0.004 :I::

-~- 0.002

0 r-~~~--r~~~~-t-~~~--t~~~~-t-~~~~-1-~~~--+~~--~-+--~~~---t 0

0 2 4 6 8 . Time (Hours)

10 12 14 16

Figure 40. Experimental Batch 5. ~ N '.:I

:0-""0

- O' ~~

t = .e ! t! = QJ 0 ~u a t QJ .e

E-4 IJJ •f"'I 0

~

100

90

80

70

60

30

20

10

GWM piece #: C1278 Variety: Idaho Crystal

Dry datP: 14 July 1995

Airon Temp: 86.7 C Air flow rate: .57 kg/mA2/s

r------,-----r------.,.----.....,.....----.,...----~-----.------ O.OH

0.012

0.01 :s ~

t' ""a bl:)

- 0.008 t QJ 1; ~ bl:)

0.006 ~ ~ ""a •f"'I a = 0.004 =

0.002

0 0 0 2 4 6 8 10

Time (Hours)

Figure 41. Experimental Batch 6.

12 14 16

~ N 00

Z' """ - C' U CF --

t = ~ ~ Q,I Q

~u a t Q,I .a ~ fll

•"'4 Q

::E

GWM piece #: F2704 Variety: NW Harrington

Dry date: 22 July 1995

Airon Temp: 63.9 C Air flow rate: .57 kg/m"2/s

100 0.014

90

0.012 80

70 0.010 :s " e:-

""" bO

0.008 t Q,I .... " ~ bO

40 0.006 e E """ •"'4

30 a = 0.004 ::t=

20

0.002 10

0 0.000 0 2 4 6 8

Time (Hours) 10 12 14 16

Figure 42. Experimental Batch 9. ~ N \0

Z' ""='

- =' u '§-. --~ = .a ~ i! = QJ 0 ~u a ~ QJ .a

f--4 I'll .... 0

:E

GWM piece #: F2705 Variety: NW Harrington

Dry date: 22 July 1995

Airon Temp: 70.0 C Air flow rate: .57 kg/mA2/s

100 r-~~~-r~~~~-r-~~~-,~~~~-r~~~~-r-~~~--r~---~~~~~~~ 0.014

90

0.012 80

0.010 :s tU

~ 60 ""='

bO

0.008 t 50

Cl.I 1; ~ bf)

40 0.006 e .e-. ... ~ ....

jlJ a = 0.004 ~

20

-·- 0.002 10

0 t--~~~-+~~~~t--~~~-t-~~~~+-~~~---1-~~~~+-~---~--+-~~~----l 0.000

0 2 4 6 8 10 12 14 16 Time (Hours)

Figure 43. Experimental Batch 10. ~ VJ 0

::0-"CS

-~ u a:---t = .a b i! = QJ 0 ~u a t QJ .a ~ rlJ

•'"4 0

::E

GWM piece #: F2706

Variety: CN Harrington

Dry date: 2~ July 1995

Airon Temp: 75.0 C Air flow rate: .57 kg/m"2/s

100 0.014

90

0.012

80

70 0.010 :s I'd

e-60

"CS bl)

0.008 t QJ ....

50 I'd ~ bl)

40 0.006 ~

~ •'"4 "CS .•

30 a = . 0.004 =

20

0.002 10

0 l------1-----+------+-----+------t-----+------+------t 0.000 0 14 16 2 4 6 8

Time (Hours) 10 12

Figure 44. Experimental Batch 11. io--1-VJ io--1-

~ "a

--£ u Q --t = .a ~ ~ = Q.I 0 ~u a t Q.I .a ~fl} ....

0

::E

GWM piece #: F2706

Variety: CN Harrington

Dry date: 24 July 1995

Airon Temp: 81.1 C Air flow rate: .57 kg/mA2/s

100 0.014

90

80

60

50

40

30

20

10

0

O.D12

0.010 s ~

~ bl)

0.008 ~ ~ ~ bl)

0.006 ~ E "a .... a

0.004 =E

-·- 0.002 -- ---------·----------- ------- -------1

+------+----+------+-----+-----1------+-----+-------4 0.000 0 2 4 6 8

Time (Hours) 10 12 14 16

Figure 45. Experimental Batch 12. )o-ool

VJ N

:E' "'C

- o' ~~

t = .a ! ~ d Qi 0 ~u a t Qi .a

f--4 (/.) ... 0

~

GWM piece#: C1317 Variety: Idaho Crystal

Dry date: 9 August 1995

Airon Temp: 65.3 C Air flow rate: .57 kg/m"2/s

100 0.014

90

0.012 80

70 o.mo :s ~

e-"'C bl)

60 • -------·

.~. 0.008 ~ Qi

~ ~

50 bl)

0.006 e. .~

40 "'C •"'4

a = 0.004 ::i:: 30

20 r --- ! - -- - H - ____ j UL~ n f 1 --'

0.002 10

0 0.000 0 2 4 6 8 10

Time (Hours)

Figure 46. Experimental Batch 13.

12 14 16

~ VJ VJ

Z' ~

- =' Sd.. ~ ~ ""' .e ~ i! = Q.I 0 ~u a ~ Q.I .e ~fl.)

•.-! 0

~

GWM piece #: C1318 Variety: Idaho Crystal

Dry dale: 10 August 1995

Airon Temp: 70.2 C Air flow rate: .57 kg/ m "2/ s

100 0.014

90

80

70 -- * = ~ j l I F ----n+-n-- --nm-------

60

50

40

30

20

10

0.012

0.010 s ~

t> ~ tlO

0.008 t 1 tlO

0.006 ~ £' ~ •.-! a = 0.004 :I::

0.002

0 0.000

16 0 2 4 6 8 Time (Hours)

10 12 14

Figure 47. Experimental Batch 14. ~

~

~ ~

- o' u~ --t = 2 ~ a! 0 QJ u ~ QJ t ~ 2

-~ 0

~

GWM piece #: F2757

Variety: NW Harrington

Dry date: 13 September 1995

Airon Temp: 71.1 C, 8 hr; 82.2 C, 7 hr.

Air flow rate: .57 kg/mA2/s, 8 hr; .43 kg/mA2/s, 7 hr.

100 .--~~~---~~~~-.-~~~--,~~~~---.-~~~~..,.-~~~--,.~~~~~~~~---. O.o14

90

80

70

60

40

30 IL ' I ' I 'l~m--- ----~-

20 r ~ l ----~ l -- J L _ _ t - 1 "

10

0.012

0.010 s tU

t' ~ bl)

0.008 t ~ ~ bl)

- 0. 006 i::!. ~ ~

l~ = 0.004 :I:

0.002

0 0.000

0 2 4 6 8 10 12 14 16 Time (Hours)

Figure 48. Experimental Batch 20. ~ VJ 01

:r;­"i::$

- o' ~~

t = .a ~ a! = QJ 0 ~u a t QJ .a ~ Cll

·~ 0

::E

100.

90

80

60

40

GWM piece #: F2758 Variety: NW Harrington

Dry dale: 24 July 1995

30 • ' l < I >v "

20

10

Airon Temp: 73.3 C, 10 hr; 83.3 C, 6 hr. Air flow rate: .57 kg/ m "2/ s, 6 hr;

.57->.24 kg/m"2/s, 4 hr .24 kg/m"2/s, 6 hr. O.Ol

4

0.012

0.010 i -9' 00

0.008 ~

~ ~ 00

0.006 ~ ~ "i::$ ·~ a = 0.004 :I:

0.002

0 0.000 0 2 4 6 8 10

Time (Hours)

Figure 49. Experimental Batch 21.

12 14 16

~ VJ

°'

Z' "tS

-~ u~ --t = ii Cl.I 0 ~u a t QJ .a

r--e ti) ... 0

~

GWM piece#: F2759 Variety: CN Harrington

Dry date: 15 SPptember 1995

Airon Temp: 72.2 C, 10 hr; 83.3 C, 6 hr. Air flow ratf': .57 kg/ m "2/ s, 6 hr;

.57->.24 kg/m"2/s, 1 hr

100 .24 kg/m"2/s, 7 hr. O.Ol4

90

0.012 80

70. O.D10 S t'U

t-"tS bl) 60 ~-..l-=cawe I N'---- W!/"'!

0.008 ~ Cl.I Wamb ~ ~

50

bl)

- 0.006 e E 40

"tS ... a = 0.004 = 30 u. I I ==' ,, Tamb

20

0.002 10

0 0.000 0 2 4 6 8 10

Time (Hours)

Figure 50. Experimental Batch 22.

12 14 16

~ V.l 'l

;Q' "'C

- o" ~~ t: .... B ~ a! = G.i 0 ~u a t: G.i B ~{I}

·..i 0

~

GWM piece #: F2774 Variety: MT Harrington

Dry date: 30September1995

Airon Temp: 72.8 C, 10 hr; 83.3 C, 4 hr. Air flow rate: .57 kg/m"2/s, 6 hr;

.57->.24 kg/m"2/s, 4 hr .24 kg/m"2/s, 4 hr. 100 0.014

90

80

701~

60

50

40

30 ~· « I - H

20 - ----- __ _J__

10

0.012

0.010 :s ~

~ bl)

0.008 t ~ bl)

0.006 ~ :S "'C ·..i

§ 0.004 ::t:

- 0.002

0 0.000 0 2 4 6 8 10

Time (Hours)

Figure 51. Experimental Batch 24.

12 14 16

~ VJ 00

GWM piece #: F2775 Variety: MT Harrington

Dry date: 1October1995

Airon Temp: 72.8 C, 10 hr; 84.4 C, 4 hr.

Air flow rate: .57 kg/ m "2/ s, 8 hr; .43 kg/m"2/s, 6 hr.

100 0.014

90

0.012

80

~ 70 0.010 :s

ta "tS

at 60 -- $ bO

t = .a ! ~ r:: Q,I 0 ~u a t ~ i 40

•pol

0.008 ~

~ ~ bO

0.006 ~ £

0

~ 30 -- ---- - - ~

Tamh

"tS ·a ::i

0.004 ::z::

20

0.002 10

0 0.000 0 10 16 2 4 6 8

Time (Hours) 12 14

Figure 52. Experimental Batch 25. ~ VJ \0

NOSHIV<lWO:J V.LVQ 1V.1N3:WHEldX3: SilSN3:A 13:GOW

H XIGN3:ddV

90

80

70

Z' 60 ~

- =-u '§. --.et = 50

i! ~ Q,j 0

~u 40 Q,j j

f--t flJ

~

20

10

GWM piece#: C1272

V ariPty: Idaho Crystal

Dry date: 11July1995

Airon Temp: 63.3 C

Air flow ralP: .594 kg/m"2/s

m x D

• A

Mcdb exp

.1 m exp

.3 m exp

.5 m exp

.7m exp

Mcdb mod

.1 m mod

.3 m mod

.5 m mod

• " ... 7mmod

,_.,_.-, .• ., .... ,~.,..,:lr':ll?.t-~mEl?lmmm

0 t--~~~-+-~~~--+~~~~+-~~~-+-~~~--+~~~~-1-~~~~~~~__J

0 2 4 6 8 10 12 14 Time (Hours)

Figure 53. Batch 2 Model vs. Experimental Data.

16

~ ~ ~

90

80

70

GWM piece#: C1275

Variety: Idaho Crystal

Dry date: 12July 1995

~ 60 --- -

-~ Si~

~ = 2 ~ i! 0 QJ u ~ QJ ~

f-4 2 -~

~

/ )IC , , )IC

//)IC

50 ~--~··----­()IC

40 +---/

20

10

0

0 2

" ,

DD

D []

D D

__a[] [] -- ----

0[]

Airon Temp: 71.1 C Air flow rate: .57 kg/m"2/s

~~·········· D ....... _

,... -w-~uup•mmmmmamammmmmmmmmmm

4 6 8 10 12 14 Time (Hours)

Figure 54. Batch 3 Model vs. Experimental Data. ~ ~ N

90 -

80

70

Z' 60 "'O

... cr~ --t = 50 .e : 1! d QJ 0 ~u 40 a t QJ .s

f--4 fl.) .... 0

30 :E

20

10

0

0

GWM piece#: C1276 Airon Temp: 75.0 C

Variety: Idaho Crystal Air flow rate: .57 kg/m"2/s

Dry dale: 13July1995

pgeecauu~u9ew;1111~~lllll .. ,l,ll""''''•l•••••1111 ·- ----

2

, --/--

----

/

• 1 , - .___ __,._ -.. . " ; ,,

• A • - --· • •

• ~~-,,,.

• ----.-• •

-~ -.----------• •

• •

T - .. , Y'"'nlHSJLll,dQ>oooc)ooooocl>oooo

4 6 8 10 12 Time (Hours)

Figure 55. Batch 4 Model vs. Experimental Data.

14

0 Mcdb exp

a .1 m exp

• .3 m exp

• .5 m exp

• .7m exp

Mcdb mod

---.1mmod

.3m mod

.5 m mod ....... 7m mod

~ ~ VJ

Airon Temp: 81.1 C GWM piece #: C1277

Variety: Idaho Crystal Air flow rate: .57 kg/m"2/s

Dry datP: 14 July 1995

90 r-~~~~r-~~~---,~~~~---r~~~~-,~~~~---r-~~~~-,-~~~~-.

80

70

~ 60

-~ u a:-- -~ = 50 .. ~ ~ = Qi 0 ~u a t 40 Qi .e

fo-4 Cl.l .• 0 ~ 30

20 ---- -

10

-----------.k,cttegC1u~;.J1il•llJlllflhP8'•19 ... llll.tlll11111•11a•lia1111_

.. •

.f' ,·· 1· /_ .. I .. ,

.. I

~ .. , . .. " . ----r - .--

" . A •

• ·---­•

0 0 ·~--

() ()

00

- ·· v'-"'""tppnonoooOO<l>OOOQOOOOO<!>OC>OC>OOOOO

0 t--~~~---t~~~~-+~~~~-+-~~~~-+-~~~~+-~~~---1~~~~--I 0 2 4 6 8 10 12 14

Time (Hours)

Figure 56. Batch 5 Model vs. Experimental Data.

0 Mcdb exp

D .1 m exp

• .3 m exp

• .5 m exp

• .7m exp

Mcdb mod

.1 m mod

.3mmod

.5 m mod

r .... ".7m mod

~ ~ ~

90

80

70

GWM piece#: C1278

Variety: Idaho Crystal

Dry date: 14July1995

\I- • -- --

• :c- 60 1- -l- -'t t "'tS "" ..

-a u~ --t = 50

~ ~ Q.I U II

~ 40 • I A...., ....

Q.I ~ f-4 I/} ....

0

~ 30

20

10

0

0 2

Airon Temp: 86.7 C

Air flow rate: .57 kg/ m "2/ s

•••i•••·················· i ------- --- ~--+-------- ----

f 1· ,, - I ,--

I ~

, • ,_ ___ -

_,. • I •

-- -· • .I' • • • -----------------+------- - - --1-------------- ------+--------- --~--

-------+--- - --------

-r= - ...... , ,, " 11 w>ooooooooocrioooooooooct>ooooo

4 6 8 10 12 14 Time (Hours)

Figure 57. Batch 6 Model vs. Experimental Data.

0 Mcdb exp

a .1 m exp

• .3 m exp

A .5 m exp

• .7m exp

Mcdb mod

.1 m mod

.3 m mod

.5 m mod ....... 7mmod

~ ~ 01

90

80

70

GWM piece#: F2704

Variety: NW Harrington

Dry dale: 22 July 1995

:c- 60 --­.,, - o' u ?F --j ~ 50

~ = QJ 0 ~u a e: 40 QJ .a

fo-4 fll •..C 0

•• • , . " - -·-- -• • ,

/

/

~ 30 - - - - ... ,,_ AMA•*•••

20

10

0

0 2 4

.~ .. ;:-~-r-~ •••• ., •• .. .. ,, . ,, .,.

-~•~ "I" .. ~ ~ .. ,, ,,. ~

6 8 10 Time (Hours)

Airon Temp: 63.9 C

Air flow rate: .57 kg/m"2/s

12 14

Figure 58. Batch 9 Model vs. Experimental Data.

0 Mcdh exp

a .1 m exp

• .3 m exp

• .5 m exp

• .7 m exp

Mcdhmod

---.1 mmod

.3 m mod

.Sm mod

..... ·• .7 m mod

~ ~

°'

90

80

GWM piecp #: F2705

Variety: NW Harrington

Dry date: 22 July 1995

Airon Temp: 70.0 C

Air flow rate: .57 kg/mA2/s

70 ~BB'~~wi;lill,li"lllll,illllltli,111111• .. ··---------Z' 60 "tS

ai --~ = 50 ~-i ~ QJ 0

~u 40 a ~ QJ .a

E--4 Cl.I ... 0 ~ 30 u ........

20 ~- -

10

0

0 2

• - ,_: __ . __ , . . ' . ;

• ;I _ __,

4

" _t__ , .

, . / .

, - •- --

• • • • . ----------------

6 8 Time (Hours)

--.W' 'YPOOQ<i)QQQQQOOOOct>OOOO

10 12

Figure 59. Batch 10 Model vs. Experimental Data.

14

0 Mcdb exp

a .1 m exp

• .3 m exp

• .5 m exp

• .7m exp

Mcdb mod

---.1mmod

.3mmod

.5 m mod

• ..... 7m mod

~ ~ '-J

GWM piece #: F2706

Variety: CN Harrington

Dry dale: 23 July 1995

90

80

~v 70 --

• Z' 60 ~

... CJ~ --e: = 50 .e ! ~ = GI 0 D ~u 40 a t GI .e

f""4 {fl ... 0

30 ~

20

10 I I

0

0 2 4

Airon Temp: 75.0 C Air flow rate: .57 kg/ m "2/ s

.. ,,,

ii • 1. .I' - •

- ----- -- ------ -

, "' •

f

_1 ____ ...

• __ ,_ ______ ·----- ----

~ nrk 0 "'"~-- I

1

o0 o<x)ooooroooooooo°'foooo

6 8 10 12 14 16 Time (Hours)

Figure 60. Batch 11 Model vs. Experimental Data.

0 Mcdh exp-]

a .1 m exp

• .3 m exp

A .5 m exp

• .7 m exp

Mcdh mod

---.1mmod

.3mmod

- .. .Sm mod ....... 7m mod

~ ~ 00

90

80

70

~ 60 - c" ~~ ~ = 50 .e ! G c: Qi 0 ~u e ~ 40 Qi .e

f--4 rtl •"'4 0

::E 30

20

10

0

0

GWM piece#: F2706

Variety: CN Harrington

Dry date: 24 July 1995

Airon Temp: 81.1 C Air flow rate: .57 kg/m"2/s

~ue1ue:aa-m1HiiWaillltHt•W9H l .. 8••••••• IBBlt•U ••••I

A

·' • I

• "' "

.f'_ , • ,, • • • i

~ -~~vwvoooooooo~ooooooooo

8 10 2 4 6 Time (Hours)

12

Figure 61. Batch 12 Model vs. Experimental Data.

() Mcdb exp

a .1 m exp

• .3 m exp ,. .5 m exp

• .7 m exp

Mcdb mod

---.lmmod

.3mmod

... 5 m mod

... 7mmod

~ ~ \0

GWM piece #: C1317

Variety: Idaho Crystal

Dry date: 9 August 1995

Airon Temp: 65.6 C

Air flow rate: .57 kg/ m "2/ s

90 I 80

70

;Q' 60 "Tj

- =' U?f. --j = 50 I! ~ QJ Q

~u a ~ 40 QJ .a ~ Cl.l

I OD

•"'4 Q

~ 30

20

10

0

0

/D / [JD

/D -aD ,' .

,.·· .. - .. r-- •• . -· -•• / "'

~Do~ ~ 0000°0000 000000000

4 12 2 6 8 Time (Hours)

10 14

Figure 62. Batch 13 Model vs. Experimental Data.

0 Mcdb exp

D .1 m exp

• .3 m exp

• .5 m exp

Mcdh mod

----- .1 m mod

· · · · · ·.3 m mod

- .5 m mod

~ U1 0

-,.Ci "'tS

- o" ~~

~ = .f! ~ ~ = Q,j 0 Q... u a ~ Q,j .f! ~fl.) ...

0

~

Airon Temp: 70.2 C GWM piece #: CB18

Variety: Idaho Crystal Air flow rate: .57 kg/m"2/s

Dry dale: 10 August 1995

100

90

80

70 ---

60

50

40

30

20

10

0 a

--C---0

0 0

/ ..

= .......... _ •••

;

/ . • ~--- ·-•

0 • ••

OC~Q ... • •

....................... ____

0000<1>0000

0 t--~~~---t~~~~-+~~~~-+~~~~-+-~~~~-+-~~~~-+--~~~----1

0 2 4 6 8 10 12 14 Time (Hours)

Figure 63. Batch 14 Model vs. Experimental Data.

0

0

Mcdh exp

.3 m exp

• .5 m exp

---Mcdbmod

.3 m mod

.5 m mod

~ 01 ~

90

80

70

~ 60 "'a

- e-u~ --~ ~ 50

;! = QJ 0 ~u a ~ 4o QJ .a

f--4 fl} ·..i 0

~ 30

20

10

0

0

GWM piece #: F2757

Variety: NW Harrington

Dry date: 13 September 1995

_I -- 0 , 0

I t 0 ,-,-----00 , 0

,, 0 --,.---~- -~

00 0

0

2 4 6 8 Time (Hours)

Airon Tt'mp: 71.1C,8 hr; 82.2 C, 7 hr. Air flow rate: .57 kg/ m A2/ s, 8 hr;

.43 kg/mA2/s, 7 hr.

--..--

.............. 10 12 14 16

• Mcdb exp

0 .1 m exp

0 .3 m exp

A .5 m exp

0 .7m exp

Mcdb mod

---.1mmod

.3m mod

.5 m mod

• • ... 7m mod

Figure 64. Batch 20 Model vs. Experimental Data. ~ Ul N

90

80

70

;:c- 60 "tS

- o" U CF --B = 50 i! ~ Q,j 0 ~u a t 40 Q,j .a ~Cl.) ....

0

::E 30

20

10

0

0

GWM piece #: F2758

Variety: NW Harrington

Dry date: 14September1995

--,

I AA

A

2 4

A A

, .. "

l'

0

6

.I'

" ..

, , I />oo Jo

__ O 0-

00 00

o•

Airon Temp: 73.3 C, 10 hr; 83.3 C, 6 hr Air flow rate: .57 kg/m"2/s, 6 hr;

.57->.24 kg/m"2/s, 4 hr .24 kg/m"2/s, 6 hr.

---- ---

• Mcdh exp

D .1 m exp () .3 m exp

A .5 m exp

0 .7 m exp

Mcdhmod

---.1 mmod

.3m mod

.5 m mod

·· .7mmod

--r·········''"'""• ................... . 8 10 12 14 16

Time (Hours)

Figure 65. Batch 21 Model vs. Experimental Data. ~ Ul VJ

;Q' ~

- o" u ?F --t = .a ! $! = QJ 0 ~u a t QJ .a

E-4 Cl) •"'4

~

GWM piece#: F2759

V ariel y: CN Harrington

Dry date: 15September1995

Airon Temp: 72.2 C, 10 hr; 83.3 C, 6 hr

Air flow rate: .57 kg/ m "2/ s, 6 hr; .57->.24 kg/m"2/s, 1 hr

.24 kg/m"2/s, 7 hr. 100----------------------------------------.

90

80

70

60 ,

, A'

... ,,, so

p

40

, I l 00 1 0000000

---· 00 ,,. 0

--- ------+ ------------

20

10

-= -.......,ywee0000eo~~•-eeeeeeo () r--~~~"1"-~~~-t-~~~-+-~~~-t-~~~--+~~~~1--~~~.+--~~---I

() 2 4 6 8 10 12 14 16 Time (Hours)

Figure 66. Batch 22 Model vs. Experimental Data.

• Mcdb exp

D .1 m exp

0 .3 m exp

A .5 m exp

0 .7 m exp

Mcdb mod

---.1 m mod

.3 m mod

.5 m mod ....... 7m mod

~ (J1 ~

90

80

70

Z' 60 "Tj

- O' u a:-- -t = 50

~ ~ Q,I 0 ~u e t 40 Q,I .e

f-4 Ill .• 0 :E 30

20

10

0

0

GWM piece#: F2774

Variety: MT Harrington

Dry date: 30 September 1995

Airon Temp: 72.8 C, 10 hr; 83.3 C, 4 hr. Air flow rate: .57 kg/m"2/s, 6 hr;

.57->.24 kg/m"2/s, 4 hr; .24 kg/m"2/s, 4 hr.

--·-08~l~MXl8iiii_8~~~ A

J;IPOBe~~BBBill!ilij~m111~11:ttwtmH8'&~ 0

<> "O

'o

2

- -,~-j) .. 0

0

I _lo~--------,---, 0

,. 0 , 0

.. _,__ ()Oo ___ -0

~ ----························ 4 6 8

Time (Hours) 10 12 14

Figure 67. Batch 24 Model vs. Experimental Data.

• Mcdb exp

a .1 m exp

0 .3 m exp

A .5 m exp

0 .7 m exp

Mcdbmod

---.lmmod

.3 m mod

.5 m mod

... 7m mod

~ U1 U1

GWM piece #: F2775

Airon Temp: 72.8 C, 10 hr; 84.4 C, 4 hr. Air flow rate: .57 kg/m"2/s, 8 hr;

.43 kg/m"2/s, 6 hr. V aricty: MT Harrington

Dry date: 1October1995

90.- I I I I I I ] g~llWRiiil8iiiiiii1

so

70

~ 60

r;-i----~

t = 50

:e -a ~ 0

~u 40

~ ~ 'f--1 fl)

•.-1

i 30

20

10

0 2

J91;lPD~-88Be!~~-·····,~ A'

_.,,,_ <;>_

.o .. ,o

, --p -0 " 0

,, 0 ,. 00

____ f4- -0--- -- L-- ------

.. 0 0

0

0

\ I I 1·········1·········1 I

4 6 8 Time (Hours)

10 12 14

Figure 68. Batch 25 Model vs. Experimental Data.

---------- ~-------------

• Mcdb exp

a .1 m exp

0 .3 m exp

A .5 m exp

0 .7m exp

Mcdhmod

---.lmmod

.3mmod ......... .Smmod

....... 7m mod - -- - -

~ Ul

°'


Recommended