59
Mammal Surveying Protocol Jug Bay Wetlands Sanctuary May 2016 Authors: Rebecca Natoli Rachel Schadegg Lydia Nichols-Russell Jenifer Mallinoff

Mammal Surveying Protocol
Jug Bay Wetlands Sanctuary
May 2016
Authors:
Rebecca Natoli
Rachel Schadegg
Lydia Nichols-Russell
Jenifer Mallinoff

1
Table of Contents:
I. Introduction
II. Small Mammal Surveying Protocol
A. Live Trapping
B. Track Tubes
III. Map of Surveying Area
IV. Equipment List for Protocol
A. Live Trapping
B. Track Tubes
V. Track Key for Small Mammals Found in Jug Bay
VI. Data Collection
A. Sample Data Sheet
B. Description of Database
VII. Bibliography

2
I. Introduction
Jug Bay Wetlands Sanctuary contains a rich variety of habitats preferred by small
mammals including riparian and upland forests, tidal freshwater marshes, fields, and meadows.
Due to this diversity in habitats, it is likely that the sanctuary is home to many small mammal
species. A wide variety of mice, shrews, moles, voles, rats, squirrels, and others may be present
but have not yet been extensively surveyed for. This surveying protocol is intended to assist
sanctuary staff and researchers in building a database of presence data for individual species at
Jug Bay. For the purposes of this protocol, “small mammals” generally refers to smaller
members of the taxonomic orders Rodentia and Insectivora.
Small mammals generally weigh less than 5 kg and can be herbivorous primary
consumers, insectivorous secondary consumers, or both. They establish their ecological
importance by participating in cyclic predator-prey relationships within the ecosystems in which
they are found. They serve as a main food source for larger carnivorous mammals, snakes, and
raptors. They are often most active at night or during dawn or dusk. They must consume
significant amounts of food to maintain metabolic homeostasis, so a considerable amount of time
is spent foraging to satiate their high energetic needs. The bodies of small mammals have high
surface-area-to-volume ratios which leaves them vulnerable to heat loss; behavioral
characteristics such as burrowing help to protect them against extreme temperatures in their
environments. Small mammals generally have relatively short life spans. Some shrews, for
example, may live up to only about a year or two old. However, small mammals often have high
reproductive rates. Gestation periods are often only around a month long and litter sizes range
from only a few to over ten offspring. Sexual maturity is reached between one month old and
around a year old, depending on the species (Merritt 2010).
Sherman live trapping and track tubes were chosen as the primary survey method for this
project due to their effectiveness and feasibility. In this project, live trapping should be
conducted by professional biologists, while track tubes surveys can be conducted by citizen
scientist volunteers. These volunteers must complete a training session run by professional
biologists on the proper setup and deployment of the test tubes. To estimate presence of small
mammals the traps will be placed within the the grid system previously established by the Jug
Bay Wetlands Sanctuary. This grid system has been overlaid onto a map of the entire sanctuary
and has been used for many other research projects conducted at the sanctuary in the past.
Therefore distributing the traps within this grid system will allow for efficiency and consistency.
The Sherman live trap is a simple box trap used to capture a variety of small mammals
and comes in sizes that accommodate a range of small mammal species. Since the capture rate
of small mammals can often depend on the size, type and location of the trap, we are using two
sizes (3in x 3.5in x 9in and 4in x 4.5in x 15in) for this project. For small mammal surveys in
3
temperate regions, live trapping is normally conducted once a year during the summer breeding
season. Whenever live traps are used, it is critical to consider the weather conditions during the
event; trapping should be avoided during severe cold, hot or rainy conditions in order to prevent
unnecessary mortalities (Manley et al. 2006) .
Track tubes are often used as a time-efficient and low cost form of passive method
commonly used to study the presence and habitat preferences of a variety of small mammal
species (Weiwel 2007). Track tube surveys cause low levels of disturbance in small mammal
communities; they reduce the risk of humans exposure to diseases carried by small mammals,
such as hantavirus, and reduce the risk of significant mortality or injury that may arise during
live-trapping. While track tubes are well suited methods for estimating species presence, they
are almost always used in conjunction with live capture surveys in order for researchers to
determine reliable abundance estimates of small mammal at an ecosystem level.

4
II. Small Mammal Surveying Protocol
Note: Locations for the trapping grid were assigned by habitat diversity. Areas were chosen that
included all habitats found in Jug Bay, including coniferous forest, hardwood forest, grassland,
and wetland.
A. Live trapping: Performed by biologists over a three-day period once a year in order to
establish the presence of exact species.
1. Distribution
- Number 100 3in x 3.5in x 9in Sherman traps. 50 traps will be placed in the
northern section of Jug Bay, 50 will be placed in the southern section.
- Number 20 4in x 4.5in x 15in Sherman traps. 20 traps will be placed in the
northern section and 20 in the southern section.
- Traps must be placed at least 10m apart and should be placed in one
quadrat of the grid to facilitate set-up and checking. The cycle will begin
with the northwest quadrat in year 1, followed by northeast in year 2,
southeast in year 3, and southwest in year 4. The cycle will restart in year
5.
2. Trap Set-up
- Follow package instructions to put together box trap.
- Put cotton batting in back of box to act as insulation/bedding.
- Bait traps with peanut butter and oat mixture. Mix approximately 2 tbsp.
peanut butter with 1 tbsp. oats and place on piece of plain folded paper (to
keep the trap clean) in front of cotton batting.
- Distribute traps.
- Camouflage traps using twigs and leaves so that they are not apparent
from any paths and do not stand out in the surroundings.
*Do not trap in periods of intense heat, cold, or rain to avoid harming animals.*
3. Trap Checking
- Traps should be set just before sundown.
- After sunrise, approximately 12 hours after they were set, traps should be
checked.
- Put on latex gloves (carry leather gloves in case mustelid or larger
mammal is trapped).
- If an animal has been trapped, cover opening in small cloth sack and
empty animal into sack.

5
- Grasp animal by nape of neck within sack and pull back opening once
animal is secure.
- Identify species.
- Record data.
- Mark animal with permanent marker to prevent duplicate data in the event
of recapture over sampling period.
- Release.
- Re-bait and set trap.
4. Post-sampling period
- Wearing rubber gloves and a face mask, disinfect traps. Dispose of
bedding in a plastic bag and throw away. For traps, sanitize with a solution
of 1:9 household bleach to water (or 1.5 C household bleach, 1 gal. water).
- Dispose of gloves and face mask when done.
B. Track Tubes: Performed by citizen scientists (volunteers) during 4 events per year at 3
month intervals. Each track tube event will take place over 3 days. The purpose of these
surveys is to establish the presence of groups of small mammals or exact species if
possible.
1. Track Tube Set-up
- Number 100 1ft long, 8cm diameter PVC pipes.
- At both ends of each tube, secure an approximately 2in x 2in piece of
adhesive felt with thin pieces of duct tape. Place the felt about half an inch
from the opening of the tube to avoid the ink getting wet.
- Use thin pieces of duct tape to secure cardstock on the bottom of each
tube, between the pieces of felt.
- Mix 2 parts mineral oil to 1 part black-powdered ink. Sufficiently wet felt
squares with ink.
- Bait tube with peanut butter and oat mixture. Mix approximately 2 tbsp.
peanut butter with 1 tbsp. oats and place in the center of the tube.
- Place tube on top of several sticks to elevate it slightly off of the ground.
- Secure tube into ground with 2 u-shaped wire hold downs on either side
and zip ties connecting the hold downs over the top of the tube.
2. Distribution
- 50 track tubes will be placed in the northern grid and 50 in the southern
grid.
- At each event, tubes will be placed in a different quadrat of the grid. At
the first event, tubes will be placed in the northwest quadrat and will then
move clockwise. At event 2 (3 months later) tubes will be placed in the

6
northeast quadrat. Event 3 in southeast and event 4 in southwest. The
cycle will start over at event 5, which will begin year 2 of data collection.
- 4 track tubes will be placed at least 10 m apart in each square of quadrat,
totaling in 48 tubes for all 12 squares. The extra 2 tubes can be placed in
the squares of your own choosing.
*Try to avoid setting up track tubes in the rain as the ink will bleed and tracks will be
difficult to identify.*
3. Track Tube Checking
- Tubes should be set out on the morning of day 1.
- Tubes should be checked 24 hours later on day 2. Ink pads, cardstock, and
bait should be replaced if tracks are seen.
- Record data and take pictures of tracks seen on day 2.
- Check tubes 24 hours later on the morning of day 3.
- Record data and take pictures of tracks seen on day 3.
- Remove track tubes and clean them for next sampling event.

7
III. Map of Surveying Area
A. Northern Sampling Site. Grids 529-534 x O-V.
B. Southern Sampling Site. Grids 505-510 x K-R.

8
IV. Equipment List for Protocol
A. Live trapping:
1. 100 3in x 3.5in x 9in Sherman traps, $16.96 per trap--www.shermantraps.com
2. 20 4in x 4.5in x 15in Sherman traps, $33.71 per trap--www.shermantraps.com
3. Gloves, $9 per carton (100 pairs)--http://www.uline.com/BL_963/Industrial-Latex-
Gloves
4. 10” x 12” cloth sack, $6.55--www.amazon.com
5. Permanent marker, $6.34 for 2--www.amazon.com
B. Track tubes:

9
1. 100 1ft long, 8cm diameter PVC pipe, $226.55 for 20ft.--www.lowes.com
2. Contact paper (White cardstock), $10.88 for 250 sheets (Neenah Exact Index)--
www.amazon.com
3. Adhesive white felt, $7.99 for 6 12”x9” sheets--www.joann.com, search Stick It Felt
solid color
4. Black Powdered ink, $6.93 for 0.75 oz.--www.amazon.com
5. Mineral oil, $8.48 for 16 oz.--www.amazon.com

10
6. Duct tape, $10.25 for 50 yd.s--www.amazon.com
7. Peanut butter, $9.99 for 80 oz. (Jif double pack)--www.amazon.com, grocery store
8. Oats, $2.81 for 18 oz. (Quaker Oatmeal Oats)--www.amazon.com, grocery store
9. 200 U-shaped wire hold downs, $400 for 200 (Orbit DripMaster 65731 1/2-Inch to 5/8-
Inch Loop Stake, Pack of 200)--www.amazon.com

12
V. Track Key for Small Mammals Potentially at Jug Bay
1. Northern Short-Tailed Shrew (Blarina brevicauda)
2. Masked Shrew (Sorex cinereus)
3. Least Shrew (Cryptotis parva)

13
4. Eastern Mole (Scalopus aquaticus)
5. Star-nosed Mole (Condylura cristata)
6. Eastern Chipmunk (Tamias striatus)
7. Eastern Gray Squirrel (Sciurus carolinensis)

14
8. White-footed Mouse (Peromyscus leucopus)
9. Meadow Vole (Microtus pennsylvanicus)
10. House Mouse (Mus musculus)

15
11. Marsh Rice Rat (Oryzomys palustris)
12. Eastern Harvest Mouse (Reithrodontomys humulis)
13. Meadow Jumping Mouse (Zapus hudsonius)

16
14. Woodland Vole (Microtus pinetorum)
15. Southern Bog Lemming (Synaptomys cooperi)
VI. Data Collection
A. Sample Data Sheet

17
i. A sample data sheet for live trapping.
ii. A sample data sheet for track tubes.
B. Description of Database
Data will be compiled on site using printed data sheets. The information will be logged
into a larger spreadsheet following the same labelling system using Google sheets.
Volunteers are encouraged to take photos of tracks and these should be e-mailed to an
address created for this purpose using the same labelling system as that of the data sheet (Grid
square-YYYYMMDD-Trap Number). The photos will then be archived and can be located by
title should they become relevant.

18
VII. Bibliography
Jug Bay Wetlands Sanctuary. 2016. Checklist of mammals of the Jug Bay Wetlands Sanctuary.
<http://www.jugbay.org/files/uploads/Mammal%20species%20list%202.pdf>. Accessed
5 May 2016.
Manley, P.N., B. Van Horne, J.K. Roth, W.J. Zielinski, M.M. McKenzie, T.J. Weller, F.W.
Weckerly, and C. Vojta. 2006. Multiple species inventory and monitoring technical
guide. U.S. Forest Service, Washington Office, Washington, D.C., USA.
Merritt, J.F. 2010. The biology of small mammals. Johns Hopkins University, Baltimore,
Maryland, USA.
Nams, V.O., and E.A. Gillis. 2003. Changes in track tube use by small mammals over time.
Journal of Mammalogy 84(4):1374-1380.
Pearson D.E., and L.F. Ruggiero. 2003. Transect versus grid trapping arrangements for
sampling small-mammal communities. Wildlife Society Bulletin 31(2):454-459.
Weiwel, A.S., W.R. Clark, and M.A. Sovada. 2007. Assessing small mammal abundance
with track-tube indices and mark -recapture population estimates. Journal of Mammalogy
88(1):2550-260.
19
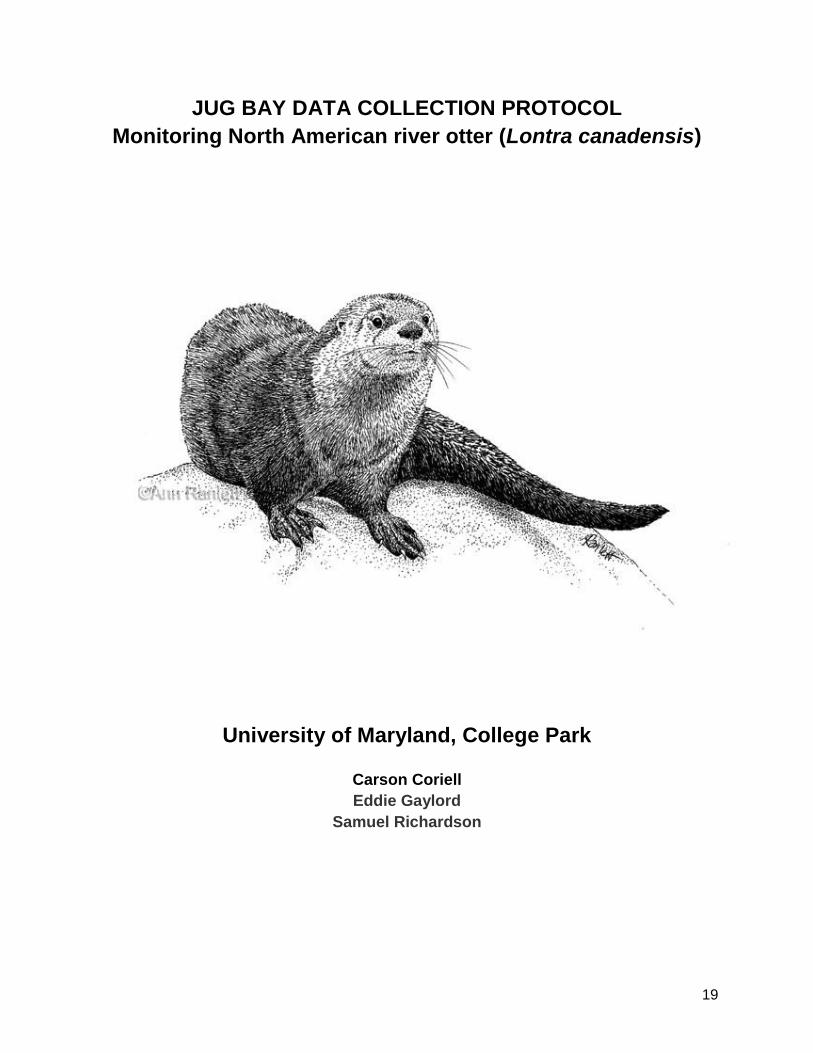
JUG BAY DATA COLLECTION PROTOCOL
Monitoring North American river otter (Lontra canadensis)
University of Maryland, College Park
Carson Coriell
Eddie Gaylord
Samuel Richardson

20
INTRODUCTION
The current status of the North American river otter (Lontra canadensis) in Jug Bay Wetlands
Sanctuary is unknown. The purpose of the Jug Bay Data Collection Protocol is to provide
direction for surveying and management of the species. Extensive monitoring will provide a
better understanding of the distribution of the North American river otter in the Chesapeake Bay
watershed.
BACKGROUND
Life History
North American river otter are semiaquatic mammals and members of the Mustelidae family.
The species has webbed feet, muscular tail, and streamline body shape. An adult river otter
typically weighs between 5-15 kg (11.0-33.0 lbs.) and ranges between 1-1.5 m (40-60 in.) in
length.
This species has a thick water resistant fur of glossy brown that provides them with insulation,
allowing them to spend time hunting in colder waters. Additionally, otters have long highly
sensitive whiskers used to aide in prey detection and capture. River otters are carnivorous
mammals with a diet that consists mostly of fish. However, river otters are opportunistic feeders
and have been known to prey upon various amphibians and several species of shellfish such as
clams and mussels, as well as small birds and mammals.
North American river otter reach sexual maturity after two years and typically breed throughout
the winter and into the spring (December to April). During the early spring, expecting mothers
will search for a den where they can give birth. The female otter does not dig its own den, but
relies on other abandoned dens created by other animals such as North American beaver
(Castor canadensis) or any other natural cavities they come across. Typically otter will produce
2-4 pups within one pregnancy. The female and her pups will remain in the den for roughly 2
months before vacating. After the young are born, they are self-sufficient after 5 months of age,
but typically will remain with their mother up to one year.
River otter do not hibernate and will remain active throughout the cold winter months. During
this time, otter will feed by foraging for prey under the frozen waters and coming up for air within
the gaps of ice. In the warmer months during period of extreme weather, otters will seek
protection from the elements by hiding in dens, under logs, within tree roots, or other available
areas.

21
Figure 1. The range of North American
river otter (Lontra canadensis) within the
United States and Canada.
Figure 2. Example of an otter track
in mud.
Distribution and Abundance
The North American river otter can be found
throughout the United States and Canada in
rivers, lakes, estuaries, or other bodies of
water including the Chesapeake Bay
watershed. This species is generally not
present within central or the southwestern
United States (Figure 1).
Legal Status
Although they were aggressively hunted and
trapped in the 19th and 20th centuries for their
valuable fur, they are currently at a stable
population trend. Today, river otter are listed as
a species of least concern according to the IUCN
Red List and appear to have thriving populations.
MONITORING PROCEDURE
Primary Survey
Preliminary surveys should be conducted in order to determine
whether river otter are present within Jug Bay Wetlands
Sanctuary. Prior to doing any survey, an excel sheet should be
created in order to document any findings. It is recommended to
use a free public service such as Google Drive’s Sheets to add
pictures and documentation of any found evidence that could
indicate the presence of river otter. This allows willing volunteers
to pool all their added information into one location, and the
primary biologist in charge of data collection can analyze all
information and come to an informed decision. To begin, primary
surveys will include observing for otter tracks and scat. Tracks
can best be detected in fallen snow or within the mud at the
banks of rivers and streams. North American river otter tracks
are generally found near bodies of water which makes searching
for mud tracks the easiest method. Adult tracks tend to be
around 10 cm (4 in.) long and around 8.8 cm (3.5 in.) wide.
Typical otter prints include the claws and the heel pad, with
substantial webbing visible as well (Figure 2).

22
Figure 3. Example of otter scat in grassy
vegetation.
Figure 4. Example of an otter slide impression
within the snow.
Scat can typically be found on land
areas located near rivers or other close
bodies of water within the otter’s home
range. The surrounding areas of where
the scat is located will normally be
within a disturbed area and often
displayed within flattened vegetation.
The scat itself can vary in shape from
tubular to a less definite form. River
otter scat tends to be a dark brown to
black color and may contain the
remnants of fish scales (Figure 3).
Another sign that can be used to identify
the presence of the species could include
otter slides (Figure 4). Otter slides are
made from impressions of the otter’s body
as well as their footprints. These can be
tricky to spot and are typically best visible
within snow. However, otter slide
impressions can be seen in mud as well
and are very useful indications of river
otter presence.

23
Secondary Survey
A secondary survey may be implemented if the primary survey results in probable river otter
presence. This portion will include the use of camera traps and spotlight surveys. It is important
to note that both of these techniques will require the use of equipment and the dedication of a
significantly larger amount of time.
Camera traps
Camera traps can be used as a noninvasive approach to monitoring river otter. To properly set
a camera trap there are several steps that need to be followed. First, it is important to make
sure the camera has fresh batteries and a cleared SD card to ensure the camera is functioning
as long as necessary. Trail cameras should be appropriately placed on level ground, preferably
near one of the locations where tracks were spotted during the primary survey. Cameras should
be placed at knee height and strapped to a secure standing such as a tree or post. Be sure the
tree you are using has a large enough diameter at breast height (DBH) so the camera does not
fall down from where you placed it. Use the provided cable lock and key to place the camera.
Locations to place trail cameras should vary depending on whether or not the presence of otters
was confirmed in the primary survey. Ideal camera locations include boardwalks, observation
blinds, and trails near water. To attract otters to camera locations, bait should be place within
the center of the area being photographed. Bait may include but is not limited to shellfish,
crustaceans, and various species of small fish.
Once you have placed the camera into a proper position, set the trail camera to “walk test”. This
will display a red LED light in the camera every time it detects motion. Walk out to 6 m (20 ft.)
while watching the camera to be sure that the red light is still active at this distance. This is to
ensure that any animals that come within this range will be captured by the camera. If satisfied
with the walk test, return to the camera and set it to “armed”. Now the trail camera is live and will
continue to take pictures until you return for it, or it runs out of space on the SD card. It is
recommended that you leave the camera trap out for at least 2-3 days in order to increase
probability of river otter sightings. Due to the 2-3 day interval recommended for observation,
camera traps could be placed on fridays and recovered on sundays, for as many weekends as
volunteers desire, or as long as otters are still being documented on camera. After collecting the
camera, simply plug the SD card into a computer to download and view the images that were
taken by the trail camera. Identifying separate individuals of river otter can be tricky when
viewing the photos. A helpful technique is to watch for variations in coat patterns among the
various animals in order to differentiate between individuals of the same species.
Spotlight surveys

24
Spotlighting for river otter is a relatively inexpensive means to assess the abundance of
populations within a particular body of water. After establishing the general location of otter
populations in the primary survey, volunteers can then return to these locations at night and
during a spotlighting event. Spotlighting is performed by using a bright, wireless outdoor
spotlight with a large diameter and strong candlepower. Observers should slowly scanning the
water and banks of water bodies, while traveling at low speeds by either canoe or kayak. Otters,
like most mammals, have a layer of tissue in the back of their eyes that reflects light back
outwards when shined upon called the tapetum lucidum, or more commonly known as a cat’s
eye. Although this improves their night vision, it also allows surveyors to quickly identify them by
sight. During a spotlight survey a single pre-established transect line should be followed across
a body of water in one direction. Surveys should start at Jackson’s Landing, a known location
where volunteers can rent kayaks/canoes for survey and can be used as the beginning of the
established transect. Depending on the amount of people involved, one or two individuals can
slowly scan on either side of the boat while another volunteer can record any otter sightings and
their relative location. GPS units can be used during surveys for an accurate account of where
the otters were spotted during survey. When spotlighting, it is important to note that many
species will also show light reflecting in their eyes. If possible, the physical characteristics of a
spotted individual should be observed to aide in identifying the species. Many semi-aquatic
animals located in Maryland have similar body shape and could be mistaken for one another
(Figure 5). Although spotlighting is inexpensive, it is time consuming, taking place for long
hours after dark. It is recommended that spotlight surveys take place two to three times a month
for an accurate account of otter populations.

25
Recommended Equipment List
● Field clothes
● First aid kit
● Compass
● Topographic maps of Jug Bay
● Portable GPS units
● Kayaks/canoes
● Wireless outdoor spotlights
● Trail cameras
○ Reconyx trail cameras
○ Secure Digital (SD) cards
○ Fresh batteries
○ Locking cables
Figure 6. An example of a possible transect that could be used to survey for North American
river otter. Gray outline showing the boundaries of Jug Bay Wetlands Sanctuary. Red dots
showing possible routes for river otter survey.

26
LITERATURE CITED
Images Taken From:
http://www.inkart.net/illustration/wildlife/northern_river_otter/northern_river_otter_large.gif https://www.defenders.org/sites/default/files/river-otter-range-map.jpg http://www.fws.gov/chesapeakenutriaproject/images/silhouetteTHUMB.gif https://commons.wikimedia.org/wiki/File:North_American_River_Otter_track,_Kings_River,_Arkansas.jpg http://www.ontariowildflower.com/images/track_otter2.jpg http://museum.unl.edu/sundaywithascientist/images/07otter-scat.jpg
References:
Breaux, A., Zielinski, W., & Kucera, T. 2002. Data collection protocol monitoring river otter (Lutra [=
Lontra] canadensis). Wetlands Regional Monitoring Program Plan 2002. Part 2: Data Collection
Protocols.
Hansen, H., BEN‐ DAVID, M. E. R. A. V., & Mcdonald, D. B. 2008. Technical Advances: Effects of
genotyping protocols on success and errors in identifying individual river otters (Lontra canadensis) from
their faeces.Molecular Ecology Resources, 8(2), 282-289.
Johnson, M. L. 2000. North American River Otter. Species and, 238.
Noordhuis, R. 2002. The river otter (Lontra canadensis) in Clarcke County (Georgia, USA)-survey, food
habits and environmental factors. OTTER SPECIALIST GROUP BULLETIN.
Serfass, T.; P. Polechla 2008. "Lontra canadensis". 2008 IUCN Red List of Threatened Species. IUCN 2008.
Retrieved 5/4/2016.

27
North American River Otter Observation Data Sheet (Primary)
Jug Bay Wetlands Sanctuary
Observer(s):
Survey Date
(mm/dd/yy)
Start Time
(military)
GPS Location
(Lat - Long)
Tracks (P/A)
Scat (P/A)
Print Direction (Towards/Away
from water body)
Weather Conditions
(sunny, overcast, rainy, etc.)
Additional Comments
Present = P
Absent = A
28
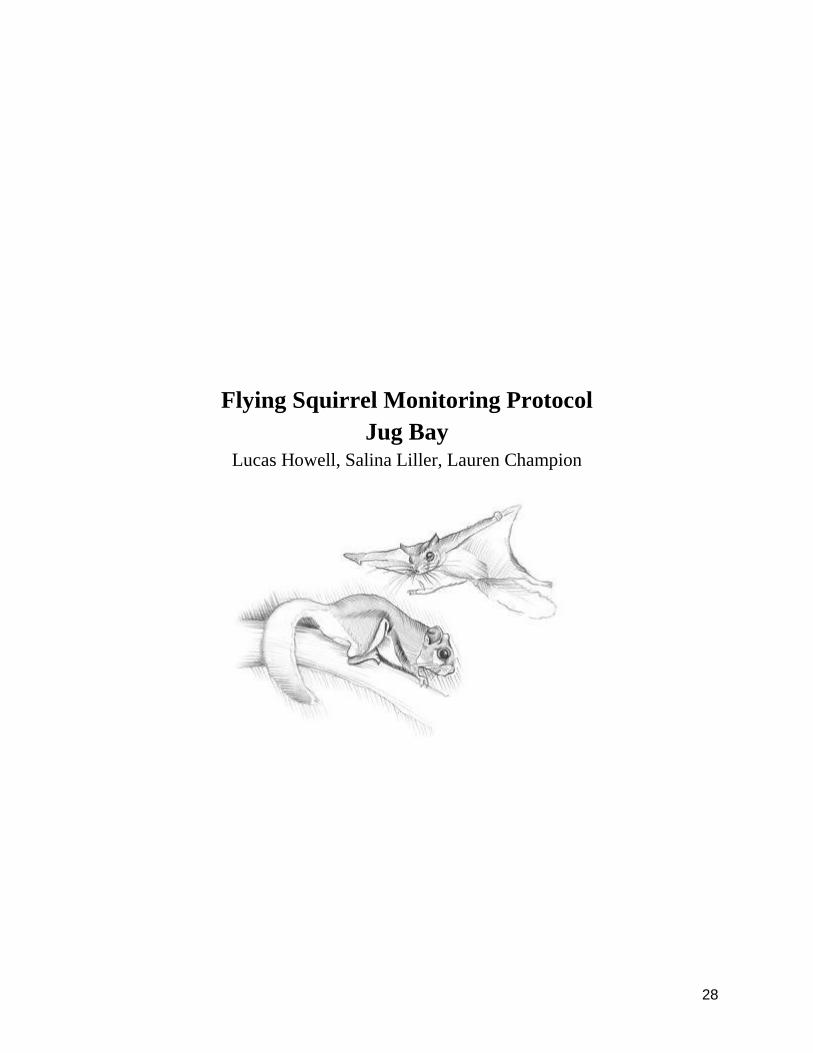
Flying Squirrel Monitoring Protocol
Jug Bay
Lucas Howell, Salina Liller, Lauren Champion

29
Species Description:
Identification
There are two types of flying squirrels found in North
America, Glaucomys sabrinus (northern flying squirrel)
and Glaucomys volans (southern flying squirrel), whose
range can be seen in Figure 1. The northern flying
squirrel can be found in the Northeast and Northwest
regions of the U.S. and stretching up throughout
Canada. The range of the Southern Flying Squirrel
expands from southeast of Canada, down the east coast
of the U.S and out west to the mid-U.S. Although the
range of the Southern Flying Squirrel is most prominent
in the U.S., while the Northern Flying Squirrel is mostly
in Canada, both species can been seen in Maryland.
Aside from their range, the coloration of their fur is
another way to differentiate them. While they are both
grey-brown, the northern flying squirrel has partial grey
coloration on its abdomen. This area is entirely white
on the southern flying squirrel and it is slightly smaller
in comparison. This may be difficult to distinguish,
though, due to their nocturnal activity and the elusive
behavior they are characteristic.
Diet
Both species are omnivorous, and they eat a variety of seeds (sunflower seeds and suet when they live
near bird feeding stations), nuts (beechnuts, acorns, hickory nuts, etc), fruit, fungi, and insects. Southern
flying squirrels supplement their diet with eggs, birds, and carrion. In the winter, flying squirrels feed on
the seeds of conifers. In the spring, they feed on the inner bark, buds, blossoms, and sap from trees such
as the sugar maple.
30
Behavior
Flying squirrels are nocturnal. Although they forage on the ground, they are arboreal and spend most of
their time in trees. Flying squirrels do not actually fly; rather, they glide between trees with the help of a
membrane (patagium) that stretches between their fore and hind limbs.
Social system
The mating relationships and social pattern of flying squirrels are not well known as they are a generally
elusive species. The few studies done on flying squirrel social systems indicate variability. When nest
cavities are abundant and food is uniformly distributed, females defend a territory that encompasses most
of their home range. Otherwise, females may only defend the area directly surrounding the nest. Males
and females occupy separate nests, and males do not aid in parental care. Males are less aggressive
than females. Territories commonly overlap between males, and sometimes males may share the same
nest in pairs or groups of three. In winter, up to 19 individuals of both sexes have been observed to share
a nest. Female home ranges are on average 1 acre, while male home ranges are on average 1.5 acres.
Densities range from 0.8-4.8 individuals per acre.
Communication
Flying squirrels have a broad vocal repertoire, which suggest that vocalizations have an important role in
regulating social behavior. Loud squeals and churs accompany mating and chasing. Pups give ultrasonic,
high pitched squeaks. Individuals emit high-frequency sounds during gliding, which may be echolocation.
Females threaten by lunging at another individual and stamping their front feet. This may escalates to
slapping the opponent’s face or giving hostile chase. Flying squirrels possess facial glands which may
provide substances that are used to mark territory within the home range, such as food stores.
Ideal Habitat
The northern flying squirrel prefers coniferous forests, while the southern flying squirrel prefers deciduous
forests near streams and woodlands. For this reason, it is important not to remove fallen trees and snags.
These snags can serve as a location for nesting, but they also use abandoned woodpecker holes, or bird
and squirrel nests. They create nests using lichen, dried grass, feathers, and shredded bark. Timber can
be harvested appropriately in areas of known populations. The amount of timber harvested generally
corresponds with the area; for large areas, a large percent of timber should be harvested. Artificial nest
boxes can be implemented in certain locations in order to prompt use.
Monitoring Method(s):
Nest Boxes
Do not be surprised if there are no observed individuals until 11 months after placement of the boxes.
Peak occupancies and densities are in November or December, so be sure to increase monitoring during
that time. Densities of squirrels can very greatly from year to year. Do not be discouraged if a density of
0.7/ha is observed, as the next year could have much more. Boxes may cost up to $16.21 per box
including labour. The cost of maintenance needs to be considered as entrance hole may be enlarged by
gray and fox squirrels. Boxes should be cleaned every 2-3 years when unoccupied. Nest boxes should be
placed 3-5m high and orientated south, south east, or east exposure. We recommend constructing at
least 10 boxes for each species of flying squirrel.
31
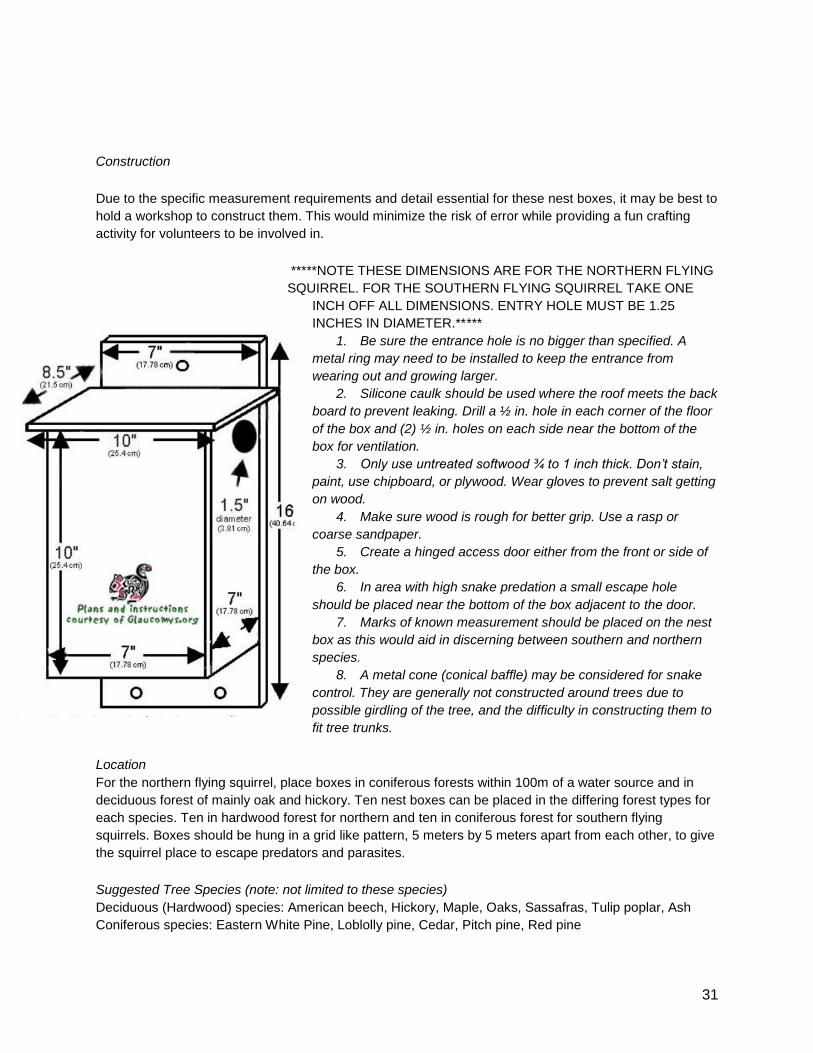
Construction
Due to the specific measurement requirements and detail essential for these nest boxes, it may be best to
hold a workshop to construct them. This would minimize the risk of error while providing a fun crafting
activity for volunteers to be involved in.
*****NOTE THESE DIMENSIONS ARE FOR THE NORTHERN FLYING
SQUIRREL. FOR THE SOUTHERN FLYING SQUIRREL TAKE ONE
INCH OFF ALL DIMENSIONS. ENTRY HOLE MUST BE 1.25
INCHES IN DIAMETER.*****
1. Be sure the entrance hole is no bigger than specified. A
metal ring may need to be installed to keep the entrance from
wearing out and growing larger.
2. Silicone caulk should be used where the roof meets the back
board to prevent leaking. Drill a ½ in. hole in each corner of the floor
of the box and (2) ½ in. holes on each side near the bottom of the
box for ventilation.
3. Only use untreated softwood ¾ to 1 inch thick. Don’t stain,
paint, use chipboard, or plywood. Wear gloves to prevent salt getting
on wood.
4. Make sure wood is rough for better grip. Use a rasp or
coarse sandpaper.
5. Create a hinged access door either from the front or side of
the box.
6. In area with high snake predation a small escape hole
should be placed near the bottom of the box adjacent to the door.
7. Marks of known measurement should be placed on the nest
box as this would aid in discerning between southern and northern
species.
8. A metal cone (conical baffle) may be considered for snake
control. They are generally not constructed around trees due to
possible girdling of the tree, and the difficulty in constructing them to
fit tree trunks.
Location
For the northern flying squirrel, place boxes in coniferous forests within 100m of a water source and in
deciduous forest of mainly oak and hickory. Ten nest boxes can be placed in the differing forest types for
each species. Ten in hardwood forest for northern and ten in coniferous forest for southern flying
squirrels. Boxes should be hung in a grid like pattern, 5 meters by 5 meters apart from each other, to give
the squirrel place to escape predators and parasites.
Suggested Tree Species (note: not limited to these species)
Deciduous (Hardwood) species: American beech, Hickory, Maple, Oaks, Sassafras, Tulip poplar, Ash
Coniferous species: Eastern White Pine, Loblolly pine, Cedar, Pitch pine, Red pine

32
Best Method of Recording Data
The data collected will be simple presence/absence data. Monitoring should be conducted once a month,
on the first Monday of the month, to see if there is any disturbance of the box. Occupancy can be tested
by rapping the tree and listening for movement in the nest box. Also, volunteers can check for evidence of
nesting in the box. Once a disturbance is detected a camera can be placed at the site. Then the SD card
should be pulled and examined once a month (i.e. if camera is placed March 6, SD card should be pulled
and examined April 6, May 6, etc). Percent occupancy of total nest boxes can be used to measure
abundance. Refer to (Donald and Peggy, 2001).
The best way to keep data organized is to have some kind of database. Google Drive works well,
because the link can be shared with all the volunteers who participate in the study. A Google Sheet can
be created for collaborative efforts to the data, and a Google Doc can be added containing all necessary
instructions for volunteers, should they ever have the need to refer back to them while surveying.
Additionally, camera trap pictures can be uploaded to the folder.
Camera Trapping
If there is evidence of disturbance and common use of the nest box, it could be beneficial to install a
camera, if the budget of the study allows for it. Camera trapping will allow the verification and
identification of the species that is utilizing the nest box.
Set Up
The setup of a camera trap would require at least two people: one person to install the camera opposite
the nest box and one person to test that it is correctly angled so the camera’s sensor would be set off by
movement at the nest box. In order to use camera traps, SD cards, AA batteries (6-12), and something to
secure the camera in place (preferably a locking cable to prevent theft) are also needed. Cameras can be
expensive, and prices generally start around $100. For this particular study, a camera with a quick shutter
speed is desirable, as it reduces motion blur from nighttime photos. Additionally, an infrared camera is
preferable to an incandescent camera, as the flash from an incandescent camera is more likely to startle
nocturnal wildlife. Below is a link for a suggested camera. It has good battery life and a fast trigger speed,
and it is one of the less costly models.
http://www.trailcampro.com/collections/red-glow-infrared-flash-trail-cameras/products/bushnell-essential-
e2-review
Since the camera trap would be placed higher up the tree than they are normally set up, the method of
setup has to differ. The camera trap would be secured 3-5 meters high on a tree, with the camera aimed
at the side of the nest box with the opening. Using a ladder, one person would secure the camera to the
tree trunk. At the same time, another person would be located at the nest box to ensure the camera is
angled correctly. The typical “walk test” would not work, so to check that the camera is working, one
person should climb a ladder and ensure that the light captures activity at that distance. The cameras
would come with more detailed instructions on exactly how to set them up. In order to try and determine
the difference between species, a mark of known measurement can be drawn on the outer surface of the
box. This mark provides a measurement to reference when the data is collected and the images are
being analyzed.

33
General Locations for Nest Box Placement Part 1- Jug Bay:

34
General Locations for Nest Box Placement Part 2- Glendening:

35
Resources:
Althoff, D.P., and P.S. Althoff. 2001. Monitoring southern flying squirrel populations with nest boxes. Ohio
Journal of Science 101: 2-11. <http://www.ridgessanctuary.org/wp-
content/uploads/2013/12/Monitoring-southern-flying-squirrel-populaitons-Althoff-and-althoff-
2001.pdf> Accessed 3 May 2016.
Fukuda, H., Takayama, G., Iguchi, M., & E Shibata. 2008. Camera-trapped mammal fauna of mt.
ohdaigahara, central japan. Japanese Journal of Conservation Ecology 13: 265-274.
<http://search.proquest.com/docview/20370702?accountid=14696> Accessed 29 Apr 2016.
Iowa Department of Natural Resources [DNR]. Wildlife Landowner Assistance. Southern flying squirrel
<http://www.iowadnr.gov/Conservation/Wildlife-Landowner-Assistance/Technical-Assistance/Sout
hern-Flying-Squirrel> Accessed 3 May 2016.
Vegetation. n.d. LANDFIRE Program: Data Products -. <http://landfire.gov/vegetation.php> Accessed 5
May 2016.
National Wildlife Federation [NWF]. 2016. Wildlife: Mammals: Flying squirrels.
<https://www.nwf.org/Wildlife/Wildlife-Library/Mammals/Flying-Squirrels.aspx> Accessed 29 Apr
2016.
Studelska, R. 1997. Northern flying squirrel (Glaucomys sabrinus).
<http://www3.northern.edu/natsource/MAMMALS/Northe1.htm>Accessed 29 Apr 2016.
Trudeau, C., Imbeau, L., Drapeau, P., & M. J. Mazerolle. 2011. Site occupancy and cavity use by the
northern flying squirrel in the boreal forest. Journal of Wildlife Management 75: 1646-1656.
<http://search.proquest.com/docview/919425024?accountid=14696> Accessed 29 Apr 2016.

36
COYOTE SURVEY PROTOCOL JUG BAY WETLAND SANCTUARY
Julia Geschke, Grace Hummell, Ashleigh Piccoli, Kelly Samia
Edited by Yasmine Hentati

37
TABLE OF CONTENTS
I. Basic Jug Bay Information
II. Coyote Biology
III. Protocol Techniques
A. Camera Trapping
B. Howl Surveys
C. Scat/Track Transects
IV. References
V. Appendix
A. Data sheets
B. Map of survey locations
C. Links to equipment
D. Sample database

38
Basic Jug Bay Information
Jug Bay Wetlands Sanctuary is an important network of various habitat types that provide refuge
for a wide variety of wildlife. Habitats include more than 1500 acres of open water, wetlands, forests, and
fields. The sanctuary’s close proximity to Annapolis and Washington, D.C. allow for environmental
education, stewardship, citizen science, and volunteer opportunities.
Coyote Biology The coyote (Canis latrans) is a canid native to North and Central America. It is widely
distributed, as this species has adapted well to urbanization and living in close proximity to
humans. Coyotes benefit from anthropogenic disturbances, as they increase food accessibility for them.
They prefer to use manmade trails or roads for ease of movement.
Coyotes have not been found utilizing intact stands or mature forests. They prefer young forests
with abundant understory plant growth, surrounded by ample edge. The understory plants provide them
with hunting cover, but also create shelter for the small mammals on which they prey. Coyotes will take
advantage of almost any type of cover to create their dens, using steep banks, rock ledges, brush-covered
slopes, thickets, hollow logs, and above-ground depressions.
This species’ diet mainly consists of white-tailed deer throughout the year. Rodents comprise the
majority of the diet only in the summer, and coyotes supplement this with plant material when it is
available. Above all, coyotes are opportunistic feeders, so they will eat whatever is available to them at
the time.
Coyotes are sexually dimorphic, so the males (16kg) are slightly larger than the females
(13kg). They are a monogamous species that will establish long-term mating pair bonds. Older females
are more likely to reproduce than yearlings, and they will give birth to their young in March or April. It
should be noted when monitoring these individuals that the dens will be abandoned by June or July and
the pups will be completely independent by August.
Coyotes are moderately social, generally living in groups of 2-4 individuals, so it is important to
note this when participating in howl surveys. Alternatively, coyotes will live by themselves. When
coyotes are found in groups, they are usually related to the other members.
39
Protocol Techniques
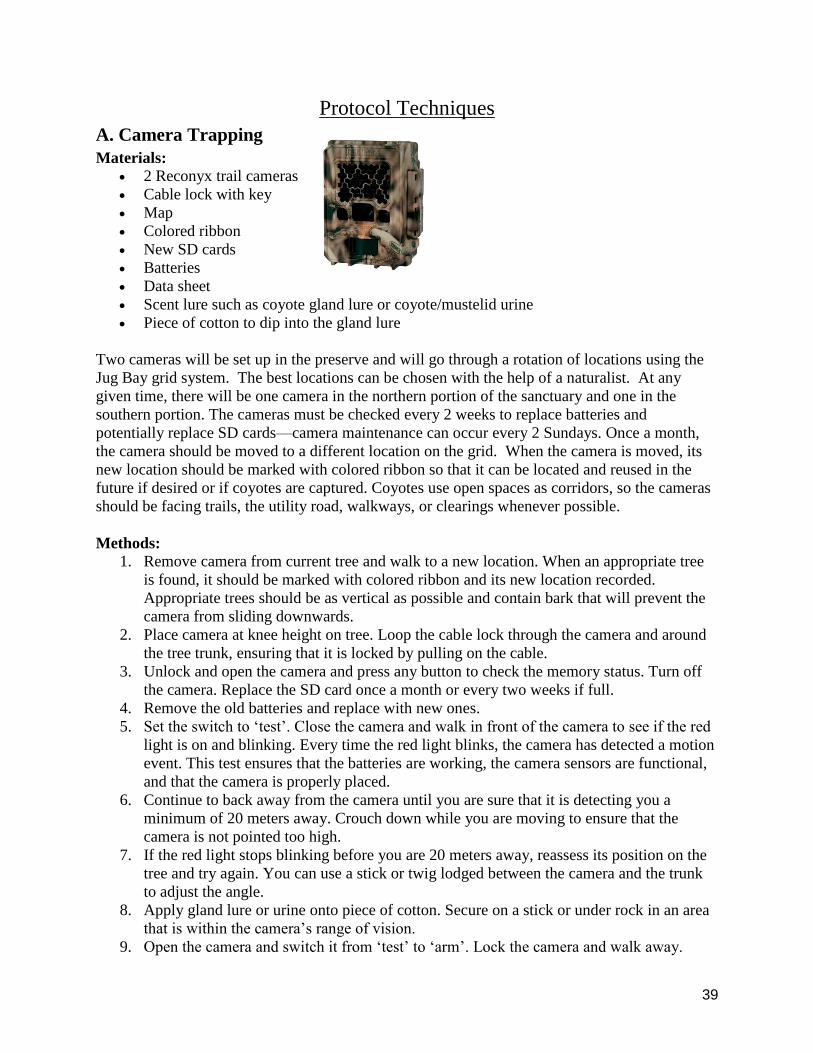
A. Camera Trapping
Materials: 2 Reconyx trail cameras
Cable lock with key
Map
Colored ribbon
New SD cards
Batteries
Data sheet
Scent lure such as coyote gland lure or coyote/mustelid urine
Piece of cotton to dip into the gland lure
Two cameras will be set up in the preserve and will go through a rotation of locations using the
Jug Bay grid system. The best locations can be chosen with the help of a naturalist. At any
given time, there will be one camera in the northern portion of the sanctuary and one in the
southern portion. The cameras must be checked every 2 weeks to replace batteries and
potentially replace SD cards—camera maintenance can occur every 2 Sundays. Once a month,
the camera should be moved to a different location on the grid. When the camera is moved, its
new location should be marked with colored ribbon so that it can be located and reused in the
future if desired or if coyotes are captured. Coyotes use open spaces as corridors, so the cameras
should be facing trails, the utility road, walkways, or clearings whenever possible.
Methods: 1. Remove camera from current tree and walk to a new location. When an appropriate tree
is found, it should be marked with colored ribbon and its new location recorded.
Appropriate trees should be as vertical as possible and contain bark that will prevent the
camera from sliding downwards.
2. Place camera at knee height on tree. Loop the cable lock through the camera and around
the tree trunk, ensuring that it is locked by pulling on the cable.
3. Unlock and open the camera and press any button to check the memory status. Turn off
the camera. Replace the SD card once a month or every two weeks if full.
4. Remove the old batteries and replace with new ones.
5. Set the switch to ‘test’. Close the camera and walk in front of the camera to see if the red
light is on and blinking. Every time the red light blinks, the camera has detected a motion
event. This test ensures that the batteries are working, the camera sensors are functional,
and that the camera is properly placed.
6. Continue to back away from the camera until you are sure that it is detecting you a
minimum of 20 meters away. Crouch down while you are moving to ensure that the
camera is not pointed too high.
7. If the red light stops blinking before you are 20 meters away, reassess its position on the
tree and try again. You can use a stick or twig lodged between the camera and the trunk
to adjust the angle.
8. Apply gland lure or urine onto piece of cotton. Secure on a stick or under rock in an area
that is within the camera’s range of vision.
9. Open the camera and switch it from ‘test’ to ‘arm’. Lock the camera and walk away.

40
B. Howl Surveys
Materials: At least 3 volunteers
o Before coming out to survey, volunteers should familiarize themselves with the
different sounds coyotes make, especially a group yip-howl. This is a good
resource: http://www.urbancoyoteproject.com/blog/2015/9/3/translating-the-song-
dog-what-coyotes-are-saying-when-they-howl
Data sheet
GPS unit
Compass
A coin
Recorded coyote call (get from professionals or the Internet)
Wireless soundstation/speaker with iPod or CD to broadcast recorded call
Handheld predator caller: $98-400
When: First Saturday of each month. If weather is bad, do survey the second Saturday.
Start 1 hour after sunset at the first station
Wind must be less than 9 miles per hour
Not raining, clearer sky with moon more visible is preferred
June-November
There will be 4 howling stations, 2 in southern Jug Bay portion and 2 in and Glendening northern
portion. (Locations identified in Part B of the Appendix on the map.) At the station, you will
have a recorded coyote call (group-yip howl) and a handheld predator caller. When playing the
sounds, the device should be at least 5 feet off the ground and directed vertically (hold into the
air and turn in a 360 radius or mount on car). At each of the 4 stations, a coin should be flipped
to determine whether the recorded coyote calls or handheld caller will be played first. This will
reduce habituation.
Methods: 1. Record any necessary information on the data sheet. Weather variables can be checked online
and added to the online data sheet later if needed.
2. Flip coin to determine which stimulus is used (coyote calls or handheld caller).
3. Play selected stimulus for 20 seconds two times.

41
4. Listen for 5 minutes.
5. If you get a response, record if it is an individual or group calling, and estimated # of coyotes.
The biggest group will likely be 4 coyotes. Also estimate the direction (south, northeast, etc.)
that the calls are coming from using the compass. Mark N/A on the datasheet for the questions
about stimulus 2.
6. If no response, play other stimulus for 20 seconds two times.
7. Listen for 5 minutes.
8. If no response, move on to next station (make sure at least 15 minutes elapses between last
sounded stimulus and starting at the next station).
C. Scat/Track Transects
Scat transects are found to be the most effective survey method for calculating coyote presence
and abundance. We would suggest using Scat Deposition Transects in Jug Bay because it
requires volunteers to travel along trails, roads, and railroads (see sample transect on map in Part
B of Appendix.) The benefit of this type of survey is that it requires minimal training, data can be
accumulated over time, it does not require artificial response from coyotes, and abundance of
coyote population can be calculated from collected scat.
Materials: ID guide for coyote scat and freshness (dry, large cracks, or not in its original shape do
not count).
o Coyote Scat is tubular, often twisted.
o 5-13 inches long
o 0.5-1.5 inches in diameter
o Tapered or twisted ends
o Can contain hair, bones, grass, berries
o Larger than red or gray fox scat
Coyote Scat (above)

42
Dog scat (top) and similar scat of other species
Image of coyote tracks if needed
Rubber gloves if needed
Paper bags
Data Sheet to record # of scat, transect routes, weather, etc.
Camera or camera on phone
Methods:
1. Assign transect routes along roads, railroads, and trails in Jug Bay, or all trails. Speak to Jug
Bay naturalists for the best routes, and if there are suitable routes between roads and trails. (See
example in appendix).
Suggested: 2-mile transect, but 1-mile or two 0.5-mile transects can also be done
2. Walk transects from March till November (more food available during these months). Pups are
also born in March and leave their dens in June so there are more chances to count scat during
these months.
We suggest starting the first weekend of March.
3. Transect should be walked at sunrise or 30 minutes after sunrise.
4. Take pictures of all scat as well as count # scat found. Taking pictures will allow scat to be
looked at by professionals if volunteers are unsure. Use an object such as a shoe for reference of
scat size.
5. Optional: place scat in paper bag and bring back to Wetlands Center for examination.

43
5. Finally, record tracks if any are seen. Make sure to take pictures of these, as well.

44
References
Boisjoly, D. (2010). Coyote habitat selection and management implications for the Gaspesie
Caribou. The Journal of Wildlife Management 74:3-11.
Crawford, B. A., M. R. Pelton, and K. G. Johnson. (1993). Techniques to monitor relative
abundance of coyotes in east Tennessee. Proc. Annu. Conf. Southeast. Assoc. Fish and
Wildl. Agencies 47:62-70.
Crimmins, S.M., J.W. Edwards, and J.M. Houben. (2012). Canis latrans (Coyote) habitat use
and feeding habits in central West Virginia. Northeastern Naturalist 19:411-420.
Gittleman, L.J. (2001). Carnivore Conservation.University of Cambridge Press, Cambridge.
England.
Gese, E.M. (2001). Monitoring of terrestrial carnivore population. USDA National Wildlife
Research Center, Washington, D.C.,USA.
Henke, S. E. and F. F. Knowlton. (1995). Techniques for estimating coyote abundance.
University of Nebraska, Lincoln, Nebraska, USA.
Kelly, Marcella J., E. L. Holub. (2008). Camera trapping of carnivores: trap success among
camera types and across species, and habitat selection by species, on Salt Pond Mountain,
Giles County, Virginia. Northeastern Naturalist 15:249-262.
Kenaga, B. A., R. A. Krebs, and W. B. Clapham, Jr. (2013). Coyote land use inside and outside
urban parks. The American Midland Naturalist 170:298-310.
University of California. (2014). Scat Identification Guide. Department of Environmental
Studies. <http://www.conservationscats.com/#!scat-identificatioin/c22nb> Accessed 5
May 2016.
Lyra-Jorge, M. C. et al. (2008). Comparing methods for sampling large-and medium-sized
mammals: camera traps and track plots. European Journal of Wildlife Research 54:739-
744.
Mastro, L.L. (2011). Life history and ecology of coyotes in the Mid-Atlantic states: A summary
of the scientific literature. Southeastern Naturalist 10:721-730.
Morgan, T. W., and C. L. Elliott. (2011). Comparison of remotely-triggered cameras vs. howling
surveys for estimating coyote (Canis latrans) abundance in central Kentucky. Journal of the
Kentucky Academy of Science 72:84-90.
Petroelje, T. R., J. L. Belant, and D. E. Beyer, Jr. (2013). Factors affecting the elicitation of vocal
responses from coyotes Canis latrans. Wildlife Biology 19:41-47.

45
Wenger, C. R., and A. T. Cringan. (1978). Siren-elicited coyote vocalizations: An evaluation of a
census technique. Wildlife Society Bulletin 6:73-76.

46
Appendix
A. Data Sheets
i. CAMERA TRAPPING
Date:
Names of observers:
Old Camera Location:
Old SD card:
New Camera Location:
New SD card:
Notes:

47
ii. HOWL SURVEYS
Date:
Names of Observers:

48
Station: 1 2 3 4
Time beginning
Time finished
Location (description)
Location (GPS)
Wind direction
Wind speed
Temperature
Moon phase
Estimated cloud cover
Stimulus type used first
Group or individual
response to stimulus 1
Group or individual
response to stimulus 2
Direction of response
Estimated min. # of
coyotes calling for
stimulus 1
Estimated max. # of
coyotes calling for
stimulus 1
Estimated min. # of
coyotes calling for
stimulus 2
Estimated max. # of
coyotes calling for
stimulus 2
Type of call response
(bark, growl, lone howl,
group yip-howl)

49
iii. SCAT/TRACK TRANSECTS
Observer Date Sunrise
time
Weather Transect
route
# Scat Tracks Present (Y/N)

50

51
B. Map of Survey Methods
The red outline is all of Jug Bay lands. The top one is the northern part (Glendening) and the
bottom one is the southern part (the wetlands sanctuary where the visitor’s center is.)

52
Glendening (northern):

53
Jug Bay (southern):
54
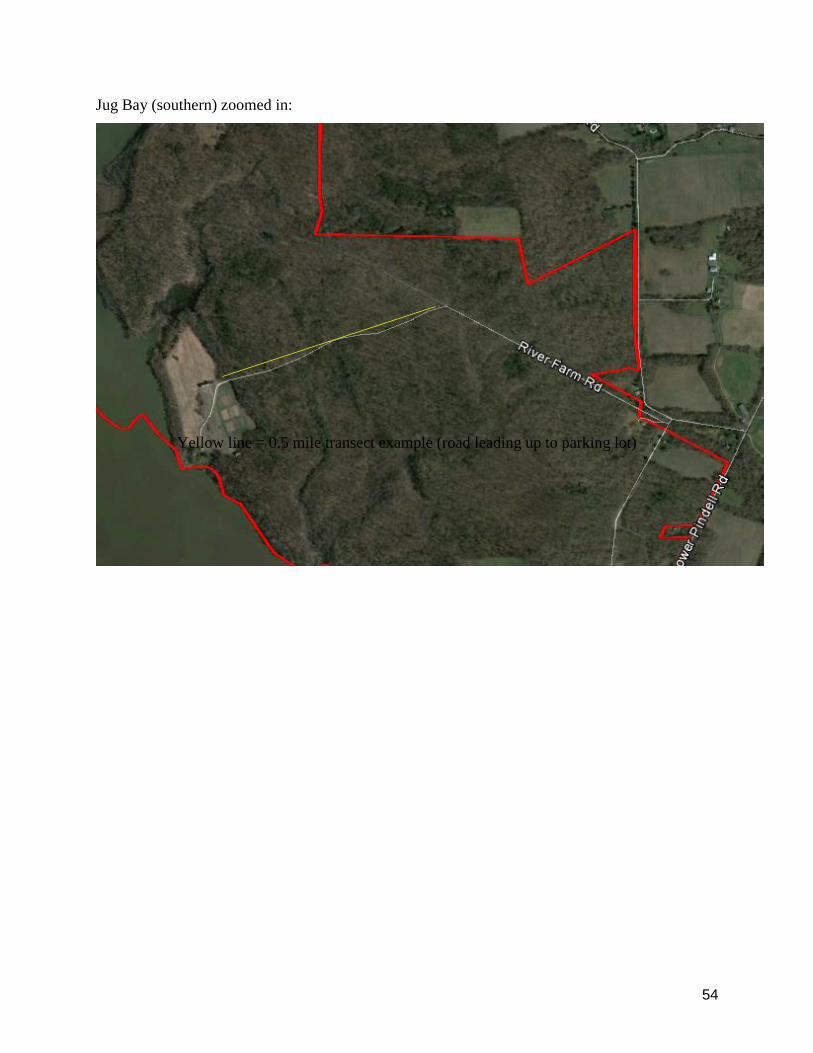
Jug Bay (southern) zoomed in:
Yellow line = 0.5 mile transect example (road leading up to parking lot)

55
C. Links to Equipment Listed below are links to suggested equipment or (if out of stock) examples of what the
equipment should look like.
Reconyx trail camera:
http://www.gandermountain.com/modperl/product/details.cgi?pdesc=Reconyx-Hyperfire-
HC500-Trail-
Camera&i=694858&r=view&cvsfa=2586&cvsfe=2&cvsfhu=363934383538&gclid=CPn3hsDH
xcwCFcYfhgodGjAH3Q
Handheld Coyote Caller:
https://www.midwayusa.com/product/169580/johnny-stewart-pm-4-preymaster-digital-caller-
with-12-digital-predator-sounds
http://www.gamecalls.net/products/Johnny_Stewart_Preymaster_Digital_Caller-1860-19.html
http://www.midwayusa.com/product/235117/fox-pro-fx3-electronic-predator-game-call-with-32-
digital-sounds-mossy-oak-break-up-camo
http://www.cabelas.com/product/FOXPRO-Wildfire-Predator-
Call/1376071.uts?productVariantId=3158620&WT.tsrc=PPC&WT.mc_id=GoogleProductAds&
WT.z_mc_id1=03442941&rid=20&gclid=CIjisaOaqMwCFUpZhgodAJMLMw&gclsrc=aw.ds

56
D. Sample Database We suggest that a Gmail account be created specifically for this project (something like
[email protected]) with a common password that can be given to all volunteers. The
following google spreadsheets will be in the drive for this email so volunteers can log in and
record their data. Additionally, any pictures taken can either be emailed to that account or
volunteers can log in and upload their pictures to the drive themselves.

57

58


