Page 1
Are Poor People Less Happy? Findings from Melanesia
Simon Feeny
School of Economics, Finance and MarketingBuilding 80, Level 11
RMIT University445 Swanston Street
Melbourne, VIC 3000Australia
[email protected]
Lachlan McDonaldSchool of Economics, Finance and Marketing
Building 80, Level 11RMIT University
445 Swanston StreetMelbourne, VIC 3000
[email protected]
Alberto PossoSchool of Economics, Finance and Marketing
Building 80, Level 11RMIT University
445 Swanston StreetMelbourne, VIC 3000
[email protected]
* Correspondence to Simon Feeny, School of Economics, Finance and Marketing, Building 80, Level 11, RMIT University, 445 Swanston Street, Melbourne VIC 3000, Australia. Tel: +61 3 9925 5901; Fax: +61 3 9925 5624; Email: [email protected] .
Page 2
Abstract
Happiness is increasingly being used to inform development policy. This is particularly
true in Melanesian countries where linkages between income and life satisfaction are
perceived to be weak. This paper examines the self-reported happiness of households in
two Melanesian countries: the Solomon Islands and Vanuatu. The focus is on whether
those living in poverty are less happy. Findings indicate that wealth, increases in
income, relative income, and living on communally owned land are all positively
associated with happiness. Household size and food insecurity have a negative
association. There is also strong support for poor households being less happy.
Keywords: Happiness; poverty; Melanesia; Solomon Islands; Vanuatu.
Page 3
Acknowledgements
This paper is part of a project funded by the Australian Agency for International
Development through its Australian Development Research Award scheme. These views
expressed in the paper are those of the authors and not necessarily those of the
Commonwealth of Australia. The Commonwealth of Australia accepts no responsibility for
any loss, damage or injury resulting from reliance on any of the information or views
contained in the publication.
Page 4
1. INTRODUCTION
Happiness, as a measure of well-being, has received great attention by policymakers
in recent years. In 2011, the United Nations General Assembly adopted a resolution entitled
‘Happiness: towards a holistic approach to development’ and the 2012 World Happiness
Report advocates for self-reported well-being and happiness to take precedence over GDP in
policymaking (Helliwell et al., 2012).1 Throughout the Pacific, happiness gained much
interest when Vanuatu topped the New Economics Foundations’ Happy Planet Index (HPI) in
2006. Moreover, the MNCC (2012) focused on happiness in developing alternative indicators
of well-being for Vanuatu. The report found that people living on custom land, that
participate in traditional ceremonial activities and who are active members of their
community are, on average, happier.
This paper seeks to identify the main determinants of happiness in two Melanesian
countries: the Solomon Islands and Vanuatu. Communities in these countries are distinct,
with the majority of households living semi-subsistence lifestyles on communally owned land
in rural areas. Virtually all households have access to a garden on which to grow their food
and systems of exchange, reciprocity and social networks are known to be very strong.
A specific objective of the paper is to examine whether there is a relationship
between poverty and happiness. To the authors’ knowledge the relationship between the two
has yet to be examined in a systematic manner since household surveys are usually designed
to focus on one at the expense of the other.2 Given the focus of the international community
on income poverty and the preference of policymakers in the region (and elsewhere) to find
alternative indicators, it is important to determine whether the two are related.
Defining and measuring poverty in Melanesian countries such as the Solomon
Islands and Vanuatu is a challenging task. One view is that poverty does not exist in these
countries since communally owned land systems, subsistence or semi-subsistence lifestyles
Page 5
and strong social support networks prevent extreme hunger, homelessness and outright
destitution. A similar view is that subsistence affluence prevails in these societies. The term,
originally coined by Fisk (1971), relates to households being able to satisfy their needs with
very little labour input.3 It is for these reasons that people have been very reluctant to refer to
poverty when evaluating human well-being in these societies.
Yet lifestyles in these societies are changing and many households in these countries
face a number of challenges akin to poor households across the world. Malnutrition and
hunger exist, with households relying on cheap, sometimes poor quality imported food and
sometimes skipping meals. Monetisation is increasing the importance of income to enable the
payment of school fess and the purchase of basic household goods and services in order to
meet the basic needs of the family. Urbanisation combined with very few employment
opportunities has given rise to squatter settlements, high rates of unemployment, social
tensions and crime. Moreover, climate change threatens to exacerbate the problems faced by
these countries. Unfortunately, only a very limited number of surveys are conducted to
provide insights into these issues. Assessing well-being in these contexts is therefore timely
and important and can provide crucial information for policymakers and their social
protection policies.
The challenges facing these countries are borne out by some of their official
development indicators. While the World Bank classifies both the Solomon Islands and
Vanuatu as middle income countries, other indicators reveal relatively low levels of
development. Using basic needs poverty lines, in 2006, 23 per cent of the population of the
Solomon Islands and 16 per cent of the population of Vanuatu lived in poverty (AusAID,
2009).4 According to the Human Development Index (HDI), the Solomon Islands and
Vanuatu rank 143 and 124 respectively out of 186 countries (UNDP, 2013). Assessing
progress towards the United Nations Millennium Development Goals (MDGs) is difficult due
Page 6
to a paucity of data but where data do exist they suggest that the Solomon Islands is unlikely
to achieve any of the goals while Vanuatu is on track to achieve just two: reducing child
mortality and combatting HIV/AIDS and other diseases (PIFS, 2012). Improving child health
remains a challenge in both countries, with 26 per cent of children under the age of five in
Vanuatu and 32 per cent of children in the Solomon Islands found to be stunted (AusAID,
2012).
Given the distinctive lifestyles of Melanesian communities, defining poverty in the
region will always be controversial. There is however, a consensus that conventional
measures of poverty based on income or consumption are considered inappropriate. Further,
participatory poverty assessments conducted in these and other Pacific countries found that
households preferred the term hardship over poverty and reported suffering from a lack of
access to basic services, income earning opportunities and good governance.
In recognition that any measure of poverty in the countries is likely to be
contentious, the focus of this paper is on the well-known Multidimensional Poverty Index
devised by Alkire and Foster (2011). The index is arguably well-suited to Melanesian
countries since it uses information on three non-monetary dimensions of well-being: health;
education and living standards. The impact of relative poverty (how rich people feel relative
to the rest of their community) on happiness is also examined.
The remainder of this paper is structured as follows. Section 2 summarises the
existing literature which has sought to explain the determinants of happiness. Section 3
describes the data and methodology employed by the paper. Section 4 presents the findings
from the empirical analysis and finally, Section 5 concludes.
Page 7
2. LITERATURE REVIEW
There is now widespread recognition of the inadequacy of income as measure of well-
being and a search for more appropriate measures. As noted above, this is particularly true in
Melanesia where semi-subsistence livelihoods and very strong social support networks imply
that the use of income-based measures of well-being is inappropriate.
The Alternative Indicators of Well-being report for Vanuatu emanated from the 2008
Melanesian Spearhead Group (MSG) Trade and Economic Officials Meeting (TEOM) and
the MSG Leaders’ Summit. The leaders agreed that governments in the region need to do
more to account for and measure the non-cash values that contribute to their peoples’ quality
of life (MNCC, 2012). Findings suggest that people from Torba province are the happiest in
Vanuatu and this is despite them having low incomes and being a long way from a major
market. The report also demonstrated the importance of resource access, culture and
community vitality, necessitating the inclusion of such factors in the investigation carried out
by this paper. The remainder of this section summarises the determinants of happiness that
have been identified by other studies.
(a) Income and happiness
The focus of many happiness studies has been the impact of income. Such
investigations are motivated by the seminal work of Easterlin (1974) which presented a so-
called paradox. He found that: (i) richer individuals in the US are happier than poorer
individuals but; (ii) over time, as the US got richer, average happiness failed to increase. In
fact, despite income levels increasing, levels of happiness in the US, Japan, UK and most
European countries have been static since the late 1950s (Laynard, 2006). A number of
explanations have been purported to explain this paradox.
Page 8
The first is that individuals’ relative incomes are important for happiness, rather than
actual income levels (Jiang et al., 2012).5 Individuals compare themselves to others and feel
happier if their relative circumstances improve. According to this theory, if all individuals’
incomes increase together, then their relative standing does not change and happiness remains
unaltered. Secondly, as argued by Layard (2006), people adapt to higher incomes quite
quickly, making it hard to secure permanent increases in happiness from increases in income.
While a rise in income might therefore have an impact on happiness initially, this impact
dissipates over the longer term. Thirdly, the World Happiness Report argues that higher
incomes can come at a cost, such as environmental degradation, an increase in insecurity, a
loss of trust and reduced confidence in government. At a country level, it might also be the
case that additional incomes only flow to the rich, doing little to increase the average level of
happiness (Helliwell et al., 2012).
Another finding is that there is diminishing marginal utility of income with respect to
happiness. In other words, the life satisfaction of the poor can be improved with small
amounts of money while richer individuals require a much larger increase in absolute income
to improve their happiness. At low levels of income, additional financial resources can secure
basic needs such food, clothing, housing, health care, water and sanitation. At higher
incomes, such needs have already been met (Helliwell et al, 2012).
(b) Non-income determinants of happiness
There is generally a consensus on the non-income determinants of happiness
(Appleton and Song, 2008; Dolan et al., 2008; MacKerron, 2012). In particular, after basic
needs are met, aspirations, relative income differences and the security of gains in well-being
are all found to be important (Graham, 2005).6
Page 9
Helliwell et al (2012) categorise the main determinants of happiness into two groups.
The first group includes external factors, which policymakers can change such as income,
work, community and governance, and values and religion. Country level data reveals that
happiness is highest in countries with a sense of community, trust and social equity –
Denmark, Finland, Norway, Netherlands. The second group includes person factors such as
mental health, physical health, family experience, education, gender and age.
Unemployment and less job security are found to impact negatively on happiness (Di
Tella et al, 2001; Frey and Stutzer, 2002) while trust, being part of a community, freedom,
equality and religion all have a positive association (Helliwell et al., 2012). Better mental and
physical health are found to be positively associated with happiness although these variables
are often difficult to measure (Helliwell et al., 2012). Marriage is nearly always found to
increase happiness but there is no strong evidence that having children is associated with
happiness (Stutzer and Frey, 2006). The level of education is usually expected to increase an
individuals’ income although there is relatively little evidence of this effect independent of
income (Helliwell et al., 2012). With regard to gender, women are found to be happier than
men in advanced economies but the reverse is sometimes found to be the case in developing
countries (Graham and Felton, 2005; Blanchflower, 2008; Senik, 2004). The relationship
between happiness and age is often found to be U-shaped with happiness declining for
middle-aged individuals before rising in later life (Blanchflower and Oswald, 2004;
Helliwell, 2003). These findings from the literature inform the specification of the empirical
model specified in the proceeding section.
However, while studies have tended to focus on the relationship between income and
poverty, there is little evidence of whether poverty (and non-income poverty in particular) is
related to happiness. It is sometimes argued that the poor are happy possibly due to a focus on
relationships and community vitality rather than on money and materialism with pictures of
Page 10
smiling people in remote areas of Africa providing testament to this claim. Conversely, it can
be argued that such assertions are naive to the aspirations of the poor and their need for
access to food and basic services for their survival. Amartya Sen notes that the some people
can bear adversity cheerfully (although this does not mean there is no adversity and that we
should ignore the depravity experienced by the poor (see Barford, 2011)). A related issue is
whether there is a relationship between vulnerability and happiness. Vulnerability refers to
the likelihood of being poor or becoming poor in the future. Graham and Pettinato (2002)
find that the self-reported well-being of those who have escaped poverty can be lower than
that of the poor due to an insecurity or risk of falling back into poverty. This paper
contributes to the existing literature by examining these issues in greater detail.
3. DATA AND METHODOLOGY
(a) Data
The paper employs data from a unique household survey conducted in the Solomon
Islands and Vanuatu in 2012-2013. A total of 619 households were surveyed (302 households
in the Solomon Islands and 317 households in Vanuatu). Five locations were targeted in each
country, which were selected based on criteria that sought to reflect diversities in remoteness,
economic activity, and environmental differences.
In the Solomon Islands, communities on the two largest islands were surveyed:
Guadalcanal and Malaita. In the capital, Honiara, two squatter settlements, White River in the
west of the city and Burns Creek in the east, were visited. The former is a multi-ethnic
settlement located in western Honiara while the latter consists mainly of Malaitans that were
displaced during an ethnic conflict from 1999-2003. Two communities on the Weather Coast
of Guadalcanal, Oa and Marauipa, were also surveyed. This is a region renowned for its
geographical remoteness and its exposure to harsh climactic conditions. Finally, households
Page 11
were surveyed in the densely populated rural centre of Malu’u, which is located about 80 kms
north of Auki, the country’s second largest city, on the island of Malaita.
Comparable communities were visited in Vanuatu. In the capital city, Port Vila,
communities were visited in the squatter settlements of Ohlen in the north of the city and
Blacksands in the south west, both of which are home to migrants from outer islands. Two
migrant communities in the country’s second largest city, Luganville, located on the island of
Espiritu Santo, were also visited (Pepsi and Sarakata). While only separated by the Sarakata
river, these two communities enjoy very different access to government services since, at the
time of the survey, Pepsi community was not considered to be under the auspices of the
Luganville Municipal Council. The final survey location was Hog Harbour, also on Espiritu
Santo, which is a rural village with good access to Luganville following the completion of the
East Santo road, and also to tourism owing to its proximity to the well-renowned Champagne
Beach.
The survey was designed following a literature review of poverty and happiness and
their drivers in developing countries, particularly in the Pacific Islands. In order to capture
potential gender differences, the research teams aimed for a 45 to 55 per cent gender balance
in survey respondents. To measure happiness, household members were asked (in their local
language) ‘On a scale of 1-10 (with 10 being very happy and 1 being not happy at all) how
happy are you?’7 The happiness scores by community for each country are provided in Figure
1 below.
Page 12
Figure 1: Happiness Scores by community in the Solomon Islands and Vanuatu
02
46
810
Whi
te R
iver
Mar
uiap
a
Mal
u'u
Burn
s C
reek
Oa
Solomon Islands
02
46
810
Ohl
en
Hog
Har
bour
Blac
k S
ands
Sara
kata
Peps
i
Hap
pine
ss, 1
-10
Vanuatu
(b) Methodology
As outlined in Graham (2005), empirical models of happiness are usually specified in the
same way. We follow this specification:
W i=α+βx i+ε i, (1)
where W i is self-reported happiness of household member i, x i is a vector of explanatory
variables including socio-demographic and socio-economic characteristics. α is a constant
and β is a vector of coefficients. Unobserved characteristics and measurement errors are
captured in the error term (ε).
The inclusion of the variables in vector x i is motivated by the literature review
undertaken in Section II as well as by the characteristics, culture and livelihoods of
households in the Solomon Islands and Vanuatu, discussed in the introduction. The variables
Page 13
includes gender, age, education, employment, wealth, poverty, vulnerability, the change in
earnings during the past two years, self-reported inequality, household size, whether the
household lives on communally owned (custom) land, whether the household has access to a
garden, and whether the household worried that their food would run out before they got
money to purchase more (as a measure of food security).8
Self-reported inequality was obtained by asking households about their relative
financial situation: ‘Compared with the rest of your country do you feel poor or rich?’ and
respondents were provided with a five point Likert scale from 1 (for very poor) to 5 (for very
rich). The same question was asked in relation to their village or community.
Wealth is measured using an index based on the approach pioneered in Filmer and
Pritchett (2001). It uses a principal components approach to construct a score of
socioeconomic status (the authors refer to this as “wealth”) using indicators of durable assets,
indicators of the quality of water and sanitation access, electricity access and dwelling
characteristics.
Careful consideration was given to the measure of poverty used in the study. For the
reasons discussed above, this paper replicates the Multidimensional Poverty Index (MPI)
developed by the Oxford Poverty and Human Development Initiative. The index has become
a widely accepted and used measure of poverty and is currently reported in the annual
United Nations Development Program’s Human Development Reports. A case is also being
made for reductions in the MPI to be used as a headline goal in the new round of
international development targets in the post-2015 development agenda (Alkire and Sumner,
2013).
The MPI considers three equally weighted dimensions of poverty (health, education
and living standards) captured by ten indicators. The MPI therefore conveys additional
information not captured in single-dimensional measures. It identifies those who are poor
Page 14
through a two-step process involving identifying cut-offs of deprivation. ‘The first is the
traditional dimension-specific cut-off, which identifies whether a person is deprived with
respect to that dimension. The second delineates how widely deprived a person must be in
order to be considered poor’ (Alkire and Foster, 2011, p.477). In this way, the MPI
simultaneously concerns itself with how many people are experiencing poverty as well as
how much (or the depth of) the deprivation is being experienced.
The MPI is calculated using the following formula:
MPI=H × A, (2)
where H is the headcount or the percentage of people who are identified as
multidimensionally poor and A (intensity) is the percentage of dimensions in which the
average poor person is deprived. A household is deemed poor if it is deprived in at least 33
per cent of the weighted indicators. A measure of vulnerability is also included in the model.
Following Alkire and Foster (2011), vulnerable households are those with a weighted average
of deprivations somewhere between 0.20 and 0.33. Table A1 in the appendix provides the
dimensions, indicators, deprivation thresholds and weights for the MPI. Table A2 provides
variable definitions and summary statistics are provided in Table A3.
4. RESULTS AND INTERPRETATION
This section presents the results from the empirical model explaining the variation in
happiness across the communities in the Solomon Islands and Vanuatu. Our dependent
variable, happiness, is an ordinal variable taking values of 1 to 10. Higher values correspond
to a higher level of happiness. Given the ordinal nature of the dependent variable, OLS would
yield biased and inefficient parameter estimates and an ordered probit model is therefore
estimated. All models include community fixed effects to account for unobserved
Page 15
characteristics that vary between communities and could potentially affect individual levels
of happiness, such as the proximity to urban centres or the coast.
Column (1) of Table 1 presents results from the model with the wealth variable
included but the poverty variable excluded. Since there is a high degree of correlation
between these two variables they cannot be employed together in the model. The same
applies to the personal perceptions of inequality variables (relative to country and
community).9 Findings from this model are consistent with a priori expectations. First,
people in wealthier households are found to be happier. Second, the variation in happiness in
these two Melanesian countries is partially explained by relative earnings. Specifically, an
increase in earnings over the last two years is found to significantly increase happiness.
Moreover, if individuals believe themselves to be richer than others in their community or
country, then they are also happier. Our findings, therefore, contradict evidence from other
developing countries, showing a negative relationship between inequality and happiness.10
Economists have formulated a number of theories to explain how the happiness of
an individual can be affected by the happiness of others. For example, classical theorists such
as Bentham and Marshall describe how utility is a function not only of personal consumption,
but also, the desire for distinction from others in society (Barber, 1991). Specifically, they
suggest that utility is a function of factors such as status, prestige and reputation. Moreover,
they argue that consumption of general goods and services, itself, can be driven by our
perceptions of others. It seems, therefore, that in poor communities in Melanesia, status
seems to be playing an important role in determining utility. In other words, being richer than
others or having had improvements in one’s own wealth will increase happiness in these
households.
Table 1 also reveals that individuals living on communally owned land are happier.
Primarily, this may occur because individuals with access to the land may use it to establish
Page 16
gardens and grow food without having to pay for usage rights. Individuals with access to this
land may also feel happier because of stronger cultural connections to land in these countries
and a sense of belonging stemming from the fact that these lands have been passed from
generation to generation through a variety of traditional tenure systems for millennia
(MNCC, 2012).
Turing to the remaining variables, Table 1 also indicates that large household size is
associated with lower happiness in these communities. To put this into perspective, an
increase in the number of people living in a household by 1 lowers the probability that an
individual will attain a score of 10 in the happiness scale by 1 per cent.11 This finding is
consistent with anecdotal evidence that extended family members are moving to areas with
better employment opportunities and placing stress on the households which host them.
Increasing numbers of mouths to feed with limited employment opportunities and sometimes
a shortage of land for gardens is reducing the happiness of household members. Findings
from Table 1 also indicate, not surprisingly, that households experiencing food insecurity are
found to be less happy.
Column (2) presents results when poverty is introduced into the model (and the
wealth variable is excluded, given that they share a number of the same components). The
negative and statistically significant coefficient attached to this variable indicates that people
living in multidimensionally poor households are less happy. This is a unique and important
finding suggesting a vital link between the two. Interestingly, the MNCC (2012) found that
people in Torba province, the northernmost region of Vanuatu, which includes the Banks
Islands, are on average, the happiest people in Vanuatu. Yet previous research also reveals
that the rate of multidimensional poverty is also quite high in the most geographically distant
regions of the Solomon Islands and Vanuatu, which includes the Banks Islands, suggesting
that Torba is likely to be an exception (Clarke et al., 2013).
Page 17
Columns (3) and (4) of Table 1 present results from models using the alternative
inequality variable (where respondents are asked how rich they feel relative to the rest of
their community, rather than their country). Results, again, suggest a positive finding between
happiness and inequality while results relating to the other variable remain largely
unchanged.
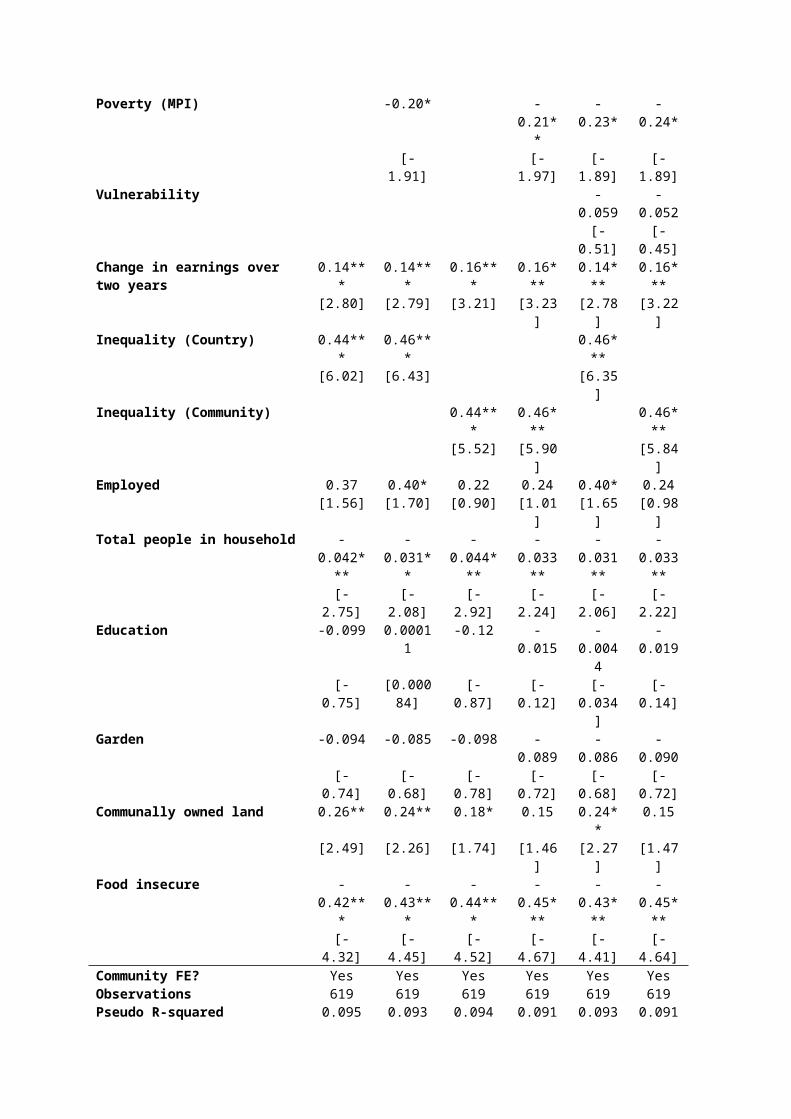
Table 1: The Determinants of Happiness in the Solomon Islands and Vanuatu
Independent variables (1) (2) (3) (4) (5) (6)Male 0.12 0.15 0.10 0.13 0.16 0.13
[1.28] [1.57] [1.07] [1.35] [1.59] [1.38]Age -0.024 -0.022 -0.026 -0.024 -0.022 -0.024
[-1.34] [-1.21] [-1.47] [-1.34] [-1.24] [-1.36]Age squared 0.00029 0.00027 0.00032* 0.00029 0.00027 0.00029
[1.51] [1.37] [1.65] [1.51] [1.39] [1.53]Wealth 0.15*** 0.15***
[3.19] [3.30]Poverty (MPI) -0.20* -0.21** -0.23* -0.24*
[-1.91] [-1.97] [-1.89] [-1.89]Vulnerability -0.059 -0.052
[-0.51] [-0.45]Change in earnings over two years 0.14*** 0.14*** 0.16*** 0.16*** 0.14*** 0.16***
[2.80] [2.79] [3.21] [3.23] [2.78] [3.22]Inequality (Country) 0.44*** 0.46*** 0.46***
[6.02] [6.43] [6.35]Inequality (Community) 0.44*** 0.46*** 0.46***
[5.52] [5.90] [5.84]Employed 0.37 0.40* 0.22 0.24 0.40* 0.24
[1.56] [1.70] [0.90] [1.01] [1.65] [0.98]Total people in household -
0.042***-0.031** -
0.044***-
0.033**-
0.031**-
0.033**[-2.75] [-2.08] [-2.92] [-2.24] [-2.06] [-2.22]
Education -0.099 0.00011 -0.12 -0.015 -0.0044 -0.019[-0.75] [0.00084
][-0.87] [-0.12] [-0.034] [-0.14]
Garden -0.094 -0.085 -0.098 -0.089 -0.086 -0.090[-0.74] [-0.68] [-0.78] [-0.72] [-0.68] [-0.72]
Communally owned land 0.26** 0.24** 0.18* 0.15 0.24** 0.15[2.49] [2.26] [1.74] [1.46] [2.27] [1.47]
Food insecure -0.42*** -0.43*** -0.44*** -0.45***
-0.43***
-0.45***
[-4.32] [-4.45] [-4.52] [-4.67] [-4.41] [-4.64]Community FE? Yes Yes Yes Yes Yes YesObservations 619 619 619 619 619 619Pseudo R-squared 0.095 0.093 0.094 0.091 0.093 0.091Chi-squared p-value 0 0 0 0 0 0Notes: Dependent variable is happiness. Robust z-statistics in brackets. *, **, and *** denote statistical significance at the 10, 5 and 1 per cent, respectively.
Page 18
5. CONCLUSION
Using statistical modelling of unique household survey data, this paper identifies
the main determinants of happiness in both the Solomon Islands and Vanuatu. An import-
ant finding is that the level of income does not explain the variation in happiness in these
two countries. The quest for alternative indicators of well-being in the region is therefore
well justified. So too is a focus on reducing multidimensional poverty. Findings indicate
that the poor in these countries are, on average, less happy. This has important implica-
tions. Improving the health, education and living standards indicators of the MPI will im-
prove happiness in the region, as well as being worthwhile in their own right.
Other findings reveal that wealth, increases in income and relative income are all
positively associated with happiness. In contrast, household size has a negative associ-
ation. These findings are generally consistent with many previous studies explaining the
variation in happiness (usually across country).
Two other findings from the analysis are unique to this study, with further implic-
ations for policymakers in Melanesia. The first is that people on communally owned land
are found to be happier. This is likely to reflect the close ties that communities in these
countries have to their land as well as the importance of land for gardens. Secondly, food
security is also found to be important for happiness. Policymakers should therefore find
ways to strengthen access to land and improve food security. In urban areas this might in-
volve support for urban gardens and land segregation schemes, as well as programs that en-
courage food cultivation in the available space around homes, such as potted and hanging
gardens. Improving agricultural productivity through education, access to finance and the
provision of tools will also improve food security
18
Page 19
REFERENCES
Alesina, A., Di Tella, R. and MacCulloch, R. (2004). Inequality and happiness: Are
Europeans and Americans different?, Journal of Public Economics, Vol.88, 2009–2042.
Alkire, S. and J. Foster (2011), Counting and Multidimensional Poverty Measurement.
Journal of Public Economics, Vol.95, pp. 476–487.
Alkire, S. and A. Sumner (2013), Multidimensional Poverty and the Post-2015 MDGs,
Oxford Poverty and Human Development Initiative, University of Oxford, UK.
Appleton, S. and L. Song (2008), Life Satisfaction in Urban China: Components and
Determinants, World Development, Vol.36, No.11, pp.2325-2340.
AusAID (2009), Tracking Development and Governance in the Pacific, Australian
Agency for International Development, Canberra.
AusAID (2012), Achieving Education and Health Outcomes in Pacific Island Countries –
Is There a Role for Social Transfers? AusAID Pacific Social Protection Series: Poverty,
Vulnerability and Social Protection in the Pacific, Australian Agency for International
Development, Canberra.
Barber, W.J. (1991). A History of Economic Thought. Penguin, Australia.
Barford, A. (2011), The Myth of the Happy Poor,
[http://www.equalitytrust.org.uk/sites/default/files/happy-myth-anna-barford.pdf]
Blanchflower, D. G. (2008). International Evidence on Well-being. NBER Working
Paper 14318, National Bureau for Economic Research, US.
19
Page 20
Blanchflower, D. and Oswald, A. (2004), Well-being over time in Britain and the USA,
Journal of Public Economics, Vol.88, 1359–1387.
Bookwalter, J.T. and D.R. Dalenberg (2010), Relative to What or Whom?: The
Importance of Norms and Relative Standing to Well-being in South Africa, World
Development, Vol.38, No.3, pp.345-355.
Cantril, H. (1965). The Pattern of Human Concerns. Rutgers University Press, New
Brunswick, NJ.
Clarke, M., Feeny, S. and L. McDonald (2013), Vulnerability to What?:
Multidimensional Poverty in Melanesia, in Feeny, S. (ed.), Household Vulnerability and
Resilience to Economic Shocks: Evidence from Melanesia, Ashgate, UK.
Di Tella, R., MacCulloch, R. J., & Oswald, A. J. (2001), Preferences over inflation and
unemployment: Evidence from surveys of happiness. American Economic Review,
Vol.91, 335–341.
Dolan, P., Peasgood, T. and M. White (2008), Do We Really Know What Makes Us
Happy?: A Review of the Economic Literature on the Factors Associated with Subjective
Well-Being, Journal of Economic Psychology, Vol.29, pp.94-122.
Easterlin, R.A. (1974), Does Economic Growth Improve the Human Lot? Some
Empirical Evidence, in David, R. and M. Reder, Nations and Households in Economic
Growth: Essays in Honour of Moses Abramovitz, Academic Press, New York.
20
Page 21
Fisk, E. (1971), Labour Absorption Capacity of Subsistence Agriculture”, Economic
Record, Vol. 47, No.119, pp.366-78.
Frey, B. and Stutzer, A. (2002), What Can Economists Learn from Happiness Research?
Journal of Economic Literature, Vol.40, 401–35.
Gibson, J (2010), Recent Shocks and Long-term Change in the Samoan Economy, Pacific
Economic Bulletin, Vol.25, pp.7–23.
Graham, C. (2005), The Economics of Happiness: Insights on Globalisation from a Novel
Approach, World Economics, Vol.6, No.3, pp.41-55.
Graham, C. and Pettinato, S. (2002), Happiness and Hardship: Opportunity and Insecurity
in New Market Economies, The Brookings Institution, Washington, DC.
Graham, C. and Felton, A. (2005), Does Inequality Matter to Individual Welfare: An
Exploration Based on Happiness Surveys in Latin America, Center on Social and
Economic Dynamics Working Papers Series No. 38. Washington, DC: The Brookings
Institution
Graham, F. and Felton, A. (2006), Inequality and happiness: Insights from Latin
America, Journal of Economic Inequality, Vol.4, pp.107-122.
Helliwell, J. (2003), How’s Life? Combining Individual and National Variables to
Explain Subjective Well-Being, Economic Modelling, Vol.20, pp.331-60.
Helliwell, J., Layard, R. and Sachs, J. (2012) World Happiness Report. New York: The
Earth Institute, Columbia University.
21
Page 22
Helliwell, J., Layard, R. and Sachs, J. (2013) World Happiness Report. New York: The
Earth Institute, Columbia University.
Filmer, D., L.H. Pritchett (2001), Estimating Wealth Effects Without Expenditure Data –
or Tears: An Application to Educational Enrolments in States of India, Demography,
Vol.38, No.1, pp.115–132.
Jiang, S., Lu, M. and H. Sato (2012), Identity, Inequality and Happiness: Evidence from
Urban China, World Development, Vol.40, No.6, pp.1190-1200.
Layard, R. (2006). Happiness and Public Policy: A Challenge to the Profession,
Economic Journal, Vol.116, pp.C24-C33.
MacKerron, G. (2012), Happiness Economics from 35,000 Feet, Journal of Economic
Surveys, Vol.26, No.4, pp.705-735.
MNCC (2012), Alternative Indicators of Well-being for Melanesia, Vanuatu Pilot Study
Report, Malvatumauri National Council of Chiefs, Port Vila, Vanuatu.
Nanau, G.L. (2011), The Wantok System as a Socio-economic and Political Network in
Melanesia, OMNES: The Journal of Multicultural Society, Vol.2, No.1, pp.31-55.
Narsey, W (2011), The Incidence of Poverty in Solomon Islands: the Importance of
Methodology, Journal of Pacific Studies, Vol.31, No.1, pp.31-58.
Narsey, W. (2012), Poverty Analysis in Vanuatu: A Critical Review and Alternative
Formulation, South Pacific Studies, Vol.33, No.1, pp.25-51.
22
Page 23
PIFS (2012), Pacific Regional MDGs Tracking Report 2012, Pacific Islands Forum
Secretariat, Suva.
Sacks, D.W., Stevenson, B. and J. Wolfers (2012), The New Stylized Facts About
Income and Subjective Well-Being, Emotion, Vol.12, No.6, pp.1181-1187.
Senik, C. (2004), When Information Dominates comparison. Learning from Russian
Subjective Panel Data, Journal of Public Economics 88, 2099–2133.
Stutzer, A. (2004), The Role of Income Aspirations in Individual Happiness, Journal of
Economic Behavior and Organization, Vol.54, No.1, pp.89-109.
Stutzer, A., and Frey, B.S. (2006), Does Marriage Make People Happy, Or Do Happy
People Get Married?. Journal of SocioEconomics, Vol.35, No.2, pp.326-347.
Tomes, N. (1986), Income Distribution, Happiness, and Satisfaction: A Direct Test of the
Interdependent Preference Model”, Journal of Economic Psychology, Vol.7, pp.425–446.
UNDP (2013), Human Development Report: The Rise of the South, United Nations
Development Program, New York.
23
Page 24
Appendix
Table A1: Dimensions, Indicators, Deprivation Thresholds and Weights for the Multidimensional Poverty Index
Dimension (weight)
Indicator(weight) Deprived if…..
Health(1/3)
Mortality(1/6) Any child has died in the family
Nutrition(1/6)
Any adult or child for whom there is nutritional information is malnourished*
Education(1/3)
Years of Schooling(1/6)
No household member has completed five years of schooling
School Attendance(1/6)
Any school-aged child is not attending school in years 1 to 8
Standard of Living(1/3)
Electricity(1/18)
The household has no electricity
Sanitation(1/18)
The household´s sanitation facility is not improved (according to the MDG guidelines), or it is improved but shared with other households
Water(1/18)
The household does not have access to clean drinking water (according to the MDG guidelines) or clean water is more than 30 minutes walking from home.
Floor(1/18) The household has dirt, sand or dung floor
Cooking Fuel(1/18) The household cooks with dung, wood or charcoal.
Assets(1/18)
The household does not own more than one of: radio, TV,telephone, bike, motorbike or refrigerator, and does not owna car or truck
Notes: A proxy measure was used for this indicator. A households is deprived if they answered in the affirmative to the question “Did you or any other adults in the house not eat food for an entire day because there wasn’t enough money to buy food” taken from the US Food Security module. The Table is based on Alkire (2011)
24
Page 25
Table A2: Variable Definitions
Variable DefinitionHappiness Measured using a Likert scale (1 to 10)Male Dummy variable taking the value of 1 for male respondentsAge Age of respondent in yearsWealth Index of a households assets and access to basic services. Based on
Filmer and Pritchett (2001)Poverty Binary dummy variable taking the value of 1 for poor households.
Based on Multidimensional Poverty Index of Alkire and Foster (2011)
Vulnerability Binary dummy variable taking the value of 1 for households that are close to the poverty threshold. Based on Alkire and Foster (2011)
Change in earnings Based on the question ‘During the past two years, how have your earnings changed?’ measured using a Likert scale (1 to 5)
Inequality (Country) Responses to ‘Compared with the rest of your country do you feel poor or rich?’ measured using a Likert scale (1 to 5)
Inequality (Community) Responses to ‘Compared with the rest of your community do you feel poor or rich?’ measured using a Likert scale (1 to 5)
Employed Binary dummy variable taking the value of 1 if the respondent works for money
Household size Number of people in the householdEducation Proportion of household members finished primary and secondary
schoolGarden Binary dummy variable taking the value of 1 if the house has access
to a gardenCommunally owned land Binary dummy variable taking the value of 1 if the house is on com-
munally owned landFood insecure Binary dummy variable taking the value of 1 if the household
worried that their food would run out before they got money to purchase more
25
Page 26
Table A3: Summary Statistics
Variable Obs Mean Std. Dev.
Min Max
Happiness (scale from 1 to 10) 619 7.30 2.33 1 10Male 619 0.54 0.50 0 1Age 619 41.14 14.01 17 86Wealth 619 0.04 1.36 -3.09 3.17Multidimensional Poverty Index 619 0.31 0.46 0 1Vulnerability 619 0.24 0.43 0 1Change in earnings 619 3.14 0.98 1 5Inequality (Country) 619 2.77 0.69 1 5Inequality (Community) 619 2.92 0.65 1 5Employed 619 0.96 0.20 0 1Household size 619 5.53 2.79 1 23Education 619 0.47 0.35 0 1Garden 619 0.77 0.42 0 1Communally owned land 619 0.53 0.50 0 1Food insecure 619 0.55 0.50 0 1
26
Page 27
Endnotes
1 The country of Bhutan is often viewed as taking the lead role on this issue by devising its measure of Gross National
Happiness.
2 While the relationship between GDP per capita and happiness is often analysed at a country level (Helliwell et al.,
2013), studies have not specifically examined whether poor people are happy.
3 While Fisk (1971) was referring to livelihoods in Papua New Guinea, the term has also been applied to other
Melanesian countries.
4 Basic needs poverty lines measure the level of income required to meet certain thresholds for housing, food, clothing,
healthcare, education and to meet customary obligations (AusAID, 2009). If the household earns less currency than the
amount deemed necessary to meet these needs, the household is classified as poor. Urban poverty is found to be far
higher than rural poverty in these countries (AusAID, 2009). However, Gibson (2010) and Narsey (2011; 2012) argue
that this is likely to be the result of errors in calculating comparable poverty lines between urban and rural areas.
5 Relative standing or achievement relative to peers and parents can also be important (Bookwalter and Dalenbeg, 2010)
6 Helliwell (2003) finds that six variables can explain 80 per cent of the variance in happiness across 50 countries: the
divorce rate, the unemployment rate, the percentage of people reporting that “most people can be trusted”; membership
in non-religious organisations; the percentage of citizens who “believe in God”; and the quality of government.
7 This measure is line with previous work in the region (MNCC, 2012) which, in turn, uses the Self-Anchoring Striving
Scale of Cantril (1965). Discussions with local researchers and enumerators revealed that people would interpret the
question as happiness in general or happiness with life as a whole rather than happiness today.
8 It is common for studies to use the log of income as an explanatory variable to capture the diminishing marginal utility
of income. However, the income variable used in this study is ordinal, consisting of five income brackets given the
difficulties in accurately recording income in the countries concerned.
9 It has been suggested that wealth is endogenous in model explaining happiness (see Stutzer, 2004). The same might
also apply to the poverty variable. We tested for the endogeneity of these variables using a Durbin-Wu-Hausman test,
using education and the number of children as instruments, noting that they are not significant determinants of
happiness. These tests indicated that both variables are exogenous at the 1 percent level of statistical significance.
10 While Tomes (1986) finds positive relationship between inequality and happiness in Canada, Alesina et al. (2004)
find a negative relationship between inequality and happiness in Europe and the United States. Similarly, Blanchflower
and Oswald (2004) show that a small, albeit statistically significant, effect of inequality on well-being in the same group
of countries. Finally, for developing countries, Graham and Felton (2006) find a negative relationship between these
variables in Latin America. However, Senik (2004) finds that inequality has no statistical significant effect on happiness
Page 28
in Russia.
11 This figure is calculated by taking the marginal effect of having one more person in the household on scoring 10 on
the happiness scale, holding everything else at its mean.