18
Q1 Presentation 2012 27 April, 2012
| Date post: | 05-Jan-2016 |
| Category: |
Documents |
| Upload: | anthony-hawkins |
| View: | 218 times |
| Download: | 1 times |

Q1 Presentation 201227 April, 2012
2
Disclaimer• This presentation has been prepared by Duni AB (the “Company”) solely for use at this investor presentation and
is furnished to you solely for your information and may not be reproduced or redistributed, in whole or in part, to any other person. By attending the meeting where this presentation is made, or by reading the presentation slides, you agree to be bound by the following limitations.
• This presentation is not for presentation or transmission into the United States or to any U.S. person, as that term is defined under Regulation S promulgated under the Securities Act of 1933, as amended.
• This presentation contains various forward-looking statements that reflect management’s current views with respect to future events and financial and operational performance. The words “believe,” “expect,” “anticipate,” “intend,” “may,” “plan,” “estimate,” “should,” “could,” “aim,” “target,” “might,” or, in each case, their negative, or similar expressions identify certain of these forward-looking statements. Others can be identified from the context in which the statements are made. These forward-looking statements involve known and unknown risks, uncertainties and other factors, which are in some cases beyond the Company’s control and may cause actual results or performance to differ materially from those expressed or implied from such forward-looking statements. These risks include but are not limited to the Company’s ability to operate profitably, maintain its competitive position, to promote and improve its reputation and the awareness of the brands in its portfolio, to successfully operate its growth strategy and the impact of changes in pricing policies, political and regulatory developments in the markets in which the Company operates, and other risks.
• The information and opinions contained in this document are provided as at the date of this presentation and are subject to change without notice.
• No representation or warranty (expressed or implied) is made as to, and no reliance should be placed on, the fairness, accuracy or completeness of the information contained herein. Accordingly, none of the Company, or any of its principal shareholders or subsidiary undertakings or any of such person’s officers or employees accepts any liability whatsoever arising directly or indirectly from the use of this document.
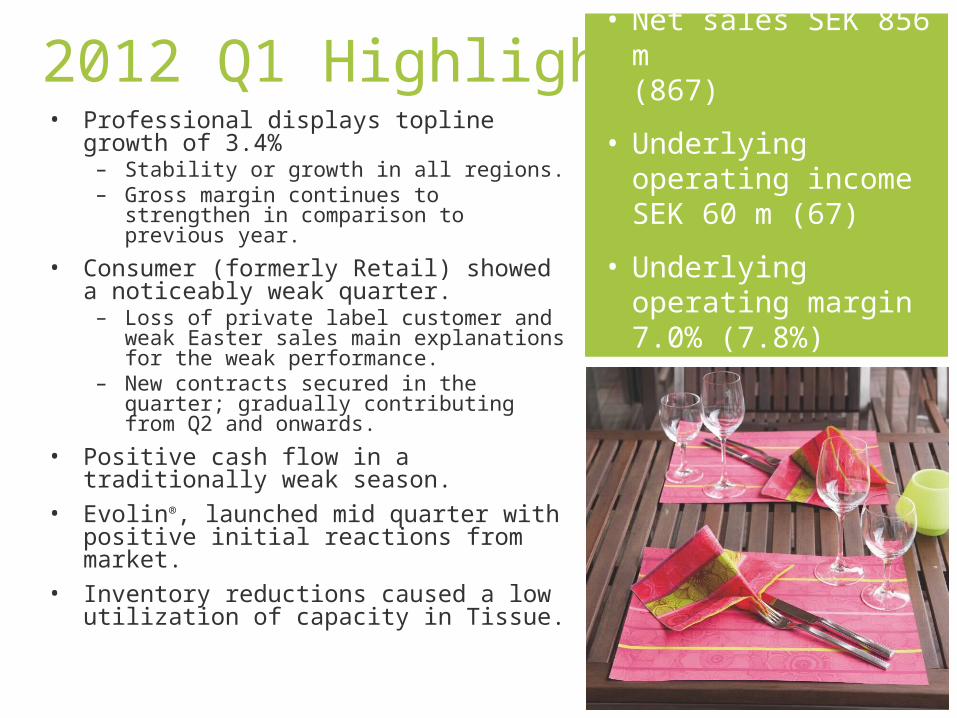
2012 Q1 Highlights• Professional displays topline growth of
3.4%– Stability or growth in all regions.– Gross margin continues to strengthen in
comparison to previous year.
• Consumer (formerly Retail) showed a noticeably weak quarter.– Loss of private label customer and weak
Easter sales main explanations for the weak performance.
– New contracts secured in the quarter; gradually contributing from Q2 and onwards.
• Positive cash flow in a traditionally weak season.
• Evolin®, launched mid quarter with positive initial reactions from market.
• Inventory reductions caused a low utilization of capacity in Tissue.
• Net sales SEK 856 m(867)
• Underlying operating income SEK 60 m (67)
• Underlying operating margin 7.0% (7.8%)

4
Market Outlook• HORECA market long-term growing
in line or slightly above GDP– Positive eating out trend.– Higher growth in take-away sector.
• Consumer segment suffers from weak demand in main markets.
• HoReCa sector still positive in main north and central European markets– Scandinavia & Germany continue
to indicate modest growth in restaurant segment.
– Clearly weaker demand in debt burdened southern Europe markets.
• Input material for traded goods show signs of returning to historical high levels. Pulp still below last years levels.

5
HoReCa total
HORECA Sales DevelopmentGermany (Feb 2012)

6
+5.2% in volume in Feb and +6.2% in value.
Restaurant Sales Development, Sweden (Feb 2011 – Feb 2012)

Business Areas

8
Professional – Stable sales development
Sales and EBIT 1)
0
500
1 000
1 500
2 000
2 500
3 000
2008 2009 2010 2011 LTM 2012
SE
K m
illions
0%
2%
4%
6%
8%
10%
12%
14%
16%
Sales EBIT Margin
1) Excluding non-recurring costs and market valuation of derivatives
• Stability with modest growth in all Regions.
• Gross margin continues to strengthen in comparison to previous year and main contributor to result improvement.
• Evolin rolled out step by step in all major markets.
Geographical split – sales Q1 2012
Net sales Professional
Q1 2012
Q1 2011 Growth Growth at fixed exchange rates
Nordic 140 142 -1.4% -1.4%
Central Europe 377 359 5.0% 4.2%
South & East Europe 99 96 3.1% 4.2%
Rest of the World 10 7 42.9% 42.9%
TOTAL 626 605 3.6% 3.4%

9
Consumer (formerly Retail) – Weak quarter due to poor volumes
Sales and EBIT 1)
0
200
400
600
800
1 000
2008 2009 2010 2011 LTM 2012
SE
K m
illions
-8%
-6%
-4%
-2%
0%
2%
4%
6%
Sales EBIT Margin
Geographical split - sales Q1 2012
• Easter seasonal sales have decreased in importance compare to past years. Moreover Duni had less success in gaining promotions.
• Albeit the loss of a major private label customer influencing the quarter negatively, several new contracts were secured.
Net sales Consumer
Q1 2012
Q1 2011 Growth Growth at fixed exchange rates
Nordic 15 19 -21.1% -21.1%
Central Europe 108 132 -18.2% -18.2%
South & East Europe 4 8 -50.0% -50.0%
Rest of the World 0 0 100.0% 100.0%
TOTAL 127 159 -20.1% -20.4%
1) Excluding non-recurring costs and market valuation of derivatives

10
Tissue – Low utilization degree in the quarter
Internal 57%
External 43%
Sales mix Q1 2012
• Low utilization in the quarter, due to inventory reduction, main reason for lower result.
• Underlying performance remains stable.
Sales and EBIT
0
100
200
300
400
500
600
2008 2009 2010 2011 LTM2012
0%
2%
4%
6%8%
10%
12%
14%
Sales EBIT Margin

11Financials
12
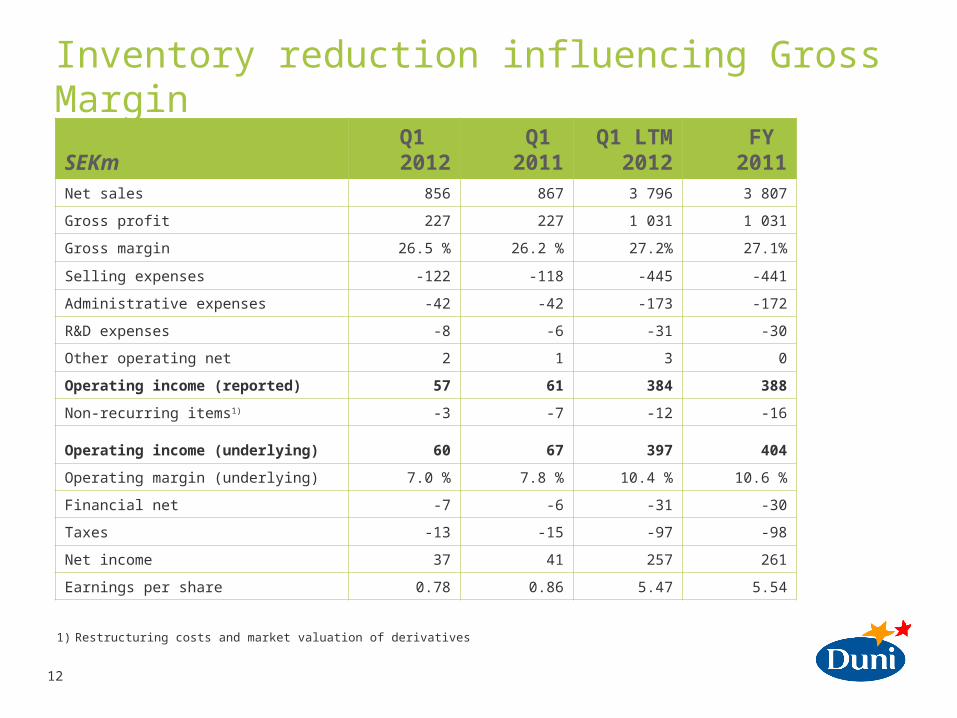
Inventory reduction influencing Gross Margin
SEKmQ1
2012Q1
2011Q1 LTM
2012FY
2011Net sales 856 867 3 796 3 807
Gross profit 227 227 1 031 1 031
Gross margin 26.5 % 26.2 % 27.2% 27.1%
Selling expenses -122 -118 -445 -441
Administrative expenses -42 -42 -173 -172
R&D expenses -8 -6 -31 -30
Other operating net 2 1 3 0
Operating income (reported) 57 61 384 388
Non-recurring items1) -3 -7 -12 -16
Operating income (underlying) 60 67 397 404
Operating margin (underlying) 7.0 % 7.8 % 10.4 % 10.6 %
Financial net -7 -6 -31 -30
Taxes -13 -15 -97 -98
Net income 37 41 257 261
Earnings per share 0.78 0.86 5.47 5.54
1) Restructuring costs and market valuation of derivatives

13
Improved profitability in Professional; weak performance in Consumer & Tissue
SEKmQ1 2012
Q1 2011
Q1 LTM 2012
FY 2011
Professional Net sales 626 604 2 788 2 766
Operating income1) 61 53 366 357
Operating margin 9.8% 8.7% 13.1% 12.9%
Consumer Net sales 127 159 580 612
Operating income1) -1 6 14 21
Operating margin -0.9% 3.5% 2.5% 3.4%
Tissue Net sales 104 104 427 428
Operating income1) 0 9 17 25
Operating margin 0.2% 8.7% 3.9% 5.9%
Duni Net sales 856 867 3 796 3 807
Operating income1) 60 67 397 404
Operating margin 7.0% 7.8% 10.4 10.6%
1) Excluding non-recurring cost and market valuation of derivates

14
Seasonally strong cash flow
SEKm
Q1 2012
Q1 2011
Q1 LTM 2012
FY 2011
EBITDA1) 88 95 504 511
Capital expenditure -39 -38 -378 -377
Change in;
Inventory -16 -56 3 -37
Accounts receivable 75 26 13 -36
Accounts payable -15 -69 46 -8
Other operating working capital -57 -2 -32 23
Change in working capital -13 -101 30 -58
Operating cash flow 36 -44 156 76
1) Excluding non-recurring costs and market valuation of derivatives

15
Net debt reduction in Quarter 1SEKm Q1 2012 Q1
2011FY
2011Goodwill 1 199 1 199 1 199
Tangible and intangible fixed assets 898 639 888
Net financial assets1) 215 255 210
Inventories 485 491 470
Accounts receivable 584 600 663
Accounts payable -287 -242 -302
Other operating assets and liabilities3) -239 -266 -300
Net assets 2 855 2 676 2 827
Net debt 732 647 745
Equity 2 124 2 029 2 082
Equity and net debt 2 855 2 676 2 827
ROCE2) 15% 18% 17%
ROCE2) w/o Goodwill 28% 35% 29%
Net debt / Equity 34% 32% 36%
Net debt / EBITDA2) 1.5 1.2 1.5
1) Deferred tax assets and liabilities + Income tax receivables and payables
2) Excluding non-recurring costs and market valuation of derivatives
3) Including restructuring provision and derivatives

Strategic challenge

17
Financial Targets• Organic growth of 5% over a
business cycle
• Consider acquisitions to reach new markets or to strengthen current market positions
• Top line growth – premium focus
• Improvements in manufacturing, sourcing and logistics
• Target at least 40% of net profit
Sales growth > 5%
EBIT margin > 10%
Dividend payout ratio 40+%
0%
(at fixed
exchange rates)
10.4%
Q1 LTM 2012
3.50 SEK per share (proposal)

18
Exploring Different Growth Paths
Core geography New geography
New Horeca concepts
Table top
Conceptexpansion
MarketPenetration
Platformexpansion
Supported by new organizational structure


