27
Managed Account Solutions SM : Benefit from a personalized investment plan to help you reach your financial goals <Insert Firm Logo Here>
| Date post: | 27-Dec-2015 |
| Category: |
Documents |
| Upload: | gwenda-bishop |
| View: | 217 times |
| Download: | 0 times |

Managed Account SolutionsSM:
Benefit from a personalized investment plan to help you reach your financial goals
<Insert Firm Logo Here>
22
1
2
3
Agenda
Managed Account Basics
Key Managed Account Solutions Potential Benefits
Is Managed Account Solutions Right for You?
33
Managed accounts defined
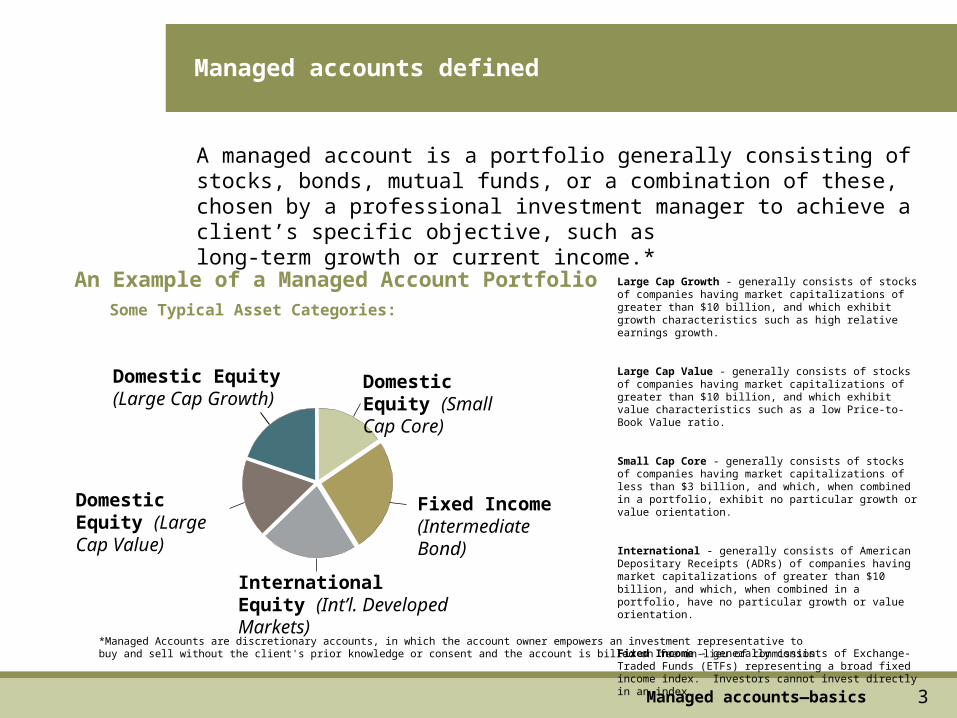
A managed account is a portfolio generally consisting of stocks, bonds, mutual funds, or a combination of these, chosen by a professional investment manager to achieve a client’s specific objective, such as long-term growth or current income.*
International Equity (Int’l. Developed Markets)
Domestic Equity (Small Cap Core)
Fixed Income (Intermediate Bond)
Domestic Equity (Large Cap Value)
Domestic Equity (Large Cap Growth)
An Example of a Managed Account PortfolioSome Typical Asset Categories:
Large Cap Growth - generally consists of stocks of companies having market capitalizations of greater than $10 billion, and which exhibit growth characteristics such as high relative earnings growth.
Large Cap Value - generally consists of stocks of companies having market capitalizations of greater than $10 billion, and which exhibit value characteristics such as a low Price-to-Book Value ratio.
Small Cap Core - generally consists of stocks of companies having market capitalizations of less than $3 billion, and which, when combined in a portfolio, exhibit no particular growth or value orientation.
International - generally consists of American Depositary Receipts (ADRs) of companies having market capitalizations of greater than $10 billion, and which, when combined in a portfolio, have no particular growth or value orientation.
Fixed Income - generally consists of Exchange-Traded Funds (ETFs) representing a broad fixed income index. Investors cannot invest directly in an index.
Managed accounts—basics
*Managed Accounts are discretionary accounts, in which the account owner empowers an investment representative to buy and sell without the client's prior knowledge or consent and the account is billed on fee in-lieu of commission.
44
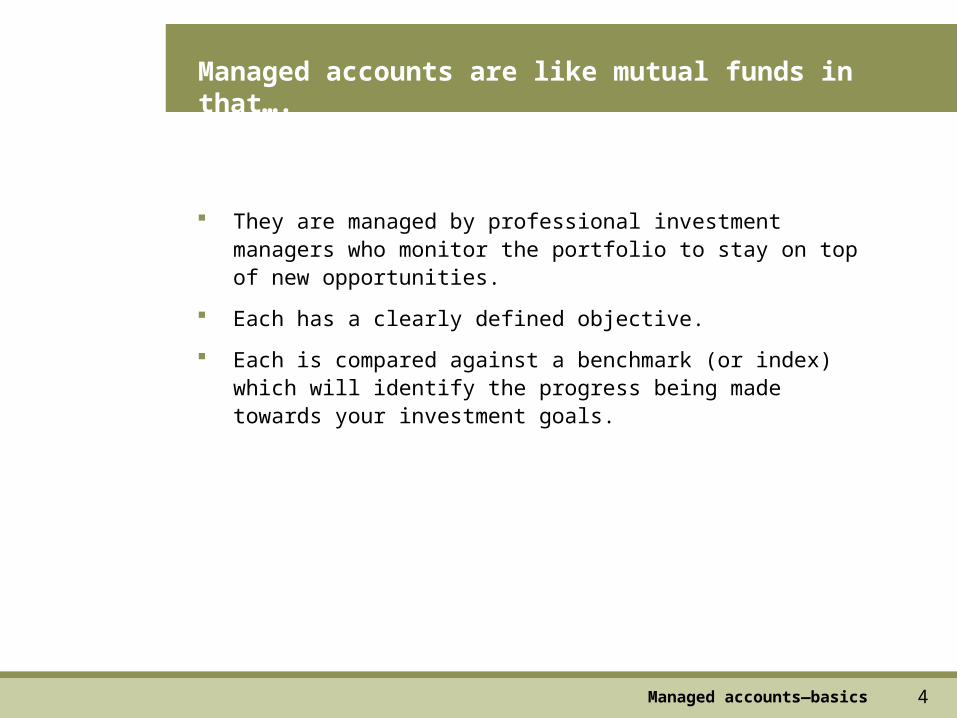
Managed accounts are like mutual funds in that….
They are managed by professional investment managers who monitor the portfolio to stay on top of new opportunities.
Each has a clearly defined objective.
Each is compared against a benchmark (or index) which will identify the progress being made towards your investment goals.
Managed accounts—basics
55
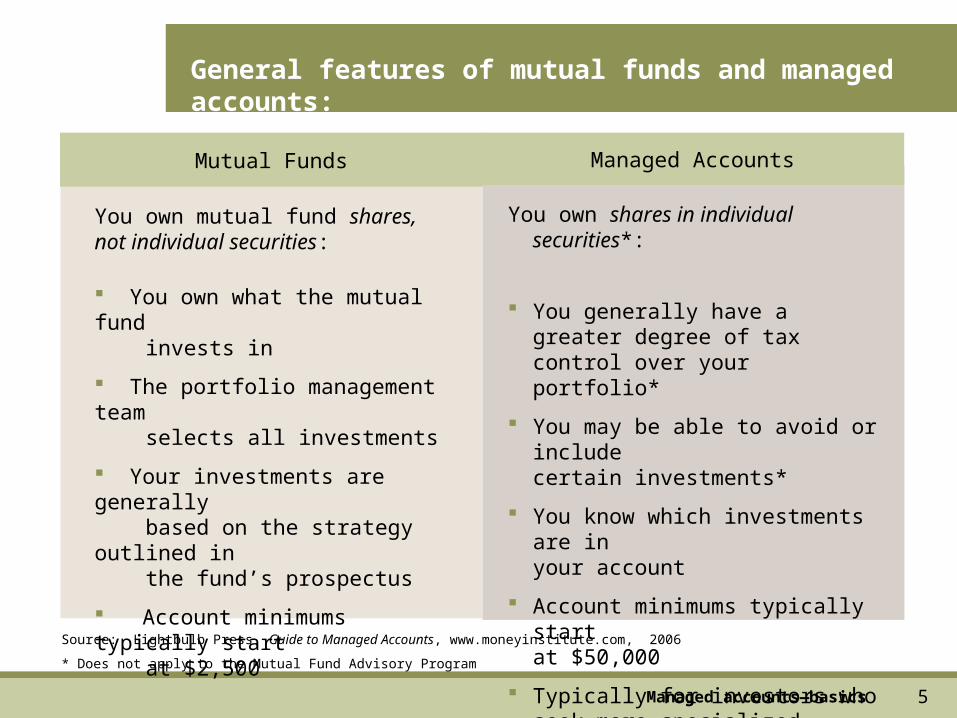
General features of mutual funds and managed accounts:
Source: Lightbulb Press, Guide to Managed Accounts, www.moneyinstitute.com, 2006
* Does not apply to the Mutual Fund Advisory Program
Mutual Funds Managed Accounts
You own mutual fund shares, not individual securities:
You own what the mutual fund invests in
The portfolio management team selects all investments
Your investments are generally based on the strategy outlined in the fund’s prospectus
Account minimums typically start at $2,500
You own shares in individual securities*:
You generally have a greater degree of tax control over your portfolio*
You may be able to avoid or include certain investments*
You know which investments are in your account
Account minimums typically start at $50,000
Typically for investors who seek more specialized portfolios and investment advice
Managed accounts—basics
66
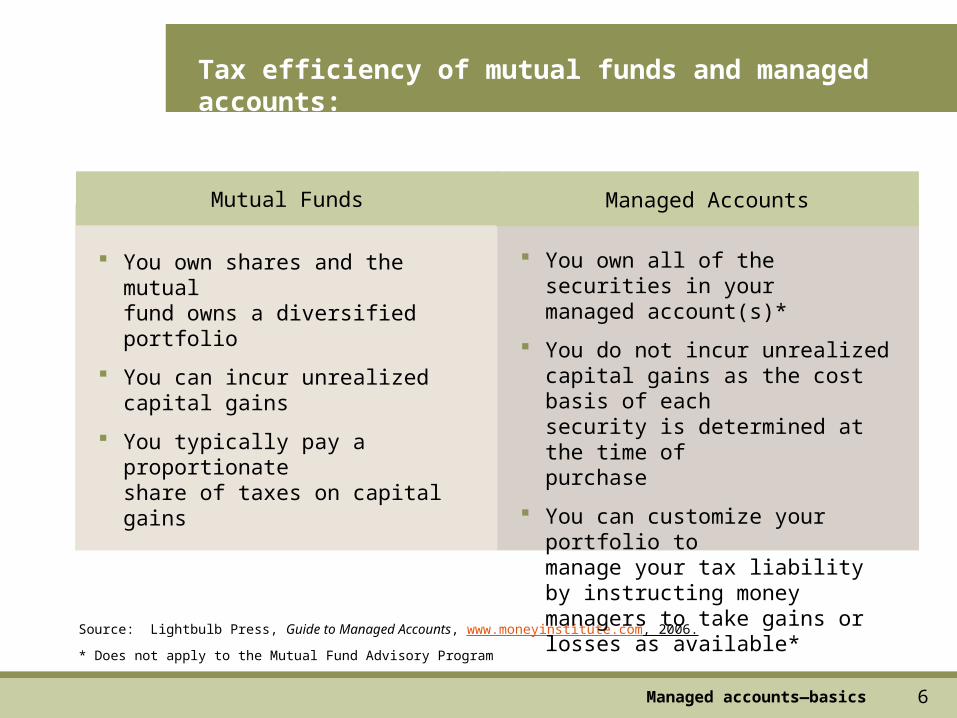
Tax efficiency of mutual funds and managed accounts:
Source: Lightbulb Press, Guide to Managed Accounts, www.moneyinstitute.com, 2006.
* Does not apply to the Mutual Fund Advisory Program
Mutual Funds Managed Accounts
You own shares and the mutual fund owns a diversified portfolio
You can incur unrealized capital gains
You typically pay a proportionate share of taxes on capital gains
You own all of the securities in your managed account(s)*
You do not incur unrealized capital gains as the cost basis of each security is determined at the time of purchase
You can customize your portfolio to manage your tax liability by instructing money managers to take gains or losses as available*
Managed accounts—basics
77
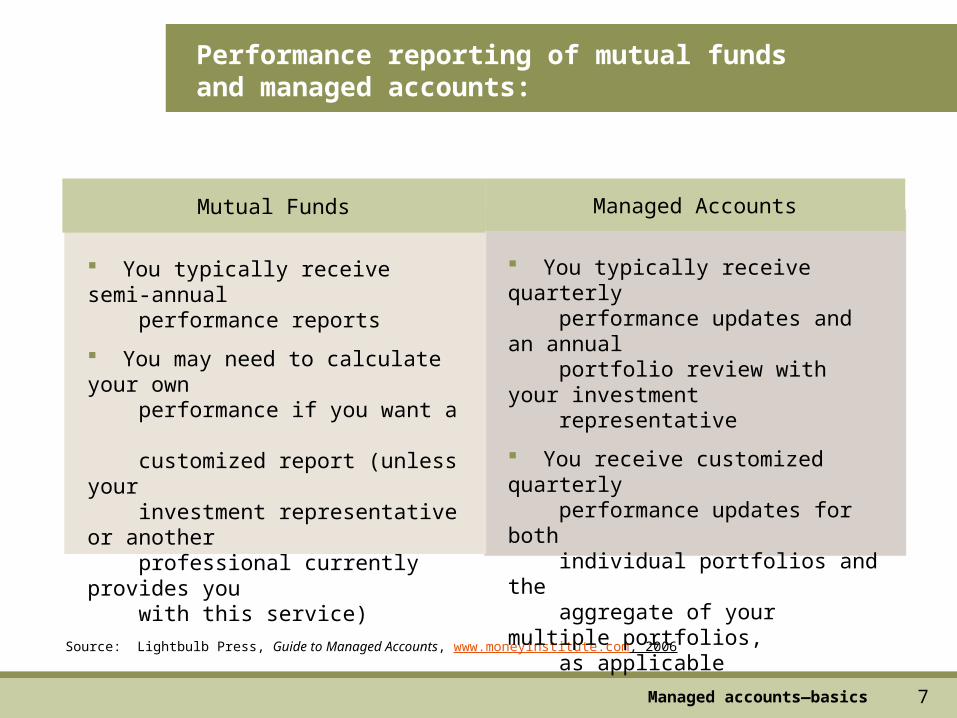
Performance reporting of mutual fundsand managed accounts:
Source: Lightbulb Press, Guide to Managed Accounts, www.moneyinstitute.com, 2006
Mutual Funds Managed Accounts
You typically receive semi-annual performance reports
You may need to calculate your own performance if you want a customized report (unless your investment representative or another
professional currently provides you with this service)
You typically receive quarterly performance updates and an annual portfolio review with your investment representative
You receive customized quarterly performance updates for both individual portfolios and the aggregate of your multiple portfolios, as applicable
Managed accounts—basics
88
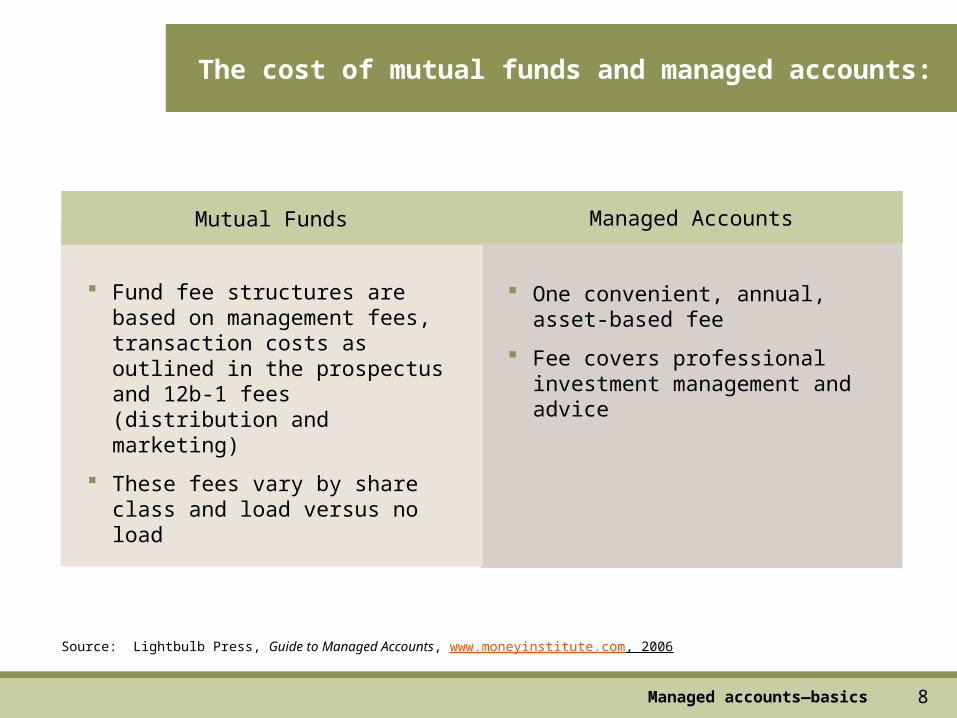
The cost of mutual funds and managed accounts:
Source: Lightbulb Press, Guide to Managed Accounts, www.moneyinstitute.com, 2006
Mutual Funds Managed Accounts
Fund fee structures are based on management fees, transaction costs as outlined in the prospectus and 12b-1 fees (distribution and marketing)
These fees vary by share class and load versus no load
One convenient, annual, asset-based fee
Fee covers professional investment management and advice
Managed accounts—basics
99
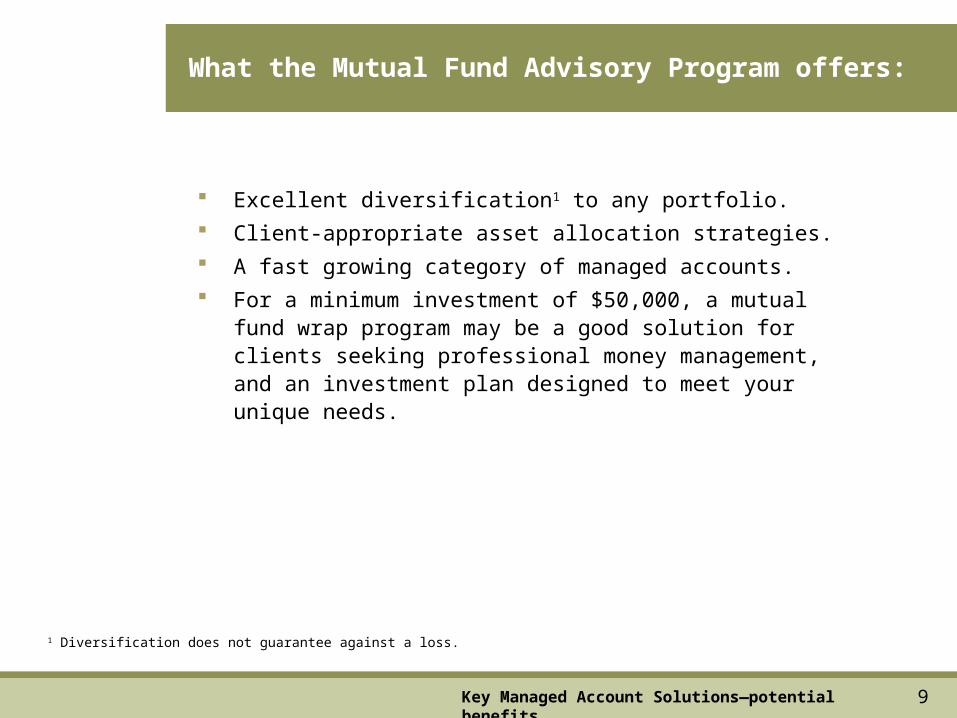
Excellent diversification1 to any portfolio.
Client-appropriate asset allocation strategies.
A fast growing category of managed accounts.
For a minimum investment of $50,000, a mutual fund wrap program may be a good solution for clients seeking professional money management, and an investment plan designed to meet your unique needs.
1 Diversification does not guarantee against a loss.
What the Mutual Fund Advisory Program offers:
Key Managed Account Solutions—potential benefits

1010
How can managed accounts benefit you?
Managed Account Solutions offers you:
An Individual Investment Plan
Access to professional money managers
A greater degree of tax control over your portfolio
Ongoing portfolio monitoring and rebalancing
A convenient, asset-based, annual fee
Key Managed Account Solutions—potential benefits
1111
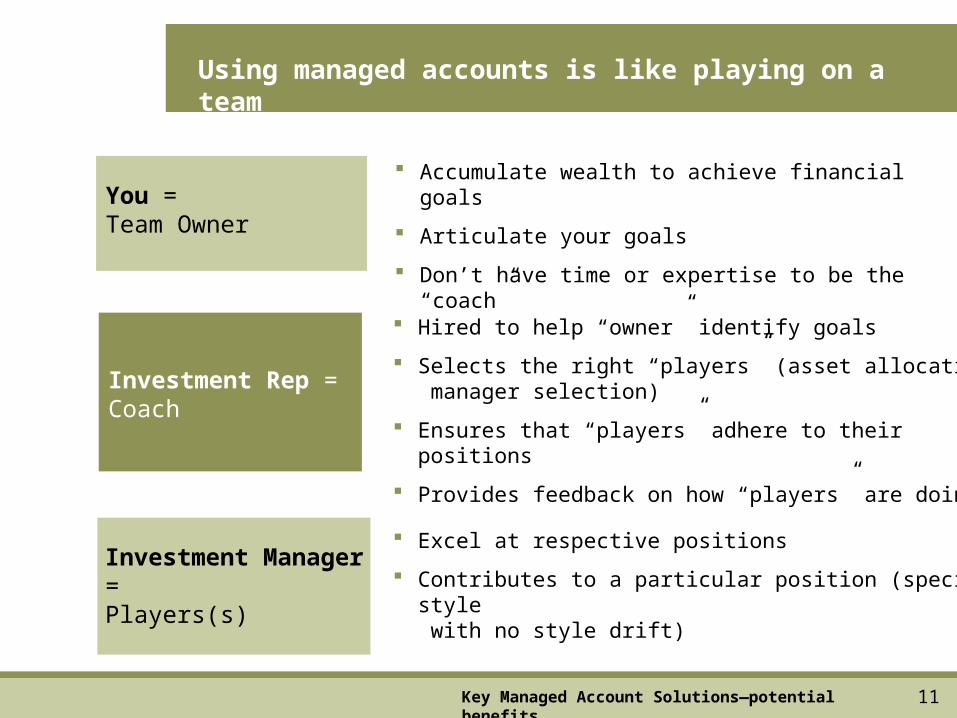
Using managed accounts is like playing on a team
You = Team Owner
Investment Rep =Coach
Investment Manager =Players(s)
Accumulate wealth to achieve financial goals
Articulate your goals
Don’t have time or expertise to be the “coach”
Hired to help “owner” identify goals
Selects the right “players” (asset allocation & manager selection)
Ensures that “players” adhere to their positions
Provides feedback on how “players” are doing
Excel at respective positions
Contributes to a particular position (specific style with no style drift)
Key Managed Account Solutions—potential benefits
1212
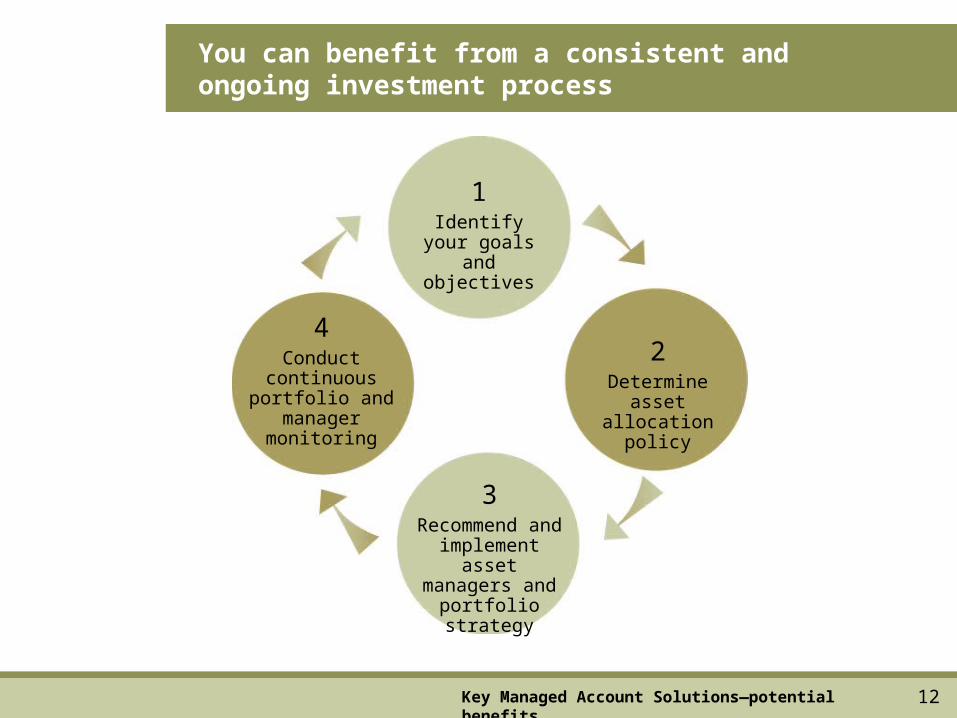
1Identify your
goals and objectives
3Recommend and implement asset managers and
portfolio strategy
2Determine asset allocation policy
4Conduct
continuous portfolio and
manager monitoring
You can benefit from a consistent and ongoing investment process
Key Managed Account Solutions—potential benefits
1313
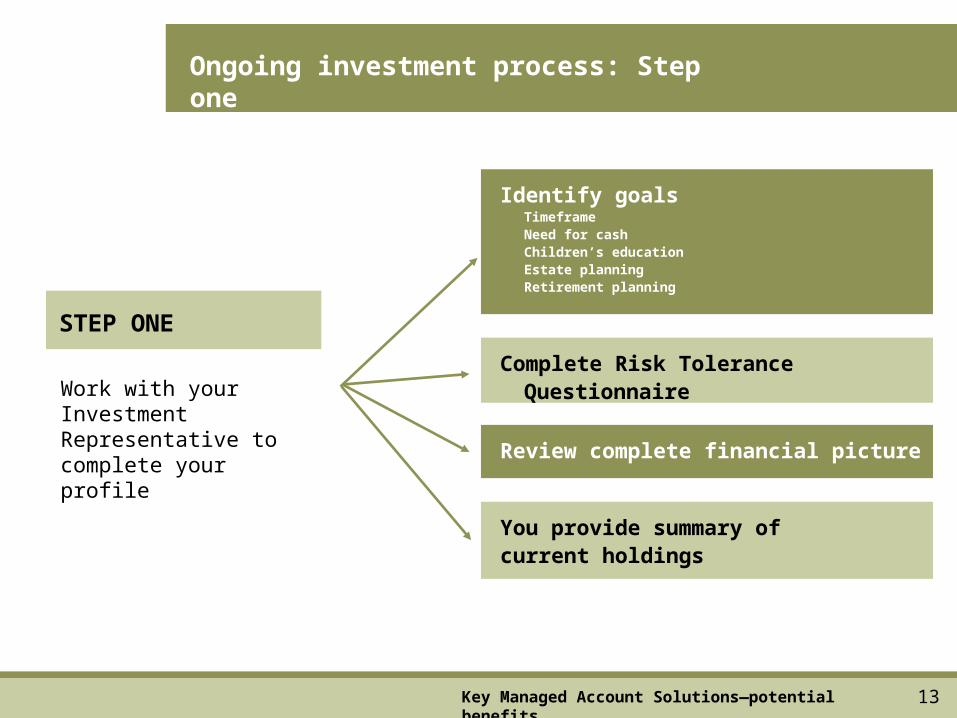
Ongoing investment process: Step one
Identify goalsTimeframeNeed for cashChildren’s educationEstate planningRetirement planning
Complete Risk Tolerance Questionnaire
Review complete financial picture
You provide summary of current holdings
Work with your Investment Representative to complete your profile
STEP ONE
Key Managed Account Solutions—potential benefits

1414
Identify and review gaps and style drift to:
Ongoing investment process: Step two
Current holdings assessmentand
risk tolerance review
Determine asset allocation policy
Select managers
Your Investment Representative determines your asset allocation policy
STEP TWO
Key Managed Account Solutions—potential benefits

1515
Follow a specific style
Monitor, evaluate, and sell investments
Analyze portfolioholdings and keep your investments on track
Ongoing investment process: Step three
Review and implement your plan
Review personalized strategy designed to help meet your unique needs
Agree upon plan
Implement your plan
Managers are selected and your investment plan is implementedManagers selected to:
STEP THREE
Key Managed Account Solutions—potential benefits
1616
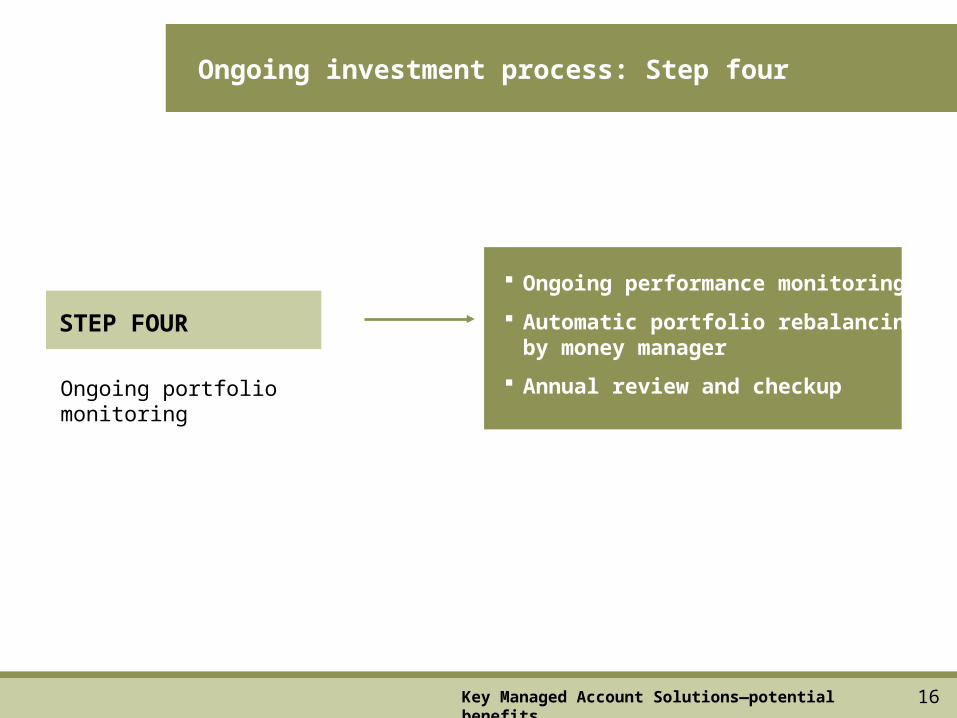
Ongoing investment process: Step four
Ongoing portfolio monitoring
STEP FOUR
Ongoing performance monitoring
Automatic portfolio rebalancing by money manager
Annual review and checkup
Key Managed Account Solutions—potential benefits

1717
Source: Ibbotson Associates: This image illustrates the effect of different growth rates on a static (unbalanced) portfolio over a 20-year period. In 1984, the target asset mix began with a 50% allocation to stocks and a 50% allocation to bonds. Past performance does not guarantee future results.
Stock allocation
Bond allocation
Po
rtfo
lio
we
igh
tin
gs
Target asset mix: 50% stocks/50% bonds
1984–2004
Why rebalancing matters
50%
72%
28%
75%
25%
58%
42%
55%
45%50%
0%
20%
40%
60%
80%
100%
1984 1989 1994 1999 2004
Because asset classes grow at different rates of return, it is necessary to periodically rebalance a portfolio to maintain a target asset mix.
Key Managed Account Solutions—potential benefits
1818
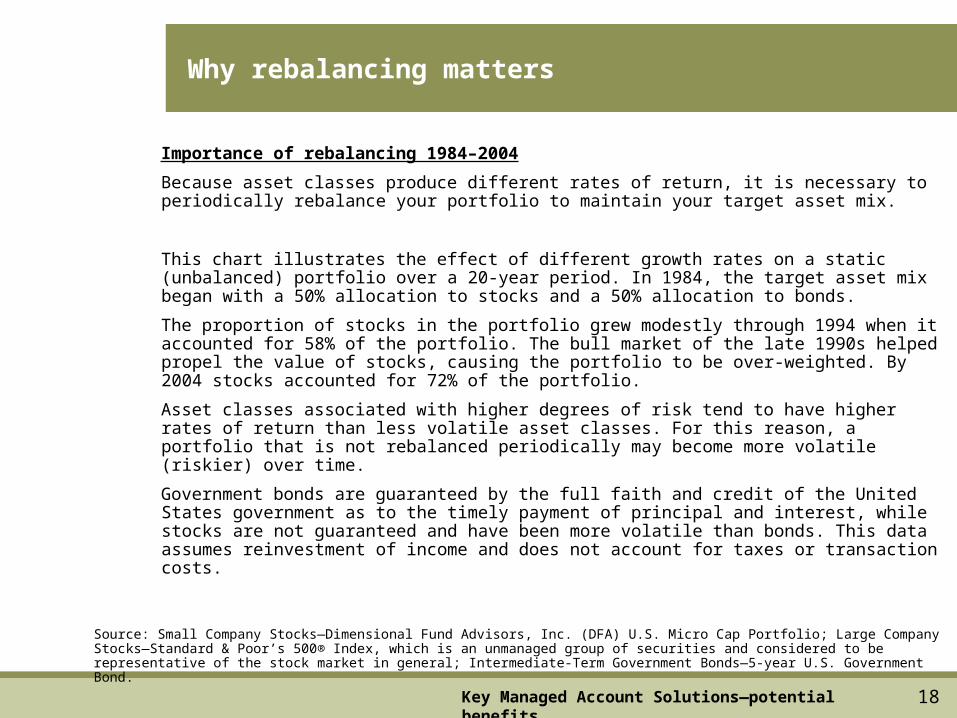
Importance of rebalancing 1984–2004
Because asset classes produce different rates of return, it is necessary to periodically rebalance your portfolio to maintain your target asset mix.
This chart illustrates the effect of different growth rates on a static (unbalanced) portfolio over a 20-year period. In 1984, the target asset mix began with a 50% allocation to stocks and a 50% allocation to bonds.
The proportion of stocks in the portfolio grew modestly through 1994 when it accounted for 58% of the portfolio. The bull market of the late 1990s helped propel the value of stocks, causing the portfolio to be over-weighted. By 2004 stocks accounted for 72% of the portfolio.
Asset classes associated with higher degrees of risk tend to have higher rates of return than less volatile asset classes. For this reason, a portfolio that is not rebalanced periodically may become more volatile (riskier) over time.
Government bonds are guaranteed by the full faith and credit of the United States government as to the timely payment of principal and interest, while stocks are not guaranteed and have been more volatile than bonds. This data assumes reinvestment of income and does not account for taxes or transaction costs.
Source: Small Company Stocks—Dimensional Fund Advisors, Inc. (DFA) U.S. Micro Cap Portfolio; Large Company Stocks—Standard & Poor’s 500® Index, which is an unmanaged group of securities and considered to be representative of the stock market in general; Intermediate-Term Government Bonds—5-year U.S. Government Bond.
Why rebalancing matters
Key Managed Account Solutions—potential benefits
1919
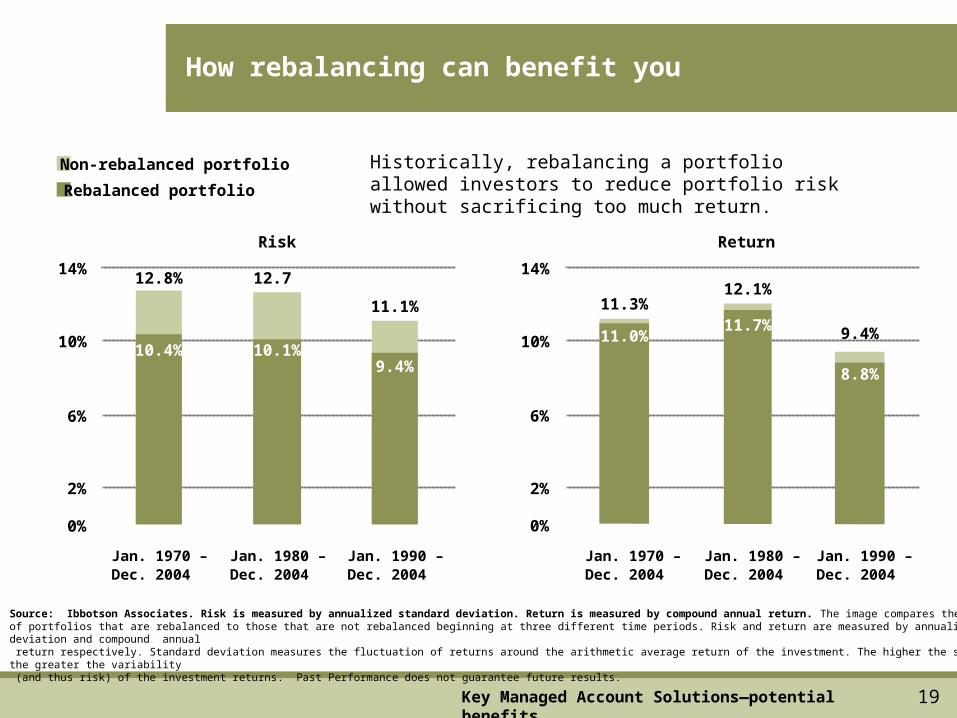
Non-rebalanced portfolio
Rebalanced portfolio
Jan. 1970 –Dec. 2004
Jan. 1980 –Dec. 2004
Jan. 1990 –Dec. 2004
How rebalancing can benefit you
Risk Return
Jan. 1970 –Dec. 2004
Jan. 1980 –Dec. 2004
Jan. 1990 –Dec. 2004
Source: Ibbotson Associates. Risk is measured by annualized standard deviation. Return is measured by compound annual return. The image compares the risk and return of portfolios that are rebalanced to those that are not rebalanced beginning at three different time periods. Risk and return are measured by annualized standard deviation and compound annual return respectively. Standard deviation measures the fluctuation of returns around the arithmetic average return of the investment. The higher the standard deviation, the greater the variability (and thus risk) of the investment returns. Past Performance does not guarantee future results.
11.3%12.1%
9.4%11.0%11.7%
8.8%
0%
2%
4%
6%
8%
10%
12%
14%12.8% 12.7%
11.1%
9.4%10.4% 10.1%
0%
2%
4%
6%
8%
10%
12%
14%
Historically, rebalancing a portfolio allowed investors to reduce portfolio risk without sacrificing too much return.
Key Managed Account Solutions—potential benefits

2020
Rebalancing versus not rebalancing
Historically, rebalancing a portfolio has allowed investors to reduce portfolio risk without sacrificing too much return.
Over time, your portfolio asset allocation policy can get disturbed by market ups and downs. For example, stocks tend to outperform bonds in the long run. Since stocks are riskier than bonds, a greater allocation to stocks can also increase the portfolio risk. Rebalancing is an essential account management tool that helps to keep the portfolio within the risk tolerance level that is comfortable for your asset allocation strategy.
This chart compares the risk and return of portfolios that are rebalanced to those that are not rebalanced beginning at three different time periods. Risk and return are measured by annualized standard deviation and compound annual return, respectively. Standard deviation measures the fluctuation of returns around the arithmetic average return of the investment. The higher the standard deviation, the greater the variability (and thus risk) of the investment returns.
The first set of portfolios begins in January 1970 and ends in December 2004, followed by the second set that begins in January 1980 and ends in December 2004, and finally the third set that begins in January 1990 and ends in December 2004. Each portfolio consisted of 60% stocks, 20% bonds, and 20% cash at the portfolio’s beginning date. Stocks consist of 33.3% large-cap, 33.3% small-cap, and 33.3% international stocks at each portfolio’s beginning date. The bond allocation consists entirely of 5-year U.S. government bonds, while the cash allocation consists of 30-day U.S. Treasury bills. The portfolios have been rebalanced semi-annually.
In all three portfolios, the rebalanced portfolio had a lower risk than the non-rebalanced portfolio. For instance, the rebalanced portfolio beginning January 1980 had a risk of 10.1%, which is only 79.5% of the 12.7% risk of the non-rebalanced portfolio. Although rebalancing was able to reduce the portfolio risk, the tradeoff was a slight reduction in returns. For example, the rebalanced portfolio beginning January 1980 had a return of 11.7%, which is 96.7% of the 12.1% return of the non-rebalanced portfolio.
Government bonds and Treasury bills are guaranteed by the full faith and credit of the United States government as to the timely payment of principal and interest, while stocks are not guaranteed and have been more volatile than bonds. International investments involve special risks such as fluctuations in currency, foreign taxation, economic and political risks, and differences in accounting and financial standards. This data assumes reinvestment of income and does not account for taxes or transaction costs.
How rebalancing can benefit you
Key Managed Account Solutions—potential benefits
Source: Large Company Stocks—Standard & Poor’s 500® Index, which is an unmanaged group of securities and considered to be representative of the stock market in general; Small Company Stocks—represented by the fifth capitalization quintile of stocks on the NYSE for 1926–1981 and the performance of the Dimensional Fund Advisors, Inc. (DFA) U.S. Micro Cap Portfolio thereafter; International Stocks—Morgan Stanley Capital International Europe, Australasia, and Far East (EAFE®) Index; Government Bonds—5-year U.S. Government Bonds; Cash—30-day U.S. Treasury Bill.

2121
Managed Account Solutions may be the solution to help you reach your goals
Do you have one or more of these attributes?
You have $50,000 or more to invest and or/retirement assets ready to roll-over
ASSETS
You are looking for a professional investment manager to help you reach your financial goals
EXPERIENCE
You are seeking a greater degree of tax control
TAX-EFFICIENCY
You recently inherited money, sold business, etc.
FINANCIAL EVENTS
Is Managed Account Solutions — right for you?

2222
The annual fee and what it covers
The convenient, annual fee covers:
Consultations with your investment representative
Development of your individual investment plan
Ongoing portfolio monitoring
Custody services
Commission-free transactions (thru investment managers)
Is Managed Account Solutions — right for you?

2323
Which program is right for you?
Mutual Fund Advisory Program ($50,000 minimum investment)
A comprehensive program that gives you access to a wide range of carefully selected mutual funds
Access to actively managed investment solutions for a low minimum ($50,000)
An objective, unbiased investment process
User-friendly quarterly performance reports
Ongoing portfolio monitoring
Automatic rebalancing by money manager(s)
What it is Key benefits
Is Managed Account Solutions — right for you?
2424
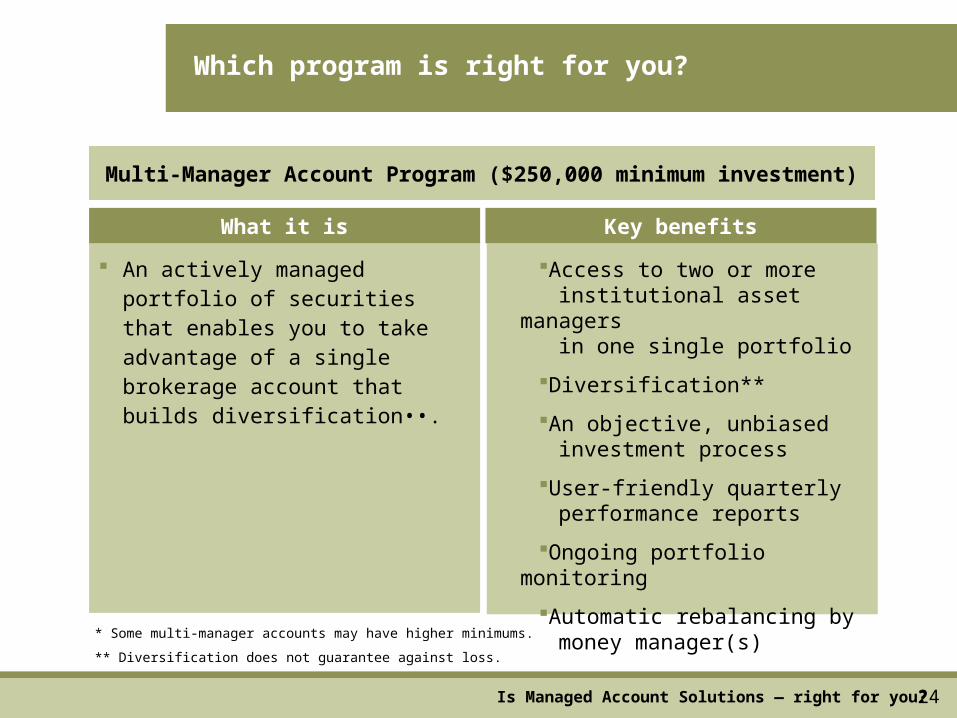
* Some multi-manager accounts may have higher minimums.
** Diversification does not guarantee against loss.
Multi-Manager Account Program ($250,000 minimum investment)
An actively managed portfolio of securities that enables you to take advantage of a single brokerage account that builds diversification••.
Access to two or more institutional asset managers in one single portfolio
Diversification**
An objective, unbiased investment process
User-friendly quarterly performance reports
Ongoing portfolio monitoring
Automatic rebalancing by money manager(s)
What it is Key benefits
Is Managed Account Solutions — right for you?
Which program is right for you?

2525
Separate Account Program (typically investors with $500,000 or more)
A program that gives you the ability to place your assets in discretionary separate accounts managed by professional money managers and enables you to take advantage of a customized approach to investment planning
Access to professional asset management
An objective, unbiased investment process
Customization
Tax efficiency
User-friendly quarterly performance reports
Ongoing portfolio monitoring
Automatic rebalancing by money manager(s)
What it is Key benefits
Is Managed Account Solutions — right for you?
Which program is right for you?

2626
How to put Managed Account Solutions work for you
Schedule a meeting with your investment representative so he/she can help you create an individual investment plan.
Take advantage of an investment plan designed to help you reach your unique investment goals
Is Managed Account Solutions — right for you?
2727
Thank You!
<Investment Representative Name>
<Firm Name>
<Phone>
<Email Address>
National Financial’s Managed Account Solutions service is provided by Envestnet Asset Management, Inc. (“Envestnet”), a third-party provider of investment management services. National Financial does not provide investment advisory services in conjunction with the Managed Account Solutions service. Envestnet is not a corporate affiliate of National Financial.
425725.3 National Financial Services LLC, Member, NYSE, SIPC


