By: Ryan Abrams Investment Analyst AlphaMetrix Alternative Investment Advisors, LLC Ranjan Bhaduri, PhD, CFA, CAIA Managing Director – Head of Research AlphaMetrix Alternative Investment Advisors, LLC Elizabeth Flores, CAIA Associate Director – Interest Rate Products CME Group Lintner Revisited A Quantitative Analysis of Managed Futures in an Institutional Portfolio To contact CME Group with questions or comments about Managed Futures click here
Transcript
By: Ryan Abrams Investment Analyst AlphaMetrix Alternative Investment Advisors, LLC Ranjan Bhaduri, PhD, CFA, CAIA Managing Director – Head of Research AlphaMetrix Alternative Investment Advisors, LLC Elizabeth Flores, CAIA Associate Director – Interest Rate Products CME Group
Lintner RevisitedA Quantitative Analysis of Managed Futures in an Institutional Portfolio
To contact CME Group with questions or comments about Managed Futures
ABstRACt:Managed futures comprise a wide array of liquid, transparent alpha strategies which
offer institutional investors a number of benefits. these include cash efficiency, intuitive
risk management, and a proclivity toward strong performance in market environments
that tend to be difficult for other investments. this paper revisits Dr. John Lintner’s
classic 1983 paper, “the Potential Role of Managed Commodity-Financial Futures
Accounts (and/or Funds) in Portfolios of stocks and Bonds,” which explored the
substantial diversification benefits that accrue when managed futures are added to
institutional portfolios. As Dr. Lintner did, it analyzes the portfolio benefits that managed
futures offer through the mean-variance framework, but it draws on more complete
techniques such as the analysis of omega functions to assess portfolio contribution. the
paper also conducts a comparative qualitative and quantitative analysis of the risk and
return opportunities of managed futures relative to other investments, and includes a
discussion as to why managed futures strategies tend to perform well in conditions that
are not conducive to other investment strategies. It provides an overview of the diversity
of investment styles within managed futures, dispelling the commonly held notion
that all CtAs employ trend following strategies. Finally, it highlights the opportunities
the space offers to institutional investors seeking to create well-diversified, liquid,
transparent, alpha portfolios.
Dedicated to the late Dr. John Lintner
A Quantitative Analysis of Managed Futures in an Institutional Portfolio
tABLE OF CONtENts
Introduction 2
Revisiting Lintner 3
Managed Futures – some Basic 4 Properties
Growth of Futures Markets and 6 Managed Futures
Manager style and selection 7
Managed Futures Risk, Return, 11 and the Potential for Enhanced Diversification
Risk and Return: 12 Omega – A Better Approach
Hidden Risk: the Importance 15 of Liquidity, transparency and Custody
the Lack of Correlation and Potential 17 for Portfolio Diversification
Managed Futures and Performance 22 during Financial Market Dislocations
Benefits to Institutional Investors 30
Conclusion 32
Conclusion in Context of Lintner 34
References 35
cmegroup.com
2
INtRODuCtION
Managed futures comprise a diverse collection of active hedge fund trading strategies which specialize in liquid, transparent, exchange-traded futures markets and deep foreign exchange markets. Some of the approaches taken by managed futures managers exploit the sustained capital flows across asset classes that typically take place as markets move back into equilibrium after prolonged imbalances. Others thrive on the volatility and choppy price action which tend to accompany these flows. Others do not exhibit sensitivity to highly volatile market environments and appear to generate returns independent of the prevailing economic or volatility regime. This explains in part why managed futures often outperform traditional long-only investments and most alternative investment and hedge fund strategies during market dislocations and macro events.
This paper endeavors to re-introduce managed futures as a liquid, transparent hedge fund sub-style which actively trades a diversified mix of global futures markets and attempts to dispel some of the more common misconceptions many institutional investors hold regarding the space. We discuss the likely effects and implications of the proliferation of futures markets and managed futures assets under management on the performance and capacity of trading managers. We also address trading manager selection and style, and differentiate among the myriad unique trading strategies which currently encompass managed futures. An assessment of the performance and risk characteristics of managed futures relative to traditional investments and other alternatives is conducted, including a critique of the mean-variance framework in which many practitioners and investment professionals analyze performance and risk. The Omega performance measure is offered as an alternative to traditional mean-variance ratios since it accounts for the non-Gaussian nature of the distributions typically encountered in finance; the Omega function was invented by mathematicians in 2002, and thus was not available to Lintner.
This paper also gives a brief treatment of risk management and the importance of liquidity. From there, we analyze historical correlations among managed futures, traditional investments, and other alternative investment strategies, demonstrating the diversification benefits that may be reaped from the introduction of managed futures’ uncorrelated variance into traditional portfolios and blended portfolios of traditional and alternative investments. We explore the proclivity of managed futures strategies toward strong performance during market dislocations due to their tendency to exploit the massive flows of capital to or from quality that tend to coincide with these events. Although managed futures have often produced outstanding returns during dislocation and crisis events, it must be emphasized that managed futures are not and should not be viewed as a portfolio hedge, but rather as a source of liquid transparent return that is typically not correlated to traditional or other alternative investments.
Finally, we conclude with a discussion of some of the unique benefits offered to institutional investors, namely, the ability to use notional funding to efficiently fund exposure to managed futures, diminish the risks associated with asset-liability mismatches, and capitalize on favorable tax treatment. We also close the loop in relation to how Lintner’s insights on the role of managed futures in an institutional portfolio have held up after twenty-five years.
3
A Quantitative Analysis of Managed Futures in an Institutional Portfolio
REvIsItING LINtNER
The late Dr. John Lintner (1916 – 1983), a Harvard University Professor, had an illustrious and prolific career, including recognition as one of the co-creators of the Capital Asset Pricing Model (CAPM). Lintner also published a classic paper entitled “The Potential Role of Managed Commodity-Financial Futures Accounts (and/or Funds) in Portfolios of Stocks and Bonds,” which he presented in May 1983 at the Annual Conference of the Financial Analysts Federation in Toronto. Lintner found the risk-adjusted return of a portfolio of managed futures to be higher than that of a traditional portfolio consisting of stocks and bonds. The Lintner study also found that portfolios of stocks and/or bonds combined with managed futures showed substantially less risk at every possible level of expected return than portfolios of stocks and/or bonds alone. The following passage from Lintner’s scholarly work furnishes good insight on his findings:
“Indeed, the improvements from holding efficiently selected portfolios of managed accounts or funds are so large – and the correlations between the returns on the futures portfolios and those on the stock and bond portfolios are surprisingly low (sometimes even negative) – that the return/risk trade-offs provided by augmented portfolios consisting partly of funds invested with appropriate groups of futures managers (or funds) combined with funds invested in portfolios of stocks alone (or in mixed portfolios of stocks and bonds), clearly dominate the trade-offs available from portfolios of stocks alone (or from portfolios of stocks and bonds). Moreover, they do so by very considerable margins.
The combined portfolios of stocks (or stocks and bonds) after including judicious investments in appropriately selected sub-portfolios of investments in managed futures accounts (or funds) show substantially less risk at every possible level of expected return than portfolios of stock (or stocks and bonds) alone. This is the essence of the “potential role” of managed futures accounts (or funds) as a supplement to stock and bond portfolios suggested in the title of this paper.
Finally, all the above conclusions continue to hold when returns are measured in real as well as in nominal terms, and also when returns are adjusted for the risk-free rate on Treasury bills.” [Lintner, pages 105-106]
Sadly, Lintner died shortly after presenting his treatise on the role of managed futures in institutional portfolios.
The objectives of this paper are not at all modest, namely, to furnish a modern-day Lintner paper, and also to dispel some common myths regarding managed futures. While Linter’s study has been applauded by scholars and practitioners who have read it, there still seems to be a gap and disconnect between many institutional investors and the managed futures space. Is this because through the passage of time the kernel of Linter’s findings is no longer true? Or have some institutional investors simply not performed their fiduciary duty in a completely satisfactory manner?
Updating the Linter paper will help to supply the answer to this question. In order to do this properly, it is best to lay the framework of what managed futures are in terms of the current landscape before exploring the impact of adding them to traditional portfolios.
cmegroup.com
4
MANAGED FutuREs – sOME BAsIC PROPERtIEs
A discussion of managed futures performance, particularly during periods of market dislocation, may be more illuminating if preceded by a brief discussion of what managed futures are and are not. As previously mentioned, managed futures encompass a variety of active trading strategies which specialize in liquid, transparent, exchange-traded futures, options, and foreign exchange, and may be thought of as a liquid, transparent hedge fund strategy. Like long/short equity and equity market neutral hedge fund strategies, managed futures strategies may take long and short positions in the markets they trade, are available only to qualified investors, and may employ leverage. An important difference, however, is that equity hedge fund leverage requires borrowing funds at a rate above LIBOR, whereas managed futures investing allows for the efficient use of cash made possible by the low margin requirements of futures contracts. Rather than allowing cash not being used for margin to collect interest at the investor’s futures commission merchant (FCM), the investor can deploy it to gain a higher notional exposure when investing using a managed account. Consequently, the investor is not paying interest, since they did not need to borrow money to get the extra exposure. The following example helps to highlight this important point.
Example: An institutional investor has $50 million (USD), and wishes to get $50 million exposure in a managed futures strategy that allows for a funding factor of two. The investor then only needs to invest $25 million to the managed futures strategy and may put the other $25 million in Treasury bills to receive interest.
Another critical difference between futures and equities is that there are no barriers to short selling in futures. Since two parties agree to enter into a contract, there is no need to borrow shares, pay dividends, or incur other costs associated with entering into equity short sales. Thus, in that sense, it is easier to invoke a long-short strategy via futures than it is using equities.
Managed futures traders are commonly referred to as “Commodity Trading Advisors” or “CTAs,” a designation which refers to a manager’s registration status with the Commodity Futures Trading Commission and National Futures Association. CTAs may trade financial and foreign exchange futures, so the Commodity Trading Advisor registration is somewhat of a misnomer since CTAs are not restricted to trading only commodity futures. The highly diversified and global nature of the markets included in most managed futures programs makes the selection of a passive long-only index for analysis of value added through active management extremely difficult since many CTAs trade portfolios of futures contracts which span across all asset classes. The name Commodity Trading Advisor also results in the common mistake of using passive long-only commodity indices, such as the Goldman Sachs Commodity Index (GSCI), DJ AIG Commodity Index (DJ AIG), and Rogers International Commodity Index (RICI) as performance benchmarks. These indices are not appropriate because they include only a small fraction of the futures markets most CTAs trade, and do not account for active management or the ability to take short as well as long positions, all of which should result in lack of correlation over time.
Active management and the ability to take long and short positions are key features that differentiate managed futures strategies not only from passive long-only commodity indices, but from traditional investments as well. Although most CTAs trade equity index, fixed income, and foreign exchange futures, their returns should be uncorrelated and unrelated to the returns of these asset classes because most managers are not simply taking on systematic exposure to an asset class, or beta, but are attempting to add alpha through active management and the freedom to enter short or spread positions, which can result in totally different return profiles than the long-only passive indices.
5
A Quantitative Analysis of Managed Futures in an Institutional Portfolio
Not all managed futures managers are trend followers. Many of the earliest and most successful futures traders employed trend following strategies, as do some of the largest CTAs today, which might help to explain the prevalence of this overly casual generalization. Trend following may be the most common managed futures strategy, but it certainly is not the only one. The myriad other approaches to futures trading offer institutional investors access to a variety of sources of return, including trend following, which are uncorrelated to traditional and alternative investments, and oftentimes, to one another. These include discretionary fundamental or global macro managers who express their views using futures, short-term traders whose strategies vary tremendously, chartists who scan the markets for patterns, and contrarian traders. The wide availability of clean data has also converted academics, researchers, and scientists to trading. These individuals apply advanced quantitative techniques to the markets that go beyond basic rules-based systems to forecast the direction in price or changes in volatility. Managed futures programs that rely on strategies other than trend following are becoming a larger and more important part of the space.
Another common misconception about managed futures strategies is that they are a zero sum game. This would be the case if CTAs were trading exclusively against other CTAs, but academics and practitioners have demonstrated that some futures markets participants are willing to hedge positions, or buy or sell forward even if they expect spot prices to rise or fall in their favor (CISDM 2006, 4).
The existence of these risk premia is consistent with futures prices’ role as biased predictors of expected spot prices. The futures price equals the discounted present value of the expected spot price plus a risk premium, which can be positive or negative depending on the skewness or bias of distribution of expected spot prices. If all financial assets, including futures contracts, have a zero net present value (NPV), then:
E(st) = Fe
where T represents the delivery date, E(ST) the expected spot price, F the futures price, and (μs-r) the risk premium, the sign of which depends on whether or not the risk premium is positive or negative. Equity index futures, for example, tend to be downward-biased predictors of expected spot prices since the natural risk in equities markets is to the downside. CTAs offer liquidity to hedgers in order to capture positive risk premia (CISDM 2006, 4). It is also important to account for transactions, storage, and other costs which may affect futures prices.
(μs-r)t
cmegroup.com
6
GROwtH OF FutuREs MARkEts AND MANAGED FutuREs
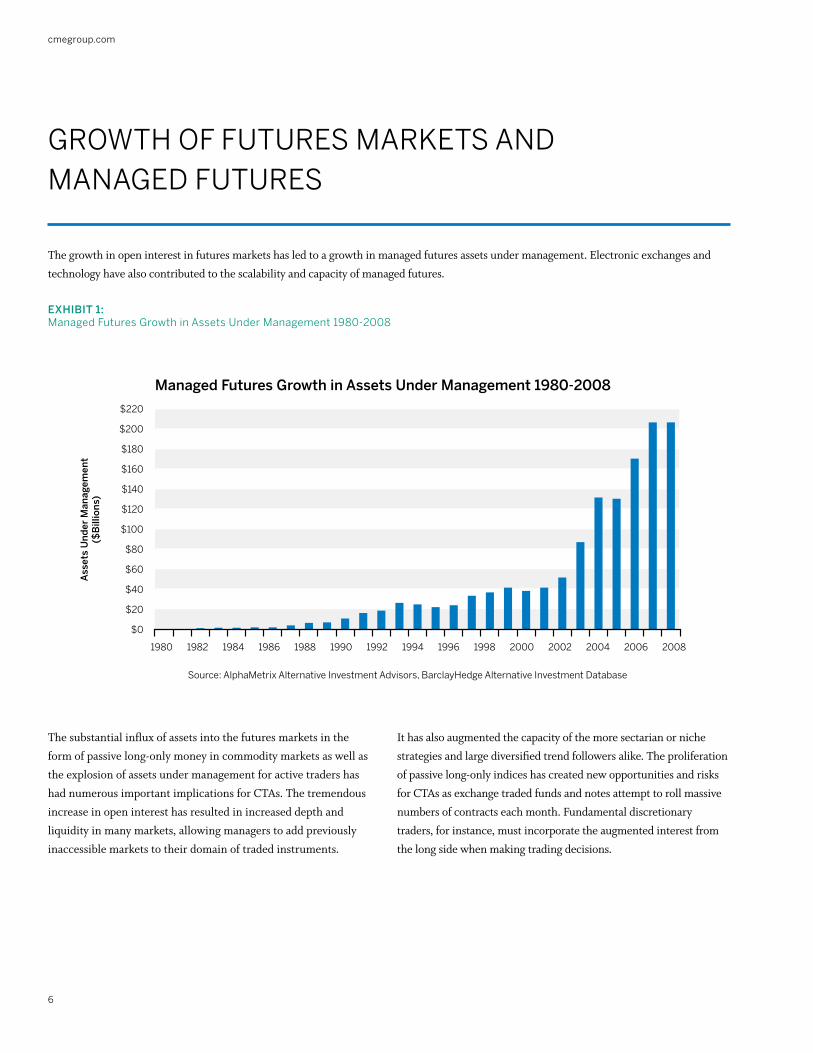
The growth in open interest in futures markets has led to a growth in managed futures assets under management. Electronic exchanges and technology have also contributed to the scalability and capacity of managed futures.
$220
$200
$180
$160
$140
$120
$100
$80
$60
$40
$20
$0
Source: AlphaMetrix Alternative Investment Advisors, BarclayHedge Alternative Investment Database
Managed Futures Growth in Assets Under Management 1980-2008
Ass
ets
Un
der
Man
agem
ent
($B
illio
ns)
The substantial influx of assets into the futures markets in the form of passive long-only money in commodity markets as well as the explosion of assets under management for active traders has had numerous important implications for CTAs. The tremendous increase in open interest has resulted in increased depth and liquidity in many markets, allowing managers to add previously inaccessible markets to their domain of traded instruments.
It has also augmented the capacity of the more sectarian or niche strategies and large diversified trend followers alike. The proliferation of passive long-only indices has created new opportunities and risks for CTAs as exchange traded funds and notes attempt to roll massive numbers of contracts each month. Fundamental discretionary traders, for instance, must incorporate the augmented interest from the long side when making trading decisions.
Exhibit 1:Managed Futures Growth in Assets under Management 1980-2008
A Quantitative Analysis of Managed Futures in an Institutional Portfolio
7
MANAGER styLE AND sELECtION
As previously mentioned, most observers associate managed futures closely with trend following strategies. The liquidity of futures contracts and copious amounts of available data, however, facilitate the application of numerous other variations of quantitative systematic trading strategies to these instruments and the time series associated with them. The influence of fundamental economic variables on commodities and futures markets provides opportunities for niche sector and market specialists to trade programs which generate returns that are often uncorrelated to most trend following programs.
A useful analogy for the different managed futures trading programs and styles, as well as for alternative investments in general, consists of thinking of the various trading styles or programs as radio receivers, each of which tunes into a different market frequency. Simply put, some strategies or styles tend to perform better or “tune in” to different market environments.
trend Following Trend following has demonstrated performance persistence over the more than 30 years since the first “turtle” strategies began trading, and roughly 70 percent of CTA strategies belong to this managed futures strategy sub-style. Trend following is dominated by momentum and/or breakout strategies, both of which attempt to capture large directional moves across diversified portfolios of markets. It also tends to be diversified across time frames, although some trend followers may be exclusively long-term (multiple months) or very short-term (days, hours, or minutes). Subtle differences in risk budgeting across markets, time horizons, and parameter selection may result in trend following programs which yield vastly different performance statistics and/or exhibit non-correlation to one another. Even within the trend-following space, there can be large differences between managers; these differences range from multi-billion dollar institutional quality firms employing an array of sophisticated and diversified techniques, to small shops trading with discretion.
Although certain voices in the investment management community have heralded the death of trend following many times over the years, there is a high probability of generating strong returns over sufficiently long rolling time periods, 36 months or more, for instance. The “long volatility” profile associated with most CTAs and trend followers in particular often means that returns are lumpy and a given manager’s performance will usually depend on a few large positive months. As such, it may take some time to draw from this right tail of the distribution of returns, and the likely interim outcome is flat lining or entering a drawdown as the program searches for opportunities in the markets it trades. Those who do not hold these investments over sufficiently long time horizons will typically experience frustration and disappointment since the events that drive performance, typically massive flights of capital to or from quality, only take place occasionally.
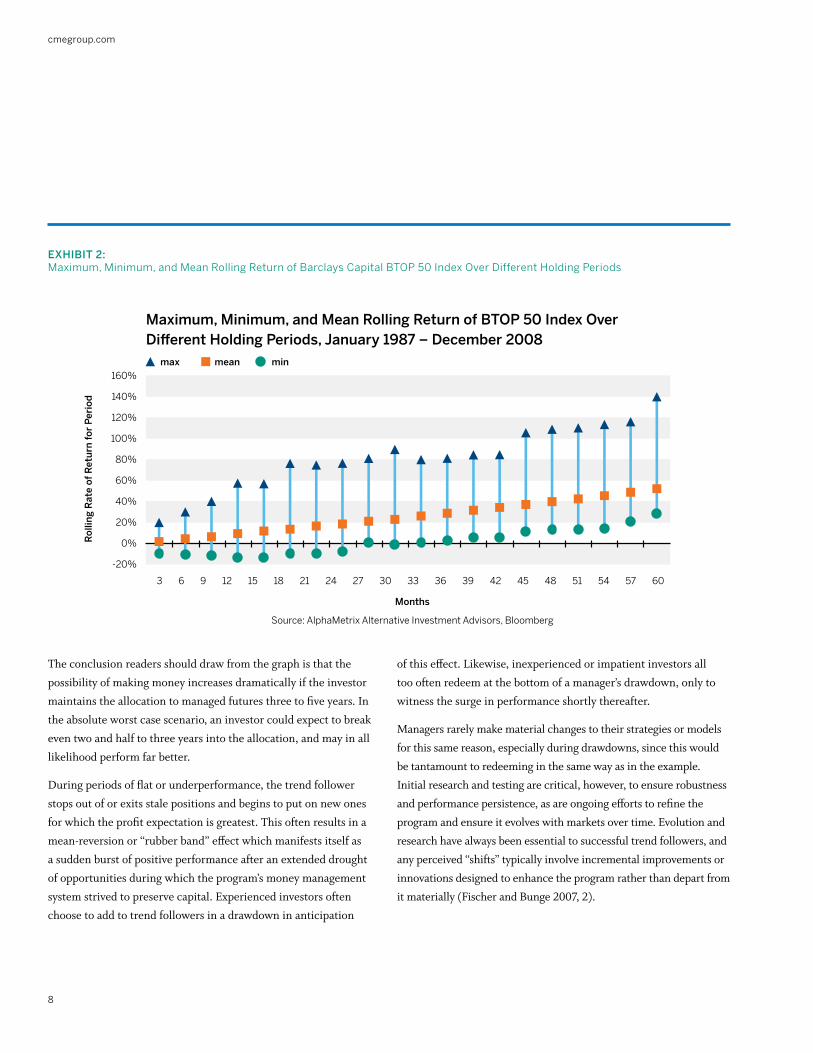
Exhibit 2, on the following page, illustrates the maximum, minimum and mean rolling return of the Barclays Capital BTOP 50 Index over different holding periods since January 1987. Each blue bar represents the range of all rolling returns for that number of months over the life of the index. For example, the bar furthest to the left represents all 3-month rolling returns since the inception of the BTOP 50 Index. The minimum, depicted by the green dot, shows the worst 3-month rolling return in the distribution. The orange square indicates the mean, and the blue triangle shows the best 3-month rolling return in the distribution for this particular example.
cmegroup.com
8
Exhibit 2:Maximum, Minimum, and Mean Rolling Return of Barclays Capital BtOP 50 Index Over Different Holding Periods
160%
140%
120%
100%
80%
60%
40%
20%
0%
-20%
Source: AlphaMetrix Alternative Investment Advisors, Bloomberg
Maximum, Minimum, and Mean Rolling Return of BTOP 50 Index Over Different Holding Periods, January 1987 – December 2008
Rol
ling
Rat
e of
Ret
urn
for
Per
iod
Months
max mean min
The conclusion readers should draw from the graph is that the possibility of making money increases dramatically if the investor maintains the allocation to managed futures three to five years. In the absolute worst case scenario, an investor could expect to break even two and half to three years into the allocation, and may in all likelihood perform far better.
During periods of flat or underperformance, the trend follower stops out of or exits stale positions and begins to put on new ones for which the profit expectation is greatest. This often results in a mean-reversion or “rubber band” effect which manifests itself as a sudden burst of positive performance after an extended drought of opportunities during which the program’s money management system strived to preserve capital. Experienced investors often choose to add to trend followers in a drawdown in anticipation
of this effect. Likewise, inexperienced or impatient investors all too often redeem at the bottom of a manager’s drawdown, only to witness the surge in performance shortly thereafter.
Managers rarely make material changes to their strategies or models for this same reason, especially during drawdowns, since this would be tantamount to redeeming in the same way as in the example. Initial research and testing are critical, however, to ensure robustness and performance persistence, as are ongoing efforts to refine the program and ensure it evolves with markets over time. Evolution and research have always been essential to successful trend followers, and any perceived “shifts” typically involve incremental improvements or innovations designed to enhance the program rather than depart from it materially (Fischer and Bunge 2007, 2).
A Quantitative Analysis of Managed Futures in an Institutional Portfolio
9
Other Managed Futures Strategies Although the majority of quantitative CTAs employ some variation of trend following strategies, other managed futures quantitative strategies abound, many of which exhibit no statistical relationship whatsoever with trend following programs. Counter-trend strategies attempt to capitalize on the often rapid and dramatic reversals that take place at the end of trends. Some quantitative traders employ econometric analysis of fundamental factors to develop trading systems. Others use advanced quantitative techniques such as signal processing, neural networks, genetic algorithms, and other methods borrowed and applied from the sciences. Recent advances in computing power and technology as well as the increased availability of data have resulted in the proliferation of short-term trading strategies. These employ statistical pattern recognition, market psychology, and other techniques designed to exploit persistent biases in high frequency data. Toward the end of 2008, short-term strategies were in high demand among fund of funds and institutional investors searching for sources of return which appeared to be statistically independent from the factors driving performance across both the traditional and alternative investments universes.
The very short holding periods of short-term traders allow them to rapidly adapt to prevailing market conditions, making it easy for them to generate returns during periods which are difficult for traditional and alternative investments. The countless combinations and permutations of portfolio holdings that these trading managers may hold over a limited period of time also tend to result in returns that are not correlated to any other investment, including other short-term traders.
Managed Futures Equal black box trading? The quantitative nature of many managed futures strategies makes it easy for casual observers to mistakenly categorize them as black box trading systems. “The irony is that most CTAs will provide uncommonly high levels of transparency relative to other alternative investment strategies” (Ramsey and Kins 2004, 131). Ramsey and Kins suggest that CTAs will describe their trading models and risk management in substantial detail during the course of due diligence, “short of revealing their actual algorithms” (Ramsey and Kins 2004, 131). CTAs are also typically willing to share substantial position transparency with fund investors, and the real-time, full transparency of positions and custody of cash and instruments made possible by investments via separately managed accounts. “As such, it is difficult to call CTAs black box considering they disclose their methodology and provide full position transparency so that investors can verify adherence to that methodology” (Ramsey and Kins 2004, 131).
cmegroup.com
10
Furthermore, any systematic or algorithmic trading system has a large human element. Namely, in the coding of this system, several decisions were made concerning the techniques invoked. What limits should be used? Should there be a component of optimization? There are countless questions and decisions that go into the codification of a systematic trading program that are qualitative in nature – after all, the coding and creation was done by humans! Those who are not quantitatively minded often completely overlook this fact. There are both pros and cons in systematic trading, as well as in discretionary trading, thus discriminating purely on the basis of systematic or discretionary is not warranted; indeed many managed futures programs are a hybrid of both.
Discretionary trading Not all CTAs employ quantitative or systematic trading approaches. In fact, some of the most unique alternative investment programs consist of discretionary CTAs and niche sector or market specialists. Like their systematic counterparts, discretionary CTAs may use fundamental and technical inputs to make trading decisions and may trade one or many markets across a continuous domain of time horizons. Some discretionary CTAs do analyze chart patterns or other technical indicators, but many discretionary CTAs employ fundamental analysis of supply and demand as the basis for their programs. The most successful discretionary traders tend to have clearly defined, well-articulated risk management coupled with unique experience and background relevant to the market or markets they trade. The fact that most discretionary managers have the flexibility to trade in a completely opportunistic fashion often results in returns which tend to be uncorrelated to trend following, managed futures and other hedge fund styles, as well as passive long-only commodity indices.
Manager Selection Peer analysis is often complicated by the blending of managed futures sub-styles or other subtle differences that frustrate the creation of peer groups of managers. The exception tends to be the rule. It might be difficult to categorize an eclectic manager who combines a price-based model with fundamental analysis to discretionarily arrive at trading decisions, or a grain trader whose returns are 0.9 correlated with a number of trend followers. It is possible to overcome these hurdles, however, by taking a quantitative approach to peer analysis. Managers whose returns are correlated likely have similar risk factors or exposures embedded in their programs or trading styles. Creating peer groups of highly correlated managers simplifies the basis for comparison across metrics of interest, and facilitates the analysis of programs which have historically tended to perform similarly in different market environments. The implications of quantitative peer group analysis of this sort for manager selection are obvious.
The importance of manager selection varies somewhat depending upon the objectives of the managed futures investor. Ramsey and Kins suggest that “an investment with large CTAs should focus on picking the very best managers with less thought of diversification,” given their methodological similarities and tendency to highly correlate to one another (Ramsey and Kins 2004, 134). Selection among large, diversified trend followers is more important, but blending two or more of these managers typically enables investors to enjoy some of the benefits of diversification. The question of selection becomes less important for investors seeking to capture the benefits of smaller, “emerging” CTAs. Ramsey and Kins recommend a “strategy of employing a large cross sample of these CTAs in order to reduce business risk and take advantage of the ability to diversify across trading methodologies and markets.” (Ramsey and Kins 2004, 134)
A Quantitative Analysis of Managed Futures in an Institutional Portfolio
11
MANAGED FutuREs RIsk, REtuRN, AND tHE POtENtIAL FOR ENHANCED DIvERsIFICAtION
The exploitation of trends or other price behaviors that tend to accompany large macro dislocations or events by CTAs produces both a positive return expectation and uncorrelated variance, making them additive to most portfolios. Although CTAs tend to have high volatility and lower Sharpe ratios relative to other alternative investments, the addition of an uncorrelated element which often contributes positive gamma, enhances the return and decreases the variance of most portfolios. (It is important to recall that this volatility comes from large, infrequent positive returns and that the Sharpe ratio is flawed as a measure of risk-adjusted performance, as we will soon demonstrate.) The fact that an investment is volatile on a stand-alone basis does not necessarily mean that it will increase the volatility of the entire portfolio. Modern Portfolio Theory suggests that adding uncorrelated variance actually decreases overall portfolio variance. The addition of uncorrelated variance may also help investors reduce other important measures of risk, including drawdown, semi-deviation, and kurtosis in the left tail.
Lintner’s paper found that the low and occasionally negative correlations between futures portfolios and traditional equity and fixed income portfolios enable the creation of portfolios with substantially less variance at every possible level of expected return relative to traditional portfolios consisting solely of stocks or mixtures of stocks and bonds (Lintner 1996, 105-106). He alludes to the growing interest of institutional investors in alternative investments as means to tap additional sources of uncorrelated return, pointing to real estate, venture capital investments and “diversified holdings of oil-well exploration pools” as examples before turning to managed futures (Lintner 1996, 102).
Since then, the importance of alternative investments to institutional investors as sources of absolute return and portfolio diversification has grown tremendously, especially over the last decade. Managed futures strategies should continue to play a prominent role in the increasingly important alternative portion of institutional portfolios, due not only to their role in dampening portfolio variance, but also their ability to improve other important performance statistics, including semideviation, drawdown, skewness, kurtosis and the Omega performance measure, which incorporates all of the information embedded in the distribution of returns of an investment, as well as an investor-determined threshold of loss.
Lintner performed his analysis on mean-variance portfolios of traditional and managed futures investments using stock and bond indices, and two sets of managed futures account and fund investment returns, likely due to the paucity of managed futures performance data. This study employs index data exclusively, due to its wide availability, as well as to minimize selection bias. It also attempts to maximize robustness and statistical validity by calculating all statistics using as many observations as possible, resulting in comparisons across heterogeneous time horizons when historical index data is not available. As such, the number of observations used for calculations varies.
cmegroup.com
12
RIsk AND REtuRN: OMEGA – A BEttER APPROACH
Popular culture and the media often portray futures trading as one of the riskiest and most speculative forms of investment. Several intrinsic characteristics of futures contracts make them substantially less risky, however, than investments in other instruments which have not been branded with many of the same negative connotations. Most casual observers and even many experienced practitioners attribute this volatility to the underlying instruments traded, but such a conclusion would be fallacious.
Futures garnered their reputation as a risky largely due to the volatility of individual commodity markets, which many observers closely associate with the futures markets. The volatility of the passive long-only commodity indices, such as the Goldman Sachs Commodity Index (GSCI), also explains in part the perception of high risk. The nearly 20 percent annualized volatility of the GSCI, combined with its maximum historical drawdown of more than 60 percent certainly justifies this perception. However, it is important to make a number of critical distinctions here. First, there are substantial differences between passive long-only indices like the GSCI and actively managed trading strategies like those which this paper highlighted earlier. “Commodities,” loosely defined, are also different than futures contracts, which are nothing more than exchange traded instruments linked to the prices of a diversified variety of global markets.
Those assessing risk must also carefully define it. Modern Portfolio Theory equates risk with variance (or volatility as measured by standard deviation), which measures the dispersion of outcomes from the mean. Using volatility to measure risk, however, penalizes those outcomes which are greater than the expected, or upside volatility. Outcomes which exceed expectations (most rational investors would not select investments for which the return expectation is negative), or exceed a necessary or desired threshold, cannot truly be said to be risky in the sense that they do not imply loss or failure to meet an objective. In other words, volatility ignores the skewness and kurtosis of a manager’s distribution of returns.
Managed futures may be more volatile than long/short equity or equity market neutral hedge funds, but not necessarily more risky. Measuring risk by volatility is dangerous to do in the alternatives space since the distributions are typically non-Gaussian.
Moreover, from a practical point of view, there is an obvious difference between upside volatility and downside volatility.
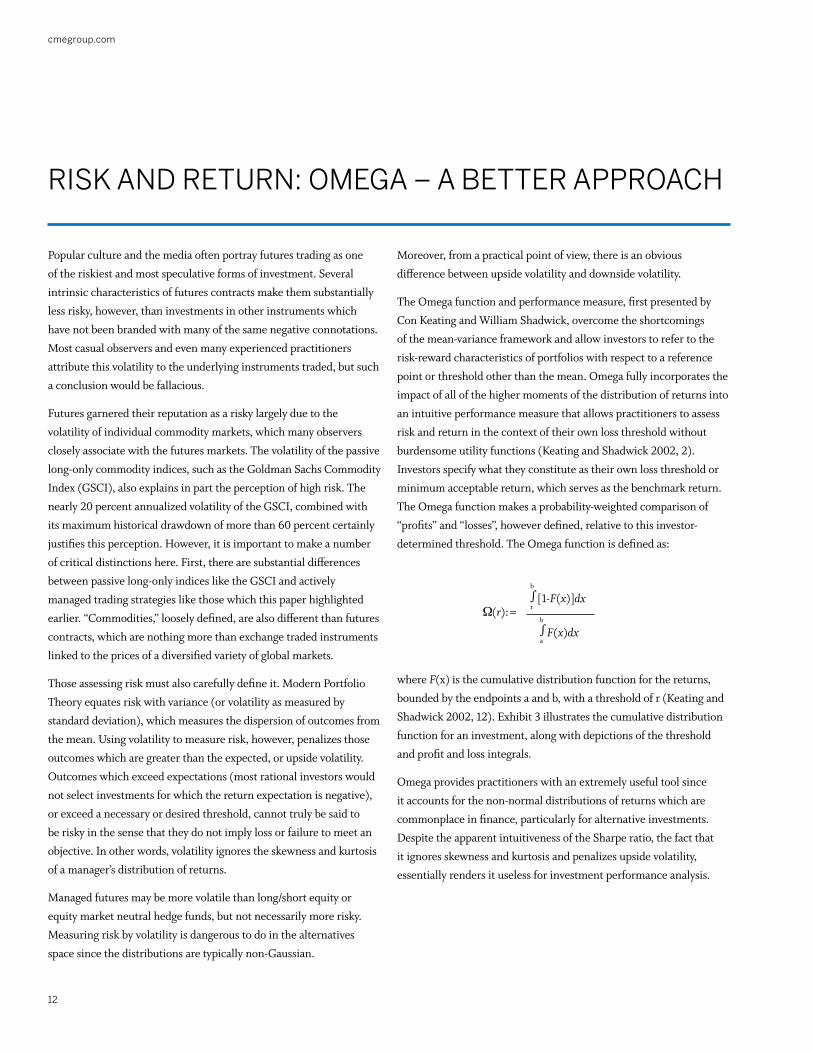
The Omega function and performance measure, first presented by Con Keating and William Shadwick, overcome the shortcomings of the mean-variance framework and allow investors to refer to the risk-reward characteristics of portfolios with respect to a reference point or threshold other than the mean. Omega fully incorporates the impact of all of the higher moments of the distribution of returns into an intuitive performance measure that allows practitioners to assess risk and return in the context of their own loss threshold without burdensome utility functions (Keating and Shadwick 2002, 2). Investors specify what they constitute as their own loss threshold or minimum acceptable return, which serves as the benchmark return. The Omega function makes a probability-weighted comparison of “profits” and “losses”, however defined, relative to this investor-determined threshold. The Omega function is defined as:
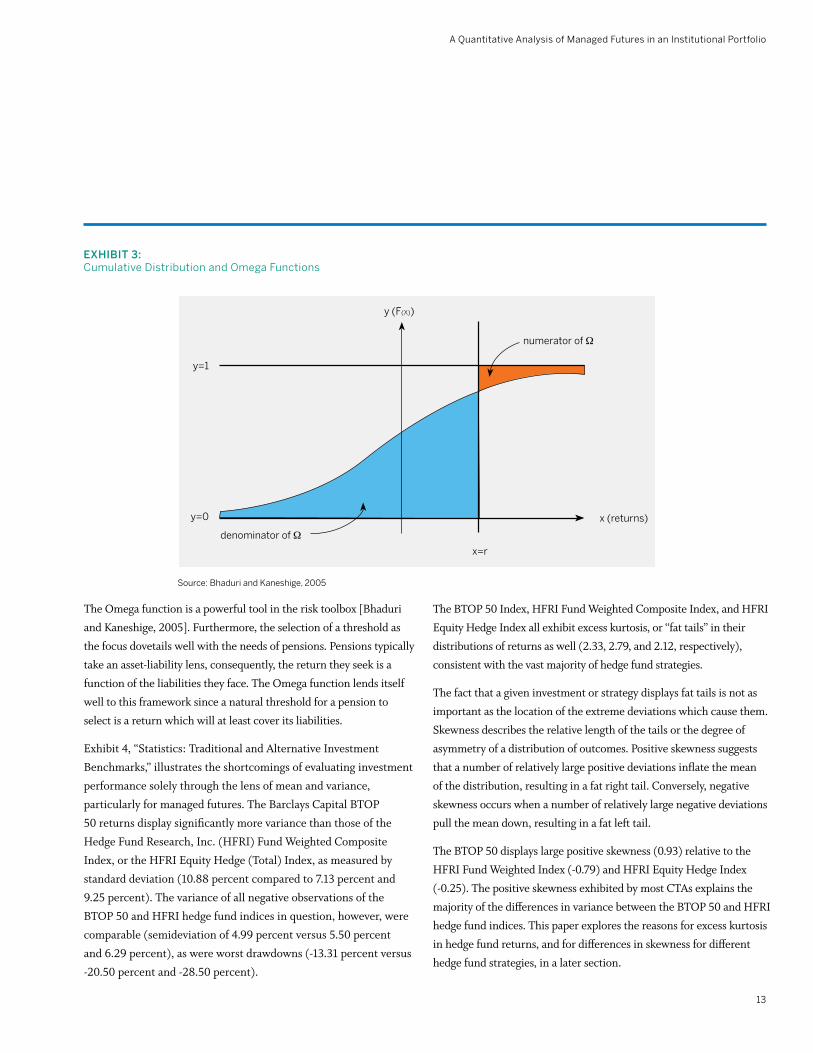
where F(x) is the cumulative distribution function for the returns, bounded by the endpoints a and b, with a threshold of r (Keating and Shadwick 2002, 12). Exhibit 3 illustrates the cumulative distribution function for an investment, along with depictions of the threshold and profit and loss integrals.
Omega provides practitioners with an extremely useful tool since it accounts for the non-normal distributions of returns which are commonplace in finance, particularly for alternative investments. Despite the apparent intuitiveness of the Sharpe ratio, the fact that it ignores skewness and kurtosis and penalizes upside volatility, essentially renders it useless for investment performance analysis.
Ω(r):=[1-F(x)]dx
F(x)dxb
∫a
b
∫r
A Quantitative Analysis of Managed Futures in an Institutional Portfolio
13
Exhibit 3:Cumulative Distribution and Omega Functions
The Omega function is a powerful tool in the risk toolbox [Bhaduri and Kaneshige, 2005]. Furthermore, the selection of a threshold as the focus dovetails well with the needs of pensions. Pensions typically take an asset-liability lens, consequently, the return they seek is a function of the liabilities they face. The Omega function lends itself well to this framework since a natural threshold for a pension to select is a return which will at least cover its liabilities.
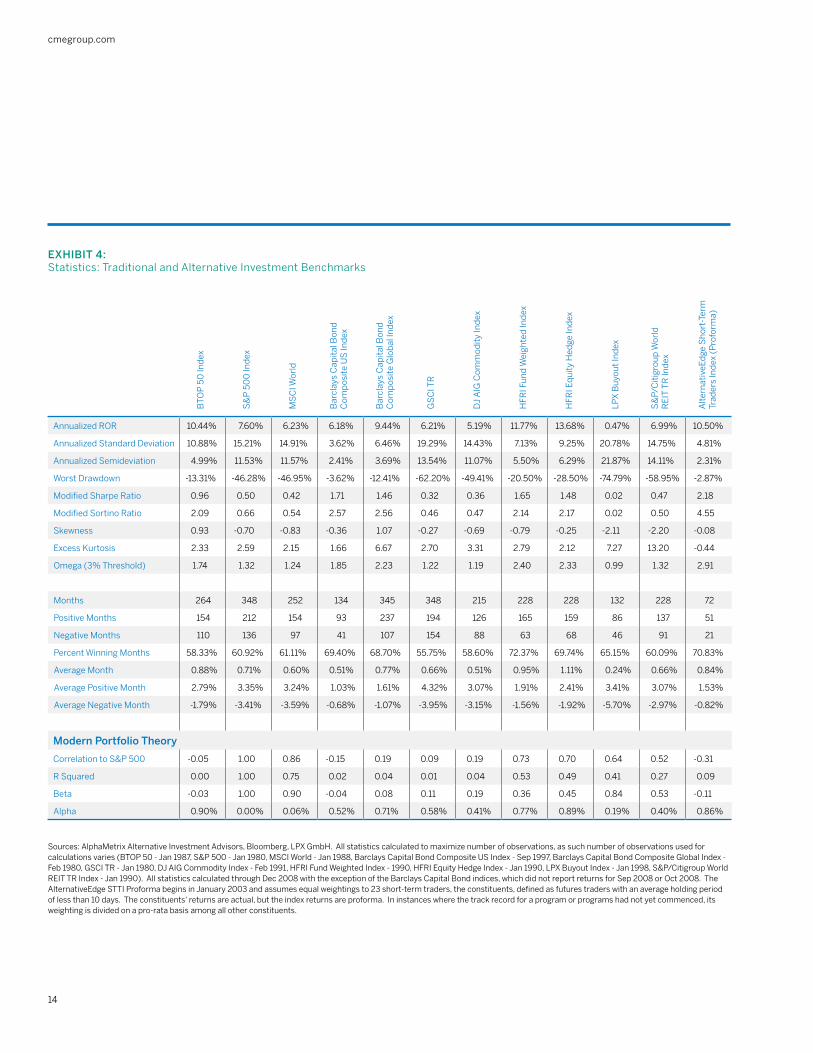
Exhibit 4, “Statistics: Traditional and Alternative Investment Benchmarks,” illustrates the shortcomings of evaluating investment performance solely through the lens of mean and variance, particularly for managed futures. The Barclays Capital BTOP 50 returns display significantly more variance than those of the Hedge Fund Research, Inc. (HFRI) Fund Weighted Composite Index, or the HFRI Equity Hedge (Total) Index, as measured by standard deviation (10.88 percent compared to 7.13 percent and 9.25 percent). The variance of all negative observations of the BTOP 50 and HFRI hedge fund indices in question, however, were comparable (semideviation of 4.99 percent versus 5.50 percent and 6.29 percent), as were worst drawdowns (-13.31 percent versus -20.50 percent and -28.50 percent).
The BTOP 50 Index, HFRI Fund Weighted Composite Index, and HFRI Equity Hedge Index all exhibit excess kurtosis, or “fat tails” in their distributions of returns as well (2.33, 2.79, and 2.12, respectively), consistent with the vast majority of hedge fund strategies.
The fact that a given investment or strategy displays fat tails is not as important as the location of the extreme deviations which cause them. Skewness describes the relative length of the tails or the degree of asymmetry of a distribution of outcomes. Positive skewness suggests that a number of relatively large positive deviations inflate the mean of the distribution, resulting in a fat right tail. Conversely, negative skewness occurs when a number of relatively large negative deviations pull the mean down, resulting in a fat left tail.
The BTOP 50 displays large positive skewness (0.93) relative to the HFRI Fund Weighted Index (-0.79) and HFRI Equity Hedge Index (-0.25). The positive skewness exhibited by most CTAs explains the majority of the differences in variance between the BTOP 50 and HFRI hedge fund indices. This paper explores the reasons for excess kurtosis in hedge fund returns, and for differences in skewness for different hedge fund strategies, in a later section.
y=1
y (F(X))
y=0
denominator of Ω
numerator of Ω
x=r
x (returns)
source: Bhaduri and kaneshige, 2005
cmegroup.com
14
Exhibit 4:statistics: traditional and Alternative Investment Benchmarks
sources: AlphaMetrix Alternative Investment Advisors, Bloomberg, LPX GmbH. All statistics calculated to maximize number of observations, as such number of observations used for calculations varies (BtOP 50 - Jan 1987, s&P 500 - Jan 1980, MsCI world - Jan 1988, Barclays Capital Bond Composite us Index - sep 1997, Barclays Capital Bond Composite Global Index - Feb 1980, GsCI tR - Jan 1980, DJ AIG Commodity Index - Feb 1991, HFRI Fund weighted Index - 1990, HFRI Equity Hedge Index - Jan 1990, LPX Buyout Index - Jan 1998, s&P/Citigroup world REIt tR Index - Jan 1990). All statistics calculated through Dec 2008 with the exception of the Barclays Capital Bond indices, which did not report returns for sep 2008 or Oct 2008. the AlternativeEdge sttI Proforma begins in January 2003 and assumes equal weightings to 23 short-term traders, the constituents, defined as futures traders with an average holding period of less than 10 days. the constituents' returns are actual, but the index returns are proforma. In instances where the track record for a program or programs had not yet commenced, its weighting is divided on a pro-rata basis among all other constituents.
A Quantitative Analysis of Managed Futures in an Institutional Portfolio
15
HIDDEN RIsk: tHE IMPORtANCE OF LIQuIDIty, tRANsPARENCy AND CustODy
Model risk always exists, as no model is perfect by definition. What is less appreciated by many in the investment community is that model risk and liquidity risk are entangled. There are no valuation issues with exchange-traded instruments, and model risk is magnified when dealing with illiquid instruments. In general, the less liquid the instruments traded, the more hidden risk, and the more dangerous model risk becomes. The historic 2008 financial meltdown is a vivid example of this statement [Bhaduri and Art, 2008].
Most managed futures programs by definition trade exclusively exchange-listed futures or options on futures. Settlements on all futures contracts are determined by the various exchanges at the end of each trading day, compelling managers to mark their books to market. Many CTAs also trade the inter-bank FX forward market, where the process of price discovery takes place 24 hours a day. It is also one of the deepest and most liquid in the world. These qualities enable hedge fund investors to mitigate or completely eliminate some of the more deleterious risks associated with investing in alternatives. The liquidity of the underlying instruments traded as well as the high level of transparency available through managed account investments with CTAs facilitates tactical asset allocation. Investors and CTAs alike can easily exit unprofitable positions, or positions that they expect to become unprofitable in the near future, with minimal slippage, usually in a matter of minutes.
Ironically, the liquid, transparent, marked-to-market nature of the instruments traded by liquid hedge funds may make their returns appear more volatile or risky than those of many hedge funds trading esoteric or illiquid instruments, which trade infrequently and are therefore marked to a stale price or a model. As a result, these hedge funds often intentionally or unintentionally smooth their returns, artificially dampening their volatility and depth of their drawdowns.
The lack of transparency and difficulty involved in pricing illiquid instruments magnifies model risk. Infrequent pricing of instruments obfuscates the relationships among market price and the different factors or variables used in pricing or trading models, complicating their testing and design. Lack of transparency and illiquidity substantially reduce the margin of error during the research and development of trading or risk models. The losses that will ensue in the event that models fail to account for a critical piece of information, will be of an order of magnitude many times larger for illiquid instruments due to the relative thinness of these markets. The seller will likely have to accept a deep discount in price to exit an illiquid position, particularly during a “fire sale” or crisis event. The credit debacle of 2007-2008, for example, exposed many hedge funds and other sophisticated investors who had invested in structured debt products whose models failed to incorporate many of the hidden risks. The investors and portfolio managers holding these instruments suffered deep losses as they struggled to find liquidity in thin markets, or watched other positions go to zero due to poor assumptions made by the rating agencies.
Conversely, risk managers can monitor and control risk with relative ease due to the transparency and liquidity of futures contracts. Instead of relying on complex models with numerous assumptions, risk managers are free to focus on monitoring margin to equity, counting contracts and testing for disaster scenarios, such as correlation convergence with a multiple standard deviation shock. Transparency and constant price discovery facilitates simple, no nonsense testing and monitoring. Investing via separately managed accounts, a common practice among managed futures investors, facilitates risk management tremendously by providing the investor with full transparency and in extreme cases, the ability to intervene against the trading manager by liquidating or neutralizing positions.
cmegroup.com
16
Hidden sources of risk that many hedge fund investors do not fully appreciate are the structural and operational risks associated with investing directly into a fund vehicle. Fund investments require the investor to transfer money to the trading manager with an implicit guarantee that it will be returned at some future date. Wiring money to the manager exposes the investor to the risk of fraud or theft of the investment. Managed account investments mitigate this risk by giving the manager limited power of attorney to trade on behalf of the investor, who maintains legal custody of the cash and instruments at his FCM. Wiring money to a manager also exposes the investor to operational risks, and requires expensive and time-consuming due diligence on the manager’s middle and back office processes, as well as its service providers. Fund investments, including those in liquid instruments, often attempt to impose lockups, gates, or onerous redemption terms on investors. Most fund documents also give the general partner the right to suspend redemptions, in effect providing the manager with a call option on the liquidity it had previously offered investors. There is no real value added by having the money housed with the manager who is being paid to try and provide an attractive risk-adjusted return over time with proper risk controls. Managers who refuse to grant managed accounts are in essence refusing to give transparency and are subjecting their clients to additional risks.
Returning to the ever-important topic of liquidity, it is worth pointing out that from a behavioral finance point of view, it is easy for investors to underestimate the value of liquidity [Bhaduri and Whelan, 2007]. If a hedge fund is trading illiquid instruments and has a long lock-up, then simply comparing its return statistics to a CTA that is trading exchange-traded instruments and does not have a lock-up is incorrect, since it does not assign a value to liquidity [Bhaduri and Art, 2008]. Lock-ups by private equity funds and hedge funds trading illiquid instruments cost the investor in terms of reduced flexibility, and they should be rewarded with higher returns to compensate for this. There are not yet many measures or instruments to deal with this problem [Bhaduri, Meissner, and Youn, 2007].
A Quantitative Analysis of Managed Futures in an Institutional Portfolio
17
tHE LACk OF CORRELAtION AND POtENtIAL FOR PORtFOLIO DIvERsIFICAtION
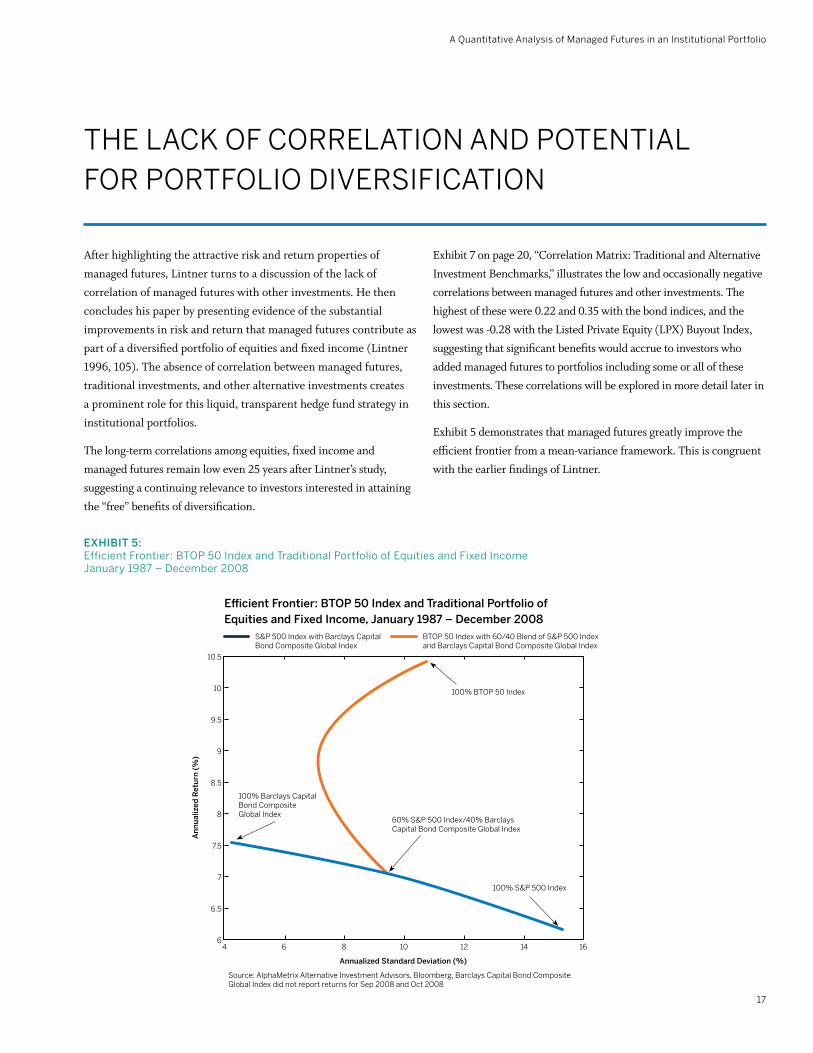
After highlighting the attractive risk and return properties of managed futures, Lintner turns to a discussion of the lack of correlation of managed futures with other investments. He then concludes his paper by presenting evidence of the substantial improvements in risk and return that managed futures contribute as part of a diversified portfolio of equities and fixed income (Lintner 1996, 105). The absence of correlation between managed futures, traditional investments, and other alternative investments creates a prominent role for this liquid, transparent hedge fund strategy in institutional portfolios.
The long-term correlations among equities, fixed income and managed futures remain low even 25 years after Lintner’s study, suggesting a continuing relevance to investors interested in attaining the “free” benefits of diversification.
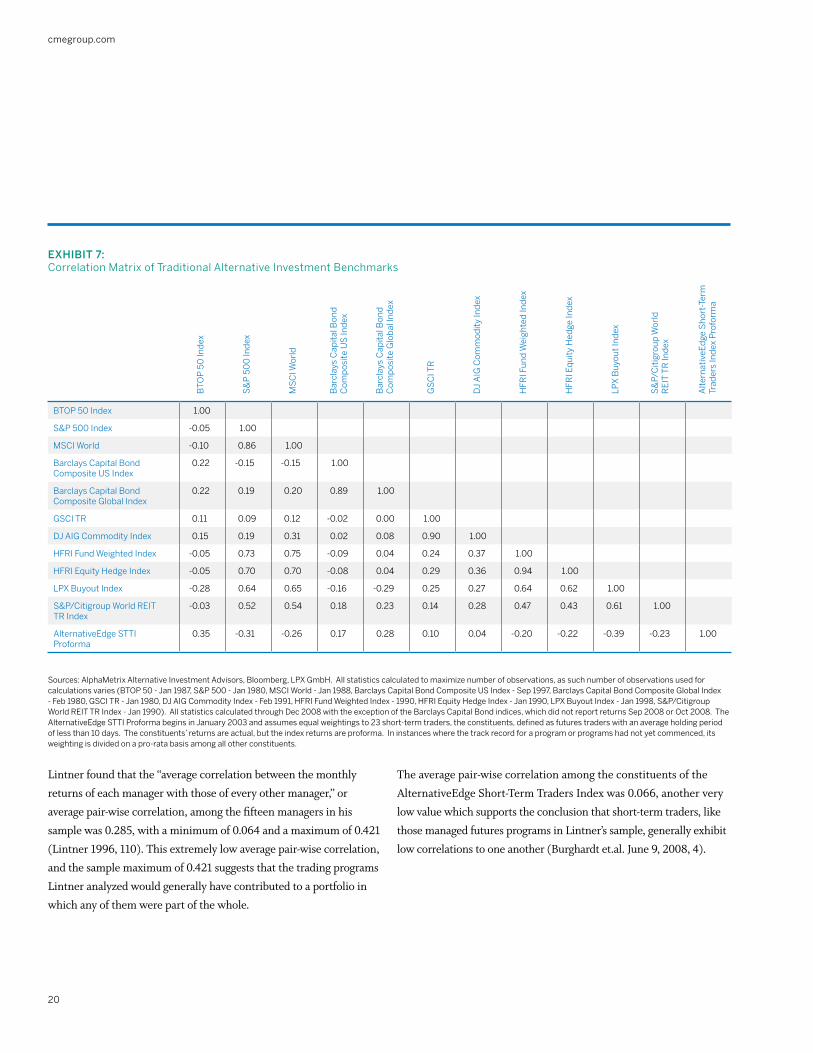
Exhibit 7 on page 20, “Correlation Matrix: Traditional and Alternative Investment Benchmarks,” illustrates the low and occasionally negative correlations between managed futures and other investments. The highest of these were 0.22 and 0.35 with the bond indices, and the lowest was -0.28 with the Listed Private Equity (LPX) Buyout Index, suggesting that significant benefits would accrue to investors who added managed futures to portfolios including some or all of these investments. These correlations will be explored in more detail later in this section.
Exhibit 5 demonstrates that managed futures greatly improve the efficient frontier from a mean-variance framework. This is congruent with the earlier findings of Lintner.
Source: AlphaMetrix Alternative Investment Advisors, Bloomberg, Barclays Capital Bond Composite Global Index did not report returns for Sep 2008 and Oct 2008
Efficient Frontier: BTOP 50 Index and Traditional Portfolio of Equities and Fixed Income, January 1987 – December 2008
Annualized Standard Deviation (%)
An
nu
aliz
ed R
etu
rn (
%)
10.5
10
9.5
9
8.5
8
7.5
7
6.5
64 6 8 10 12 14 16
S&P 500 Index with Barclays Capital Bond Composite Global Index
BTOP 50 Index with 60/40 Blend of S&P 500 Index and Barclays Capital Bond Composite Global Index
60% S&P 500 Index/40% Barclays Capital Bond Composite Global Index
100% Barclays Capital Bond Composite Global Index
100% S&P 500 Index
100% BTOP 50 Index
Exhibit 5:Efficient Frontier: BtOP 50 Index and traditional Portfolio of Equities and Fixed Income January 1987 – December 2008
cmegroup.com
18
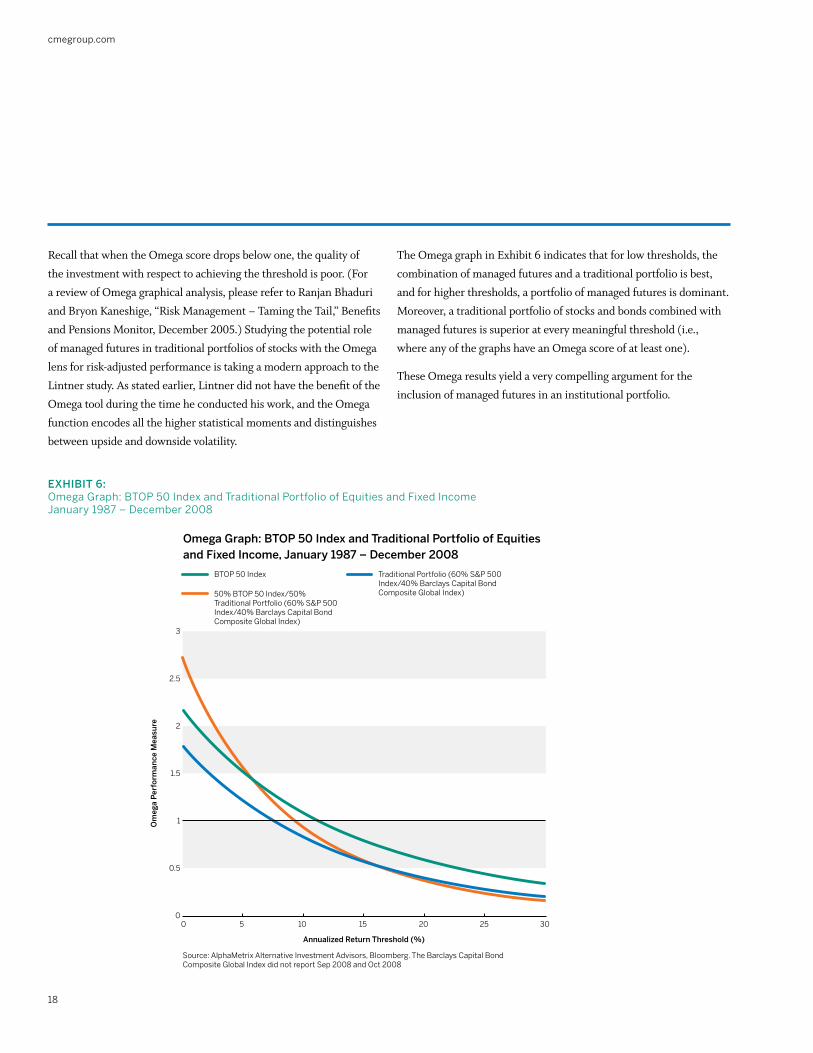
Recall that when the Omega score drops below one, the quality of the investment with respect to achieving the threshold is poor. (For a review of Omega graphical analysis, please refer to Ranjan Bhaduri and Bryon Kaneshige, “Risk Management – Taming the Tail,” Benefits and Pensions Monitor, December 2005.) Studying the potential role of managed futures in traditional portfolios of stocks with the Omega lens for risk-adjusted performance is taking a modern approach to the Lintner study. As stated earlier, Lintner did not have the benefit of the Omega tool during the time he conducted his work, and the Omega function encodes all the higher statistical moments and distinguishes between upside and downside volatility.
Source: AlphaMetrix Alternative Investment Advisors, Bloomberg. The Barclays Capital Bond Composite Global Index did not report Sep 2008 and Oct 2008
Omega Graph: BTOP 50 Index and Traditional Portfolio of Equities and Fixed Income, January 1987 – December 2008
Annualized Return Threshold (%)
Om
ega
Per
form
ance
Mea
sure
3
2.5
2
1.5
1
0.5
00 5 10 15 20 25 30
BTOP 50 Index Traditional Portfolio (60% S&P 500 Index/40% Barclays Capital Bond Composite Global Index)50% BTOP 50 Index/50%
Traditional Portfolio (60% S&P 500 Index/40% Barclays Capital Bond Composite Global Index)
The Omega graph in Exhibit 6 indicates that for low thresholds, the combination of managed futures and a traditional portfolio is best, and for higher thresholds, a portfolio of managed futures is dominant. Moreover, a traditional portfolio of stocks and bonds combined with managed futures is superior at every meaningful threshold (i.e., where any of the graphs have an Omega score of at least one).
These Omega results yield a very compelling argument for the inclusion of managed futures in an institutional portfolio.
Exhibit 6:Omega Graph: BtOP 50 Index and traditional Portfolio of Equities and Fixed Income January 1987 – December 2008
A Quantitative Analysis of Managed Futures in an Institutional Portfolio
19
Correlations between Managed Futures and Other investments The variety of trading sub-styles within managed futures and the lack of correlation among them, as well as to other traditional and alternative investments, makes it possible to enhance the return or diminish the risk of portfolios through the addition of managed futures “alpha” strategies. These include sub-styles such as short-term trading, niche discretionary strategies, relative-value, etc. These qualities make it possible to construct diversified, liquid, transparent fund of funds and portfolios by combining uncorrelated programs. Lintner’s pioneering research demonstrated that there are substantial benefits which accrue from “selective diversification” across a number of different futures managers and funds due to the “rather moderate” correlations among them (Lintner 1996, 105). The astronomically high number of combinations and permutations of portfolio holdings and investment horizons of short-term traders, and accordingly, the unique and uncorrelated returns which result, make them a fascinating case for revisiting Lintner’s analysis of diversification among futures managers.
Lintner analyzed the portfolio benefits of combining managed account investments in fifteen different futures programs using different weighting schemes. For our purposes, the weighting schemes are not important since these may vary according to the portfolio manager’s objectives. Instead, this section will focus on the correlations among managers since these provide the most information about potential benefits to be had from diversification. For simplicity, it also will distill correlations among managers into average pair-wise correlation.
This section also draws upon the performance of the constituents of the AlternativeEdge Short-Term Traders Index, a theoretical index of 23 trading programs whose holding period is less than ten days on average, trade two or more market sectors, and which are open for investment (Burghardt et.al. June 9, 2008, 4). There is some risk of survivorship bias since all of the constituent programs remain open for investment. Selection bias appears to be less of a concern since this index contains managers of all trading styles, track records of various lengths, and various levels of assets under management. Regardless, while the constituents of the index do not provide an exhaustive sample, it is likely that they provide one which is representative of short-term trading and its correlation properties.
cmegroup.com
20
Exhibit 7: Correlation Matrix of traditional Alternative Investment Benchmarks
Lintner found that the “average correlation between the monthly returns of each manager with those of every other manager,” or average pair-wise correlation, among the fifteen managers in his sample was 0.285, with a minimum of 0.064 and a maximum of 0.421 (Lintner 1996, 110). This extremely low average pair-wise correlation, and the sample maximum of 0.421 suggests that the trading programs Lintner analyzed would generally have contributed to a portfolio in which any of them were part of the whole.
The average pair-wise correlation among the constituents of the AlternativeEdge Short-Term Traders Index was 0.066, another very low value which supports the conclusion that short-term traders, like those managed futures programs in Lintner’s sample, generally exhibit low correlations to one another (Burghardt et.al. June 9, 2008, 4).
BtOP 50 Index 1.00
s&P 500 Index -0.05 1.00
MsCI world -0.10 0.86 1.00
Barclays Capital Bond Composite us Index
0.22 -0.15 -0.15 1.00
Barclays Capital Bond Composite Global Index
0.22 0.19 0.20 0.89 1.00
GsCI tR 0.11 0.09 0.12 -0.02 0.00 1.00
DJ AIG Commodity Index 0.15 0.19 0.31 0.02 0.08 0.90 1.00
HFRI Fund weighted Index -0.05 0.73 0.75 -0.09 0.04 0.24 0.37 1.00
sources: AlphaMetrix Alternative Investment Advisors, Bloomberg, LPX GmbH. All statistics calculated to maximize number of observations, as such number of observations used for calculations varies (BtOP 50 - Jan 1987, s&P 500 - Jan 1980, MsCI world - Jan 1988, Barclays Capital Bond Composite us Index - sep 1997, Barclays Capital Bond Composite Global Index - Feb 1980, GsCI tR - Jan 1980, DJ AIG Commodity Index - Feb 1991, HFRI Fund weighted Index - 1990, HFRI Equity Hedge Index - Jan 1990, LPX Buyout Index - Jan 1998, s&P/Citigroup world REIt tR Index - Jan 1990). All statistics calculated through Dec 2008 with the exception of the Barclays Capital Bond indices, which did not report returns sep 2008 or Oct 2008. the AlternativeEdge sttI Proforma begins in January 2003 and assumes equal weightings to 23 short-term traders, the constituents, defined as futures traders with an average holding period of less than 10 days. the constituents’ returns are actual, but the index returns are proforma. In instances where the track record for a program or programs had not yet commenced, its weighting is divided on a pro-rata basis among all other constituents.
A Quantitative Analysis of Managed Futures in an Institutional Portfolio
21
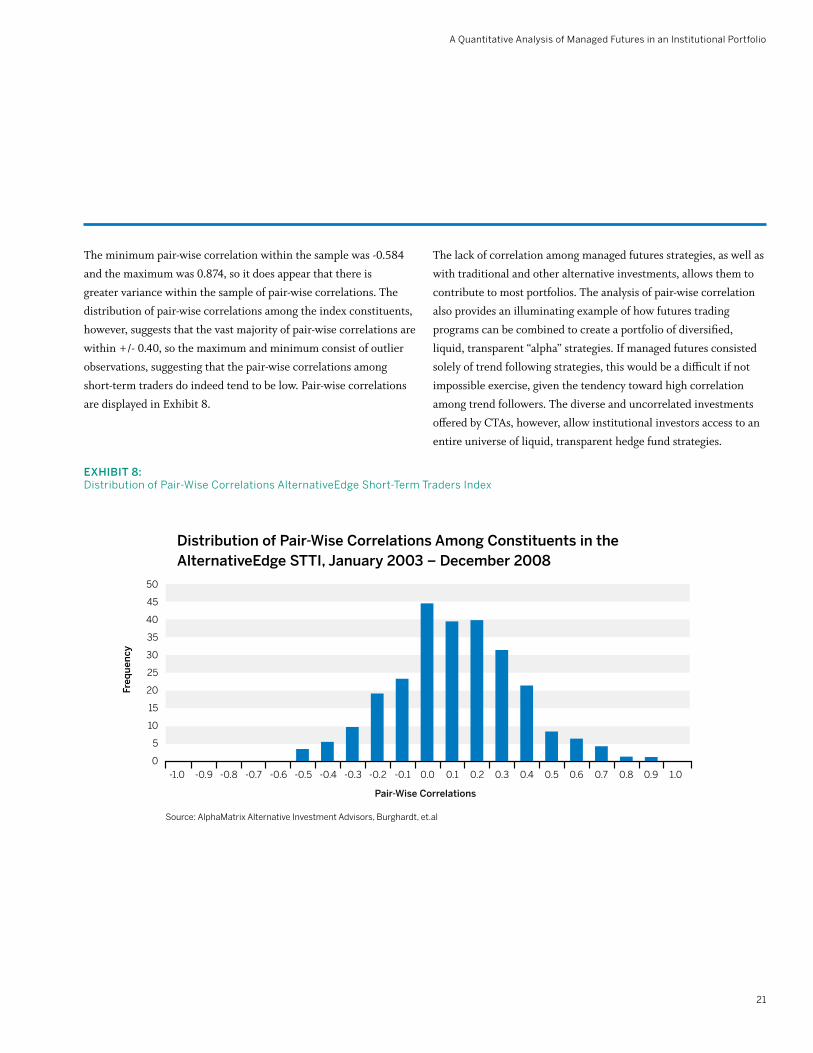
Exhibit 8: Distribution of Pair-wise Correlations AlternativeEdge short-term traders Index
Distribution of Pair-Wise Correlations Among Constituents in the AlternativeEdge STTI, January 2003 – December 2008
The minimum pair-wise correlation within the sample was -0.584 and the maximum was 0.874, so it does appear that there is greater variance within the sample of pair-wise correlations. The distribution of pair-wise correlations among the index constituents, however, suggests that the vast majority of pair-wise correlations are within +/- 0.40, so the maximum and minimum consist of outlier observations, suggesting that the pair-wise correlations among short-term traders do indeed tend to be low. Pair-wise correlations are displayed in Exhibit 8.
The lack of correlation among managed futures strategies, as well as with traditional and other alternative investments, allows them to contribute to most portfolios. The analysis of pair-wise correlation also provides an illuminating example of how futures trading programs can be combined to create a portfolio of diversified, liquid, transparent “alpha” strategies. If managed futures consisted solely of trend following strategies, this would be a difficult if not impossible exercise, given the tendency toward high correlation among trend followers. The diverse and uncorrelated investments offered by CTAs, however, allow institutional investors access to an entire universe of liquid, transparent hedge fund strategies.
source: AlphaMatrix Alternative Investment Advisors, Burghardt, et.al
cmegroup.com
22
MANAGED FutuREs AND PERFORMANCE DuRING FINANCIAL MARkEt DIsLOCAtIONs
The volatility and market dislocation that accompanied the subprime mortgage crisis, credit crunch, and explosion and collapse of commodities prices during the second half of 2007 and 2008, was briefly alluded to earlier in this paper. The diversified mix of investments many institutional investors had relied upon failed to generate returns. The major U.S. and Global equities market indices, the S&P 500 and MSCI World, performed dismally, returning -37.94 percent and -39.90 percent, respectively, from August 2007 when the credit crisis began, through December 2008.
Most alternative investments, which had promised absolute returns, disappointed investors as well. The HFRI Fund Weighted Composite Index, an equally weighted index designed to represent the returns of hedge funds across all strategies, returned -17.21 percent from August 2007 through December 2008. The HFRI Equity Hedge (Total) Index, which includes hedge funds whose core holdings consist of equities and therefore does not benefit as much from diversification as the HFRI Fund Weighted Composite Index, returned -25.06 percent. Private Equity and Real Estate Investment Trusts, represented by the LPX Buyout Index and the S&P/Citigroup World REIT Index, returned an atrocious -71.91 percent and -47.40 percent, respectively, from August 2007 through December 2008. CTAs, however, capitalized on the market dislocations of 2007 and 2008, providing managed futures investors with returns of 17.57 percent over the same period, as measured by the BTOP 50 index.
Ramsey and Kins posit that “though not a hedge, CTAs often perform very well when markets are under extreme stress, and have a high probability of adding value to an existing portfolio during difficult market conditions” (Ramsey and Kins 2004, 134). This is because managed futures tend to capture massive flows of capital as markets reestablish equilibrium in the wake of new information or in the transition from one economic cycle to another. It cannot be emphasized enough that managed futures are not and should not be treated as a portfolio hedge, but rather as an additional source of non-correlated returns, as this paper has demonstrated.
Although managed futures returns tend to be uncorrelated to other investments over the long run, correlations are non-stationary over shorter time horizons and may temporarily converge during crisis conditions. Ramsey and Kins point to “the case of exogenous events like the failed Russian coup in the 1990s or September 11, 2001” as examples where managed futures would not have been effective as a portfolio hedge and would have experienced losses alongside other investments and actively managed strategies (Ramsey and Kins 2004, 130). Not all market dislocations are the same, making CTAs vulnerable to rapid reversals or the sudden onset of volatility. The reaction of managed futures strategies to price action is path dependent, and the response of the program to prevailing price action during a crisis determines performance, at least in the short-term.
Certain generalizations about CTA returns and the market conditions that generate them do tend to result in bouts of strong, positive performance during certain kinds of market dislocations. The majority of CTAs trade “long volatility” strategies, which tend to produce a positively skewed distribution of monthly returns. The long option/positive gamma returns profile originates from the tight control of downside risk relative to less frequent outsized returns, suggesting that these managers generate the majority of their returns during lower frequency, high impact events. In contrast, most hedge fund strategies have fat left tails in their distributions of returns since they perform well under normal conditions but suffer infrequent, large losses under highly volatile conditions and should therefore be considered short volatility strategies (Ramsey and Kins 2004, 130). These “tail events” for CTAs and hedge funds tend to coincide with massive shifts of capital which create trends in global equity, interest rate, and commodities markets stemming from a flight to or from quality. Any dislocations which catalyze trends of this sort can and often do result in strong performance for managed futures.
A Quantitative Analysis of Managed Futures in an Institutional Portfolio
23
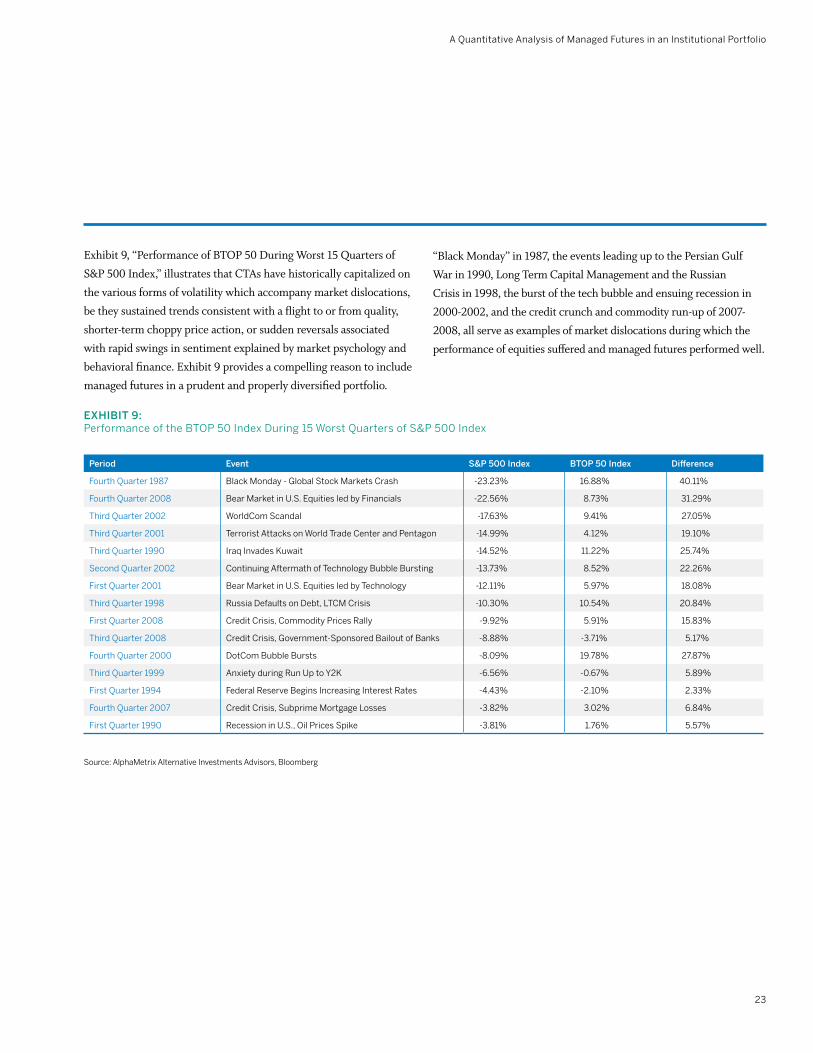
Exhibit 9, “Performance of BTOP 50 During Worst 15 Quarters of S&P 500 Index,” illustrates that CTAs have historically capitalized on the various forms of volatility which accompany market dislocations, be they sustained trends consistent with a flight to or from quality, shorter-term choppy price action, or sudden reversals associated with rapid swings in sentiment explained by market psychology and behavioral finance. Exhibit 9 provides a compelling reason to include managed futures in a prudent and properly diversified portfolio.
“Black Monday” in 1987, the events leading up to the Persian Gulf War in 1990, Long Term Capital Management and the Russian Crisis in 1998, the burst of the tech bubble and ensuing recession in 2000-2002, and the credit crunch and commodity run-up of 2007-2008, all serve as examples of market dislocations during which the performance of equities suffered and managed futures performed well.
Exhibit 9: Performance of the BtOP 50 Index During 15 worst Quarters of s&P 500 Index
Period Event S&P 500 index btOP 50 index Difference
Fourth Quarter 1987 Black Monday - Global stock Markets Crash -23.23% 16.88% 40.11%
Fourth Quarter 2008 Bear Market in u.s. Equities led by Financials -22.56% 8.73% 31.29%
third Quarter 2002 worldCom scandal -17.63% 9.41% 27.05%
third Quarter 2001 terrorist Attacks on world trade Center and Pentagon -14.99% 4.12% 19.10%
third Quarter 1990 Iraq Invades kuwait -14.52% 11.22% 25.74%
second Quarter 2002 Continuing Aftermath of technology Bubble Bursting -13.73% 8.52% 22.26%
First Quarter 2001 Bear Market in u.s. Equities led by technology -12.11% 5.97% 18.08%
third Quarter 1998 Russia Defaults on Debt, LtCM Crisis -10.30% 10.54% 20.84%
First Quarter 1990 Recession in u.s., Oil Prices spike -3.81% 1.76% 5.57%
source: AlphaMetrix Alternative Investments Advisors, Bloomberg
cmegroup.com
24
BTOP 50 vs. S&P 500’s Worst 5 Drawdowns since 1987BTOP 50 Index
60%
40%
20%
0%
-20%
-40%
-60%
S&P 500 Index
8/00 - 9/02
8/87 - 11/87
5/90 - 10/90
6/98 - 8/98
-42.16%
-46.28%
38.97%
-15.57%-15.84%
-30.17%
8.46%5.42%
13.79%
10/07 - 11/08
12.38%
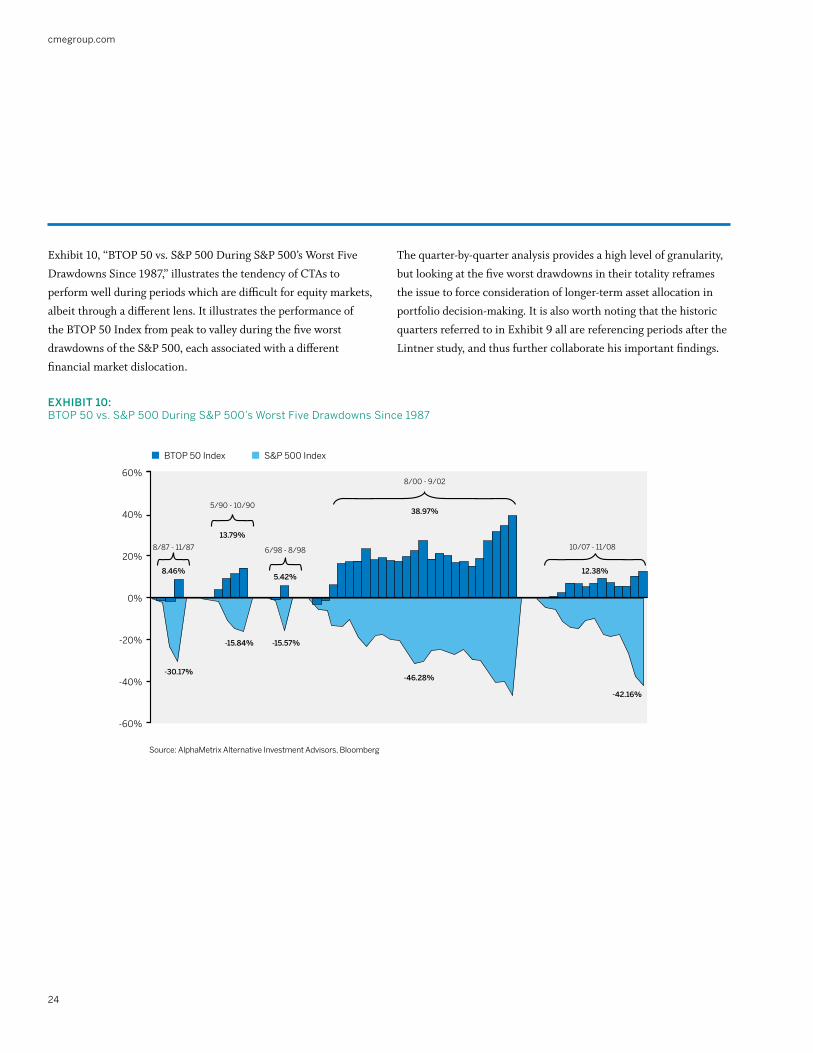
Exhibit 10: BtOP 50 vs. s&P 500 During s&P 500’s worst Five Drawdowns since 1987
Exhibit 10, “BTOP 50 vs. S&P 500 During S&P 500’s Worst Five Drawdowns Since 1987,” illustrates the tendency of CTAs to perform well during periods which are difficult for equity markets, albeit through a different lens. It illustrates the performance of the BTOP 50 Index from peak to valley during the five worst drawdowns of the S&P 500, each associated with a different financial market dislocation.
The quarter-by-quarter analysis provides a high level of granularity, but looking at the five worst drawdowns in their totality reframes the issue to force consideration of longer-term asset allocation in portfolio decision-making. It is also worth noting that the historic quarters referred to in Exhibit 9 all are referencing periods after the Lintner study, and thus further collaborate his important findings.
source: AlphaMetrix Alternative Investment Advisors, Bloomberg
A Quantitative Analysis of Managed Futures in an Institutional Portfolio
25
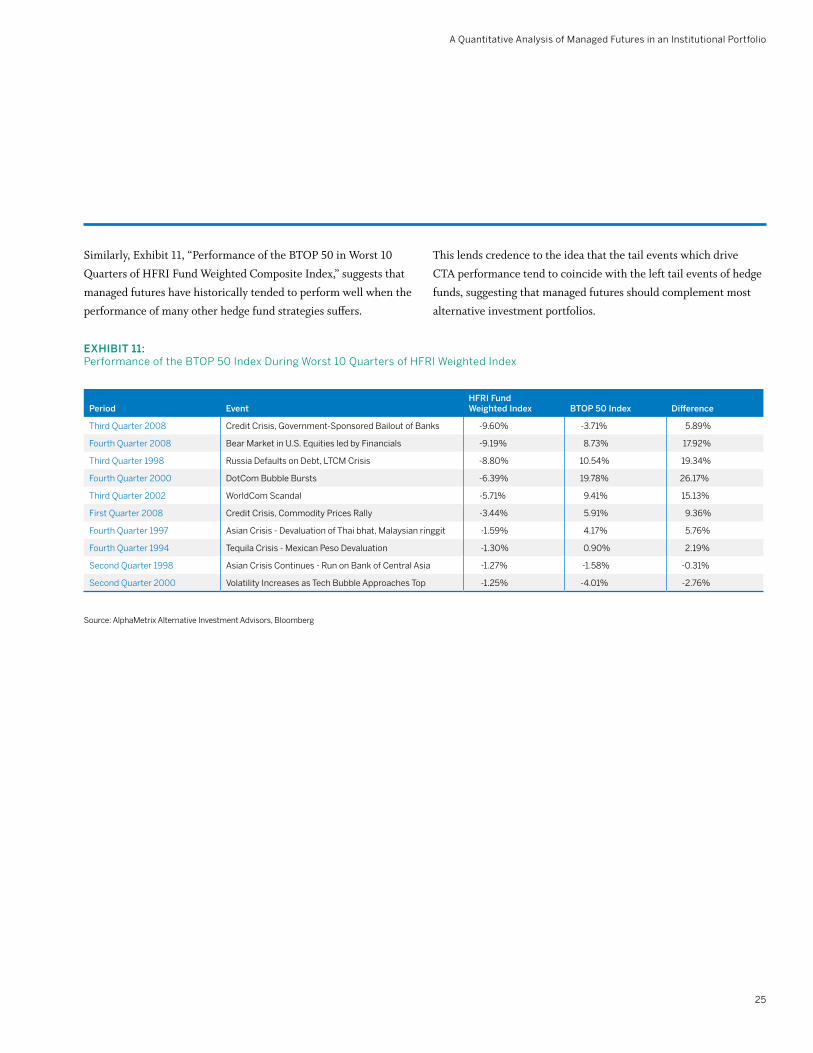
Exhibit 11: Performance of the BtOP 50 Index During worst 10 Quarters of HFRI weighted Index
Similarly, Exhibit 11, “Performance of the BTOP 50 in Worst 10 Quarters of HFRI Fund Weighted Composite Index,” suggests that managed futures have historically tended to perform well when the performance of many other hedge fund strategies suffers.
This lends credence to the idea that the tail events which drive CTA performance tend to coincide with the left tail events of hedge funds, suggesting that managed futures should complement most alternative investment portfolios.
source: AlphaMetrix Alternative Investment Advisors, Bloomberg
Period EventhFRi Fund Weighted index btOP 50 index Difference
third Quarter 2008 Credit Crisis, Government-sponsored Bailout of Banks -9.60% -3.71% 5.89%
Fourth Quarter 2008 Bear Market in u.s. Equities led by Financials -9.19% 8.73% 17.92%
third Quarter 1998 Russia Defaults on Debt, LtCM Crisis -8.80% 10.54% 19.34%
second Quarter 1998 Asian Crisis Continues - Run on Bank of Central Asia -1.27% -1.58% -0.31%
second Quarter 2000 volatility Increases as tech Bubble Approaches top -1.25% -4.01% -2.76%
cmegroup.com
26
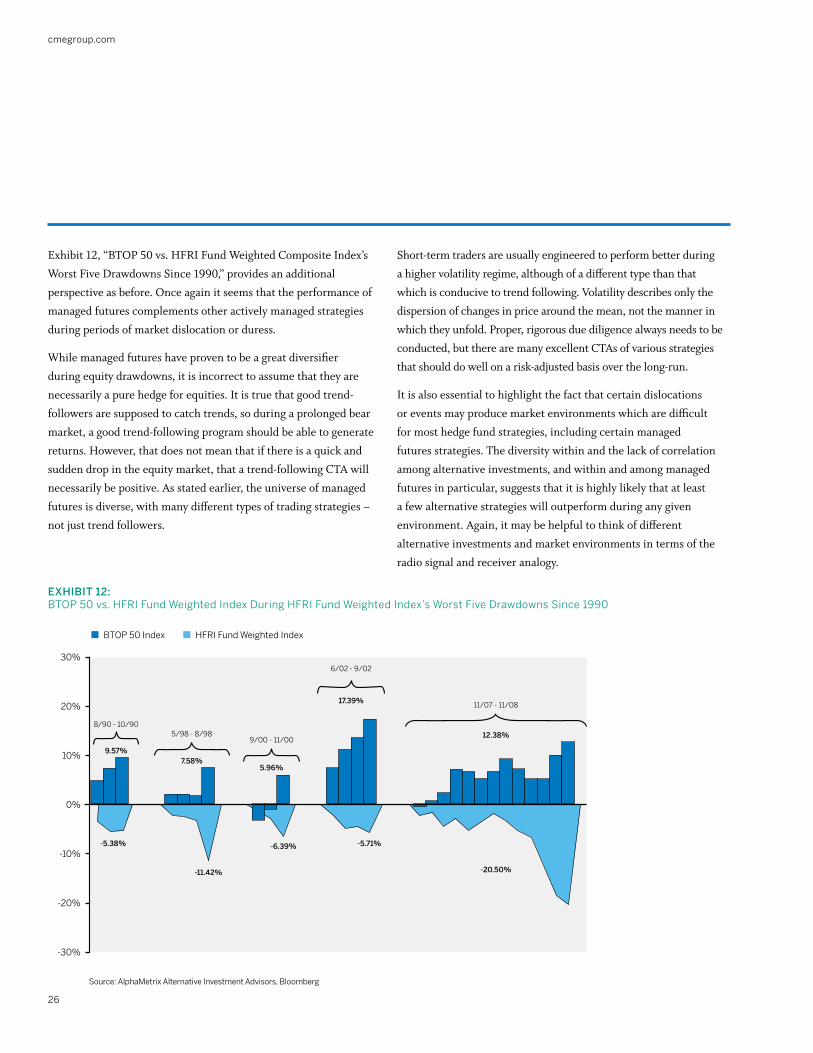
Exhibit 12: BtOP 50 vs. HFRI Fund weighted Index During HFRI Fund weighted Index’s worst Five Drawdowns since 1990
BTOP 50 vs. S&P 500’s Worst 5 Drawdowns since 1987BTOP 50 Index
30%
20%
10%
0%
-10%
-20%
-30%
HFRI Fund Weighted Index
6/02 - 9/02
11/07 - 11/08
8/90 - 10/905/98 - 8/98
17.39%
12.38%
-20.50%
-5.71%
9.57%7.58%
-5.38%
-11.42%
9/00 - 11/00
5.96%
-6.39%
Short-term traders are usually engineered to perform better during a higher volatility regime, although of a different type than that which is conducive to trend following. Volatility describes only the dispersion of changes in price around the mean, not the manner in which they unfold. Proper, rigorous due diligence always needs to be conducted, but there are many excellent CTAs of various strategies that should do well on a risk-adjusted basis over the long-run.
It is also essential to highlight the fact that certain dislocations or events may produce market environments which are difficult for most hedge fund strategies, including certain managed futures strategies. The diversity within and the lack of correlation among alternative investments, and within and among managed futures in particular, suggests that it is highly likely that at least a few alternative strategies will outperform during any given environment. Again, it may be helpful to think of different alternative investments and market environments in terms of the radio signal and receiver analogy.
Exhibit 12, “BTOP 50 vs. HFRI Fund Weighted Composite Index’s Worst Five Drawdowns Since 1990,” provides an additional perspective as before. Once again it seems that the performance of managed futures complements other actively managed strategies during periods of market dislocation or duress.
While managed futures have proven to be a great diversifier during equity drawdowns, it is incorrect to assume that they are necessarily a pure hedge for equities. It is true that good trend-followers are supposed to catch trends, so during a prolonged bear market, a good trend-following program should be able to generate returns. However, that does not mean that if there is a quick and sudden drop in the equity market, that a trend-following CTA will necessarily be positive. As stated earlier, the universe of managed futures is diverse, with many different types of trading strategies – not just trend followers.
source: AlphaMetrix Alternative Investment Advisors, Bloomberg
A Quantitative Analysis of Managed Futures in an Institutional Portfolio
27
Managed futures provide an additional source of uncorrelated absolute return that complements other alternative investment strategies by demonstrating a proclivity for outperformance during periods which tend to be difficult for many other actively managed investments.
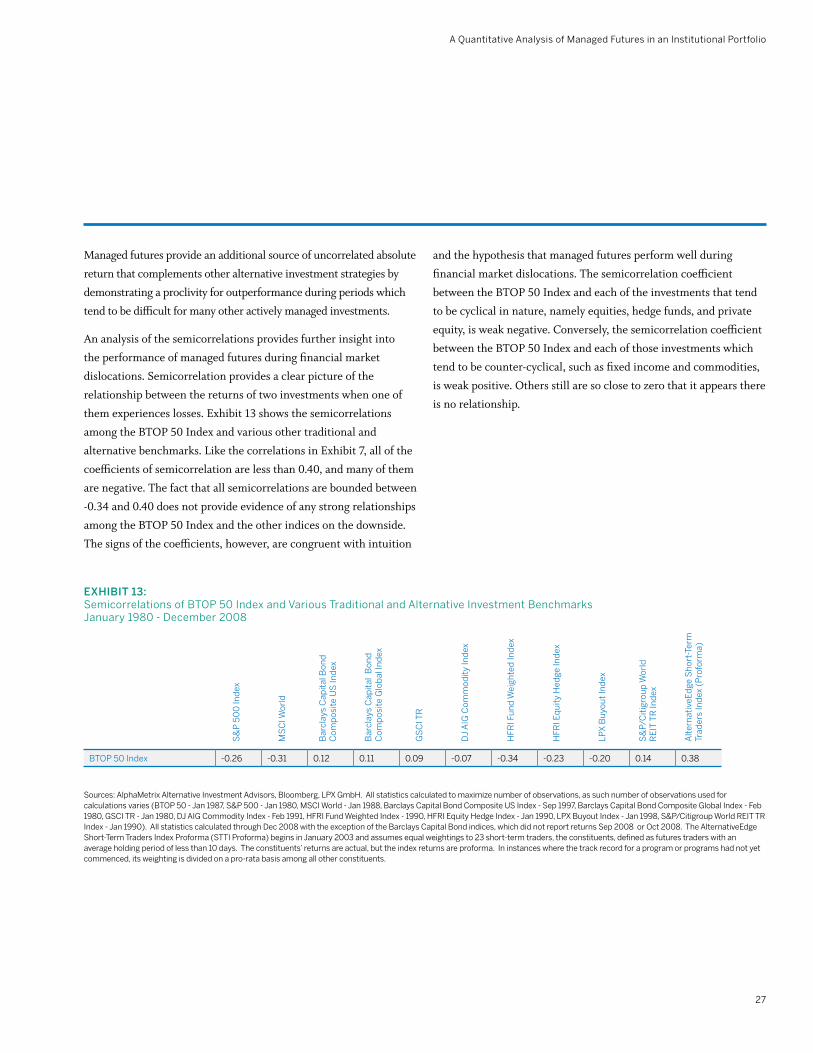
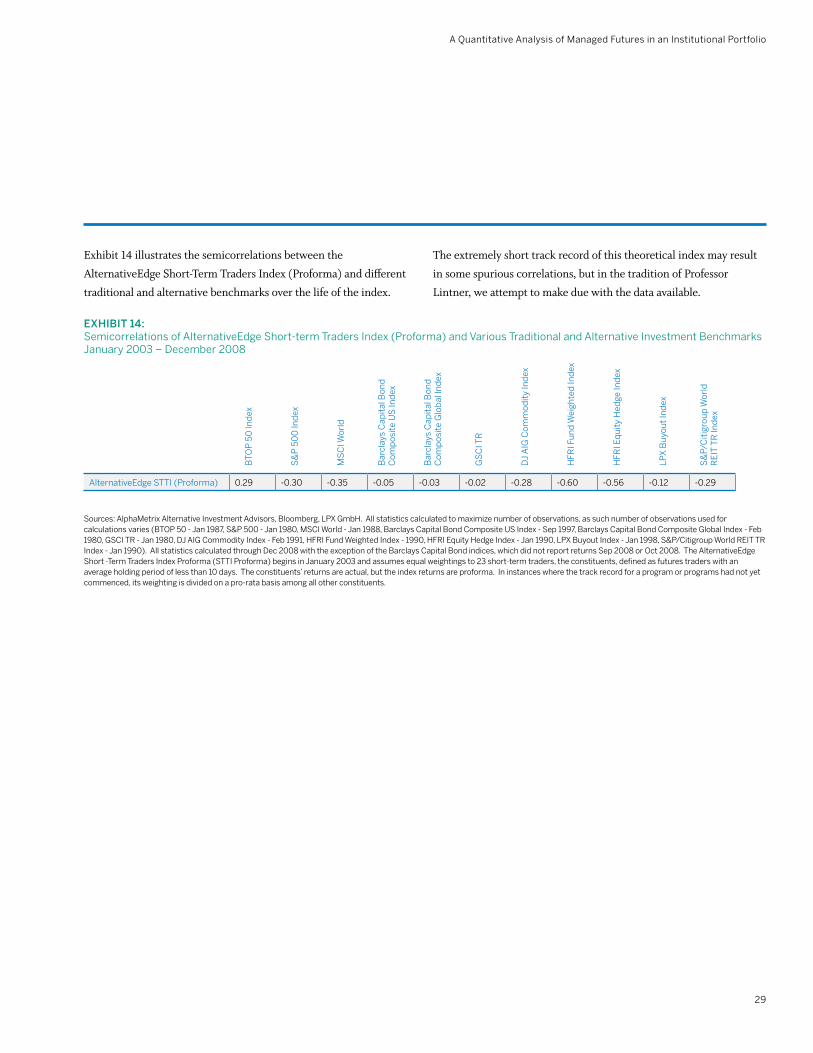
An analysis of the semicorrelations provides further insight into the performance of managed futures during financial market dislocations. Semicorrelation provides a clear picture of the relationship between the returns of two investments when one of them experiences losses. Exhibit 13 shows the semicorrelations among the BTOP 50 Index and various other traditional and alternative benchmarks. Like the correlations in Exhibit 7, all of the coefficients of semicorrelation are less than 0.40, and many of them are negative. The fact that all semicorrelations are bounded between -0.34 and 0.40 does not provide evidence of any strong relationships among the BTOP 50 Index and the other indices on the downside. The signs of the coefficients, however, are congruent with intuition
and the hypothesis that managed futures perform well during financial market dislocations. The semicorrelation coefficient between the BTOP 50 Index and each of the investments that tend to be cyclical in nature, namely equities, hedge funds, and private equity, is weak negative. Conversely, the semicorrelation coefficient between the BTOP 50 Index and each of those investments which tend to be counter-cyclical, such as fixed income and commodities, is weak positive. Others still are so close to zero that it appears there is no relationship.
Exhibit 13: semicorrelations of BtOP 50 Index and various traditional and Alternative Investment BenchmarksJanuary 1980 - December 2008
sources: AlphaMetrix Alternative Investment Advisors, Bloomberg, LPX GmbH. All statistics calculated to maximize number of observations, as such number of observations used for calculations varies (BtOP 50 - Jan 1987, s&P 500 - Jan 1980, MsCI world - Jan 1988, Barclays Capital Bond Composite us Index - sep 1997, Barclays Capital Bond Composite Global Index - Feb 1980, GsCI tR - Jan 1980, DJ AIG Commodity Index - Feb 1991, HFRI Fund weighted Index - 1990, HFRI Equity Hedge Index - Jan 1990, LPX Buyout Index - Jan 1998, s&P/Citigroup world REIt tR Index - Jan 1990). All statistics calculated through Dec 2008 with the exception of the Barclays Capital Bond indices, which did not report returns sep 2008 or Oct 2008. the AlternativeEdge short-term traders Index Proforma (sttI Proforma) begins in January 2003 and assumes equal weightings to 23 short-term traders, the constituents, defined as futures traders with an average holding period of less than 10 days. the constituents’ returns are actual, but the index returns are proforma. In instances where the track record for a program or programs had not yet commenced, its weighting is divided on a pro-rata basis among all other constituents.
cmegroup.com
28
The lack of strong negative semicorrelation with cyclical investments provides further evidence that a managed futures strategy is not a portfolio hedge. The weak negative semicorrelation, however, may suggest that managed futures do offer an uncorrelated investment style that tends to perform well during financial market dislocations; rolling analysis may provide deeper insight into this question.
Paradoxically, the tremendous diversity of trading styles and methodologies within managed futures and the lack of correlation among many of them does not appear to preclude them from sharing a penchant for most kinds of volatility or apparent resistance to it. Trend following conjures up the archetypal image of the long gamma strategy that thrives during financial market dislocations, but trading managers across the entire space tend to generate strong performance in difficult environments for other investments. The tendency toward high correlation among trend followers suggests that investors can typically maximize the benefits to their portfolios with a small number of them. Other managed futures strategies, however, successfully exploit the sustained massive flows of capital that create trends in different ways, resulting in distinct and uncorrelated returns profiles. Still others exploit altogether distinct phenomena that tend to accompany financial market dislocations or are independent of them.
Discretionary macro traders who utilize the liquid, transparent futures markets to express their views tend to capture many of the same sustained capital flows as trend followers. Unlike trend followers, however, these trading managers retain the flexibility to quickly reduce risk or reverse their positions, often resulting in completely unique and uncorrelated returns for their investors. Other discretionary CTAs focus on relative value relationships or on a niche market or sector which may not be sensitive to global systematic events. As such, these trading managers often generate strong returns during shocks or dislocations to the system and display non-correlated properties to trend followers and other investments.
Short-term traders thrive on many kinds of volatility, including the sustained variety that generates trends, but also on choppy, range-bound activity and rapidly shifting volatility regimes where volatility of volatility is high. Other short-term traders appear to generate returns independent of volatility or the prevailing volatility regime. The highly flexible nature of short-term traders enables them to quickly reposition themselves within rapidly changing market environments. As such, they often perform very well during market dislocations since they adapt quickly to take advantage of the opportunities these shock events present.
A Quantitative Analysis of Managed Futures in an Institutional Portfolio
29
Exhibit 14 illustrates the semicorrelations between the AlternativeEdge Short-Term Traders Index (Proforma) and different traditional and alternative benchmarks over the life of the index.
Exhibit 14: semicorrelations of AlternativeEdge short-term traders Index (Proforma) and various traditional and Alternative Investment Benchmarks January 2003 – December 2008
The extremely short track record of this theoretical index may result in some spurious correlations, but in the tradition of Professor Lintner, we attempt to make due with the data available.
sources: AlphaMetrix Alternative Investment Advisors, Bloomberg, LPX GmbH. All statistics calculated to maximize number of observations, as such number of observations used for calculations varies (BtOP 50 - Jan 1987, s&P 500 - Jan 1980, MsCI world - Jan 1988, Barclays Capital Bond Composite us Index - sep 1997, Barclays Capital Bond Composite Global Index - Feb 1980, GsCI tR - Jan 1980, DJ AIG Commodity Index - Feb 1991, HFRI Fund weighted Index - 1990, HFRI Equity Hedge Index - Jan 1990, LPX Buyout Index - Jan 1998, s&P/Citigroup world REIt tR Index - Jan 1990). All statistics calculated through Dec 2008 with the exception of the Barclays Capital Bond indices, which did not report returns sep 2008 or Oct 2008. the AlternativeEdge short -term traders Index Proforma (sttI Proforma) begins in January 2003 and assumes equal weightings to 23 short-term traders, the constituents, defined as futures traders with an average holding period of less than 10 days. the constituents’ returns are actual, but the index returns are proforma. In instances where the track record for a program or programs had not yet commenced, its weighting is divided on a pro-rata basis among all other constituents.
cmegroup.com
30
BENEFIts tO INstItutIONAL INvEstORs
Managed futures provide institutional investors with a variety of liquid, transparent investment programs that do not exhibit correlation to traditional or alternative investments, and oftentimes, one another. Though not a hedge, they often provide robust performance in unfavorable environments for equities and most alternative investments. The exchange-listed nature of the underlying instruments traded facilitates risk management and mitigates many of the dangers associated with model risk. Additionally, institutional investors who access the space via separately managed accounts substantially minimize operational risks and the possibility of fraud, maintain custody of assets, and have access to full transparency of positions. This section attempts to shed insight into other intrinsic features of managed futures which enable institutional investors to capitalize on these desirable characteristics.
One of the unique advantages managed futures offer institutional investors is the ability to notionally fund investments, allowing investors to efficiently deploy cash to gain increased exposure or for allocation elsewhere in the portfolio. Due to the low margin requirements for most futures contracts, only a small fraction of the cash deposited at the manager’s futures commission merchant is deployed as margin for trading. The remainder sits in cash equivalent instruments, earning interest and serving as a reserve in the event of trading losses.
Rather than allowing cash to sit idle, many futures investors prefer to deploy part of this cash to increase their trading level and notional exposure. For instance, if an investor buys a theoretical futures contract with a notional value of $100,000 and a margin requirement of $10,000, $10,000 will be deployed as margin and $90,000 will remain in cash. If the investor chooses to do so, he could double his notional exposure from $100,000 to $200,000 by posting an additional $10,000 as margin on the purchase of a second futures contract. The investor now holds a notional position of $200,000 on his $100,000 cash. This position will be able to withstand losses of 40 percent before all of the investor’s cash is consumed, triggering a margin call (a 40 percent loss on two $100,000 contracts equals $80,000. Any losses surpassing this level would dip below the margin requirement on this position of $20,000).
A Quantitative Analysis of Managed Futures in an Institutional Portfolio
31
Exhibit 15: Managed Futures Alpha Overlay - How It works
The liquidity and transparency of these instruments tremendously facilitates risk management since the notional exposure, margin usage, and prices of the instruments are all known. The risk manager can therefore easily determine and monitor portfolio risk.
The low margin requirements of futures contracts in effect allow for free leverage. Whereas leverage typically involves borrowing funds or instruments at LIBOR plus a spread, the only cost associated with leverage via notional funding is the opportunity cost of interest income foregone on the idle cash. Aside from utilizing idle cash to increase notional exposure, many investors choose to reallocate it to other parts of their portfolio, effectively allowing them to create an alpha overlay for a relatively small fraction of the total investment capital, as explained in Exhibit 15. Strategies like this allow for substantial increases in portfolio diversification for a relatively small cash outlay.
Many institutional investors also appreciate the fact that managed futures offer favorable 60 percent long-term, 40 percent short-term capital gains tax treatment, despite the fact that the holding period for the underlying instruments is typically less than what would qualify as “long-term” under U.S. tax laws.
The question of asset-liability mismatch is an important consideration for many institutional investors, particularly those who manage pension funds, endowments, or otherwise meet recurring obligations by making periodic payments. The liquidity of managed futures and other highly liquid hedge fund strategies alleviates asset-liability mismatch, allowing institutional investors for whom it is an issue to mitigate the effects of illiquid investments elsewhere in their portfolio. In the event that the investor needed to suddenly liquidate assets to meet an unanticipated obligation, it could easily do so from this part of its book without foregoing the opportunity to attain absolute returns.
Initial Capital100%
Managed Futures 10% Cash
Managed Futures 10% Notional 2X
(posted as margin)
Managed Futures 10% Cash
(held at FCM/Prime Broker)
Managed Futures Alpha Overlay Portfolio
110% Notional Exposure
Fund Investments90% Cash
• Beginwithinitialcapitaloutlay(100%).
• Invest10%ofthecashinmanagedfutures.Sincefuturesrequire only a small cash deposit, it is easy and prudent to use notional funding to increase exposure to the managed futures componentto20%.
Managed futures have evolved tremendously since the first iterations of long-term trend following in the late 1940s. Advances in technology, computing power, and telecommunications have opened up heretofore inconceivable possibilities in futures trading, not only for quantitative or systematic managers, but also for niche and discretionary experts whose access to critical information has been facilitated by these developments.
Quantitative scientists and researchers have been able to apply highly technical and sophisticated methods to the markets for the first time since the clean, high quality data which they require has only recently become available at accessible prices. Short-term traders are scouring tick databases which took years to build for persistent statistical aberrations whose exploitation has been made possible by the meteoric ascent of electronic markets and decreased transactions costs. Short-term traders are at the frontiers of interfacing trading with technology. Trend following has emerged from its naive, primarily rules-based beginnings to a highly sophisticated group of strategies whose ability to generate robust returns has been enhanced, while more closely controlling risk and drawdown. Some trend followers employ armies of scientists and mathematicians, and have formed alliances with top universities. If these developments are any indication, the future of managed futures is bright and incredible opportunities lay ahead for the next generation of traders and investors alike.
CTAs of all persuasions offer institutional investors virtually limitless potential sources of uncorrelated returns to enhance the diversification of portfolios. The fact that managed futures strategies as a whole have historically performed well in environments that tend to be difficult for most other investments provides additional benefits to portfolios.
While it is important to remember that managed futures are not
a portfolio hedge, the mechanics of trend following, short-term trading, discretionary macro, and statistical pattern recognition explain their respective intrinsic proclivities for different kinds of volatile markets. The prolonged dislocation in the global financial markets of 2007 and 2008 serves as only the latest example in a canon of many.
While the growth of managed futures has been impressive, it has paled in comparison with that of other alternative investments (hedge funds that are non-managed futures, private equity, and real estate). There are hedge funds on the entire liquidity continuum between mutual funds and private equity funds, and managed futures should be regarded as liquid alpha, as opposed to the more limited characterization of simple trend follower. The space of managed futures is rich and fertile, with a very broad range of strategies and styles.
The liquidity and transparency of the underlying instruments substantially mitigate the hidden risks which often accompany investing in hedge funds and alternative investments. Price discovery takes place constantly in futures markets, and settlements on all futures contracts are determined by the various exchanges at the end of each trading day, facilitating the pricing of portfolios and the measurement and management of risk. The value of liquidity is often under-estimated, and the performance of hedge funds that trade illiquid instruments have under-performed hedge funds that have better liquidity terms [Bhaduri and Art, 2008].
Indeed one might argue that the space of managed futures has
A Quantitative Analysis of Managed Futures in an Institutional Portfolio
33
become so diverse with so many different types of risk-adjusted return possibilities to legitimately target, that it is perhaps questionable why anyone would invest in alternatives that have onerous lock-ups and trade illiquid or non-exchange traded instruments. A portfolio manager who is performing his or her fiduciary duty must justify that the investments that they are making are getting a proper liquidity premium. This in turn means that if they make an investment in an illiquid vehicle, then they are in essence stating that they could not have achieved that risk-adjusted return through more liquid investments in managed funds. The excellent breadth and liquidity of CTAs, or portfolios of CTAs, lends itself well as the engine of structured products. It is important to realize that due diligence is needed in selecting good CTAs. Like anything else, there are both good and bad CTAs, and only rigorous and proper due diligence will help to differentiate them.
The propensity of managed futures toward positively skewed distributions of returns also suggests that few trading programs are susceptible to the risk of infrequent, potentially catastrophic losses. The mean-variance framework and Sharpe ratio rarely capture these effects, suggesting that deep analysis of the higher statistical moments or the application of the Omega function present superior approaches to the assessment of investment performance, risk, and return.
As the institutional investment community reacquaints itself with managed futures – or as the case may well be, truly discovers it for the first time – it should consider it an eclectic amalgamation of liquid alpha strategies. Managed futures offers institutional investors actively managed exposure to a truly global and diversified array of liquid, transparent instruments. The returns of many of these do not display correlation and do not appear to be easily explained by traditional or alternative investments, and oftentimes, one another. Institutional investors should view managed futures not only as means to enhance portfolio diversification, but also as absolute return vehicles with intuitive risk management.
cmegroup.com
34
CONCLusION IN CONtEXt OF LINtNER
It is not without some trepidation that the objective of this paper was set—namely, a modern day Lintner paper. Dr. Lintner’s work concerning the role of managed futures in a portfolio is considered a classic.
The famous quote by Sir Isaac Newton, “If I have seen further it is only by standing on the shoulders of giants,” is in some sense an understatement for our particular case as Dr. Lintner laid out the entire road map.
It is remarkable just how solid Dr. Lintner’s argument has remained through the test of time. The inclusion of managed futures in an institutional portfolio leads to better risk-adjusted performance (either through the mean-variance framework, or through the more modern Omega analysis). The results are so compelling that the board of any institution, along with the portfolio manager, should be forced to articulate in writing their justification in not having an allocation to the liquid alpha space of managed futures.
It is also fitting that during the silver anniversary of Dr. Lintner’s fine work, it survived the ultimate litmus test through the historic financial meltdown of 2008. Managed futures have been one of the very few bright spots for investments (both alternative and traditional) during this recent crisis in the economy.
Indeed, one might argue that Dr. Lintner saved his very best work for last.
Acknowledgements the authors would like to thank Aleks kins, Dr. Paulo Machado, Charley Penna, and Dennis Zarr.
A Quantitative Analysis of Managed Futures in an Institutional Portfolio
35
REFERENCEs
1. Bhaduri, Ranjan and Bryon Kaneshige. “Risk Management – Taming the Tail.” Benefits and Pensions Monitor, December 2005.
2. Bhaduri, Ranjan and Christopher Art. “Liquidity Buckets, Liquidity Indices, Liquidity Duration, and their Applications to Hedge Funds.” Alternative Investment Quarterly, Second Quarter, 2008.
3. Bhaduri, Ranjan, Gunter Meissner and James Youn. “Hedging Liquidity Risk.” Journal of Alternative Investments, Winter 2007.
4. Bhaduri, Ranjan and Niall Whelan. “The Value of Liquidity” Wilmott Magazine, January 2008.
5. Burghardt, Galen et.al. “Correlations and Holding Periods: The research basis for the AlternativeEdge Short-Term Traders Index”. AlternativeEdge Research Note. Newedge Group, June 9, 2008.
6. Center for International Securities and Derivatives Markets (CISDM). “The Benefits of Managed Futures: 2006 Update.” Isenberg School of Management, University of Massachusetts, 2006.
7. Fischer, Michael S. and Jacob Bunge. “The Trouble with Trend Following.” Hedgeworld’s InsideEdge. November 20, 2007.
8. Keating, Con and William F. Shadwick. “A Universal Performance Measure.” The Finance Development Centre, 2002.
9. Lintner, John. “The Potential Role of Managed Commodity-Financial Futures Accounts (and/or Funds) in Portfolios of Stocks and Bonds.” The Handbook of Managed Futures: Performance, Evaluation & Analysis. Ed. Peters, Carl C. and Ben Warwick. McGraw-Hill Professional, 1996. 99-137.
10. Ramsey, Neil and Aleks Kins. “Managed Futures: Capturing Liquid, Transparent, Uncorrelated Alpha.” The Capital Guide to Alternative Investment. ISI Publications, 2004. 129-135.
*All charts, graphs, statistics, and calculations were generated using data from Bloomberg, the Barclays Capital Alternative Investment Database, LPX GmbH, and Manager Reported Returns.
IR229/20/0609
Futures trading is not suitable for all investors, and involves the risk of loss. Futures are a leveraged investment, and because only a percentage of a contract’s value is required to trade, it is possible to lose more than the amount of money deposited for a futures position. therefore, traders should only use funds that they can afford to lose without affecting their lifestyles. And only a portion of those funds should be devoted to any one trade because they cannot expect to profit on every trade.
“Dow Jones-AIG Commodity Index” is a registered trademark or service mark of Dow Jones & Company, Inc. and American International Group, Inc. (AIG). MsCI® is a trademark of MsCI, used under license. “s&P®” and “s&P 500®“ are trademarks of the McGraw-Hill Companies, Inc., used under license.
CME Group is a trademark of CME Group Inc. the Globe logo, CME, Chicago Mercantile Exchange and Globex are trademarks of Chicago Mercantile Exchange Inc. CBOt and Chicago Board of trade are trademarks of the Board of trade of the City of Chicago. NyMEX and New york Mercantile Exchange are trademarks of New york Mercantile Exchange Inc. All other trademarks are the property of their respective owners. the information within this brochure has been compiled by CME Group for general purposes only. CME Group assumes no responsibility for any errors or omissions. Additionally, all examples in this brochure are hypothetical situations, used for explanation purposes only, and should not be considered investment advice or the results of actual market experience. All matters pertaining to rules and specifications herein are made subject to and are superseded by official CME, CBOt and NyMEX rules. Current rules should be consulted in all cases concerning contract specifications.