66
Managed Lanes White Paper I-405 Congestion Relief and Bus Rapid Transit Projects Prepared: 2004 Updated: April 2007

Managed Lanes White Paper
I-405 Congestion Relief and Bus Rapid Transit Projects
Prepared: 2004 Updated: April 2007

Contact Information
Patty Rubstello, P.E. Traffic Policy Engineer Washington State Department of Transportation, Urban Corridors Office 425-450-2720 [email protected]
Craig Stone, Urban Corridors Deputy Administrator Washington State Department of Transportation, Urban Corridors Office 206-464-1200 [email protected]
Developed by:
Joseph Bervell, HNTB Daniel Frey, WSDOT Bill Love, HDR Jerry Lu, PTG Todd S. Merkens, WSDOT* Ed Regan, Wilbur Smith Associates Patty Rubstello, P.E., WSDOT* Don Samdahl, Mirai Associates Cissy Szeto, Wilbur Smith Associates Mohammad Uddin, PTG Karl Westby, Ph.D., Westby Consulting*
*Authors
I-405 Managed Lanes White Paper Washington State Department of Transportation

Table of Contents WHAT IS THE PURPOSE OF THIS REPORT? ....................................................................................................1
I-405 EIS IDENTIFIED MANAGED LANES AS A POSSIBILITY.........................................................................................1 LEGISLATIVE INTENT FOR MANAGED LANES IN 2005 AND 2007 SESSIONS .................................................................1 HOV LANES NO LONGER PROVIDE INTENDED SERVICE ..............................................................................................1 CURRENT INVESTMENTS IN THE CORRIDOR CAN INFLUENCE MANAGED LANES OPTIONS............................................2 STANDING READY BY DETERMINING WHICH MANAGED LANES CONFIGURATION MAKES SENSE FOR I-405 ................2
WHAT ARE MANAGED LANES AND WHAT ARE THEIR BENEFITS?........................................................2
Exhibit 1: Express Toll Lanes on State Route 91 in Orange County, California, which has been in operation for over 10 years. .................................................................................................................................................2
HOW DO MANAGED LANES WORK?..................................................................................................................3
WHAT PRICED MANAGED LANE PROJECTS ARE ALREADY UNDERWAY?..........................................3
RESULTS OF EXISTING PRICED MANAGED LANES PROJECTS........................................................................................3 FUTURE PRICED MANAGED LANES FACILITIES AROUND THE COUNTRY ......................................................................3
Exhibit 2: Existing and Proposed Priced Managed Lane Facilities across the U.S. ...........................................4
WHAT MANAGED LANES EFFORTS ARE UNDERWAY IN WASHINGTON? ............................................4
SR 167 HOT LANES PILOT PROJECT .........................................................................................................................4 STATEWIDE TOLLING STUDY.....................................................................................................................................5
WHAT IS THE CURRENT HOV SITUATION ON I-405?....................................................................................5
CONFIGURATION........................................................................................................................................................5 TIME-OF-DAY RESTRICTIONS.....................................................................................................................................5 ISSUES WITH CURRENT I-405 HOV OPERATIONS .......................................................................................................6
Exhibit 3: Congested Segments on Corridors That Do Not Meet the Performance Standard (2004)..................7 Exhibit 4: I-405 HOV Lanes Southbound During the Peak Hour of the Morning Commute from Kirkland .......8 Exhibit 5: I-405 HOV Lanes Southbound During the Peak Hour of the Afternoon Commute to Renton.............9
ISSUES WITH THE CURRENT I-405 GENERAL PURPOSE OPERATIONS................................................10
Exhibit 6: Percent of throughput lost due to delay on Puget Sound freeways with loop detectors....................10
WHAT IS THE LONG-RANGE VISION FOR I-405?..........................................................................................10
IMPLEMENTATION PRINCIPLES .................................................................................................................................11 FUTURE CONSIDERATION OF MANAGED LANES ON I-405 .........................................................................................11 MAXIMIZE THROUGHPUT BY MOVING TRAFFIC ........................................................................................................11
Exhibit 7: Managed Lanes can Maintain Highway Performance......................................................................12 WHAT CONFIGURATIONS WERE ASSUMED IN THIS ANALYSIS? .................................................................................13
Exhibit 8: I-405 Implementation Plan................................................................................................................14 Exhibit 9: I-405 Managed Lane Access Points ..................................................................................................15
HOW WOULD MANAGED LANES ON I-405 WORK?......................................................................................15
DRIVING ON I-405 PRICED MANAGED LANES ...........................................................................................................16 Exhibit 10: Rendering of inline priced managed lane access point with 1 ML and 2 GP..................................16 Exhibit 11: Birds-eye-view of 2ML/3GP at an inline managed lanes access point ...........................................17
ENFORCEMENT OF MANAGED LANES ON I-405.........................................................................................................17
WHAT MANAGED LANES OPTIONS WERE STUDIED?................................................................................17
Exhibit 12: Managed Lanes Options Considered ..............................................................................................18 PROS AND CONS OF MANAGED LANES OPTIONS........................................................................................................18
Exhibit 13: Preliminary Evaluation of Managed Lanes Configuration Alternatives .........................................19 OPTIONS NOT STUDIED FURTHER .............................................................................................................................19 OPTIONS STUDIED IN GREATER DETAIL ....................................................................................................................19
HOW WAS PERFORMANCE OF THE MANAGED LANES ANALYZED? ...................................................20
I-405 Managed Lanes White Paper Washington State Department of Transportation
TRAFFIC DEMAND FORECASTS .................................................................................................................................20 TOLLED SCENARIO FORECASTS ................................................................................................................................20 OPERATIONAL ANALYSIS .........................................................................................................................................21 ANALYSIS REFINEMENT/FEEDBACK .........................................................................................................................21
WHAT DID THE PEAK HOUR ANALYSIS SHOW? .........................................................................................21
2014 AM PEAK HOUR/PEAK DIRECTION RESULTS ....................................................................................................21 Exhibit 14: 2014 AM Peak Hour Results: Southbound at NE 124th St. (Kirkland) ............................................21 Exhibit 15: 2014 AM Peak Hour Results: Northbound at NE Park Drive (Renton) ..........................................23
2014 PM PEAK HOUR/PEAK DIRECTION RESULTS .....................................................................................................24 Exhibit 16: 2014 PM Peak Hour Results: Northbound at NE 124th St. (Kirkland)............................................24 Exhibit 17: 2014 PM Peak Hour Results: Southbound at NE Park Drive (Renton) ..........................................25
OTHER 2014 AND 2030 RESULTS .............................................................................................................................25
HOW DID THE OVERALL SYSTEM PERFORM? ............................................................................................26
Exhibit 18: Vehicles and People Served in 2014 during the Morning and Afternoon Peak Hour in both Peak and Off-Peak Directions at Screenlines and Kirkland and Renton....................................................................26 Exhibit 19: Vehicles and People Served in 2030 during the Morning and Afternoon Peak Hour in both Peak and Off-Peak Directions at Screenlines and Kirkland and Renton....................................................................27
OTHER SYSTEM PERFORMANCE CONSIDERATIONS ...................................................................................................27 A NOTE ON HOV/HOT RELIABILITY .......................................................................................................................27
WHAT FINDINGS DOES THIS ANALYSIS SUGGEST?...................................................................................28
FACTORS TO CONSIDER WHEN COMPARING SCENARIOS ...........................................................................................28 I-405 MANAGED LANES ARE NOT A TOOL FOR TO GENERATE REVENUE....................................................................28
APPENDIX 1 – METHODOLOGY...................................................................................................................... A-1
APPENDIX 2 – USE OF HOV LANES OVER TIME........................................................................................ A-3
APPENDIX 3 – PERFORMANCE OF MANAGED LANE CONFIGURATION OPTIONS ........................ A-6
APPENDIX 4 – TOLLING REVENUES ........................................................................................................... A-31
APPENDIX 5 – BIBLIOGRAPHY ..................................................................................................................... A-34
I-405 Managed Lanes White Paper Washington State Department of Transportation

I-405 Managed Lanes White Paper Washington State Department of Transportation
What is the purpose of this report? As part of the 2002 I-405 Corridor Environmental Impact Statement (EIS) and subsequent Federal Record of Decision (ROD), the I-405 Team was charged with studying the possibility of incorporating “managed lanes” into future improvements along the 30-mile I-405 corridor. This white paper describes what managed lanes are, how they work, why they might be valuable on I-405, and scenarios that could improve the overall movement of vehicles and people along the corridor.
The principal motivators for preparing this report are as follows:
I-405 EIS identified managed lanes as a possibility In 1999 the Washington State Department of Transportation (WSDOT) began a 20-year planning effort for I-405, the major beltway freeway for Seattle, Washington’s Eastside. A Federal ROD and preferred alternative through a corridor program EIS was completed in the fall of 2002. In the I-405 EIS, priced managed lanes were identified as a possible piece of the strategy for congestion relief. I-405 program committees recommended a four-foot painted buffer between the general purpose lanes and the High Occupancy Vehicles (HOV) lane which also would allow for future consideration of managing up to two lanes in each direction. They recognized the need for further analysis and policy considerations of managed lanes beyond the corridor EIS process. The committees considered pricing a regional policy decision.
Legislative intent for managed lanes in 2005 and 2007 sessions The Washington State Legislature passed Senate Bill 6091 during the 2005 session that called for managed lanes to be considered along I-405: “The legislature intends that tolls be charged to offset or partially offset the costs for…widening of Interstate 405 including a managed lanes concept.” This same bill also enacted the Washington Transportation Commission to complete a statewide study to examine tolling around Washington State. Learn more on the statewide study’s website: http://www.wstc.wa.gov/Tolling/
During the 2007 session the Washington State Legislature passed House Bill 1094 which also included intent for managed lanes on I-405: “the legislature intends that tolls be charged to offset or partially offset the costs for the following projects, and that a managed lane concept be applied in their design and implementation:…widening of Interstate 405.”
HOV lanes no longer provide intended service High Occupancy Vehicle lanes have been common on major roadways around the Seattle area for some time. The reality now facing area travelers is that during peak times, many of the HOV facilities no longer operate better than the adjacent general purpose lanes. Today, buses and carpools are stuck in the rush hour congestion they are hoping to avoid by using HOV lanes. While HOV lanes still move more people than general purpose lanes since there are more passengers per vehicle, the number of vehicles in HOV lanes has increased to a point where these lanes are often no faster than normal lanes. Poor HOV lane performance also presents a challenge to transit providers, Commute Trip Reduction (CTR) efforts, and other Demand Management programs that depend on reliable travel in the HOV system.
Updated: April, 2007 1

I-405 Managed Lanes White Paper Washington State Department of Transportation
Current investments in the corridor can influence managed lanes options The I-405 project is moving forward with several improvements throughout the corridor as the result of recent legislative funding decisions. Some funded improvements may provide the opportunity to open managed lanes on stretches on I-405. If managed lanes are not put in place with currently funded improvements, the opportunity for managed lanes on these sections of I-405 may be significantly postponed. The timing of implementing managed lanes, therefore, may be critical.
Standing ready by determining which managed lanes configuration makes sense for I-405 This white paper is the next step in the process started in 2001 by the I-405 corridor EIS to analyze and refine how managed lanes could work along I-405. It assesses the performance of HOV and different managed lanes scenarios. Having this information in hand prepares WSDOT to discuss future possibilities to implement managed lanes and to make sure new investments on I-405 achieve a full return in performance.
Timing of decisions whether to implement managed lanes or not is important. In 2003 the Legislature funded $485 million in improvements on I-405; another $972 million was provided in 2005. The first three projects from this funding will all be under construction in 2007. To assess managed lanes options, the Environmental Assessment for improvements between Bellevue and Lynnwood is being analyzed with either an HOV lane or an Express Toll Lane system. Further information can be found online at: http://www.wsdot.wa.gov/Projects/i405/SR520toI5
What are managed lanes and what are their benefits? Managed lanes are strategies to maximize highway capacity by moving the most vehicles along a roadway while not letting lanes get clogged with congestion. To achieve this, managed lanes use
a combination of operation and design improvements. Managed lanes provide a reliable trip choice for travelers and, when operated in combination with general purpose lanes, can help minimize congestion across all lanes. Less congestion in the general purpose lanes means that all drivers benefit, regardless of whether they choose to take the managed lanes or the regular lanes.
Exhibit 1: Express Toll Lanes on State Route 91 in Orange County, California, which has been in operation for over 10 years.
More traditional forms of managed lane strategies familiar to Seattle area drivers include express lanes (such as those on I-5, north of Seattle) and HOV lanes. Newer managed lane concepts include priced High Occupancy Toll (HOT) lanes, truck-only lanes, and other various operational combinations. The existing HOV lanes along I-405 are one example of a managed
Updated: April, 2007 2

I-405 Managed Lanes White Paper Washington State Department of Transportation
lanes facility. This study assesses how changes to the I-405 HOV lanes would operate and their potential benefits.
How do managed lanes work? By assigning specific lane uses and requirements, operations can be implemented to move all traffic more quickly and move more people along a highway. For example, HOV lanes around the Seattle area limit access to certain classes of vehicles (carpools, buses, and motorcycles). Managed lanes can also employ different elements, like time of day restrictions, reversible lanes and electronic variable pricing, to assure lanes do not get clogged with congestion but still move as many vehicles as possible. Regardless of the specifics, managed lanes all aim to move the most people and vehicles as possible through a stretch of roadway.
What priced managed lane projects are already underway? Priced managed lanes projects have opened on several highways in the U.S., including: • Route 91 Express Lanes in Orange County, California • I-15 Express Lanes in San Diego, California • I-10 and US 290 Quick Ride Lanes in Houston, Texas • I-394 MnPass Express Lanes in Minneapolis, Minnesota • I-25 HOV/Express Lanes in Denver, Colorado • I-15 Express Lanes in Salt Lake City, Utah
In addition, demand management strategies using pricing have been implemented on several existing toll roads, bridges, and tunnels around the country. While the actual reason and scope of pricing may be different, all these facilities have implemented variable pricing to better manage the use of the facility. With variable pricing, the operators of these facilities charge a higher price when more people are using the facility, such as during morning or afternoon rush-hours, and a lower price at other times when demand is less. Variable pricing has proved an effective tool to keep roadways moving as fast as possible.
Results of existing priced managed lanes projects Some success stories from existing managed lanes facilities: • Commuters in Houston who use the Quick Ride lanes save between 12 and 22 minutes on
their trips, in each direction • After four years of operation, the increased use of the I-15 express lanes has resulted in
4,300 fewer vehicles per day in the general purpose lanes • Also in San Diego, surveys indicate that a majority of surveyed users and non-users of
the I-15 Express lanes feel this managed lanes system has reduced congestion along the corridor
• During peak periods in Orange County, the express toll lanes on SR 91 carry 40 percent of total corridor traffic, all at express speeds of 65 miles per hour
Future priced managed lanes facilities around the country With the success of established priced managed lane facilities, the concept is gaining favor throughout the nation, even in places that have not traditionally included tolls in their roadway operations. States where managed lanes are already operating, such as Texas and California, are
Updated: April, 2007 3
I-405 Managed Lanes White Paper Washington State Department of Transportation
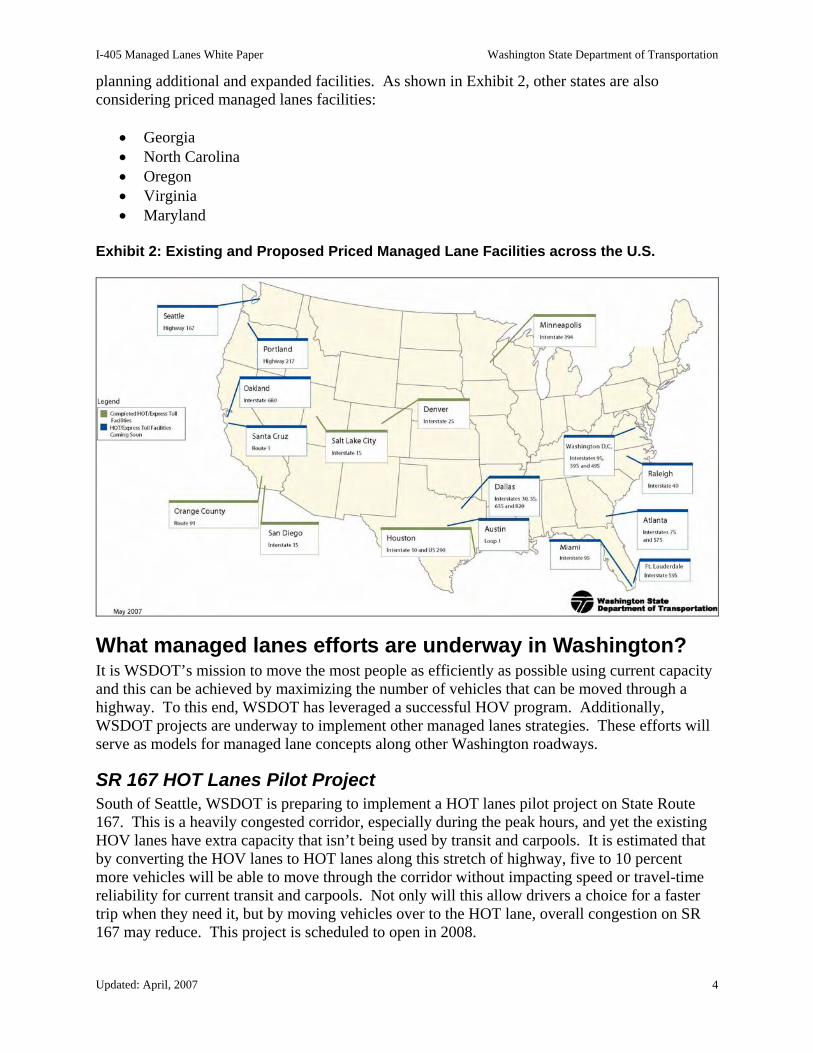
planning additional and expanded facilities. As shown in Exhibit 2, other states are also considering priced managed lanes facilities:
• Georgia • North Carolina • Oregon • Virginia • Maryland
Exhibit 2: Existing and Proposed Priced Managed Lane Facilities across the U.S.
What managed lanes efforts are underway in Washington? It is WSDOT’s mission to move the most people as efficiently as possible using current capacity and this can be achieved by maximizing the number of vehicles that can be moved through a highway. To this end, WSDOT has leveraged a successful HOV program. Additionally, WSDOT projects are underway to implement other managed lanes strategies. These efforts will serve as models for managed lane concepts along other Washington roadways.
SR 167 HOT Lanes Pilot Project South of Seattle, WSDOT is preparing to implement a HOT lanes pilot project on State Route 167. This is a heavily congested corridor, especially during the peak hours, and yet the existing HOV lanes have extra capacity that isn’t being used by transit and carpools. It is estimated that by converting the HOV lanes to HOT lanes along this stretch of highway, five to 10 percent more vehicles will be able to move through the corridor without impacting speed or travel-time reliability for current transit and carpools. Not only will this allow drivers a choice for a faster trip when they need it, but by moving vehicles over to the HOT lane, overall congestion on SR 167 may reduce. This project is scheduled to open in 2008.
Updated: April, 2007 4

I-405 Managed Lanes White Paper Washington State Department of Transportation
Statewide Tolling Study The Washington State Transportation Commission completed a statewide tolling study in response to the same legislation that asked I-405 and other projects to consider tolling and managed lanes. This statewide study aimed to identify where tolling could be effective in either relieving congestion or generating revenue to help pay for larger projects. The study found that: “the SR 167/I-405 concept, th[e] HOT lane idea can provide increased utilization of the highway corridor and provide people a meaningful travel choice and time savings.” More information can be found at: http://www.wstc.wa.gov/Tolling/default.htm
What is the current HOV situation on I-405? High occupancy vehicle lanes are designed to make Interstate 405 and other freeways more efficient. They maximize the number of people moving on the roadways and help maintain transit speed and reliability. HOV lanes help reduce demand for vehicle throughput by offering an attractive alternative to drive-alone commuting. WSDOT statistics show that HOV lanes move nearly a third of peak period freeway commuters in the Puget Sound area in only 15 percent of the vehicles. Washington State has invested more than $1.5 billion in state and federal dollars in HOV lanes, building approximately 200 lane-miles of a planned 300-mile core HOV system.
WSDOT adopted its current HOV policy on May 15, 1996. The objectives stated in that policy are:
• Improve the capability of congested freeway corridors to move more people by increasing the number of people per vehicle.
• Provide travel time savings and a more reliable trip time to high-occupancy vehicles that use the facilities.
• Provide safe travel options for high-occupancy vehicles without unduly affecting the safety of the freeway general purpose mainlines.
Configuration On I-405, one HOV lane in each direction operates the entire length of the 30-mile-long roadway. The leftmost lane in each direction is designated the HOV lane and is separated from the general purpose lanes by a solid white line. Vehicles that are allowed to use the HOV lane can enter or exit at any point. Signage indicates that the HOV lanes are for the use of buses, vehicles carrying two or more occupants, and motorcycles. Large trucks and vehicles pulling trailers are not allowed to use the HOV lanes. Many sections of the I-405 HOV system move an average of 15,000 vehicles each direction during a weekday. This is approximately 33,000 occupants on average.
Time-of-Day restrictions Until 2003, the HOV lanes were for the sole use of designated HOV users 24 hours a day. At the direction of the Washington Transportation Commission, WSDOT began a pilot project to open most HOV lanes on the east side of Lake Washington to single-occupant vehicles (SOVs) between 7 p.m. and 5 a.m. Interim results show that with the change, HOV performance during peak periods has been maintained, and freeway speeds during off-peak hours has not changed noticeably. Public perception of the HOV system, however, has improved since the change. As peak travel congestion increases in the future, it could soon grow beyond the time restrictions
Updated: April, 2007 5

I-405 Managed Lanes White Paper Washington State Department of Transportation
which could then negatively impact transit and carpools. WSDOT is in the process of determining whether to make the time-of-day change permanent.
Issues with current I-405 HOV operations
The system is breaking down in some areas.
Currently, some sections of the HOV lanes experience traffic congestion. As traffic volumes continue to grow, this congestion will worsen and ultimately restrict the flow in the HOV lanes. WSDOT performance policy calls for traffic in an HOV lane to maintain or exceed an average speed of 45 mph or greater for at least 90 percent of the time during peak hours. At this time, there are locations in the HOV system where the policy standard is not met.
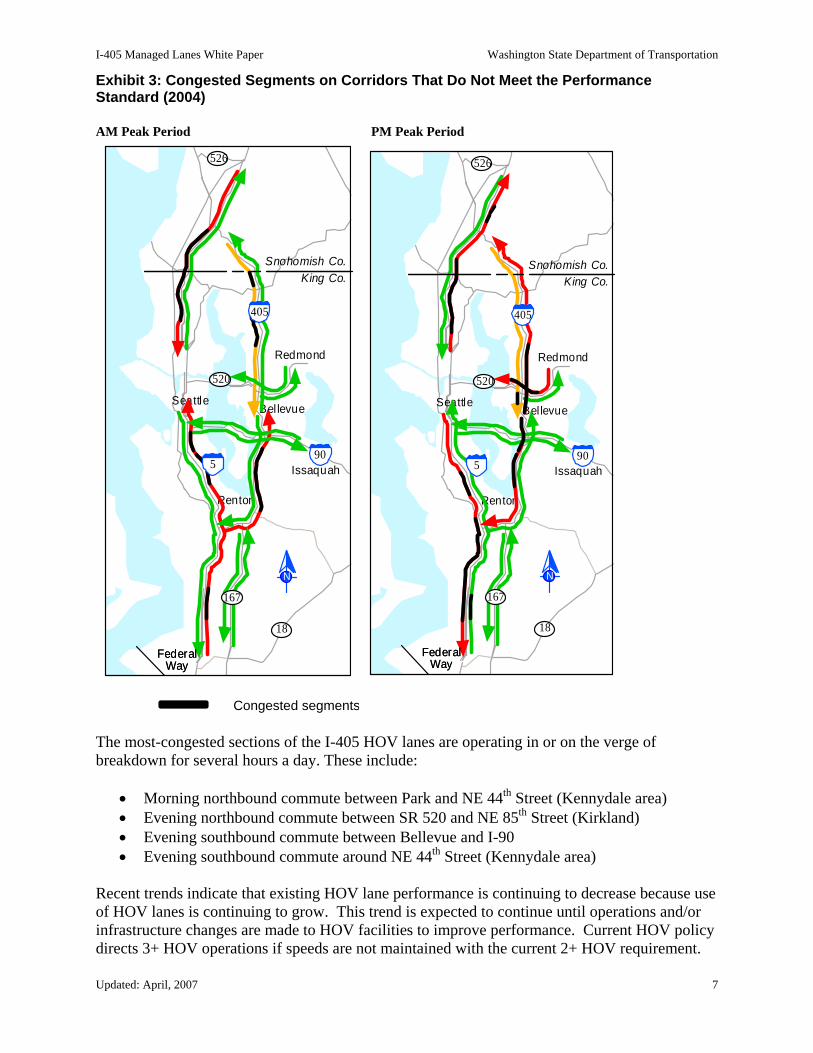
Exhibit 3 shows travel speeds on regional HOV lanes during the morning and afternoon peak periods. Green areas are free-flowing traffic, yellow indicates moderately heavy traffic, red indicates heavy traffic, and black areas show congested traffic. As traffic volumes continue to grow, HOV lane congestion will continue to worsen.
Updated: April, 2007 6
I-405 Managed Lanes White Paper Washington State Department of Transportation
Exhibit 3: Congested Segments on Corridors That Do Not Meet the Performance Standard (2004)
AM Peak Period PM Peak Period
Renton
Bel levue Seattle
Issaquah
Redmond
Federal Way
FederalWay
Snohomish Co. King Co.
N
5
405
520
90
167
526
18
Congested segments
Renton
Bel levue Seattle
Issaquah
Redmond
Federal Way
FederalWay
Snohomish Co. King Co.
N
5
405
520
90
167
526
18
The most-congested sections of the I-405 HOV lanes are operating in or on the verge of breakdown for several hours a day. These include:
• Morning northbound commute between Park and NE 44th Street (Kennydale area) • Evening northbound commute between SR 520 and NE 85th Street (Kirkland) • Evening southbound commute between Bellevue and I-90 • Evening southbound commute around NE 44th Street (Kennydale area)
Recent trends indicate that existing HOV lane performance is continuing to decrease because use of HOV lanes is continuing to grow. This trend is expected to continue until operations and/or infrastructure changes are made to HOV facilities to improve performance. Current HOV policy directs 3+ HOV operations if speeds are not maintained with the current 2+ HOV requirement.
Updated: April, 2007 7

I-405 Managed Lanes White Paper Washington State Department of Transportation
Exhibit 4: I-405 HOV Lanes Southbound During the Peak Hour of the Morning Commute from Kirkland
Exhibit 4 shows how average HOV peak hour volumes have increased over time in the Kirkland area during the morning commute. The growth in the number of HOV vehicles, while indicating success of the HOV lanes, is also a concern for maintaining their long-term performance. HOV lanes, like other lanes, can only accommodate so many vehicles before congestion slows traffic. The peak volumes in Exhibit 4 are close to the maximum throughput for an HOV lane, which is considered at about 1,800 vehicles per hour. If the trend in HOV lane vehicle growth continues, travel time performance in the HOV lane will decrease.
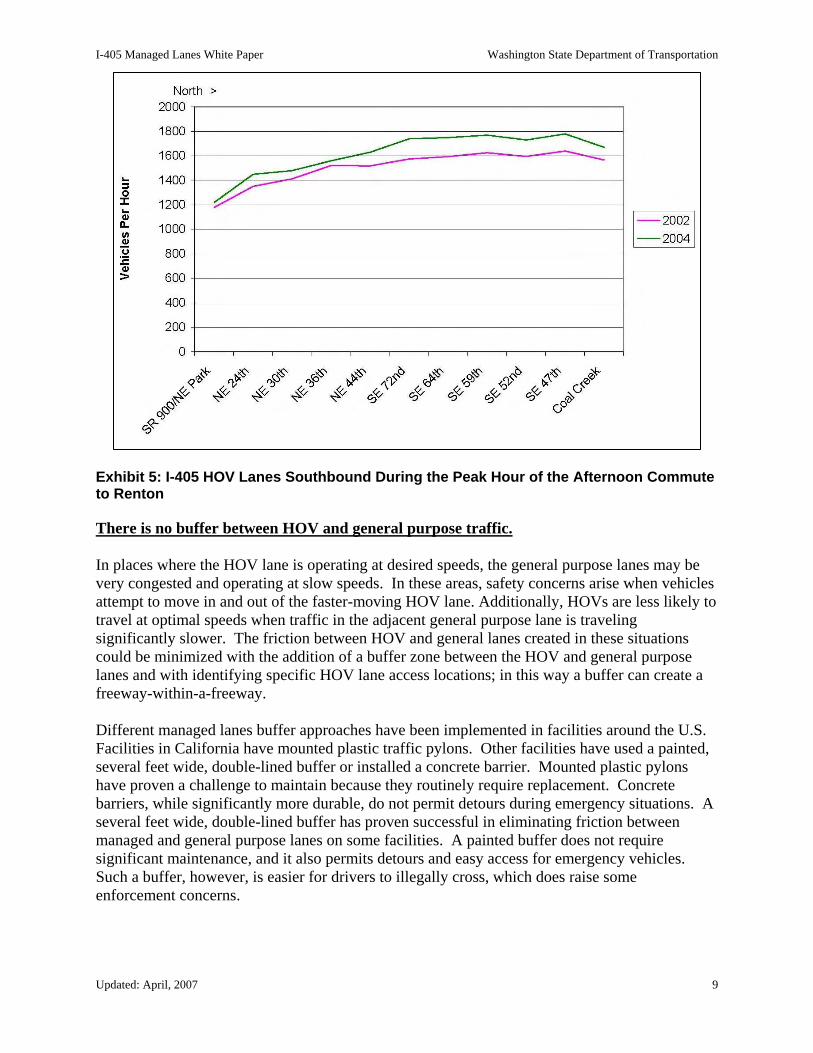
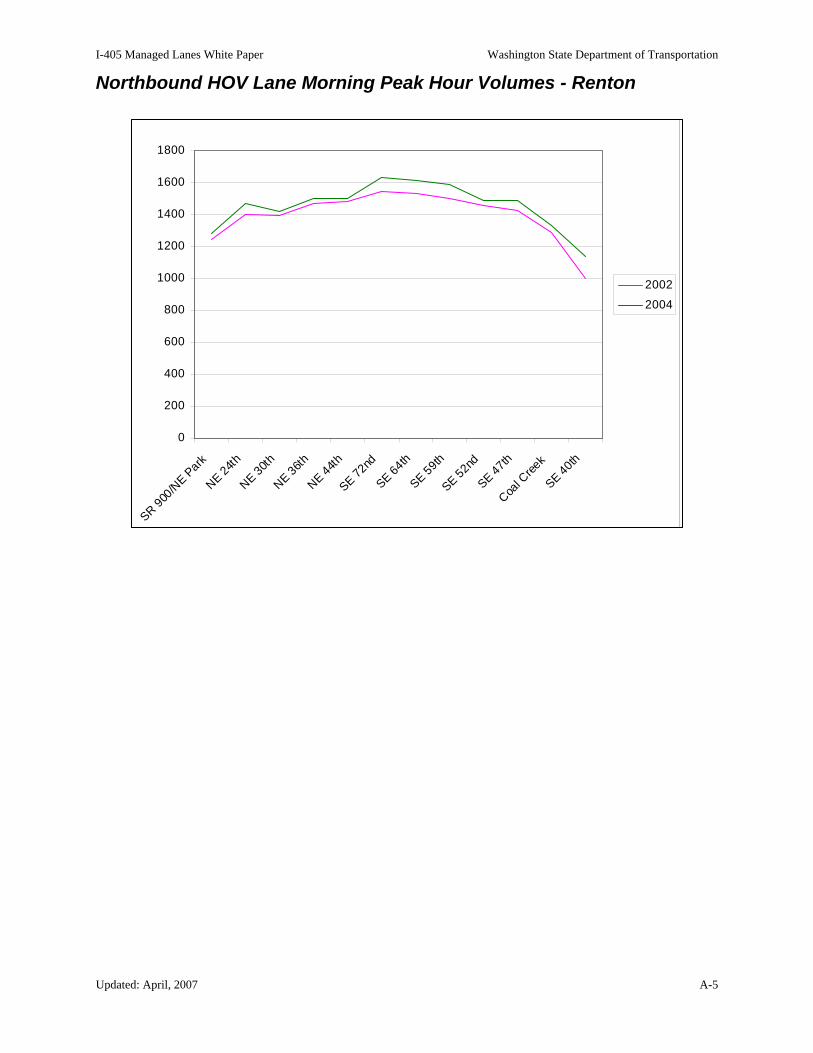
In the southern section of the I-405 corridor, use of the HOV lane has also increased. Exhibit 5 shows how average HOV peak hour volumes have increased over time between Bellevue and Renton during the afternoon commute. Like the northern section of I-405, the number of HOV vehicles is approaching, or already at, the maximum throughput for the lane. Further increases in HOV vehicle demand will decrease HOV lane service.
Appendix 2 has additional charts showing the growth of HOV use over time on I-405.
Updated: April, 2007 8
I-405 Managed Lanes White Paper Washington State Department of Transportation
Exhibit 5: I-405 HOV Lanes Southbound During the Peak Hour of the Afternoon Commute to Renton
There is no buffer between HOV and general purpose traffic.
In places where the HOV lane is operating at desired speeds, the general purpose lanes may be very congested and operating at slow speeds. In these areas, safety concerns arise when vehicles attempt to move in and out of the faster-moving HOV lane. Additionally, HOVs are less likely to travel at optimal speeds when traffic in the adjacent general purpose lane is traveling significantly slower. The friction between HOV and general lanes created in these situations could be minimized with the addition of a buffer zone between the HOV and general purpose lanes and with identifying specific HOV lane access locations; in this way a buffer can create a freeway-within-a-freeway.
Different managed lanes buffer approaches have been implemented in facilities around the U.S. Facilities in California have mounted plastic traffic pylons. Other facilities have used a painted, several feet wide, double-lined buffer or installed a concrete barrier. Mounted plastic pylons have proven a challenge to maintain because they routinely require replacement. Concrete barriers, while significantly more durable, do not permit detours during emergency situations. A several feet wide, double-lined buffer has proven successful in eliminating friction between managed and general purpose lanes on some facilities. A painted buffer does not require significant maintenance, and it also permits detours and easy access for emergency vehicles. Such a buffer, however, is easier for drivers to illegally cross, which does raise some enforcement concerns.
Updated: April, 2007 9

I-405 Managed Lanes White Paper Washington State Department of Transportation
Issues with the current I-405 general purpose operations
The system is breaking down over the entire 30-mile corridor.
Currently south of I-90, the I-405 corridor has two general purpose lanes in each direction; north of I-90 there are typically three general purpose lanes in each direction. The demand for these lanes far exceeds the available capacity for upwards of 12-14 hours each day in the south half, and 4-6 hours in the north half. Beyond having excess demand for the lanes, at the times lane capacity is needed most, congestion cuts throughput in half. Exhibit 6 shows the percent of throughput lost due to delay on highways around Puget Sound. This information tells us that on I-405 in Renton, congestion reduces the throughput of two general purpose lanes to the capacity of one free-flowing lane.
Exhibit 6: Percent of throughput lost due to delay on Puget Sound freeways with loop detectors
What is the long-range vision for I-405? Based on the EIS, key roadway improvements identified for the corridor in the I-405 Master Plan are:
• Add up to two additional lanes in each direction along the entire 30-mile length of I-405 • Add collector-distributor and auxiliary lanes • Improve interchanges • Improve connecting freeways and arterials • Expand capacity on and connections with parallel north-south arterials
In addition, the Master Plan identified significant new transit investments, including:
Updated: April, 2007 10

I-405 Managed Lanes White Paper Washington State Department of Transportation
• Addition of a new high-frequency bus rapid transit system serving I-405 and other transit centers within the neighboring communities
• A 70 percent increase in local transit service • New HOV direct-access ramps • New freeway-to-freeway HOV connections • Nine new transit centers • 5,000 new park-and-ride spaces • 1,700 new vanpools region-wide
Given that achieving the Master Plan’s significant goals would take 20 years or more and at a cost greater than $10 billion, the I-405 Executive Committee in 2003 approved a mid-term (10+ years) Implementation Plan with $4 billion in improvements (see Exhibit 8). This was identified as a logical intermediate investment goal and helped to set targets for state and regional funding.
Implementation principles A series of Implementation Principles was created to help guide the development of the Implementation Plan. They are:
• Fulfill the long-range Master Plan vision • Address the worst-performing traffic situations first • Finish complete, logical segments • Make investments throughout the corridor • Make investments that support multimodal balance • Achieve early actions • Implement environmental improvements at the start of projects • Minimize overall costs and risks • Minimize construction impacts to the public
Future consideration of managed lanes on I-405 As previously noted, incorporating managed lanes into an improved I-405 was identified during the corridor planning/EIS phase as one strategy to meet the long-range mobility needs of the corridor. The I-405 Executive Committee recommended this option be studied further. To guide this review, the I-405 Team developed a series of guiding principles, which in turn were based on the program’s overarching principles. These are:
• Move more people and vehicles • Increase corridor speeds • Increase mode splits • Minimize diversions to arterials or neighborhood streets • Provide mobility for freight
Maximize throughput by moving traffic The goal of implementing managed lanes on I-405 matches the guiding principles: to improve traffic flow and maximize the number of people who can use the roadway.
Updated: April, 2007 11

I-405 Managed Lanes White Paper Washington State Department of Transportation
To maximize the number of people who can use a roadway, there can be a fine line between high volume, free-flowing traffic and low volume, slow moving congestion. Exhibit 7 shows how speeds decrease as traffic volumes increase until the roadway reaches a tipping point where congestion forces speed and volumes to both decrease. At times when traffic exceeds about 2,000 vehicles per hour per lane, traffic flow can become unstable. When a freeway is operating under unstable conditions, covered by the yellow and red areas of the chart in Exhibit 7, factors such as additional vehicles trying to use the roadway, lane changing, merging vehicles, poor weather, roadway incidents, and overly aggressive driving can tip traffic flow into congestion. Once operations on a freeway are congested, slow speeds restrict the amount of traffic that can drive through a freeway section and the roadway has now lost efficiency. And once congestion starts, it can take some time for a roadway to flow freely again even once the reason for congestion is no longer a concern. Sometimes during periods of heavy congestion, less than half the existing capacity is effectively used at a time when it is needed most.
Managed lanes provide the opportunity to maximize traffic throughput by not allowing volumes to increase and become unstable and congested. Managed lane features that can help keep traffic moving include: buffer separation to reduce friction with adjacent lanes, limiting entry and exit points to specific locations, and allowing only certain classes of vehicles to use the lanes. Another feature to manage demand and maximize throughput is dynamic pricing. Dynamic pricing automatically changes to match the changing conditions of the freeway (in both the managed and non-managed lanes). When more vehicles enter into the managed lanes, the price will automatically increase. With a higher price, fewer additional vehicles will then enter the managed lanes. In this way, the system will keep the right balance of vehicles in the lane to keep traffic moving but not enough for the lanes to become congested.
Exhibit 7: Managed Lanes can Maintain Highway Performance
Updated: April, 2007 12

I-405 Managed Lanes White Paper Washington State Department of Transportation
What configurations were assumed in this analysis? Scenarios were developed for analysis based on an Implementation Plan level of investment in the I-405 corridor, as seen in Exhibit 8. Generally, this investment provides two additional lanes in each direction to the corridor between I-5 in Tukwila and SR 522 in Bothell. The new lanes were assumed to be either two general purpose (GP) lanes or one general purpose lane and one managed lane (ML). The 1-Managed Lane/4-General Purpose Lane (1ML/4GP) configuration, would operate as a buffer-separated HOV lane (or tolled managed lane), and four general purpose lanes in each direction; a freeway within a freeway. The 2ML/3GP configuration, would operate as two buffer-separated HOV lanes (or tolled managed lanes) and three general purpose lanes in each direction. Between SR 522 and I-5 in Lynnwood, no new capacity was modeled; however, the existing HOV lane would remain a managed lane and match the operation requirements for the rest of the corridor. All scenarios in this analysis assumed access in and out of the managed lanes would only occur at select locations, which are identified in Exhibit 9. The scenarios do not include HOV direct connector ramps at system interchanges with I-5 in Tukwila, I-90, SR 520, or I-5 in Lynnwood.
Updated: April, 2007 13

I-405 Managed Lanes White Paper Washington State Department of Transportation
Exhibit 8: I-405 Implementation Plan
Updated: April, 2007 14

I-405 Managed Lanes White Paper Washington State Department of Transportation
Exhibit 9: I-405 Managed Lane Access Points
Location Access
North of SR 181 Managed lane entrance/exit At SR 167 Freeway to freeway access At North 8th Street Direct access location North of SR 900 (Park Dr.) Managed lane entrance/exit North of 112th Avenue SE Managed lane entrance/exit At NE 6th Street Direct access location North of SR 520 Managed lane entrance/exit North of SR 908 (85th Street) Managed lane entrance/exit At NE 128th Street Direct access location North of NE 132nd Street Managed lane entrance/exit At NE 160th Street Direct access location North of NE 195th Street Managed lane entrance/exit At SR 522 Freeway to freeway access North of SR 527 Managed lane entrance/exit
How would managed lanes on I-405 work? Managed lanes on I-405 would be a freeway within a freeway, providing an express option to drivers and a reliable service for transit. Managed lanes could either be non-tolled, as the HOV lanes are today, or priced as a HOT lane. These lanes would be separated from general purpose traffic with a buffer, and access would be restricted to designed locations.
For non-tolled managed lanes, lane performance would be maintained by restricting access to certain vehicle classes. Today, that restriction in HOV lanes is passenger vehicles with a minimum of 2 or 3 occupants (depending on the facility), motorcycles, and transit. Limiting the allowed vehicle classes can keep performance at acceptable levels. However, over time the restrictions may need to change as, for example, more people carpool which can decrease lane performance.
A priced managed lane can take advantage of today’s electronic tolling technology and use dynamic pricing to manage the number of vehicles in the lanes and thus the lane’s performance. As congestion increases in general purpose lanes, for example, more drivers would want to pay to use express, managed lanes to reach their destination. However, as more drivers enter managed lanes, speeds in the managed lanes will drop. An electronic tolling system can recognize this increased traffic and automatically raise prices for the managed lanes which will lower how many more vehicles choose the managed lanes. This lane management can effectively maintain managed lanes speeds at 45 miles per hour or better, which maximizes the throughput of the lanes.
Updated: April, 2007 15

I-405 Managed Lanes White Paper Washington State Department of Transportation
With priced managed lanes single-occupant vehicles pay a toll while other vehicle classes can be toll-free. On the 91 Express Lanes in Orange County, California, for example, vehicles with 3 or more passengers are toll-free or offered a discounted price depending on the time of day; all other vehicles pay the posted toll rate. To move the most people and vehicles, toll exemptions and discounts for a priced managed lane can be set depending on the specifics of a facility.
Any tolling systems for priced managed lanes on I-405 would use electronic toll collection equipment exclusively, so there will be no toll booths. Drivers paying a toll will be required to have an electronic transponder device in their car. As they pass through designated managed lane “toll zones”, the transponder will be recorded and the toll will be electronically charged. Electronic tolling is proven technology, and is in place on every other operating HOT or priced managed lanes facility in the country, in addition to many toll highways and bridges around the world. The detailed operations of a toll collection system have not been included in this planning-level study, but will be completed in any future planning phases of the system.
Driving on I-405 priced managed lanes Before drivers decide to enter priced managed lanes, signs will post the current toll price. Drivers can decide whether to pay the toll and drive in the managed lanes (ML), or drive in the general purpose (GP) lanes. Drivers will be able to access managed lanes on I-405 from both direct access ramps and inline access points. Direct access ramps merge traffic directly into managed lanes from local streets. Inline access points allow drivers already on I-405 to enter the managed lanes from the GP lanes. On I-405, inline access points will be located in several locations to ensure easy access for drivers. Once on I-405, drivers will only be allowed to enter managed lanes at the specific inline access points.
Exhibit 10: Rendering of inline priced managed lane access point with 1 ML and 2 GP
Updated: April, 2007 16

I-405 Managed Lanes White Paper Washington State Department of Transportation
Exhibit 11: Birds-eye-view of 2ML/3GP at an inline managed lanes access point
To exit managed lanes on I-405, drivers will either take a direct access exit onto a local street, or an inline exit into the adjacent general purpose lanes. Where there are 2 ML, inline exit and entrance access points will be separated to maintain safety. With 1 ML, exit and entrance points can occur along the same stretch of roadway. WSDOT will identify inline entrance and exit points with dashed white lines. A buffer will separate general purpose traffic and managed lane traffic between entrance and exit access points; entering or exiting managed lanes between access points will be against the law and drivers can be sighted with a traffic violation.
Enforcement of managed lanes on I-405 Enforcement is an important element to ensure managed lanes work as intended. If drivers use the lanes without satisfying occupancy requirements or without paying a toll, WSDOT will not have limited ability to manage performance and maintain desired speeds in the managed lanes. Those who obeyed the rules would not benefit.
Enforcement of managed lanes would depend somewhat on operating policies of the managed lanes that have yet to be determined. In the short- to medium-term, it is likely that enforcement for any priced managed lanes would continue as visual inspection by law enforcement personnel, just as HOV lanes are monitored today. Over the longer-term, technologies may be available that will help automate the enforcement process.
What managed lanes options were studied? This report examines managed lanes options that are available within the context of the Implementation Plan (see Exhibit 8). As discussed previously, “managed lanes” is a broad term that encompasses many concepts, including traditional HOV lanes, express lanes, and priced lanes. For this report, the I-405 Team analyzed the following options:
• Number of lanes. Given the robust usage of the existing I-405 HOV lanes, the team considered the continuation of a single HOV lane in the future, as well as two HOV lanes in each direction. In both cases, the HOV lane(s) would be separated from general purpose lanes by a four-foot, double-lined buffer.
• Number of occupants. The team considered how a future managed lanes system would perform with the existing 2+ HOV designation, as well as increasing this to a 3+ HOV designation.
Updated: April, 2007 17

I-405 Managed Lanes White Paper Washington State Department of Transportation
• Time-of-day restrictions. The current time-of-day restrictions (HOV use between 5 a.m. and 7 p.m., with open usage allowed in other hours) were considered. Restriction changes to allow midday use by SOVs was not studied in this effort because it is beyond the scope of this document.
• Tolls. The effect of allowing lower occupancy vehicles to use the HOV lanes (also known as a toll buy-in) during times of sufficient available capacity was studied.
• Access control. Providing one or two HOV lanes, but limiting access to direct-access points and other select in-line access locations was studied.
This report analyzed combinations of these options to consider which managed lanes scenarios might work on the I-405 corridor.
Exhibit 12 shows the managed lane configurations considered for the I-405 corridor.
Exhibit 12: Managed Lanes Options Considered
ML: Managed Lanes, GP: General Purpose Lanes, Diamond: HOV Requirement
Pros and cons of managed lanes options Several of the configurations in Exhibit 12 do not meet the WSDOT HOV performance policy and/or would not have sufficient use of the managed lane(s). Exhibit 13 compares the alternatives based on these criteria.
Updated: April, 2007 18

I-405 Managed Lanes White Paper Washington State Department of Transportation
Exhibit 13: Preliminary Evaluation of Managed Lanes Configuration Alternatives
Options not studied further Four of the possible managed lanes alternatives did not meet the performance policy or did not have sufficient managed lane demand and were excluded from further study. These are:
1. The 1ML/4GP (2+ HOV) configuration is similar to the condition that exists today on I-405 where there is currently a single 2+ HOV lane and two general purpose lanes. As discussed earlier, today several sections of the corridor do not meet the WSDOT HOV performance policy so this is not a viable long term solution.
2. The 1ML/4GP (2+ HOT) configuration is also not viable, as the HOV performance policy is not met nor is there extra capacity for single occupant vehicles to buy into the managed lane.
3. The 2ML/3GP (3+ HOV) configuration does not have sufficient demand in the HOV lane to support the need for two HOV lanes with a 3+ HOV requirement. Because of the 3+ HOV designation, the two managed lanes would be mostly empty.
4. The 2ML/3GP (3+ HOT) configuration would keep traffic in the managed lanes moving at reliable speeds. From a traffic analysis standpoint, it was assumed that if the 2ML/3GP (2+ HOT) configuration operated sufficiently, this configuration with a 3+ HOT would work as well. For this reason, traffic analysis of this configuration was not completed. Revenue results were completed for this configuration and can be found Appendix 4.
Options studied in greater detail The remaining options were studied in greater detail as part of this report. These options include:
Updated: April, 2007 19

I-405 Managed Lanes White Paper Washington State Department of Transportation
1. 1ML/4GP (3+ HOV) – This alternative changes the minimum occupancy requirements for travel in the HOV lane from two-or-more to three-or-more occupants. This reduces demand in the lane as compared to today in order to keep it free-flowing.
2. 1ML/4GP (3+ HOT) – This alternative is similar to the 3+ HOV designation above, but also allows vehicles with one- and two-occupants to buy their way into the lane. The use of dynamic pricing would allow for management of the lane to maximize throughput and maintain performance.
3. 2ML/3GP (2+ HOV) – This alternative keeps the current HOV lane designation, and adds one more managed lane. Because there is excess demand in today’s HOV lanes, the second HOV lane would improve performance by providing additional HOV capacity.
4. 2ML/3GP (2+ HOT) – This alternative keeps the current HOV occupancy requirements, but adds a second managed lane and allows tolled single-occupant vehicles to use excess capacity in the lanes to maximize throughput. Performance goals will be maintained through the use of dynamic pricing.
How was performance of the managed lanes analyzed? The study of managed lanes improvements to the I-405 corridor involved detailed analysis of forecasted traffic conditions using the regional travel demand model. The results from this process were fed into a microsimulation operations model to test the performance of the corridor under the various conditions. See Appendix 1 for more information.
Traffic demand forecasts Year 2014 and 2030 volume forecasts of demand for the I-405 corridor were generated based on refined Puget Sound Regional Council (PSRC) 2010 and 2030 models. The refined models include a detailed configuration of all the interchanges along the I-405 Corridor, as well as refined volume-delay functions. Travel demand forecasts were developed separately for the morning peak period, a midday period, and the afternoon peak period.
Tolled scenario forecasts Once the total corridor demand was established, a second level of forecasting was conducted. For each of the HOT (priced managed lane) scenarios analyzed, a series of sensitivity tests were conducted using specialized pricing models to estimate the price level at which a sufficient number of single-occupant vehicles would use the managed lanes on I-405 without degrading operations in the managed lanes. The tolled traffic estimates are based on drivers’ willingness to pay to save travel time. To maximize usage of the managed lanes, estimated toll rates for 2014 range from $0.05 to $0.20 per mile, depending on the managed lanes configuration. These toll rates translate to between $4.7 million to $11.2 million in annual revenue. This assumes that about 15 percent of the vehicles using the managed lanes would pay. For more detailed toll and revenue information, see Appendix 4.
In the analysis, the price charged to single- and/or two-occupant vehicles (depending on the scenario) to drive in managed lanes was compared to the time savings offered by the managed lanes to develop a ratio of cost-per-minute of travel time saved. There is a wide range of willingness-to-pay among drivers, which can vary by situation and by time-of-day. For each
Updated: April, 2007 20
I-405 Managed Lanes White Paper Washington State Department of Transportation
individual trip, drivers who value their time at a level greater than the cost-per-minute-saved would tend to choose the managed lanes. Conversely, drivers who value their time at a level less than the cost-per-minute-saved would tend to choose a toll-free option, in this case the general purpose lanes. The tolling model looked at the entire day to develop price amounts, rather than the operational analysis below, which considered only the peak period.
As traffic moves from the general purpose lanes to the managed lanes, the travel time in the general purpose lanes improves and time savings advantage offered by the managed lanes would be altered. This would result in slightly less traffic willing to pay a price since the time savings for managed lanes has been lowered. For each toll rate level, the pricing model attempted to find an equilibrium point between time savings and drivers’ willingness to pay tolls to save time.
Operational analysis Once the forecasting of traffic in the managed lanes was complete for the four scenarios, a detailed operational analysis of the I-405 Corridor was conducted. VISSIM microsimulation model software was used to conduct the analysis. This microsimulation model has the ability to represent physically separated managed lane operations and their interaction with the general purpose lanes. The model also has the ability to assign different vehicle classes separately and can assign traffic on a continuous path from their entry into the system to their exit from the system. The I-405 corridor model assigned trucks, single-occupant, 2+ HOV and 3+ HOV vehicles separately.
A 30-mile corridor model was developed that included the general purpose lanes, managed lanes, direct access connections, service interchanges, system interchanges, managed lane access points and ramp metering. The model focused on peak period operations.
Analysis refinement/feedback For the I-405 corridor, an additional feedback loop between the operational analysis and the tolling forecasts was used to help refine the sensitivity of the pricing model to the effects on time savings as traffic shifts between the general purpose lanes and managed lanes. This information was transferred between the models in the form of customized speed vs. volume-to-capacity curves developed through a series of runs using the Vissim model.
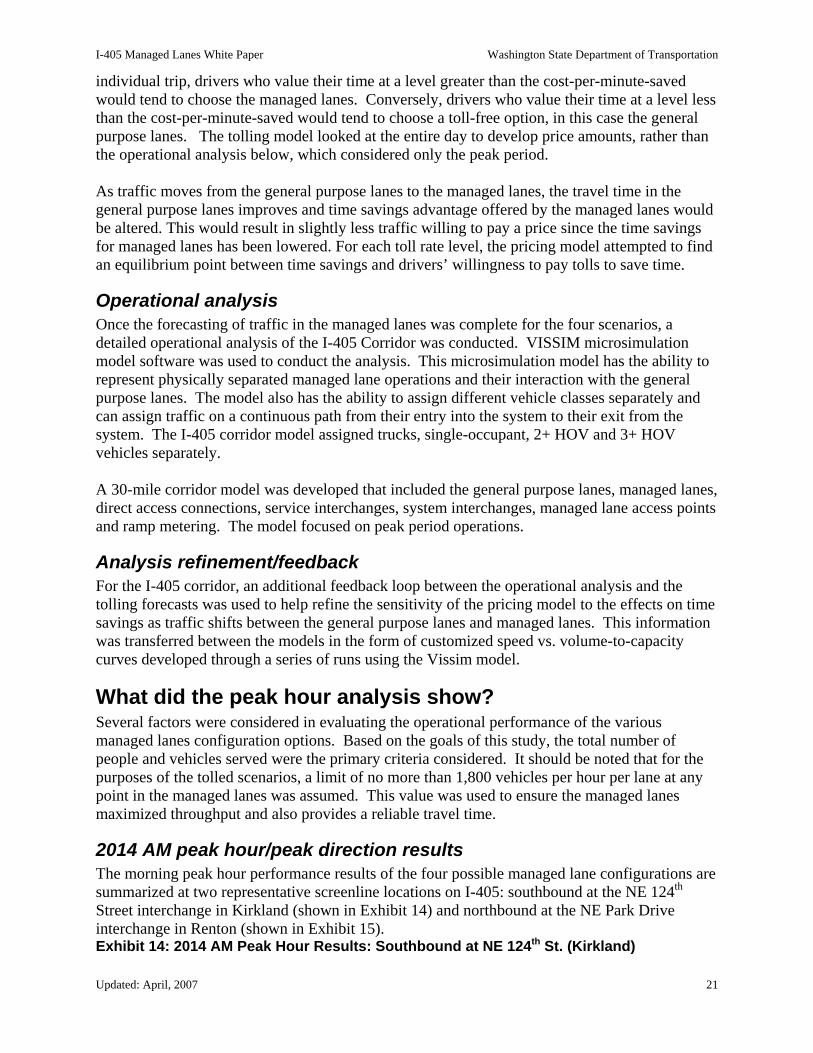
What did the peak hour analysis show? Several factors were considered in evaluating the operational performance of the various managed lanes configuration options. Based on the goals of this study, the total number of people and vehicles served were the primary criteria considered. It should be noted that for the purposes of the tolled scenarios, a limit of no more than 1,800 vehicles per hour per lane at any point in the managed lanes was assumed. This value was used to ensure the managed lanes maximized throughput and also provides a reliable travel time.
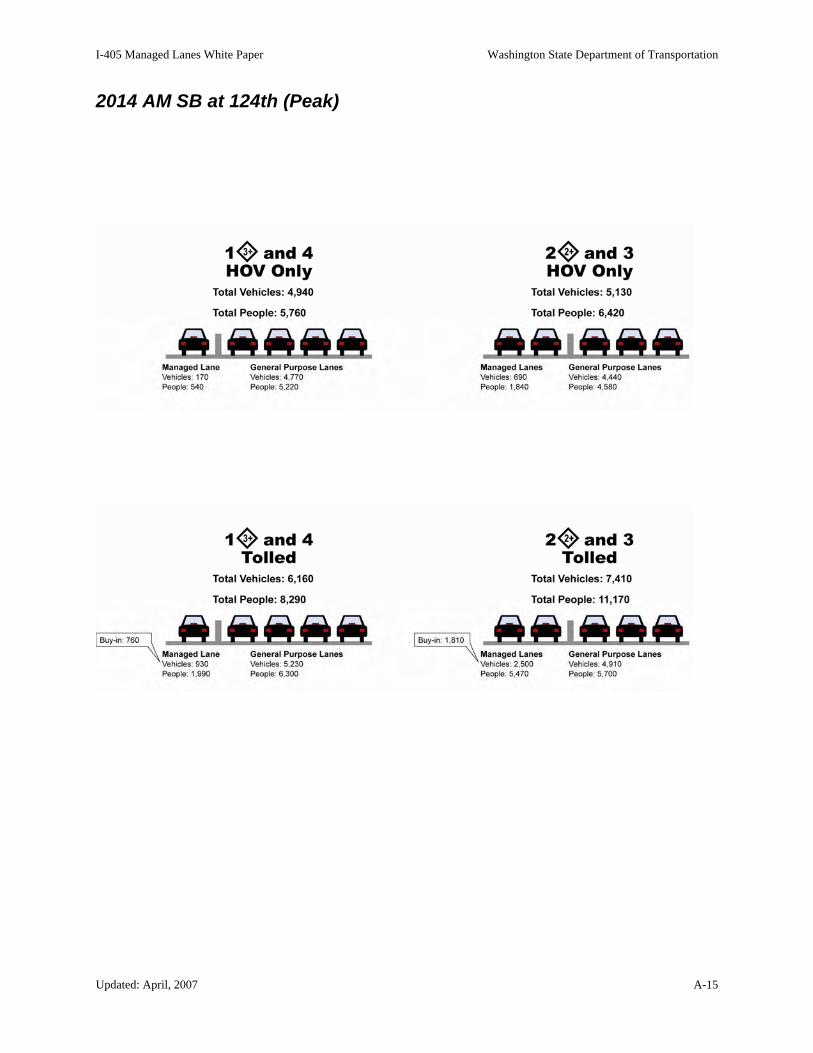
2014 AM peak hour/peak direction results The morning peak hour performance results of the four possible managed lane configurations are summarized at two representative screenline locations on I-405: southbound at the NE 124th
Street interchange in Kirkland (shown in Exhibit 14) and northbound at the NE Park Drive interchange in Renton (shown in Exhibit 15). Exhibit 14: 2014 AM Peak Hour Results: Southbound at NE 124th St. (Kirkland)
Updated: April, 2007 21
I-405 Managed Lanes White Paper Washington State Department of Transportation
Updated: April, 2007 22
I-405 Managed Lanes White Paper Washington State Department of Transportation
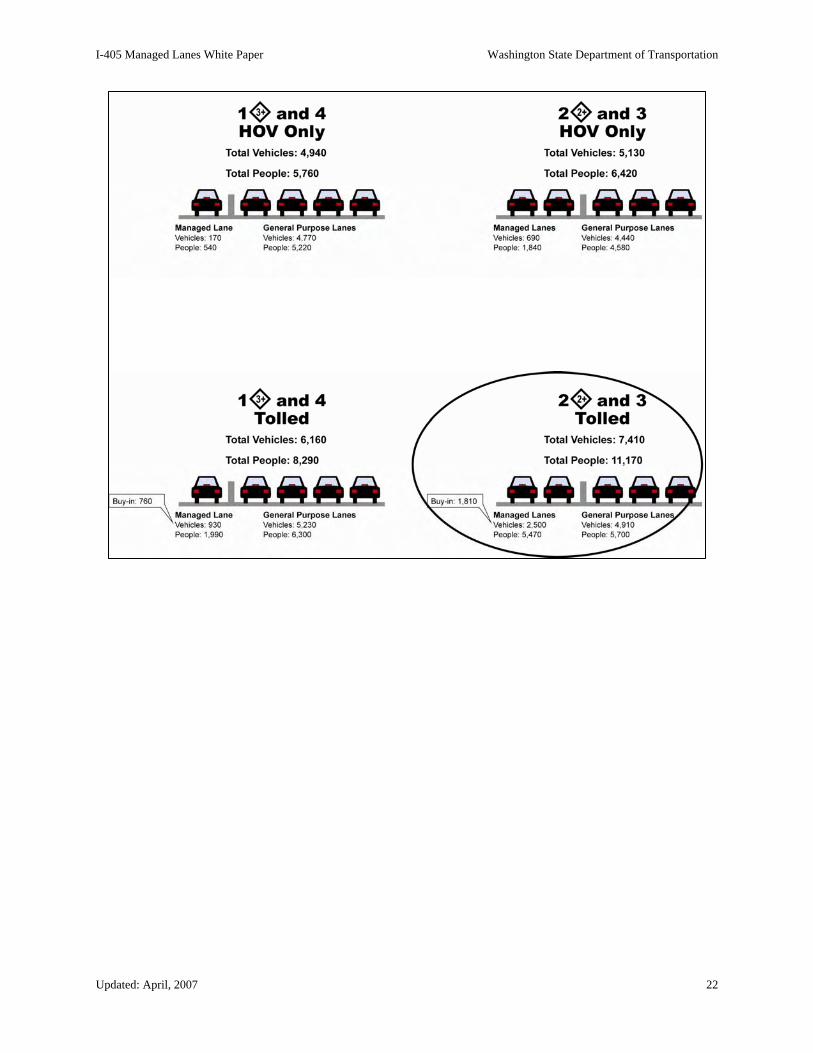
Exhibit 15: 2014 AM Peak Hour Results: Northbound at NE Park Drive (Renton)
At these locations, both the 2ML/3GP HOV-only and tolled configurations served more vehicles and people than the corresponding 1ML/4GP configurations. The 2ML/3GP tolled configurations served between 1,250 and 1,380 more vehicles and 2,880 and 2,640 more people than the 1ML/4GP tolled configuration, depending on the location.
The 2ML/3GP tolled scenario had the highest number of buy-in vehicles to the managed lanes. Between 760 and 960 vehicles bought into the 1ML/4GP HOT lane, while between 1,810 and 2,130 vehicles bought into the 2ML/3GP HOT lanes, in Kirkland and Renton respectively.
Updated: April, 2007 23

I-405 Managed Lanes White Paper Washington State Department of Transportation
2014 PM peak hour/peak direction results
The same screenline locations in Kirkland and Renton were used to illustrate the results of the evening peak hour analysis. Exhibits 16 and 17 show the 2014 evening analysis results at NE 124th Street in Kirkland and at NE Park Drive in Renton, respectively.
Exhibit 16: 2014 PM Peak Hour Results: Northbound at NE 124th St. (Kirkland)
Updated: April, 2007 24
I-405 Managed Lanes White Paper Washington State Department of Transportation
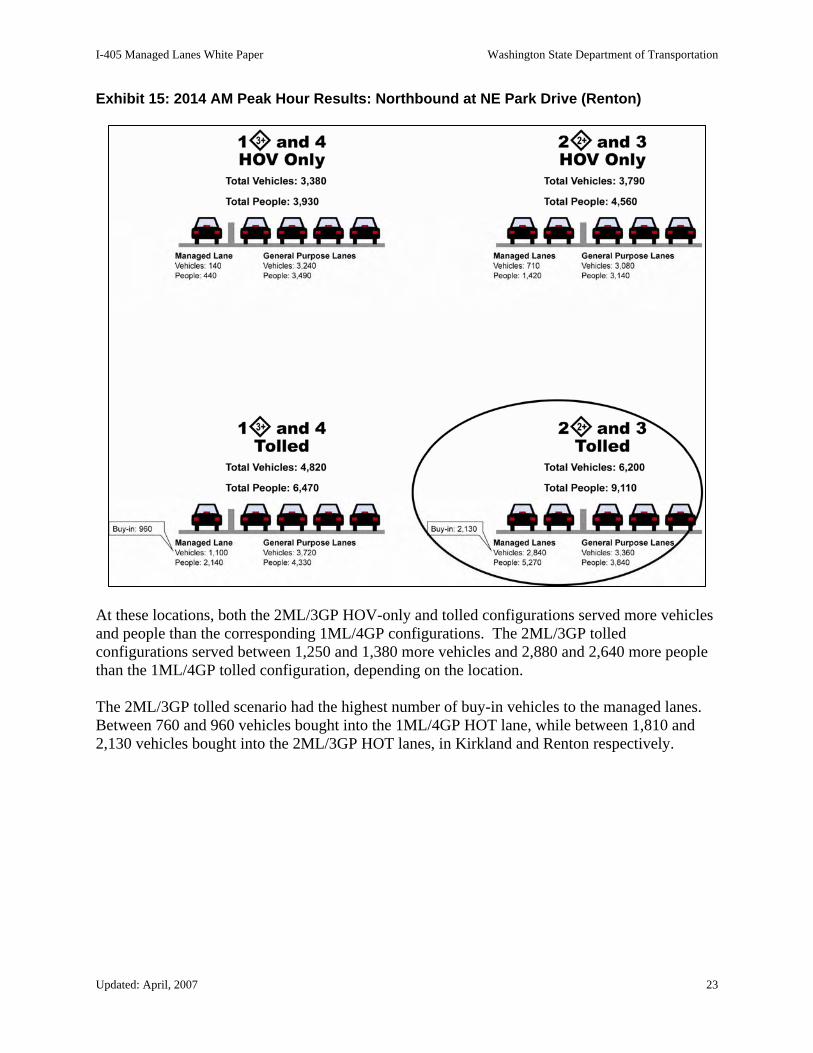
Exhibit 17: 2014 PM Peak Hour Results: Southbound at NE Park Drive (Renton)
In the evening peak hour, the analysis showed that the 1ML/4GP HOV-only configuration served more vehicles and more people in total than the 2ML/3GP HOV-only configuration at both screenlines. However, the 2ML/3GP tolled configuration served the most vehicles and people among all scenarios.
Once again, the 2ML/3GP scenario had the highest number of buy-in vehicles to the managed lanes. Between 380 and 710 vehicles bought into the 1ML/4GP HOT lane, while between 1,260 and 1,400 vehicles bought into the 2ML/3GP HOT lanes, depending on the location.
In both the morning and afternoon peak hours, even though more vehicles paid to use managed lanes in the 2ML/3GP HOT configuration, this configuration served the highest total number of both vehicles and people at both the study locations. In addition, for the morning peak hour, the two managed lanes served as many or more people than the adjacent three general purpose lanes.
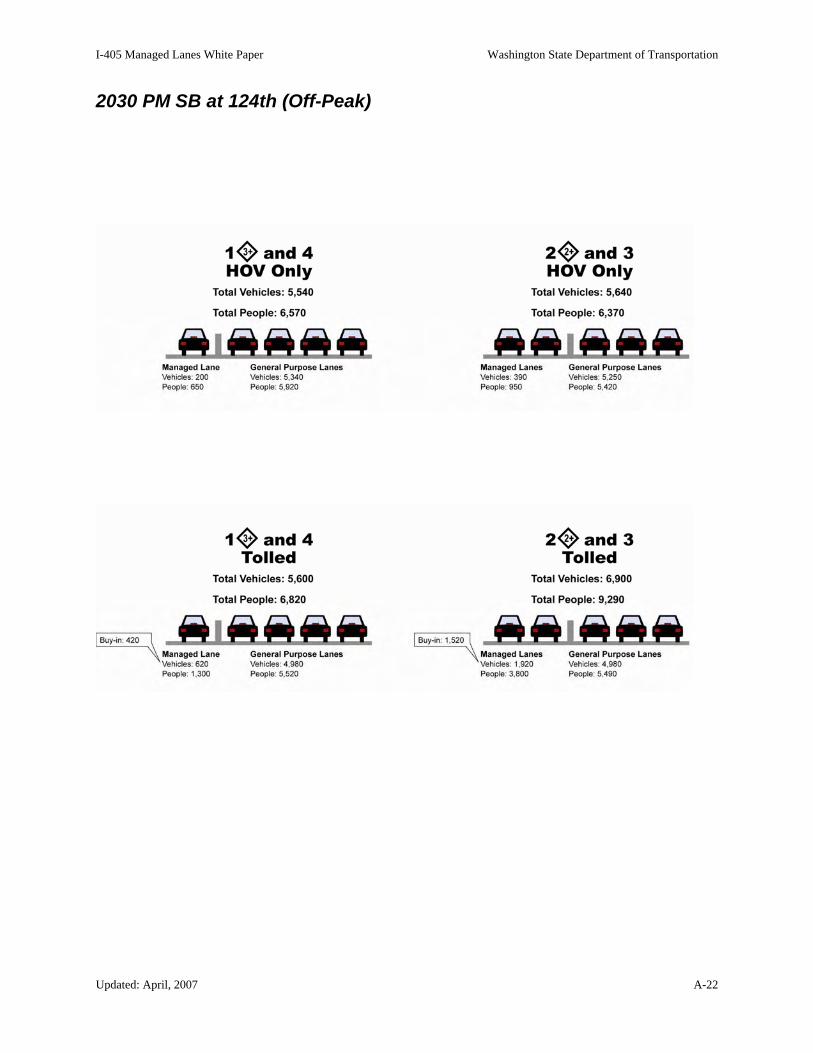
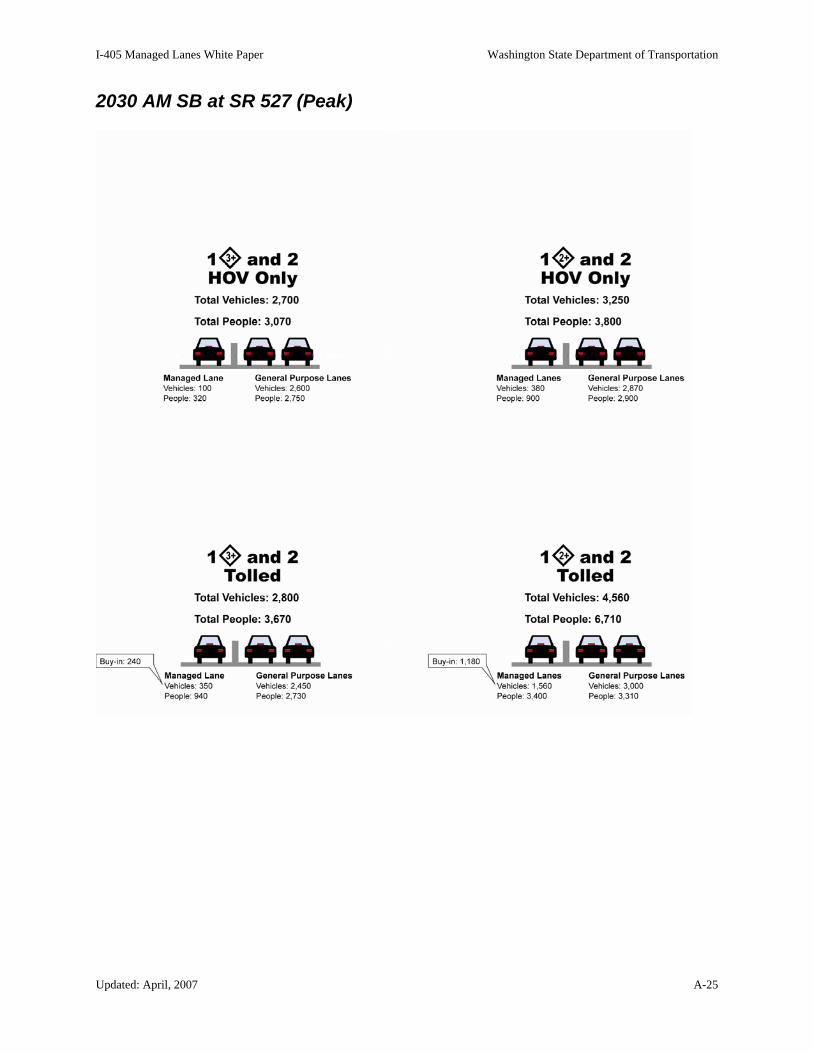
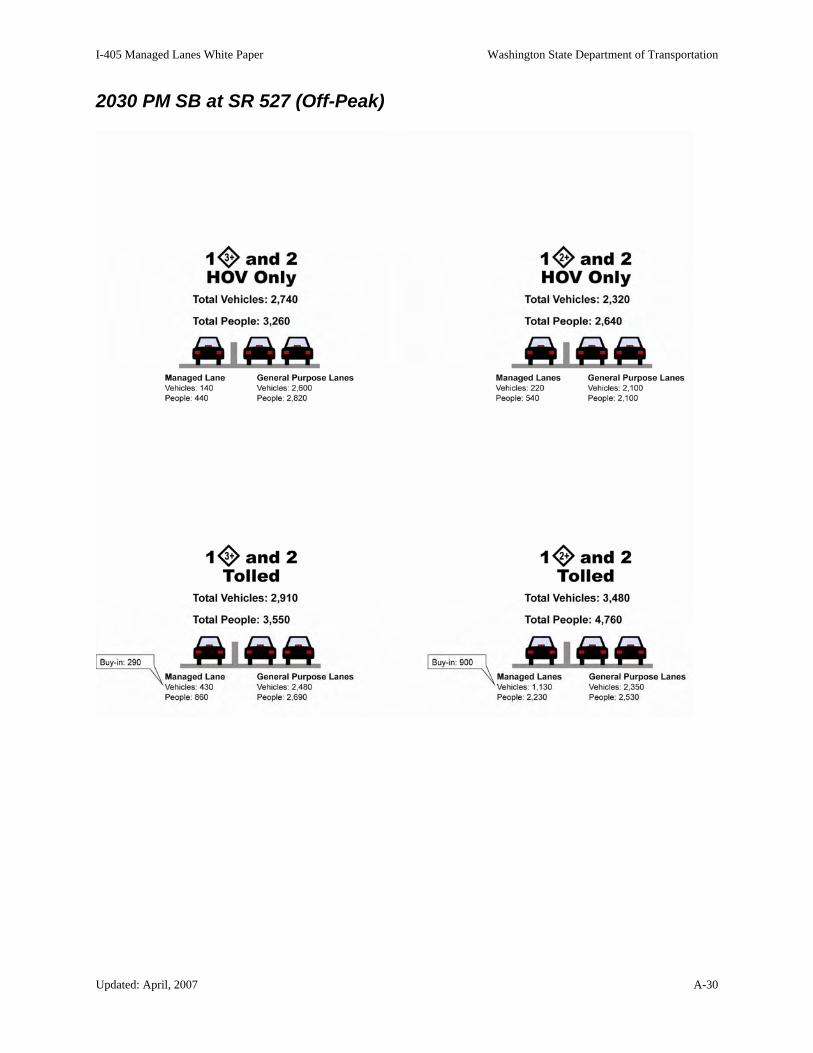
Other 2014 and 2030 results The project team also looked at a third location, at SR 527 in Bothell (the results of which are included in Appendix 3 of this report) and also reviewed analysis results in the off-peak directions. While the peak-direction demand provides information on performance during the worst conditions, the off-peak direction demand is closer to the level of traffic volumes observed
Updated: April, 2007 25

I-405 Managed Lanes White Paper Washington State Department of Transportation
in the corridor for the late morning, noon, early afternoon, and nighttime hours. The performance differences for the peak results were mirrored in the off-peak results.
At SR 527 for both HOV-only and tolled configurations the 1ML/2GP scenarios with a 2+ HOV requirement consistently performed better than the 1ML/2GP scenarios with a 3+ HOV requirement. The 2+ HOV with tolled buy-in had the highest performance results. Consistent HOV requirements and toll operations on either side of SR 527 would keep managed lanes running smoothly.
All the operational results can be seen in Appendix 3.
How did the overall system perform? To capture an estimate of overall system performance, the vehicle and person throughput at the analyzed screenline locations in Kirkland and Renton were totaled for 2014 and 2030. This data combines morning and afternoon peak-hour totals for both peak and off-peak directions. The results are summarized in Exhibits 18 and 19.
Exhibit 18: Vehicles and People Served in 2014 during the Morning and Afternoon Peak Hour in both Peak and Off-Peak Directions at Screenlines and Kirkland and Renton
As shown in Exhibit 18, the 2014 peak hour totals show that the 2ML/3GP HOV only configuration will serve more people and vehicles than the 1ML/4GP HOV only. The 2ML/3GP tolled configuration has the highest vehicle and person throughput of all four. During the 2014 peak hour, the 2ML/3GP tolled configuration serves 47 percent more vehicles and 54 percent more people than the 1ML/4GP tolled configuration.
Updated: April, 2007 26

I-405 Managed Lanes White Paper Washington State Department of Transportation
Exhibit 19: Vehicles and People Served in 2030 during the Morning and Afternoon Peak Hour in both Peak and Off-Peak Directions at Screenlines and Kirkland and Renton
The 2030 peak hour totals shown in Exhibit 19 show similar relative levels of person and vehicle throughput to the 2014 results. The 2030 peak hour 2ML/3GP tolled configuration serves 45 percent more vehicles and 49 percent more people than the 1ML/4GP tolled configuration.
Other system performance considerations Overall, the I-405 freeway system performed well in year 2014, but began to see sections of the corridor experience congestion in year 2030. Factors such as freeway bottlenecks, capacity limitations at freeway-to-freeway interchanges, location of HOV and HOT lane entrances and exits, a single HOT lane in year 2030 north of SR 522, and other factors, influenced the results of system performance.
The addition of freeway-to-freeway HOV or HOT ramps at I-90, SR 520 and I-5 on both ends of the corridor, would likely have a large positive impact on managed lane performance on I-405. Additionally, refinement of entrance and exit points would improve HOT and HOV lane performance.
A note on HOV/HOT reliability It should be noted that two managed lanes, whether HOV or HOT, are typically more reliable than one lane. This is because in the event of an incident such as a bus breakdown or a disabled vehicle blocking a lane, a system of two managed lanes can continue to function at some level. A single lane would be severely impacted. Taking this into consideration, two HOV or HOT lanes have the ability to provide more people a consistently reliable trip.
Updated: April, 2007 27

I-405 Managed Lanes White Paper Washington State Department of Transportation
What findings does this analysis suggest?
Factors to consider when comparing scenarios Overall, the analyzed scenario that is predicted to serve the greatest number of users is the option that has two tolled managed lanes and three general purpose lanes, where 2+ HOV traffic can use the managed lanes toll-free and single-occupant vehicles can choose to pay a toll to use them when excess capacity is available. In addition, this scenario:
• Preserves the 2+ HOV designation. Without the addition of a second HOV lane, the carpool occupancy designation for I-405 would likely need to be changed to 3+ in the near future to maintain acceptable operations and preserve travel speeds guaranteed to transit agencies. The use of two HOV lanes provides the opportunity to maintain performance and forestall the 3+ HOV decision beyond 2020.
• Provides future flexibility. The 2ML/3GP HOT scenario also provides the greatest flexibility to accommodate future operation options to maintain performance even as traffic volumes continue to grow. Operating only a single managed lane today would likely make future managed lane expansions significantly more difficult as right-of-way prices and construction costs both continue to increase.
I-405 managed lanes are not a tool for to generate revenue Maximizing person throughput, not generating revenue, is the principal goal of implementing a managed lanes system on I-405, as determined by WSDOT and the I-405 Executive Committee. While the addition of a tolling option may provide new revenues to help improve I-405, this is less important than moving the greatest number of people in the most efficient manner.
The 2ML/3GP tolled option with 2+ HOV traffic toll-free outlined above is estimated to produce less revenue than other options. A 2ML/3GP tolled with 3+ HOV could generate more revenue, $11.2 million compared to $5.7 million, but has some negative impacts to general purpose lane performance. For more revenue information see Appendix 4.
Updated: April, 2007 28
I-405 Managed Lanes White Paper Washington State Department of Transportation
Appendix 1 – Methodology
How was the study completed?A detailed modeling and simulation effort accurately analyzed traffic operations of managed lanes on I-405 at five screenline sites. For each screenline, an opening year 2014 and design year 2030 analysis was performed.
For each of the managed lanes study scenarios, a micro-simulation model produced results for both toll and non-tolled operation. Comparison of the tolled and non-tolled measures of effectiveness will help evaluate the success of managed lanes on I-405.
The managed lanes study required the interaction of three sophisticated transportation engineering/planning programs: EMME/2 Regional travel demand software; VISSIM Microscopic traffic simulation software; and
Toll Revenue Estimation model
1. EMME/2 Regional travel demand software. The regional travel demand model used in the Managed Lanes study is a modified version of the Puget Sound Regional Council’s EMME/2 model. Engineers used this EMME/2 model to develop 2014 and 2030 traffic volumes for the project network.
2. VISSIM Microscopic traffic simulation software. Engineers selected VISSIM (v. 3.61) to simulate the detailed traffic and transit conditions along each segment of the freeway corridor. These micro-simulations tested the sensitivity of demand for the managed lanes in congested travel conditions – information needed to conduct a tolling analysis, which is one of three managed lanes tools considered for I-405. A defensible and fiscally prudent tolling analysis requires an accurate view of corridor travel speeds and bottleneck locations to gauge relative travel times and costs for freeway users.
3. Toll Revenue Estimation model. The revenue estimation process for the I-405 Managed Lanes made use of a windowed version of the PSRC regional travel demand model, which allows for interaction between the arterials and I-405.
The refined toll revenue estimation model helped to estimate the impact of using tolls to regulate demand on the managed lanes under three operating scenarios. To develop toll rates, first, the model estimated the travel time difference between using general purpose lanes and managed lanes. The model then predicts how many drivers would be willing to pay a toll and use the managed lanes to avoid delays in the general-purpose lanes, or other alternate routes. The model tested several toll rates to determine what rate best balances volumes between the general-purpose and managed lanes.
Updated: April, 2007 A-1
I-405 Managed Lanes White Paper Washington State Department of Transportation
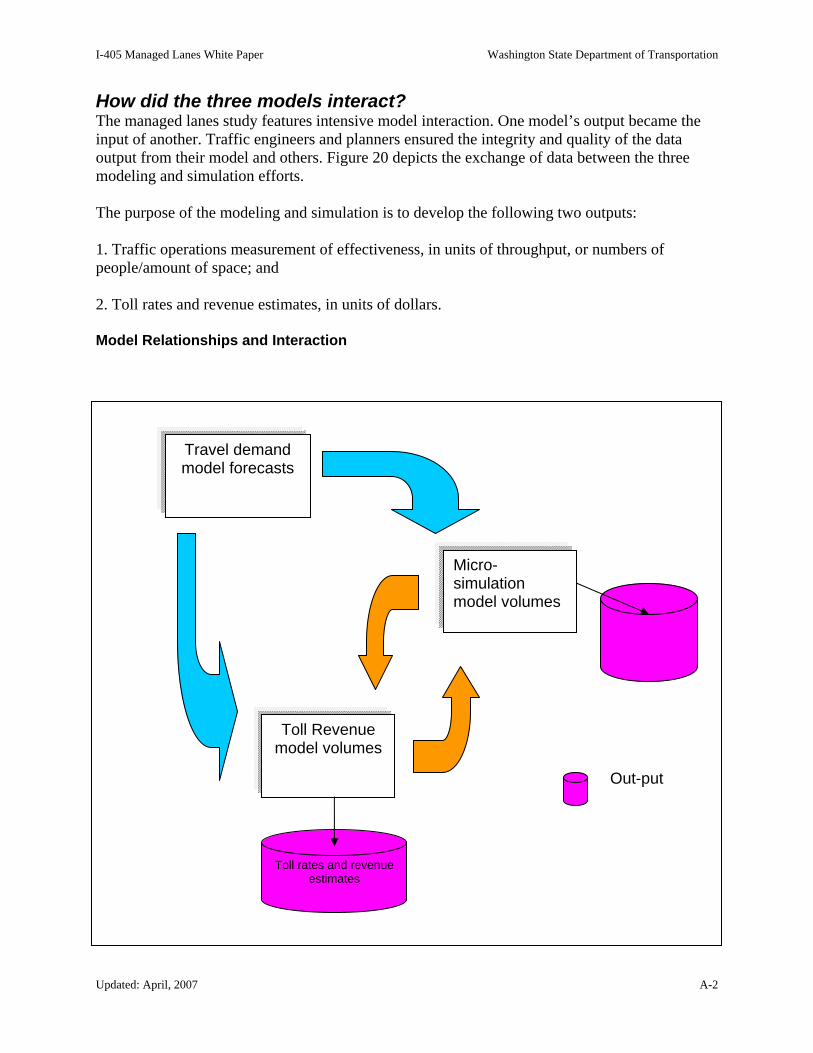
How did the three models interact? The managed lanes study features intensive model interaction. One model’s output became the input of another. Traffic engineers and planners ensured the integrity and quality of the data output from their model and others. Figure 20 depicts the exchange of data between the three modeling and simulation efforts. The purpose of the modeling and simulation is to develop the following two outputs: 1. Traffic operations measurement of effectiveness, in units of throughput, or numbers of people/amount of space; and 2. Toll rates and revenue estimates, in units of dollars. Model Relationships and Interaction
Travel demand model forecasts
Micro-simulation model volumes
Toll Revenue model volumes
Out-put
Toll rates and revenue estimates
Updated: April, 2007 A-2

I-405 Managed Lanes White Paper Washington State Department of Transportation
Appendix 2 – Use of HOV Lanes Over Time
Updated: April, 2007 A-3

I-405 Managed Lanes White Paper Washington State Department of Transportation
Northbound HOV Lane Afternoon Peak Hour Volumes - Kirkland
0
20 0
40 0
60 0
80 0
10 00
12 00
14 00
16 00
18 00
NE 60th
NE 72nd
- S
NE 85th
- S
NE 85th
- N
NE 97th
NE 104th
NE 108th
NE 116th
NE 124th
- S
NE 124th
- N
NE 132n
d
NE 140th
NE 145th
NE 152n
d
NE 160th
- S
NE 160th
- N
NE 170th
SR 522 -
S1
SR 522 -
S2
Vehi
cles
Per
Hou
r
20 02 20 04
No rt h >
Updated: April, 2007 A-4
I-405 Managed Lanes White Paper Washington State Department of Transportation
Northbound HOV Lane Morning Peak Hour Volumes - Renton
0
200
400
600
800
1 000
1 200
1 400
1 600
1 800
SR 900/N
E Park
NE 24th
NE 30th
NE 36th
NE 44th
SE 72nd
SE 64th
SE 59th
SE 52nd
SE 47th
Coal C
reek
SE 40th
2 002
2 004
Updated: April, 2007 A-5

I-405 Managed Lanes White Paper Washington State Department of Transportation
Appendix 3 – Performance of Managed Lane Configuration Options
Updated: April, 2007 A-6

I-405 Managed Lanes White Paper Washington State Department of Transportation
2014 AM NB at Park (Peak)
Updated: April, 2007 A-7

I-405 Managed Lanes White Paper Washington State Department of Transportation
2014 PM SB at Park (Peak)
Updated: April, 2007 A-8

I-405 Managed Lanes White Paper Washington State Department of Transportation
2030 AM NB at Park (Peak)
Updated: April, 2007 A-9

I-405 Managed Lanes White Paper Washington State Department of Transportation
2030 PM SB at Park (Peak)
Updated: April, 2007 A-10

I-405 Managed Lanes White Paper Washington State Department of Transportation
2014 AM SB at Park (Off-Peak)
Updated: April, 2007 A-11

I-405 Managed Lanes White Paper Washington State Department of Transportation
2014 PM NB at Park (Off-Peak)
Updated: April, 2007 A-12

I-405 Managed Lanes White Paper Washington State Department of Transportation
2030 AM SB at Park (Off-Peak)
Updated: April, 2007 A-13

I-405 Managed Lanes White Paper Washington State Department of Transportation
2030 PM NB at Park (Off-Peak)
Updated: April, 2007 A-14
I-405 Managed Lanes White Paper Washington State Department of Transportation
2014 AM SB at 124th (Peak)
Updated: April, 2007 A-15

I-405 Managed Lanes White Paper Washington State Department of Transportation
2014 PM NB at 124th (Peak)
Updated: April, 2007 A-16

I-405 Managed Lanes White Paper Washington State Department of Transportation
2030 AM SB at 124th (Peak)
Updated: April, 2007 A-17

I-405 Managed Lanes White Paper Washington State Department of Transportation
2030 PM NB at 124th (Peak)
Updated: April, 2007 A-18

I-405 Managed Lanes White Paper Washington State Department of Transportation
2014 AM NB at 124th (Off-Peak)
Updated: April, 2007 A-19

I-405 Managed Lanes White Paper Washington State Department of Transportation
2014 PM SB at 124th (Off-Peak)
Updated: April, 2007 A-20

I-405 Managed Lanes White Paper Washington State Department of Transportation
2030 AM NB at 124th (Off-Peak)
Updated: April, 2007 A-21
I-405 Managed Lanes White Paper Washington State Department of Transportation
2030 PM SB at 124th (Off-Peak)
Updated: April, 2007 A-22

I-405 Managed Lanes White Paper Washington State Department of Transportation
2014 AM SB at SR 527 (Peak)
Updated: April, 2007 A-23

I-405 Managed Lanes White Paper Washington State Department of Transportation
2014 PM NB at SR 527 (Peak)
Updated: April, 2007 A-24
I-405 Managed Lanes White Paper Washington State Department of Transportation
2030 AM SB at SR 527 (Peak)
Updated: April, 2007 A-25

I-405 Managed Lanes White Paper Washington State Department of Transportation
2030 PM NB at SR 527 (Peak)
Updated: April, 2007 A-26

I-405 Managed Lanes White Paper Washington State Department of Transportation
2014 AM NB at SR 527 (Off-Peak)
Updated: April, 2007 A-27

I-405 Managed Lanes White Paper Washington State Department of Transportation
2014 PM SB at SR 527 (Off-Peak)
Updated: April, 2007 A-28

I-405 Managed Lanes White Paper Washington State Department of Transportation
2030 AM NB at SR 527 (Off-Peak)
Updated: April, 2007 A-29
I-405 Managed Lanes White Paper Washington State Department of Transportation
2030 PM SB at SR 527 (Off-Peak)
Updated: April, 2007 A-30

I-405 Managed Lanes White Paper Washington State Department of Transportation
Appendix 4 – Tolling Revenues
Estimated toll rates for 2014 and 2030 for analyzed managed lane scenarios
Toll Rates to Maximize Usage of Managed Lanes
Year Time Period
2ML/3GP 2+HOV toll-free (Peak-Nonpeak)
($ per mile)
1ML/4GP 3+HOV toll-free (Peak-Nonpeak)
($ per mile)
2ML/3GP 3+HOV toll-free (Peak-Nonpeak)
($ per mile)
2014 AM Peak Midday PM Peak
$.05-.05 $.05-.05 $.20-.05
$.05-.05 $.05-.05 $.10-.05
$.05-.05 $.05-.05 $.10-.05
2030 AM Peak Midday PM Peak
$.70-.35 $.05-.05 $.70-.35
$.50-.25 $.05-.05 $.70-.35
$.35-.15 $.05-.05 $.70-.35
Updated: April, 2007 A-31
I-405 Managed Lanes White Paper Washington State Department of Transportation
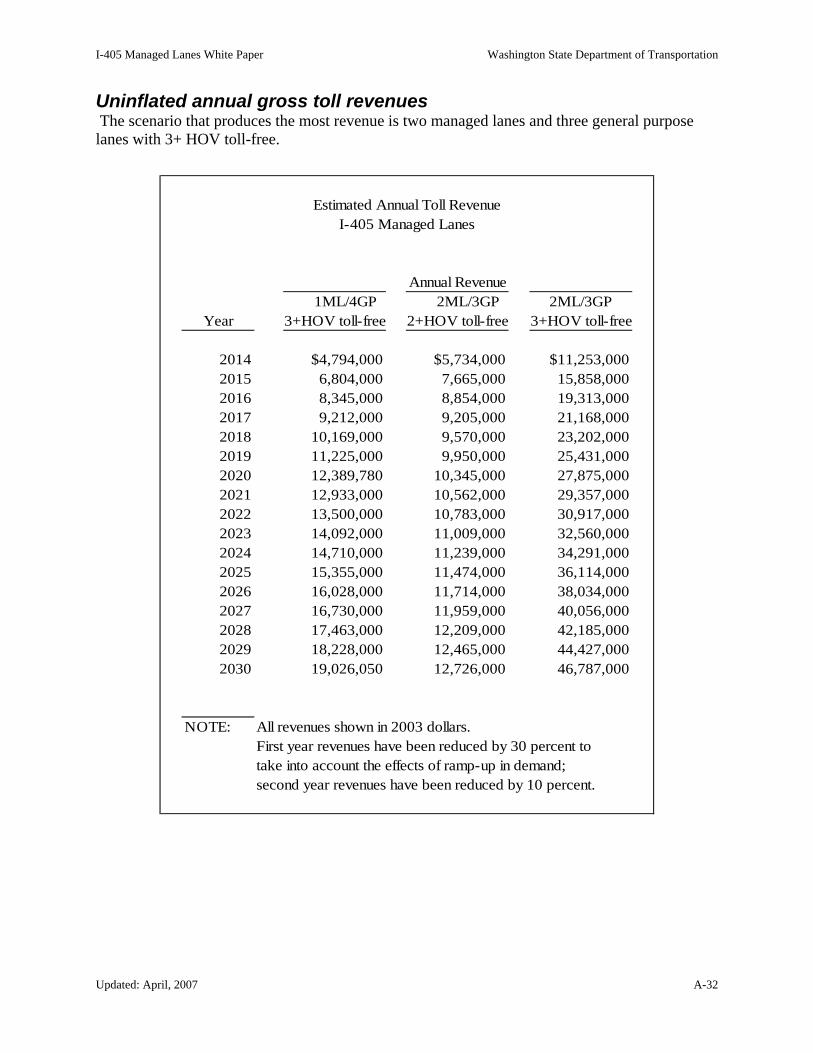
Uninflated annual gross toll revenues The scenario that produces the most revenue is two managed lanes and three general purpose lanes with 3+ HOV toll-free.
Estimated Annual Toll Revenue I-405 Managed Lanes
Annual Revenue 1ML/4GP 2ML/3GP 2ML/3GP
Year 3+HOV toll-free 2+HOV toll-free 3+HOV toll-free
2014 $4,794,000 $5,734,000 $11,253,000 2015 6,804,000 7,665,000 15,858,000 2016 8,345,000 8,854,000 19,313,000 2017 9,212,000 9,205,000 21,168,000 2018 10,169,000 9,570,000 23,202,000 2019 11,225,000 9,950,000 25,431,000 2020 12,389,780 10,345,000 27,875,000 2021 12,933,000 10,562,000 29,357,000 2022 13,500,000 10,783,000 30,917,000 2023 14,092,000 11,009,000 32,560,000 2024 14,710,000 11,239,000 34,291,000 2025 15,355,000 11,474,000 36,114,000 2026 16,028,000 11,714,000 38,034,000 2027 16,730,000 11,959,000 40,056,000 2028 17,463,000 12,209,000 42,185,000 2029 18,228,000 12,465,000 44,427,000 2030 19,026,050 12,726,000 46,787,000
NOTE: All revenues shown in 2003 dollars. First year revenues have been reduced by 30 percent to take into account the effects of ramp-up in demand; second year revenues have been reduced by 10 percent.
Updated: April, 2007 A-32

I-405 Managed Lanes White Paper Washington State Department of Transportation
Approximate bonding capacityThese bonding capacity ranges were not produced by a financial advisor and have been developed using a simplified approach primarily to provide a range of possibilities.
Bonding Capacity Range Approximations I-405 Managed Lanes
(In Thousands)
Revenue Bonds (1) General Obligation Bonds (2) 1ML/4GP 2ML/3GP 2ML/3GP 1ML/4GP 2ML/3GP 2ML/3GP
3+HOV toll-free 2+HOV toll-free 3+HOV toll-free 3+HOV toll-free 2+HOV toll-free 3+HOV toll-free
Assuming Net Revenue Pledge (3)
10-Year Average Revenue $8,502 $7,759 $19,482 $8,502 $7,759 $19,482 Assumed Coverage Requirement 1.75 1.75 1.75 1.00 1.00 1.00 Maximum Debt Service $4,858 $4,434 $11,133 $8,502 $7,759 $19,482 Bond Issue Size $66,873 $61,029 $153,237 $130,695 $119,274 $299,483 Net Bond Proceeds $55,728 $50,857 $127,697 $116,174 $106,021 $266,208
Assuming Gross Revenue Pledge (4)
10- Year Average Revenue $10,628 $9,699 $24,352 $10,628 $9,699 $24,352 Assumed Coverage Requirement 1.75 1.75 1.75 1.00 1.00 1.00 Maximum Debt Service $6,073 $5,542 $13,915 $10,628 $9,699 $24,352 Bond Issue Size $83,595 $76,288 $191,542 $163,377 $149,096 $374,347 Net Bond Proceeds $69,663 $63,573 $159,619 $145,224 $132,530 $332,753
(1) Revenue Bonds assume 30 year term , 6.0% interest and 1.20 net proceeds reduction factor to cover 1.5 net years of capitalized interest, debt reserve and bond sales costs. (2) General Obligation Bonds assume 30 year term , 5.0% interest and 1.125 net proceeds reduction factor to cover 1.5 net years of capitalized interest and bond sales costs. (3) Net Revenue Pledge assumes all operating cost and maintenance are deducted from toll revenues before debt service. (4) Gross Revenue Pledge assumes operating and maintenance costs are paid by others or are "subordinated" to debt service.
Updated: April, 2007 A-33
2001
I-405 Managed Lanes White Paper Washington State Department of Transportation
Appendix 5 – Bibliography
Parsons, Brinckerhoff, Quade & Douglas, I-405 Lane Management Options, prepared for WSDOT, October 2001
Mirai Associates, I-405 Managed Lane Analysis, Working Paper, prepared for WSDOT, October
Mirai Associates, I-405 Managed Lane Evaluation Technical Memorandum, prepared for WSDOT, August 2002
Utah Department of Transportation, Utah Managed Lanes Report, January 28, 2006
Updated: April, 2007 A-34


