State & Local Government Solutions Medicaid Information Technology System (MITS) Management and Administrative Reporting (MAR) Participant Guide August 25, 2010 HP Enterprise Services Suite 100 50 West Town Street Columbus, OH 43215
Transcript
State & Local Government Solutions Medicaid Information Technology System (MITS)
Management and Administrative Reporting (MAR) Participant Guide
August 25, 2010
HP Enterprise Services Suite 100
50 West Town Street Columbus, OH 43215
Ohio MITS – Management and Administrative Reporting (MAR) Participant Guide August 25, 2010
MAR Overview ......................................................................................................... 3 MAR Subsystem ............................................................................................... 3 MAR Report Categories ...................................................................................... 4
Viewing and Exporting interChange Reports ................................................................. 5 What .............................................................................................................. 5 Who ............................................................................................................... 5 When .............................................................................................................. 5 Relevance ........................................................................................................ 5 Requirements .................................................................................................. 5 How To ........................................................................................................... 6 Success ........................................................................................................... 6 Practice ........................................................................................................... 6 Summary ........................................................................................................ 7
Printing interChange Reports ..................................................................................... 8 What .............................................................................................................. 8 Who ............................................................................................................... 8 When .............................................................................................................. 8 Relevance ........................................................................................................ 9 Requirements .................................................................................................. 9 How To ........................................................................................................... 9 Success ........................................................................................................... 9 Practice ......................................................................................................... 10 Summary ...................................................................................................... 10
Appendix A ........................................................................................................... 12 MAR Reports .................................................................................................. 12
Ohio MITS – Management and Administrative Reporting (MAR) Participant Guide August 25, 2010
Overview The goal of this course is to provide you with the knowledge and common skills necessary to view, export and print reports using the Ohio MITS (Medicaid Information Technology System).
Objectives After completing this course, you should be able to:
View reports in interChange Export reports from interChange Print reports in interChange
Ohio MITS – Management and Administrative Reporting (MAR) Participant Guide August 25, 2010
MAR Subsystem The purpose of the Management and Administrative Reporting (MAR) subsystem is to provide financial and statistical reports (both scheduled and on-request) to assist the state and federal governments with fiscal planning, new program and policy development, and the monitoring and control of State Medical Assistance Programs.
The MAR function is a comprehensive management tool which provides: information on program status; the ability to analyze historical trends; and the ability to estimate the impact of policy changes on State Medical Assistance Programs. This function uses key information from other MITS subsystems to generate standard reports.
The main input to MAR is data obtained through the BIAR data repository, which is derived from the Claims, Financial, Recipient, Reference and Provider subsystems. The major process is the generation of reports and program data.
BIAR generates reports that range from simple queries to more complex reporting and data analysis. General users can manage reports through InfoView and super users can create and modify ad hoc reports in Desktop Intelligence.
SUR Profiler Reports: This category contains quarterly and yearly reports that assist with identifying providers who have medical resource use that is substantially different from their peers.
The key outputs from MAR are financial, statistical and summary reports and data required by federal regulations, and other reports and data that assist the state in the management and administration of State Medical Assistance Programs.
Ohio MITS – Management and Administrative Reporting (MAR) Participant Guide August 25, 2010
MAR Report Categories The following lists describe the MAR subsystem at a high level. To learn more about specific reports, see the descriptions under the MAR reports titles in Appendix A.
MAR:
Aggregate Payments: o Expenditures o Long Term Care o Operations o Provider o Recipient
Encounter: o Expenditures o Long Term Care o Operations o Provider o Recipient
Ohio MITS – Management and Administrative Reporting (MAR) Participant Guide August 25, 2010
What In this topic you learn how to view and export reports through interChange panels.
Who Only a small, select number of people will perform this task. Some of these people will be stakeholders, legislators, administration (OHP, JFS, Governor’s Office) and interested parties.
When Users will routinely look at these reports as part of their job function. Sometimes the Centers for Medicare & Medicaid Services (CMS), stakeholders, legislators, administration (OHP, JFS and the Governor’s Office) and other interested parties will request information. Using MAR will also assist the state with the planning and management of their system, which will lead to a need for these reports.
Relevance The MAR reports will give the user an overview of the information they will need. They will need to use the BIAR system for greater detail. The users of MAR will also be users of BIAR.
Requirements Users must have necessary security requirements in MITS and an understanding of PDF files and Excel spreadsheets should also attend the class on Infoview reporting, although it does not have to happen before taking the MAR course. The user should also have training on the report data which they will be reviewing.
Ohio MITS – Management and Administrative Reporting (MAR) Participant Guide August 25, 2010
How To Follow these steps from the MITS homepage to view and export reports through interChange:
Step Action
1 Click MAR.
2 Click Aggregate Payments or Encounter.
3 Select reporting category to view various report panels.
4 Click on chosen report panel.
5 Select options.
6 Click view.
7 Click print.
Success You have successfully completed this task when the desired report displays or prints.
Practice Produce and export reports using this information:
Start in MAR Choose Aggregate Payments Choose expenditures Choose Operations Select Operational Performance averages and percents Use the default parameters for your reports
When you are done your report will display.
Repeat the process a second time for additional practice. Use this information:
Start in MAR Select Encounter Choose Provider Select Provider ranking Use the default parameters for your reports Select view to see your reports
When you are done your report will display.
Ohio MITS – Management and Administrative Reporting (MAR) Participant Guide August 25, 2010
What In this topic you learn how to print reports through interChange panels.
Who Only a small, select number of people will perform this task. Some of these people will be stakeholders, legislators, administration (OHP, JFS, Governor’s Office) and interested parties.
When Users will routinely look at these reports as part of their job function. Sometimes the Centers for Medicare & Medicaid Services (CMS), stakeholders, legislators, administration (OHP, JFS and the Governor’s Office) and other interested parties will request information. Using MAR will also assist the state with the planning and management of their system, which will lead to a need for these reports.
Ohio MITS – Management and Administrative Reporting (MAR) Participant Guide August 25, 2010
Relevance The MAR reports will give the user a “high level” overview of the information they will need. They will need to use the BIAR system for greater detail. The users of MAR will also be users of BIAR.
Requirements Users must have necessary security requirements in MITS and an understanding of PDF files and Excel spreadsheets. They should also attend the class on Infoview reporting, although it does not have to happen before taking the MAR course.
How To Follow these steps from the MITS homepage to print reports through interChange:
Step Action
1 Click MAR.
2 Click Aggregate Payments or Encounter.
3 Select reporting category to view various report panels.
4 Click on chosen report panel.
5 Select options.
6 Click view.
7 Click print.
Success You have successfully completed this task when the desired report displays and also prints.
Ohio MITS – Management and Administrative Reporting (MAR) Participant Guide August 25, 2010
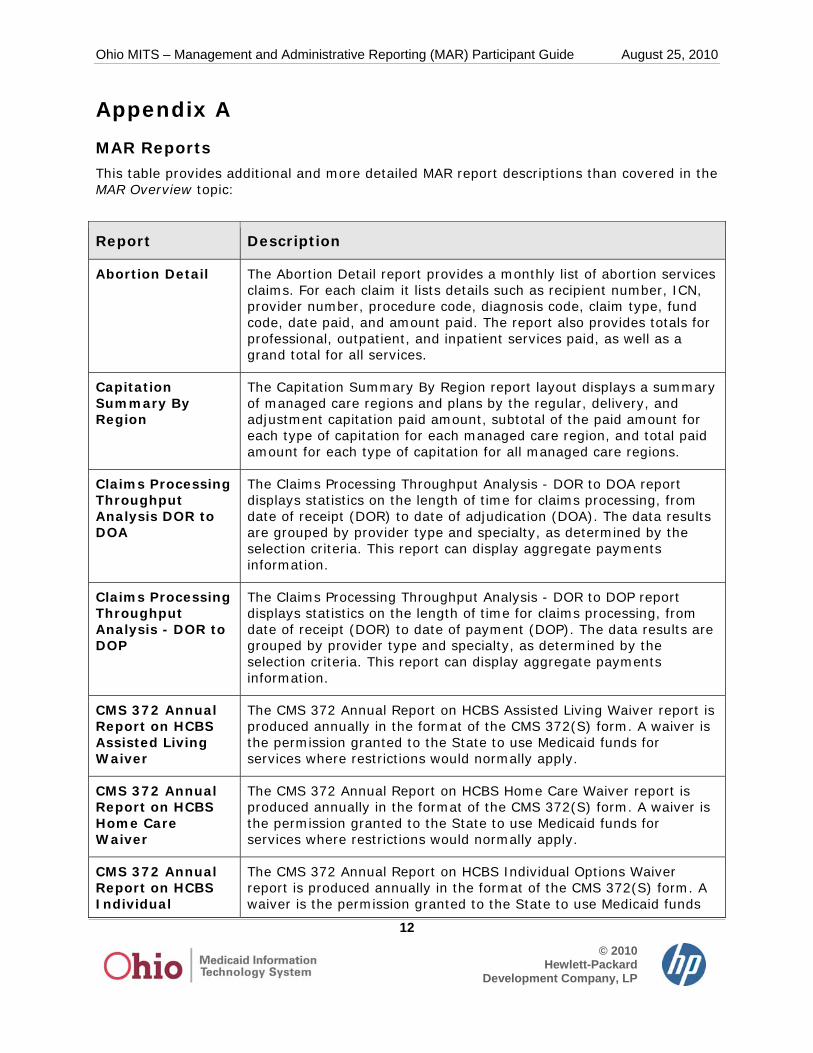
MAR Reports This table provides additional and more detailed MAR report descriptions than covered in the MAR Overview topic:
Report Description
Abortion Detail The Abortion Detail report provides a monthly list of abortion services claims. For each claim it lists details such as recipient number, ICN, provider number, procedure code, diagnosis code, claim type, fund code, date paid, and amount paid. The report also provides totals for professional, outpatient, and inpatient services paid, as well as a grand total for all services.
Capitation Summary By Region
The Capitation Summary By Region report layout displays a summary of managed care regions and plans by the regular, delivery, and adjustment capitation paid amount, subtotal of the paid amount for each type of capitation for each managed care region, and total paid amount for each type of capitation for all managed care regions.
Claims Processing Throughput Analysis DOR to DOA
The Claims Processing Throughput Analysis - DOR to DOA report displays statistics on the length of time for claims processing, from date of receipt (DOR) to date of adjudication (DOA). The data results are grouped by provider type and specialty, as determined by the selection criteria. This report can display aggregate payments information.
Claims Processing Throughput Analysis - DOR to DOP
The Claims Processing Throughput Analysis - DOR to DOP report displays statistics on the length of time for claims processing, from date of receipt (DOR) to date of payment (DOP). The data results are grouped by provider type and specialty, as determined by the selection criteria. This report can display aggregate payments information.
CMS 372 Annual Report on HCBS Assisted Living Waiver
The CMS 372 Annual Report on HCBS Assisted Living Waiver report is produced annually in the format of the CMS 372(S) form. A waiver is the permission granted to the State to use Medicaid funds for services where restrictions would normally apply.
CMS 372 Annual Report on HCBS Home Care Waiver
The CMS 372 Annual Report on HCBS Home Care Waiver report is produced annually in the format of the CMS 372(S) form. A waiver is the permission granted to the State to use Medicaid funds for services where restrictions would normally apply.
CMS 372 Annual Report on HCBS Individual
The CMS 372 Annual Report on HCBS Individual Options Waiver report is produced annually in the format of the CMS 372(S) form. A waiver is the permission granted to the State to use Medicaid funds
Ohio MITS – Management and Administrative Reporting (MAR) Participant Guide August 25, 2010
Options Waiver for services where restrictions would normally apply.
CMS 372 Annual Report on HCBS Level One Waiver
The CMS 372 Annual Report on HCBS Level One Waiver report is produced annually in the format of the CMS 372(S) form. A waiver is the permission granted to the State to use Medicaid funds for services where restrictions would normally apply.
CMS 372 Annual Report on HCBS Choices Waiver
The CMS 372 Annual Report on HCBS Choices Waiver report is produced annually in the format of the CMS 372(S) form. A waiver is the permission granted to the State to use Medicaid funds for services where restrictions would normally apply.
CMS 372 Annual Report on HCBS Passport Waiver
The CMS 372 Annual Report on HCBS Passport Waiver report is produced annually in the format of the CMS 372(S) form. A waiver is the permission granted to the State to use Medicaid funds for services where restrictions would normally apply.
CMS 372 Annual Report on HCBS Transitions Aging Carve-Out Waiver
The CMS 372 Annual Report on HCBS Transitions Aging Carve-Out Waiver report is produced annually in the format of the CMS 372(S) form. A waiver is the permission granted to the State to use Medicaid funds for services where restrictions would normally apply.
CMS 372 Annual Report on HCBS Transitions MRDD Waiver
The CMS 372 Annual Report on HCBS Transitions MRDD Waiver report is produced annually in the format of the CMS 372(S) form. A waiver is the permission granted to the State to use Medicaid funds for services where restrictions would normally apply.
Default State Category of Service
The Default State Category of Service report lists records assigned a default MAR category of service (COS) during the weekly MAR data extraction process. The MAR COS, claim ICN, claim detail number, source code, and paid amount are displayed for each record assigned the default category. The report includes paid claims and adjustments, expenditures, and non claim-specific accounts receivable transactions that were assigned a default category. Encounter claims and adjustments are excluded from the report.
Error Code Analysis
The Error Code Analysis report displays the most common provider billing errors for a specified time period. This report indicates how well providers understand billing procedures and program policies. For each error code, the report shows the number of error claims, the provider IDs, the percent of total errors, and the billed and paid amounts. This report can display aggregate payments information.
Expenditure Analysis By Category of Service and Aid
The Expenditure Analysis By Category Of Service and Aid Category report displays paid claim data grouped by State category of service (COS). For each COS/aid category combination, the report lists the number of recipients, units of service, paid dollars, and the average
Ohio MITS – Management and Administrative Reporting (MAR) Participant Guide August 25, 2010
Category paid amount per recipient. This report can display either encounter or aggregate payments information.
Expenditures Statistics By State COS
The Expenditure Statistics By State COS report displays paid and denied claim statistics grouped by State category of service (COS). For paid claims, the report lists the number of paid claim, the units of service provided on these claims, and the amount paid for these claims. For denied claims, the number of denied claims and the billed amount of those claims are provided. This report can display either encounter or aggregate payments information.
Expenditures Statistics By Provider Type
The Expenditure Statistics By Provider Type report displays paid and denied claim statistics grouped by provider type and specialty. For paid claims, the reports list the number of paid claims, the units of service provided on those claims, and the amount paid for these claims. For denied claims, the number of denied claims and the billed amount on those claims are provided. The data results are grouped by provider type and specialty. This report can display either encounter or aggregate payments information.
Expenditure Analysis By Benefit Plan and Aid Category
The Expenditure Analysis By Benefit Plan and Aid Category report displays paid claim data grouped by benefit plan and aid category. For each aid category of each benefit plan, the report lists the number of recipients, units of service, paid dollars, and the average paid amount per recipient. This report can display either encounter or aggregate payments information.
Expenditure Statistics By Fund Code
The Expenditure Statistics By Fund Code report displays paid and denied claim statistics grouped by fund code. For paid claims, the report lists the number of paid claim, the units of service provided on these claims, and the amount paid for these claims. For denied claims, the number of denied claims and the billed amount of those claims are provided. This report can display either encounter or aggregate payments information.
Expenditure Statistics By Fund Code Group
The Expenditure Statistics By Fund Code Group report displays paid and denied claim statistics grouped by fund code group. For paid claims, the report lists the number of paid claim, the units of service provided on these claims, and the amount paid for these claims. For denied claims, the number of denied claims and the billed amount of those claims are provided. This report can display either encounter or aggregate payments information.
Federal Reporting - Cash Recoupment Summary
The Federal Reporting - Cash Recoupment Summary report layout displays the FFYQ, fund code, date of recoupment, dollars recouped, A/R reason code, and date of original claim payment grouped by the federal fiscal year quarter (FFYQ). The report will be generated
Ohio MITS – Management and Administrative Reporting (MAR) Participant Guide August 25, 2010
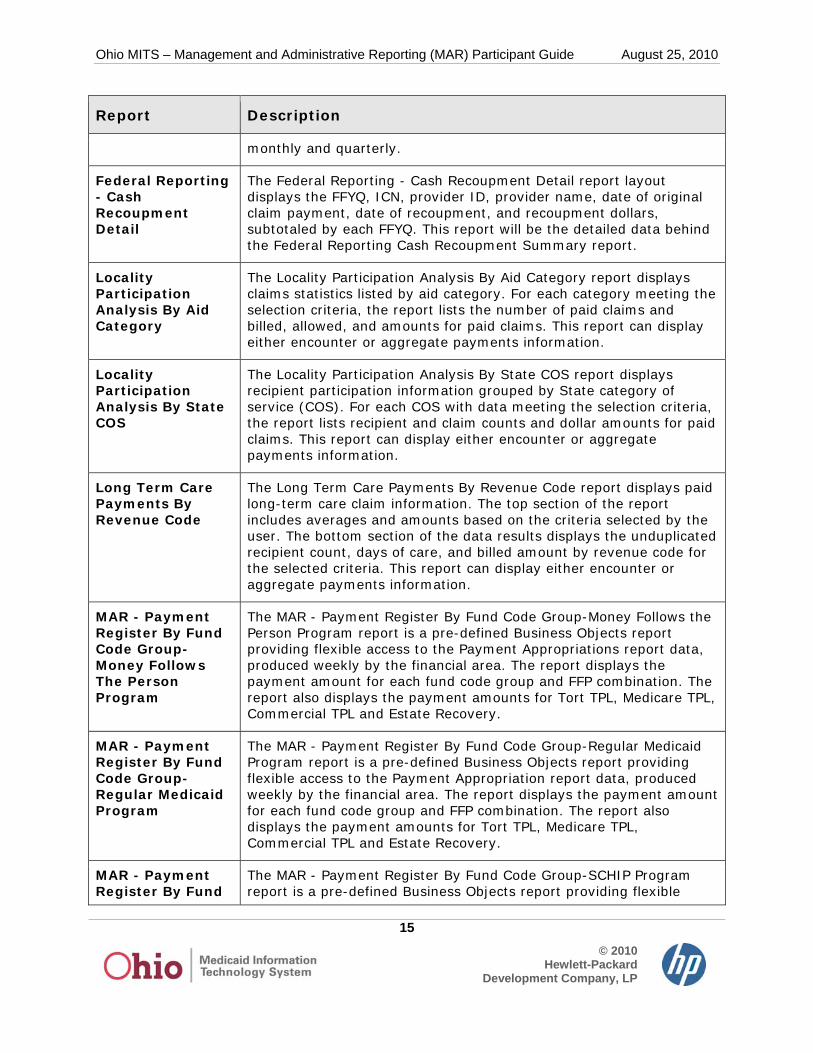
The Federal Reporting - Cash Recoupment Detail report layout displays the FFYQ, ICN, provider ID, provider name, date of original claim payment, date of recoupment, and recoupment dollars, subtotaled by each FFYQ. This report will be the detailed data behind the Federal Reporting Cash Recoupment Summary report.
Locality Participation Analysis By Aid Category
The Locality Participation Analysis By Aid Category report displays claims statistics listed by aid category. For each category meeting the selection criteria, the report lists the number of paid claims and billed, allowed, and amounts for paid claims. This report can display either encounter or aggregate payments information.
Locality Participation Analysis By State COS
The Locality Participation Analysis By State COS report displays recipient participation information grouped by State category of service (COS). For each COS with data meeting the selection criteria, the report lists recipient and claim counts and dollar amounts for paid claims. This report can display either encounter or aggregate payments information.
Long Term Care Payments By Revenue Code
The Long Term Care Payments By Revenue Code report displays paid long-term care claim information. The top section of the report includes averages and amounts based on the criteria selected by the user. The bottom section of the data results displays the unduplicated recipient count, days of care, and billed amount by revenue code for the selected criteria. This report can display either encounter or aggregate payments information.
MAR - Payment Register By Fund Code Group-Money Follows The Person Program
The MAR - Payment Register By Fund Code Group-Money Follows the Person Program report is a pre-defined Business Objects report providing flexible access to the Payment Appropriations report data, produced weekly by the financial area. The report displays the payment amount for each fund code group and FFP combination. The report also displays the payment amounts for Tort TPL, Medicare TPL, Commercial TPL and Estate Recovery.
MAR - Payment Register By Fund Code Group-Regular Medicaid Program
The MAR - Payment Register By Fund Code Group-Regular Medicaid Program report is a pre-defined Business Objects report providing flexible access to the Payment Appropriation report data, produced weekly by the financial area. The report displays the payment amount for each fund code group and FFP combination. The report also displays the payment amounts for Tort TPL, Medicare TPL, Commercial TPL and Estate Recovery.
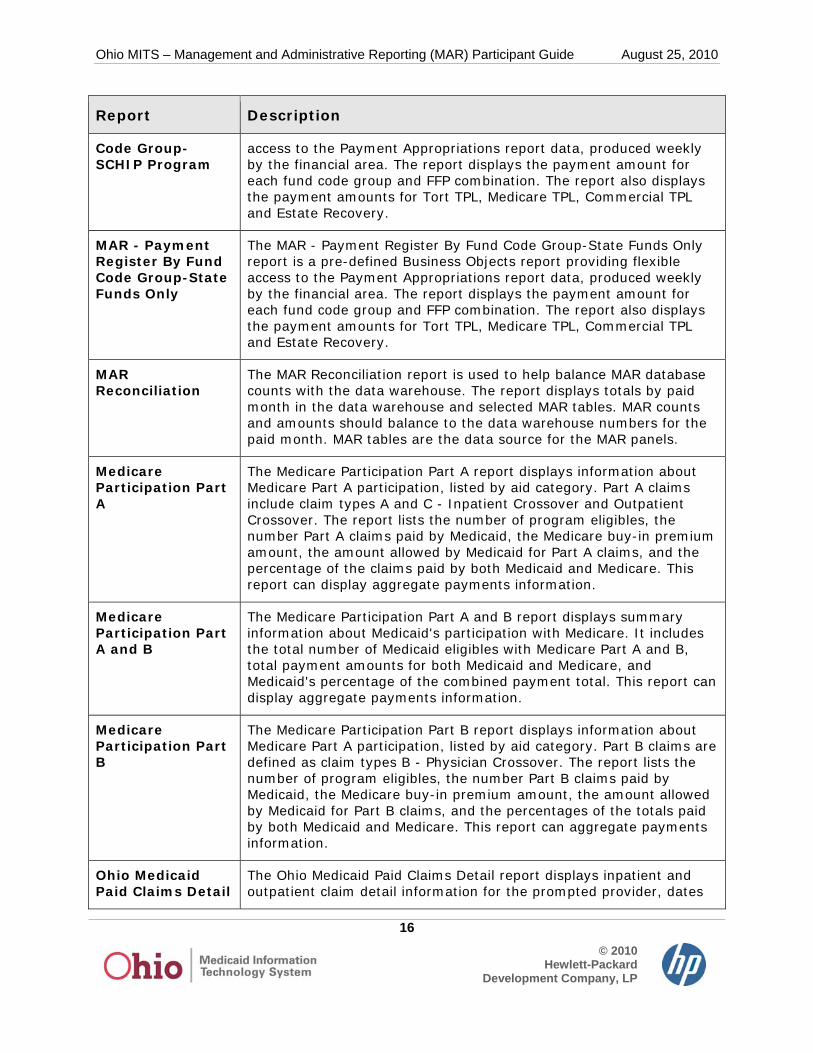
MAR - Payment Register By Fund
The MAR - Payment Register By Fund Code Group-SCHIP Program report is a pre-defined Business Objects report providing flexible
Ohio MITS – Management and Administrative Reporting (MAR) Participant Guide August 25, 2010
access to the Payment Appropriations report data, produced weekly by the financial area. The report displays the payment amount for each fund code group and FFP combination. The report also displays the payment amounts for Tort TPL, Medicare TPL, Commercial TPL and Estate Recovery.
MAR - Payment Register By Fund Code Group-State Funds Only
The MAR - Payment Register By Fund Code Group-State Funds Only report is a pre-defined Business Objects report providing flexible access to the Payment Appropriations report data, produced weekly by the financial area. The report displays the payment amount for each fund code group and FFP combination. The report also displays the payment amounts for Tort TPL, Medicare TPL, Commercial TPL and Estate Recovery.
MAR Reconciliation
The MAR Reconciliation report is used to help balance MAR database counts with the data warehouse. The report displays totals by paid month in the data warehouse and selected MAR tables. MAR counts and amounts should balance to the data warehouse numbers for the paid month. MAR tables are the data source for the MAR panels.
Medicare Participation Part A
The Medicare Participation Part A report displays information about Medicare Part A participation, listed by aid category. Part A claims include claim types A and C - Inpatient Crossover and Outpatient Crossover. The report lists the number of program eligibles, the number Part A claims paid by Medicaid, the Medicare buy-in premium amount, the amount allowed by Medicaid for Part A claims, and the percentage of the claims paid by both Medicaid and Medicare. This report can display aggregate payments information.
Medicare Participation Part A and B
The Medicare Participation Part A and B report displays summary information about Medicaid's participation with Medicare. It includes the total number of Medicaid eligibles with Medicare Part A and B, total payment amounts for both Medicaid and Medicare, and Medicaid's percentage of the combined payment total. This report can display aggregate payments information.
Medicare Participation Part B
The Medicare Participation Part B report displays information about Medicare Part A participation, listed by aid category. Part B claims are defined as claim types B - Physician Crossover. The report lists the number of program eligibles, the number Part B claims paid by Medicaid, the Medicare buy-in premium amount, the amount allowed by Medicaid for Part B claims, and the percentages of the totals paid by both Medicaid and Medicare. This report can aggregate payments information.
Ohio Medicaid Paid Claims Detail
The Ohio Medicaid Paid Claims Detail report displays inpatient and outpatient claim detail information for the prompted provider, dates
Ohio MITS – Management and Administrative Reporting (MAR) Participant Guide August 25, 2010
of services, and dates of payment ranges. The Service Date Range prompts represent the "From Date of Service" range for outpatient claims and the "Discharges Date" range for inpatient claims. The second tab of the report contains the report data without the heading. It was created so the user can easily sort the data once the report has been migrated to Microsoft Excel.
Ohio Medicaid Paid Claims Summary
The Ohio Medicaid Paid Claims Summary report displays a summary of inpatient and outpatient expenditures by revenue code. The report also displays inpatient days for revenue codes less than or equal to 0219, third party payment amounts, outpatient lab payments, a count of discharges before January 1, and a count of discharges after December 31.
Operational Performance Summary - Averages and Percents
The Operational Performance Summary - Averages & Percents report displays claims processing statistics, listed by provider type and specialty. It shows the average length of time for claims processing and the percentage of claims paid, corrected, and denied. This report can display aggregate payments information.
Operational Performance Summary - Dollars
The Operational Performance Summary - Dollars report displays billed amounts for paid, denied, and pending claims; total charges submitted; and the difference between billed amount and paid amounts on paid claims. The results are displayed for each provider type or specialty meeting the selection criteria. This report can also display aggregate payments information.
Operational Performance Summary - Provider
The Operational Performance Summary - Provider report provides information about the volume of processed claims, listed by provider type and specialty. It displays the number of original claims paid, denied, or pending; the number adjustment claims paid or denied; and the dollar amount for pending claims. This report can display aggregate payments information.
Payment Comparison By Category of Service
The Payment Comparison By Category of Service report is a comparison of claim payments by State category of service (COS) and sub-COS. It lists the number and amounts of paid claims for the month, the same month of the previous year, the State fiscal year to date (SFYTD), and the SFYTD for the previous year. This report can display either encounter or fee-for-service information.
Payment Comparison By Provider Type
The Payment Comparison By Provider Type report shows a comparison of claim payments by provider type and provider specialty. It lists the number and amounts of paid claims for the month, the same month of the previous year, the State fiscal year to date (SFYTD), and the SFYTD for the previous year. This report can display either encounter or aggregate payments information.
Ohio MITS – Management and Administrative Reporting (MAR) Participant Guide August 25, 2010
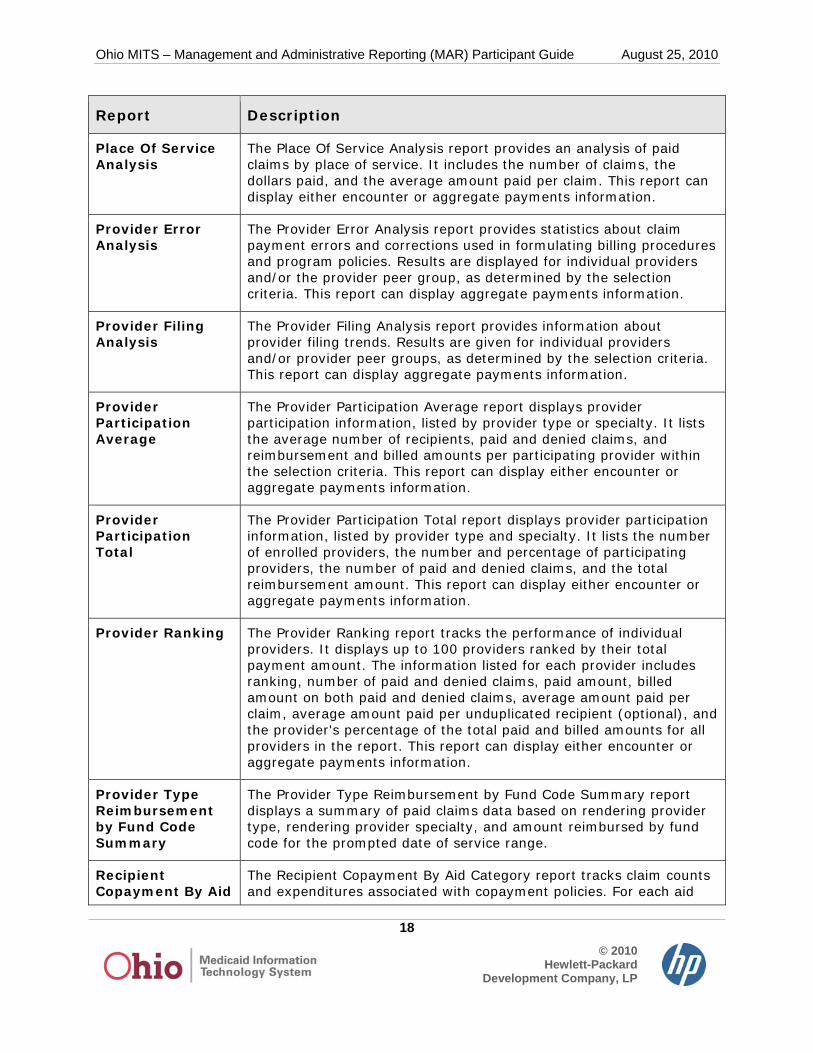
The Place Of Service Analysis report provides an analysis of paid claims by place of service. It includes the number of claims, the dollars paid, and the average amount paid per claim. This report can display either encounter or aggregate payments information.
Provider Error Analysis
The Provider Error Analysis report provides statistics about claim payment errors and corrections used in formulating billing procedures and program policies. Results are displayed for individual providers and/or the provider peer group, as determined by the selection criteria. This report can display aggregate payments information.
Provider Filing Analysis
The Provider Filing Analysis report provides information about provider filing trends. Results are given for individual providers and/or provider peer groups, as determined by the selection criteria. This report can display aggregate payments information.
Provider Participation Average
The Provider Participation Average report displays provider participation information, listed by provider type or specialty. It lists the average number of recipients, paid and denied claims, and reimbursement and billed amounts per participating provider within the selection criteria. This report can display either encounter or aggregate payments information.
Provider Participation Total
The Provider Participation Total report displays provider participation information, listed by provider type and specialty. It lists the number of enrolled providers, the number and percentage of participating providers, the number of paid and denied claims, and the total reimbursement amount. This report can display either encounter or aggregate payments information.
Provider Ranking The Provider Ranking report tracks the performance of individual providers. It displays up to 100 providers ranked by their total payment amount. The information listed for each provider includes ranking, number of paid and denied claims, paid amount, billed amount on both paid and denied claims, average amount paid per claim, average amount paid per unduplicated recipient (optional), and the provider's percentage of the total paid and billed amounts for all providers in the report. This report can display either encounter or aggregate payments information.
Provider Type Reimbursement by Fund Code Summary
The Provider Type Reimbursement by Fund Code Summary report displays a summary of paid claims data based on rendering provider type, rendering provider specialty, and amount reimbursed by fund code for the prompted date of service range.
Recipient Copayment By Aid
The Recipient Copayment By Aid Category report tracks claim counts and expenditures associated with copayment policies. For each aid
Ohio MITS – Management and Administrative Reporting (MAR) Participant Guide August 25, 2010
Category category, the report lists the number of claims paid, the number and percentage of claims with copayments, and the dollars for deducted copay and billed, allowed, and paid amounts. This report can display aggregate payments information.
Recipient Participation Summary By County
The Recipient Participation Summary By County report displays recipient participation statistics grouped by county. For each county, the report lists recipient and enrollee counts and dollar averages; the percent of enrollees participating; and the total dollar amount for paid claims. This report can display either encounter or aggregate payments information.
Recipient Ranking The Recipient Ranking report shows trends in usage for selected groups of recipients. It lists the highest-ranking 100 recipients by total amount of paid claims, as well as counts, amounts, averages, and percentages for billed, paid, and denied claims. This report can display either encounter or aggregate payments information.
Sterilization Detail
The Sterilization Detail report provides a monthly list of sterilization services claims. For each claim, it lists details such as recipient number, ICN, provider number, procedure code, diagnosis code, claim type, fund code, date paid, and amount paid. The report also provides totals for professional, outpatient, and inpatient services paid, as well as a grand total for all services.
Third Party Payment Ranking
The Third Party Payment Ranking report shows third-party payment trends by provider. It ranks the highest 100 providers by the percentage of the paid claim total paid by third parties. It also displays claim counts, dollar amounts, and percentages. This report can display either encounter or aggregate payments information.
Total CHIP Payment For Case Type J And Case Type K
The Payment Appropriation Report: Total CHIP Payment report displays appropriations for CHIP Payments for Case Type J (U2 + U3) & K by fund code.
Total For DA Takeback Claims By County
The Total for DA Takeback Claims report displays Medicaid paid amount by county.
Total Medicaid Expenditures and Healthy Start Expansion
The Payment Appropriation Report: Total Medicaid Expenditures and Healthy Start Expansion report displays appropriations for Medicaid and Healthy Start expansion expenditures by fund code.
Unknown MAS - BOE Assignment
The Unknown MAS - BOE Assignment report lists recipients who had an unknown MAS/BOE assignment during creation of the Medicaid
Ohio MITS – Management and Administrative Reporting (MAR) Participant Guide August 25, 2010