25
Management Excellence: The Metrics Reloaded An Oracle Thought Leadership White Paper September 2008

Management Excellence: The Metrics Reloaded An Oracle Thought Leadership White Paper September 2008

Management Excellence: The Metrics Reloaded Page 2
NOTE: The following is intended to outline our general product direction. It is intended for information purposes only, and may not be incorporated into any contract. It is not a commitment to deliver any material, code, or functionality, and should not be relied upon in making purchasing decisions. The development, release, and timing of any features or functionality described for Oracle’s products remains at the sole discretion of Oracle.

Management Excellence: The Metrics Reloaded Page 3
Management Excellence: The Metrics Reloaded
Executive Summary .......................................................................................... 4 Chapter 1: Management Excellence ............................................................... 5 Chapter 2: Stakeholder Environment: Gain to Sustain ............................... 7
Key Metrics.................................................................................................... 7 Chapter 3: Market Model: Investigate to Invest ........................................... 9
Key Metrics.................................................................................................. 10 Chapter 4: Business Model: Design to Decide............................................ 13
Key Metrics.................................................................................................. 14 Chapter 5: Chapter Business Plan: Plan to Act........................................... 17
Key metrics .................................................................................................. 17 Chapter 6: Business Operations: Analyze to Adjust .................................. 20
Key Metrics.................................................................................................. 20 Chapter 7: Business Results: Record to Report .......................................... 22
Key Metrics.................................................................................................. 22 Chapter 8: Call to Action................................................................................ 24 About Oracle Corporation............................................................................. 24

Management Excellence: The Metrics Reloaded Page 4
Management Excellence: The Metrics Reloaded
EXECUTIVE SUMMARY The key to enterprise performance management is to identify an organization’s value drivers, focus on them, and align the organization to drive results. It’s as simple as that; and it is the hardest thing to do. The fact that there are many management methodologies, such as the balanced scorecard, performance prism, and five forces to name just a few, makes it harder. What is the right framework? As many management processes are disconnected from other management and operational processes, the context for implementing such a methodology is missing.
Oracle’s Strategy-to-Success management framework provides that context. It consists of six management processes spanning the strategic, financial, and operational levels of the organization. In this paper we associate each of these processes with a relevant metrics framework and we provide some indicative metrics. Our aim here is not to be exhaustive, but to provide you the tools to do the same exercise within your own organization and reach a state of ‘management excellence’.
To get a full understanding of what ‘management excellence’ means, this white paper should be read together with “Management Excellence: How Tomorrow’s Leaders Will Get Ahead.” 1

Management Excellence: The Metrics Reloaded Page 5
CHAPTER 1: MANAGEMENT EXCELLENCE Most organizations don’t suffer from a shortage of data, management reports, and performance indicators. In fact, the opposite is true. There is an information overload and the amount of key issues to track seems to only increase. It is easier to come up with 200 performance indicators that might come in handy, than to converge them into the 20 or so really important ones. Many methodologies have been devised to help organizations create that strategic focus, but what methodology works best? There are domain-specific methodologies such as SCOR for supply-chain management, ITIL for IT-departments or GRI for sustainability reporting. And there are strategic methodologies such as the balanced scorecard, the performance prism or the EFQM framework (European Framework for Quality Management). And perhaps the most widely used ‘methodology’ is bottom-up reporting, based on what the organization is used to reporting on, and what is available in the systems.
The available methodologies seem to overlap and to compete, and there are no best practices on how to combine these methodologies. Until now. Organizations that strive for ‘management excellence’1 realize they need to align their management processes in the same way they have aligned their operationally excellent business processes.
Oracle’s Strategy-to-Success (S2S) framework introduces reference management processes to align an organization’s strategic, financial, and operational management activities. The framework expands the traditional scope of performance management to include the stakeholder environment, market model, and business model.
S2S consists of six steps, in which the output from one becomes the input for the next:
1. Understand the stakeholder environment 2. Scan the market 3. Strategize and develop the business model 4. Create and manage the business plan 5. Run the business operations 6. Provide feedback on all levels by measuring business results
1 “Management Excellence: How Tomorrow’s Leaders Will Get Ahead”, An Oracle Thought Leadership White Paper, September 2008, http://www.oracle.com/solutions/business_intelligence/index.html (under “White Papers”).
Management Excellence
Organizations seeking competitive differentiation realize that operational
excellence – optimizing cost, quality and speed – is not enough anymore.
Operational excellence needs to be extended with management excellence,
creating an organization that is smart, agile and aligned.

Management Excellence: The Metrics Reloaded Page 6
Figure 1: Strategy-to-Success: The Management Process Value Chain
The Strategy to Success framework combines several principles that are critical in driving management excellence.
First, it balances both an outside-in and inside-out approach in managing performance—explicitly including external views of the business by understanding stakeholder contributions and requirements as well as market dynamics. In contrast, traditional approaches to performance management are primarily focused on understanding internal business performance only. Clearly that is insufficient to achieving.
Secondly, because management processes are of strategic, financial, and operational nature, the key to success is aligning these processes across various levels as well as across business functions. Sound business results will only come from perfect execution of plans, making it imperative to connect the entire set of management processes. Even though traditional performance management only gradually starts to recognize the need to support management processes, it still treats these in isolation.
Thirdly, the S2S framework drives management excellence by recognizing that in order to create a learning organization that is agile, feedback loops between management processes are critical. This will allow companies to detect changes immediately, assess the impact on its plans, and quickly find alternative ways to reach its goals. These feedback loops should consist of the right key performance indicators on the operational, financial, and strategic management level.
Lastly, the S2S framework organizes the various performance management frameworks to be aligned. Each Strategy-to-Success management process has its own focus.
For each S2S management process, we will identify how to define and structure key performance indicators, as well as leading and lagging metrics.
Leading metric: a performance indicator that indicates future success. For
instance, 100% delivery within 24 hours is a leading indicator to customer
satisfaction for a national mail service.
Lagging metric: a performance indicator that indicates past results. For instance,
profit and market share are results of a successful strategy.

Management Excellence: The Metrics Reloaded Page 7
CHAPTER 2: STAKEHOLDER ENVIRONMENT: GAIN TO SUSTAIN Gain to Sustain is the management process for connecting corporate strategy with the interests of key stakeholders including employees, customers, suppliers, regulators, citizens, and investors. The purpose of this process is to ensure that a company gains all the necessary contributions from its stakeholders to drive business performance, while at the same time meeting the required
stakeholder expectations.
Leading companies improve the Gain to Sustain process to increase access to capital, have more engaged employees, and be able to build better relationships with their customers and suppliers by increasing the transparency of their business operations.
Key Metrics
Business results (lagging) Business drivers (leading)
Investors
• Shareholder value
• Earnings per share
• Market capitalization
• Capital structure mix
• Credit rating
Customers
• Customer satisfaction
• Share of wallet
• Mindshare, market share
• Product and service delivery
Employees • Employee satisfaction
and retention • Employer attractiveness
Suppliers • Supplier performance • Supplier profitability
• Switching cost
Regulators • Audit score • Compliance index
Society • Sustainability index • Positive press index
Overall • Value added • Brand value
Table 1: Gain to Sustain Performance Indicators
Key performance indicators within the ‘Gain to Sustain’ process should focus on an organization’s stakeholders, i.e. investors, customers, employees, suppliers, regulators, society, and other stakeholders in general. Credit rating is an interesting investor-related metric that is both leading and lagging. A high credit rating positively impacts an organization’s financial results and shareholder opinion. At the same time, this credit rating is the result of the confidence the rating agency has, (partly) based on past results. Most of the investor metrics, though, are lagging in nature. Earnings per share, market cap, and other related indicators are the result of

Management Excellence: The Metrics Reloaded Page 8
past action. Shareholder value is influenced by expected future results, but is the end result of a bottom-line analysis and therefore also lagging in nature.
Typical leading metrics for customers are mindshare on the strategic level, and product and service delivery quality on the operational level. Mindshare, the percentage of respondents that spontaneously mentions your brand as top-of-mind, drives future sales. Service and delivery quality drives customer satisfaction and share-of-wallet (how much of their budget customers have spent with you). Likewise, employer attractiveness is a leading indicator for getting a good team together, while high employee satisfaction and retention are the results.
Organizations should be interested in the profitability of their suppliers. It is a leading indicator for a successful relationship and the degree to which a supplier can invest in order to integrate within your administrative and logistical processes. A high supplier performance is the result.
Regulators and society have a similar way of looking at the organization. A positive press index and a good compliance index (to which extent the organization can ‘tick off’ all boxes demanded by the regulator) provide confidence in good corporate governance. This confidence can be the outcome of a regulator audit, or high ratings in a sustainability index, such as the Dow Jones Sustainability Index and others worldwide.
In general, the bottom-line performance indicator for the Gain to Sustain process is ‘added value’. Not only to the organization itself, but to all stakeholders.
Key methodology: Performance Prism2
2 Andrew Neely, Chris Adams, Mike Kennerly (2002), Performance Prism: The Scorecard for Measuring and Managing Stakeholder Relationships, Financial Times/Prentice Hall.

Management Excellence: The Metrics Reloaded Page 9
CHAPTER 3: MARKET MODEL: INVESTIGATE TO INVEST Investigate to Invest is the management process for identifying, evaluating and creating the most attractive market opportunities for investment. The purpose of this process is to select strategic alternatives to generate the highest returns. Which existing markets to focus in, which ones to enter and which markets to retract from. This process involves combining external
information, such as market intelligence and competitive intelligence, with internal analysis of the product or service portfolio performance as well as customer and geographic performance.
Leading enterprises benchmark their performance against key competitors, continuously monitor market alternatives, and are willing to invest in new markets or stop investing in existing markets if it is to the benefit of its stakeholders.
Management Excellence: The Metrics Reloaded Page 10
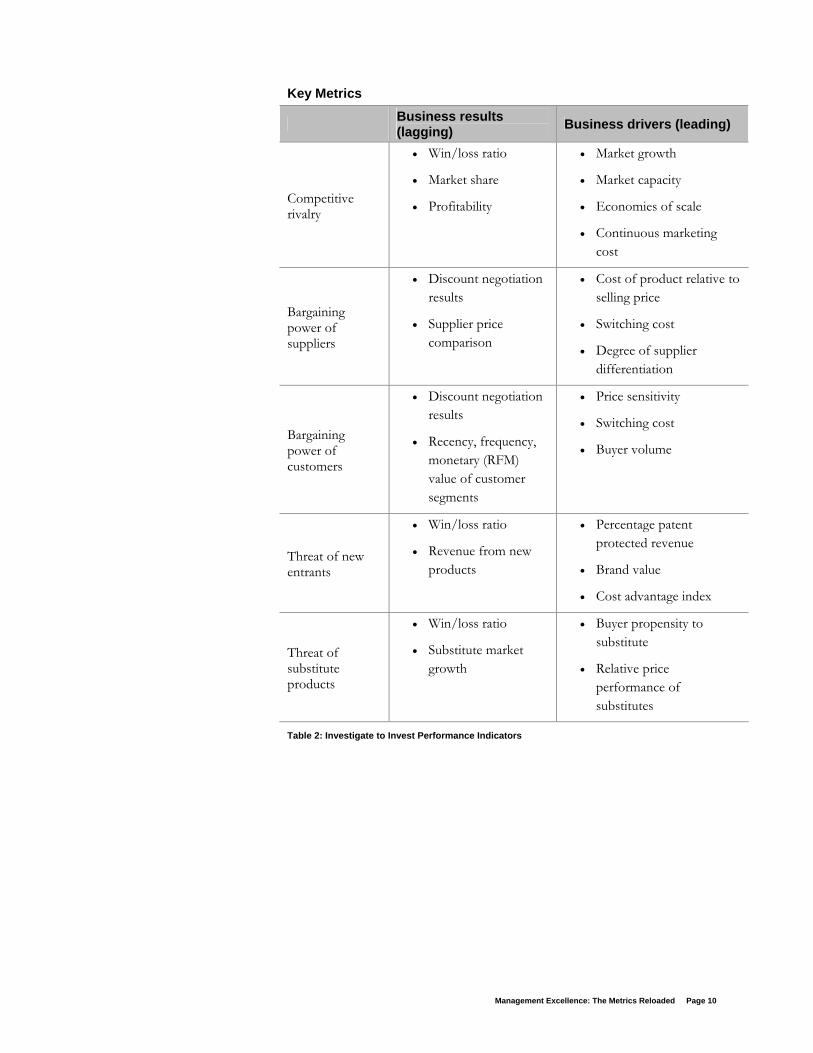
Key Metrics
Business results (lagging) Business drivers (leading)
Competitive rivalry
• Win/loss ratio
• Market share
• Profitability
• Market growth
• Market capacity
• Economies of scale
• Continuous marketing cost
Bargaining power of suppliers
• Discount negotiation results
• Supplier price comparison
• Cost of product relative to selling price
• Switching cost
• Degree of supplier differentiation
Bargaining power of customers
• Discount negotiation results
• Recency, frequency, monetary (RFM) value of customer segments
• Price sensitivity
• Switching cost
• Buyer volume
Threat of new entrants
• Win/loss ratio
• Revenue from new products
• Percentage patent protected revenue
• Brand value
• Cost advantage index
Threat of substitute products
• Win/loss ratio
• Substitute market growth
• Buyer propensity to substitute
• Relative price performance of substitutes
Table 2: Investigate to Invest Performance Indicators

Management Excellence: The Metrics Reloaded Page 11
The Investigate to Invest process benefits from a good understanding of one of the best recognized frameworks for market analysis, Porter’s Five Forces model.
Figure 2: Porter’s Five Forces
Most organizations have some competitive intelligence in place, but often not deeply connected to its own business intelligence. The Strategy-to-Success framework suggests a tighter integration. Most of the information in the Investigate to Invest process will be external in nature. This starts with the traditional performance indicators such as market share, win/loss ratios against all major and new competitors, and profitability analysis. More leading metrics to assess the attractiveness of a certain market would be market growth, the existence of overcapacity, the opportunity to create economies of scale, and the need for continuous marketing costs. Additional forces of competition come from new entrants in the market and other substitute markets. For instance, think of high-speed trains competing with short-haul flights, mobile phones competing with mp3-players, or the supermarket gourmet section competing with restaurants. Key performance indicators to track successful competition would be the extent to which buyers are likely to substitute, and a price performance comparison. In the case of new entrants, it makes sense to track which part of the revenue is protected by patents, for example. Buyer preference may come from brand value (which at the same time is also a lagging metric, as brand value is impacted by customer loyalty), and an assessment of how unique certain cost advantages are. Tracking fixed cost as part of overall cost is important in assessing how easy it is to withdraw from a market and allocate resources elsewhere.
Although suppliers and customers are different from competitors (unless there is a high degree of forward and backward integration in the value chain), they impact an organization’s competitive performance as well. Suppliers and customers have bargaining power. This is shown in discount negotiations (of the organization towards its suppliers as well as the customers towards the organization), but there are more leading metrics as well. Suppliers have a high bargaining power if the cost of their product is a large part of the selling price of your product. Think of the

Management Excellence: The Metrics Reloaded Page 12
screens of laptops, or the batteries for a hybrid car, or the price of oil as part of the cost of a flight. The bargaining power of suppliers increases when the switching costs are high, even when there are many comparable suppliers.
Customers have a high bargaining power if there is high price sensitivity in a market and if the switching costs are low. Loyal customers that have a very high volume have special power too. Think, for instance, of supermarkets who have the power to negotiate prices below the actual cost of a product.
Minding customers and suppliers is part of the Gain to Sustain management process as well, and various other key performance indicators overlap too.
Key Methodology: Five Forces 3 4
3 http://en.wikipedia.org/wiki/Porter_5_forces_analysis. 4 Michael E. Porter (January 2008), “The Five Competitive Forces That Shape Strategy,” Harvard Business Review, Boston.

Management Excellence: The Metrics Reloaded Page 13
CHAPTER 4: BUSINESS MODEL: DESIGN TO DECIDE Design to Decide is the management process for designing the business infrastructure and partner network to deliver value to customers in the most profitable way. The purpose of this process is to select the optimal configuration in connecting the company’s value chain. This process involves scenario analysis to determine the company’s product portfolio, outsourcing strategy, business
partners and channels, acquisition and divestment strategy, as well as its financing strategy.
Leading companies are continuously looking for different ways to reach their goals, instead of sticking to a fixed plan. Through techniques such as scenario analysis and what-if modeling, they are able to see changes in the market before anyone else and have the strategic ability to continuously capitalize on these changes.

Management Excellence: The Metrics Reloaded Page 14
Key Metrics
Business results (lagging) Business drivers (leading)
Financial perspective
• Economic value added (EVA)
• Shareholder value
• Customer perspective metrics
• Process perspective metrics
Customer perspective
• Customer satisfaction
• Revenue growth
• Brand value
• Process perspective metrics
Process perspective
• Productivity, operational excellence benchmark (time to market, cost, quality)
• Customer profitability
• Direct/indirect channel mix
• Revenue from new products
• Compliance rating
• Growth/learning perspective metrics
Growth/learning perspective
• Skills/competencies match
• IT effectiveness benchmark
• Impact (monetary, time, quality) of improvement initiatives
• (Economic value added, shareholder value)
Table 3: Design to Decide Performance Indicators
The categories in Table 3 represent the balanced scorecard perspectives. The balanced scorecard is most successful if it serves as the connection point between strategy formulation and strategy execution. It is not enough to ‘simply’ calculate the expected return on investment for each typical Design to Decide area of attention (product portfolio, outsourcing strategy, business partners and channels, acquisition and divestment strategy); they need to fit in the overall strategic concept. A balanced scorecard strategy map provides such a context.

Management Excellence: The Metrics Reloaded Page 15
Figure 3: Reference Strategy Map5
Strategy maps assume a cause-and-effect relationship between the four perspectives of the balanced scorecard. If you keep learning and adapting, and you know how to run a good business, clients will be happy and keep coming back—which has a positive effect on the bottom line. Or conversely, if you don’t keep up with the changes in the market and the organization is not running smoothly, customers will leave—which has a negative effect on the bottom line. For each perspective there are several objectives that describe the characteristics of the strategy. Some will be unique, fitting the specific culture and values of the organization, and others will be generic, describing trends in the industry. The balanced scorecard and, even more, the strategy map can have a dramatic effect on an organization’s focus and alignment. It becomes clear which activities drive success and which don’t. The organization can focus on its value drivers with confidence. Organizational alignment is achieved when the balanced scorecard is seen as a communication and collaboration instrument (instead of a classical management information system), aimed at command and control. Discussing the cause-and-effect relationships leads to a common understanding of how the various parts of the business relate.
Strategy maps help create leading indicators instead of lagging indicators. At first thought, the term “leading indicator” may look strange. Are measurements not lagging per definition, as you can only measure something once it has happened? How can indicators then be predictive or leading? It is when performance indicators are linked together in a cause-and-effect relationship that they become predictive. For instance, sustained customer satisfaction, revenue growth, and brand value combined with operationally excellent business processes have a positive effect on an organization’s bottom line success, including shareholder
5 Robert S. Kaplan, David P. Norton (2004), Strategy Maps: Converting Intangible Assets into Tangible Outcomes, Harvard Business Press, Boston.

Management Excellence: The Metrics Reloaded Page 16
value. In turn, an efficient process, an effective channel mix, new product introductions, and a positive press on business practices lead to higher customer success. Tomorrow’s success in operations and customer recognition comes from having the right skills and competencies, well functioning IT systems, and effective ways to improve the organization’s ways of working.
We’ve added EVA and shareholder value as leading metrics for the growth and learning perspective, to show sustainable success is a virtuous cycle. Financial success allows an organization to invest in its future.
Key methodology: Balanced Scorecard6
6 Robert S. Kaplan, David P. Norton (1996), Balanced Scorecard: Translating Strategy into Action, Harvard Business Press, Boston.
Management Excellence: The Metrics Reloaded Page 17
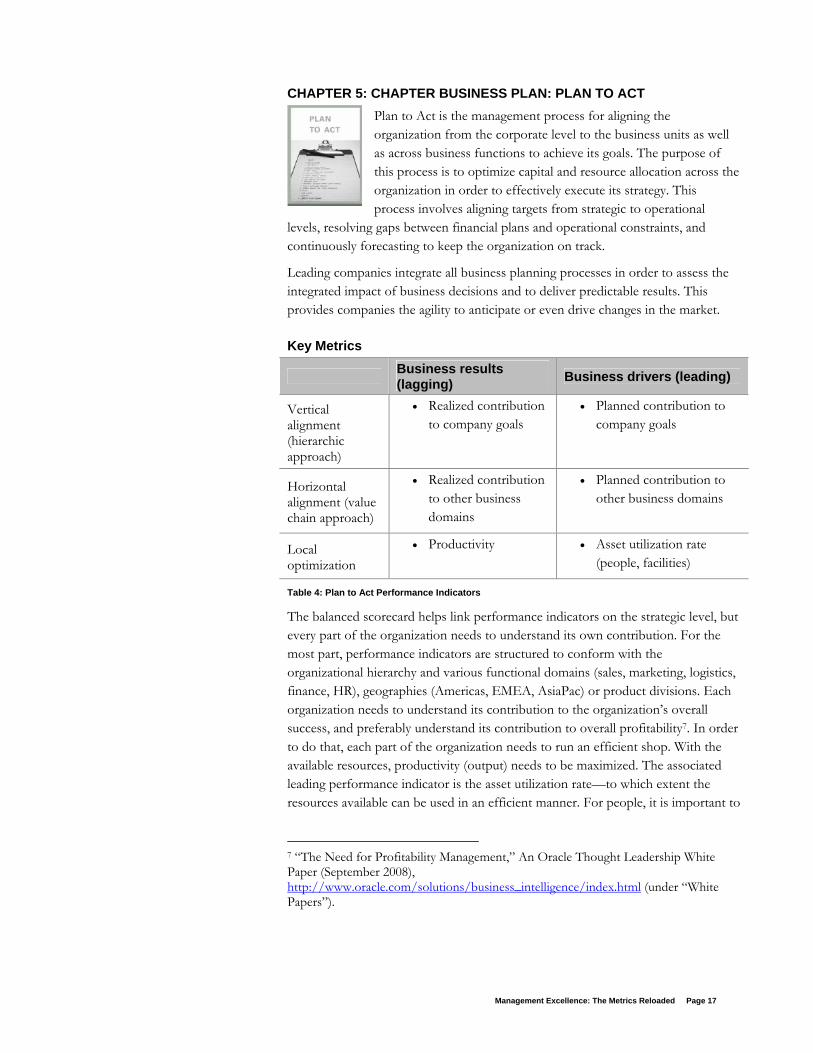
CHAPTER 5: CHAPTER BUSINESS PLAN: PLAN TO ACT Plan to Act is the management process for aligning the organization from the corporate level to the business units as well as across business functions to achieve its goals. The purpose of this process is to optimize capital and resource allocation across the organization in order to effectively execute its strategy. This process involves aligning targets from strategic to operational
levels, resolving gaps between financial plans and operational constraints, and continuously forecasting to keep the organization on track.
Leading companies integrate all business planning processes in order to assess the integrated impact of business decisions and to deliver predictable results. This provides companies the agility to anticipate or even drive changes in the market.
Key Metrics
Business results (lagging) Business drivers (leading)
Vertical alignment (hierarchic approach)
• Realized contribution to company goals
• Planned contribution to company goals
Horizontal alignment (value chain approach)
• Realized contribution to other business domains
• Planned contribution to other business domains
Local optimization
• Productivity • Asset utilization rate (people, facilities)
Table 4: Plan to Act Performance Indicators
The balanced scorecard helps link performance indicators on the strategic level, but every part of the organization needs to understand its own contribution. For the most part, performance indicators are structured to conform with the organizational hierarchy and various functional domains (sales, marketing, logistics, finance, HR), geographies (Americas, EMEA, AsiaPac) or product divisions. Each organization needs to understand its contribution to the organization’s overall success, and preferably understand its contribution to overall profitability7. In order to do that, each part of the organization needs to run an efficient shop. With the available resources, productivity (output) needs to be maximized. The associated leading performance indicator is the asset utilization rate—to which extent the resources available can be used in an efficient manner. For people, it is important to
7 “The Need for Profitability Management,” An Oracle Thought Leadership White Paper (September 2008), http://www.oracle.com/solutions/business_intelligence/index.html (under “White Papers”).

Management Excellence: The Metrics Reloaded Page 18
track absenteeism; for facilities and machinery it is production time as part of overall available time.
However, there is a danger associated with vertical alignment (each part of the organization maximizing its use of resources): local optimizations. The question of whether redistribution of resources will lead to higher overall results is only asked on the executive level, and may be challenged fiercely by middle management. Next to vertical alignment, horizontal alignment is needed. Every part of the organization should also know what it contributes to the other parts of the organization, upstream and downstream of the value chain. It is peculiar that often this is not the case, as most value drivers are more process-oriented than hierarchy-oriented. Take, for instance, one of the most important drivers for customer satisfaction in an insurance company: processing speed of claims. A claim that is rejected quickly leads to fewer customer satisfaction issues than a claim rewarded after months. However, the claims department only partly controls this performance indicator. It depends on the skills and training of the people, the quality of the IT systems, and the underwriting department accepting the right risks. Or think of ‘triple play’ offerings (telephony, internet, TV) from telecoms. The most important performance indicator is ‘first time right’, making sure the installation of the offering is flawless. This requires tight integration of planning processes between the various product pillars within the telecom company. Whereas normally they would optimize their operation by planning large batches, in this integrated environment the unit of optimization is each single installation. Lastly, consider the aerospace industry, where ‘zero defect’ is a dominant performance indicator. Every single business function is involved in achieving this target. It starts with the design function, making sure every part only fits in one particular way, and it ends with rigorous tests and quality checks. Everyone is responsible.
Every department needs to understand its contribution and impact on other departments. Taking this value chain approach, defining performance indicators per business domain may not bring optimized results. Most delays, quality problems, and associated costs occur between business domains—handing over work from one function to the next. These handovers are called business interfaces and they need metrics as well. What is the average waiting time of transactions between business domains? What percentage of transactions flows flawlessly through the various processes and systems?

Management Excellence: The Metrics Reloaded Page 19
Management reporting using vertical alignment improves an organization’s accountability. It is clear whether managers make their assigned targets or not. Horizontal alignment improves an organization’s responsibility. Managers need to keep an eye on what they achieve for others, and know their contribution to the goals of the customer.
Key methodology: Performance Leadership Framework8
8 Frank Buytendijk (2008), Performance Leadership, McGraw-Hill, New York.

Management Excellence: The Metrics Reloaded Page 20
CHAPTER 6: BUSINESS OPERATIONS: ANALYZE TO ADJUST Analyze to Adjust is the management process for analyzing deviations from a company’s goals in order to take corrective actions. The purpose of this process is to detect variances between execution and plans, analyze the causes and trends of these variations, and determine the best possible responses. This process involves actions ranging from immediate tactical responses, such as
changing a customers’ credit status, to adjusting the business plan or even reevaluating the strategy, depending on the magnitude of the impact.
Leading companies have a multitude of analytics within every single business domain and have established a single version of the truth in their data, metadata, and master data across these analytics. This allows them to create leading metrics and a chain of cause-and-effect throughout their complete business.
Key Metrics
Business results (lagging) Business drivers (leading)
Financial • Order to cash cycle
time • Delivery efficiency
Sales • Revenue • Pipeline conversion rate
Marketing • Leads • Campaign effectiveness
Delivery • Service level • Backorder time
HR • Absenteeism, tenure • Employer attractiveness
IT • Business performance • Development/operations
cost mix
Table 5: Analyze to Adjust Performance Indicators
Traditionally, management information has always been financial in nature. However, understanding operational drivers improves the predictability of financial outcomes9. In the Plan to Act process, we already described the need for each business function to run an efficient shop. Every functional domain has and needs its own specific management information. Table 5 provides an indicative example for a number of business domains.
The key question that many organizations struggle with is whether to adopt ‘best practice’ metrics and reports as part of a packaged application, or to develop their own specific metrics.
9 “Integrating Operations and Finance: A Two-Way Street,” An Oracle Thought Leadership White Paper, August 2008, http://www.oracle.com/solutions/business_intelligence/index.html (under “White Papers).

Management Excellence: The Metrics Reloaded Page 21
It should be said that even if companies operate in the same industry or have the same core strategy, they will still need different metrics. Most likely, the two companies are in a different maturity phase, have different skills and competencies, and have different strategic initiatives to differentiate from their competition. Specific organizations will each have their own, unique strategic performance indicators. And so they should. Copying best practices does not lead to strategic differentiation.
However, in managing day-to-day operations on a more tactical and operational level, there is no added value in reinventing the wheel. What is the point of having your own definition of absenteeism, or days sales outstanding? And next to these standard performance indicators, every industry has its own specific metrics reflecting the specifics of that industry. For those generic and industry-specific performance indicators, organizations should simply use the metrics and reports that come with their business applications and their business intelligence systems. Oracle’s BI Applications comprise 26 different areas across multiple industries and offer over 5,000 metrics out of the box. The time saved implementing these standard metrics can better be spent on crafting the right strategic metrics.
Where in the Plan to Act process managers focus on identifying value drivers across the value chain, in the Analyze to Adjust process variances between actuals, plans, and forecasts are analyzed, and linked to the identified value drivers. Horizontal alignment means that organizations should have a single version of the truth in their metadata and master data, in order to track variances across the cause-and-effect chain.
Key framework: Oracle Business Intelligence Applications10
10 http://www.oracle.com/appserver/business-intelligence/bi-applications.html.

Management Excellence: The Metrics Reloaded Page 22
CHAPTER 7: BUSINESS RESULTS: RECORD TO REPORT Record to Report is the management process for providing strategic, financial, and operational feedback to understand how a business is performing. This process involves collecting, transforming, and delivering relevant, timely, and accurate information to all stakeholders inside and outside the organization in order to provide insight into how their expectations have been met.
Leading companies accelerate their financial close process to report their results to regulators and investors as fast as possible. In addition, they ensure the reporting of accurate and reliable information to prevent financial re-statements that could cause severe financial consequences. Leading companies have also started to provide maximum transparency to stakeholders—not only from a financial perspective, but also including the impact on economic, environmental, and social factors.
Key Metrics
Business results (lagging) Business drivers (leading)
Cost
• Management process efficiency and cost as part of overall business cost
• Span of control
Quality • Forecast accuracy
• % KPIs implemented
Speed
• Forecast cycle time, time to close, time to report
• Management productivity
Smart • Performance impact new
initiatives, innovations and new business models
Agile • Response time to market
changes
Aligned
• Sustainable success
• Return on assets, investments, equity
• Return on stakeholder
• Stakeholder performance (see gain to sustain process)
Table 6: Record to Report Performance Indicators
Management excellence means that organizations create competitive advantage by having superior management processes, making the organization smart, agile, and aligned. This means management processes should be managed using performance

Management Excellence: The Metrics Reloaded Page 23
indicators as much as operational processes. The Record to Report process does two things. It is the process of providing feedback to all other management processes in the S2S framework. This happens as a last step in the framework because only if you drive strategies all the way to execution can there be a tangible business result. The metrics described in the other processes would be examples of that feedback.
But the Record to Report process also has its own function: managing management processes themselves. Management processes must first be efficient. A key performance indicator to express cost could be measuring the cost of management processes as part of overall business costs. They should not exceed a certain percentage. The best indicator for quality would be forecast accuracy—to which extent managers are supported by well-functioning management processes to continually keep them in touch with reality. Speed is important too. Forecasts have a certain cycle time, and the shorter the cycle time, the higher the periodicity of a forecast can be. Other important indicators are ‘time to close’ and ‘time to report’—which is the number of days needed to consolidate the figures coming from the various business systems, and subsequently being able to report them to the external world.
But efficiency is not enough. Management processes need effectiveness performance indicators as well, to ensure that the organization is smart, agile, and aligned. Organizations can prove they are smart by measuring the performance impact of new initiatives, as the business environment is continuously changing. The bottom-line metric for agility would be ‘time to respond’. And to complete the circle, connecting the Record to Report process with the Gain to Sustain process, the true measure of alignment between the organization and its environment is stakeholder performance.
If your strategies and business practices add value, not only to your organization but to all stakeholders as well, there is a virtuous circle. Value is created for the complete ecosystem, instead of subtracted from the ecosystem as a zero-sum game. And that is the precondition for sustainable success.
Key methodology: Strategy–to-Success Framework11
11 “Management Excellence: How Tomorrow’s Leaders Will Get Ahead,” An Oracle Thought Leadership White Paper, September 2008, http://www.oracle.com/solutions/business_intelligence/index.html (under “White Papers”).

Management Excellence: The Metrics Reloaded Page 24
CHAPTER 8: CALL TO ACTION Most organizations have the majority of the puzzle pieces, but usually not put together so as to see the big picture. Management processes and management reports are often disconnected. Organizations should use the S2S management framework to align the pieces already there, and identify redundant as well as missing pieces.
Identifying the right performance indicators cannot be done without understanding what the right management processes should look like. Lessons from this white paper should be applied in conjunction with the insights from the other management excellence white papers.
ABOUT ORACLE CORPORATION Oracle is the leader in Enterprise Performance Management (EPM), unifying Performance Management and Business Intelligence (BI), supporting a broad range of strategic, financial and operational management processes. Oracle provides a complete and integrated system for managing and optimizing enterprise-wide performance. This allows organizations to achieve a state of management excellence – being smart, agile and aligned - which provides competitive advantage and leverages their operational investments.
• Smart – Leverage market-leading products and technologies that address enterprise-wide requirements and drive new insights into your business
• Agile – Enable advanced integration that improves agility and lowers costs of ownership
• Aligned – Drive pervasive intelligence across the enterprise by linking strategic, financial and operational management processes
For more information, go to http://www.oracle.com/epm. Contact us with any comments or questions at [email protected].

Management Excellence: The Metrics Reloaded September 2008 Authors: Frank Buytendijk, Thomas Oestreich Oracle Corporation World Headquarters 500 Oracle Parkway Redwood Shores, CA 94065 U.S.A. Worldwide Inquiries: Phone: +1.650.506.7000 Fax: +1.650.506.7200 oracle.com Copyright © 2008, Oracle. All rights reserved. This document is provided for information purposes only and the contents hereof are subject to change without notice. This document is not warranted to be error-free, nor subject to any other warranties or conditions, whether expressed orally or implied in law, including implied warranties and conditions of merchantability or fitness for a particular purpose. We specifically disclaim any liability with respect to this document and no contractual obligations are formed either directly or indirectly by this document. This document may not be reproduced or transmitted in any form or by any means, electronic or mechanical, for any purpose, without our prior written permission. Oracle is a registered trademark of Oracle Corporation and/or its affiliates. Other names may be trademarks of their respective owners.


