Page 1
1
Management Guru: Journal of Management Research
Peer Reviewed Journal Monthly Issue, May, 2020, Vol. VIII, Issue 04
RNI Registration No. : MAHENG/2012/47953 ISSN No. : 2319-2429 Date of Publication : 15th May, 2020 Owner, Publisher & Printer : Sharayu Chandrashekhar Ashtikar Editor : Sharayu Chandrashekhar Ashtikar
Address for Communication
Bldg. 2-A/203, Om Laxmi Narayan Park Society, Opp. Shri Hari Mangal Karyalaya, Anand Nagar, Pandurang Wadi,
Near Gavdevi Mandir, Manpada Road, Dombivli (East) 421201
Address B-7/501, Vijay Park, Kasar Vadavali, Ghodbunder Road,
Thane (W) 400615. Mobile:7506707761/9967357415
Email : [email protected] Website : www.sharayuprakashan.com
Printed, Published and Owned By Sharayu Chandrashekhar Ashtikar. Printed at Shri Ganesh Enterprises, A111 Amargyan Industrial Estate Pokharan Road, No 1, off , S.T. WorkShop, Thane (W) and Published at B-7/501 Vijay Park, Kasar Vadavali, Ghodbunder Road, Thane (W) 400615. Editor: Sharayu Chandrashekhar Ashtikar.
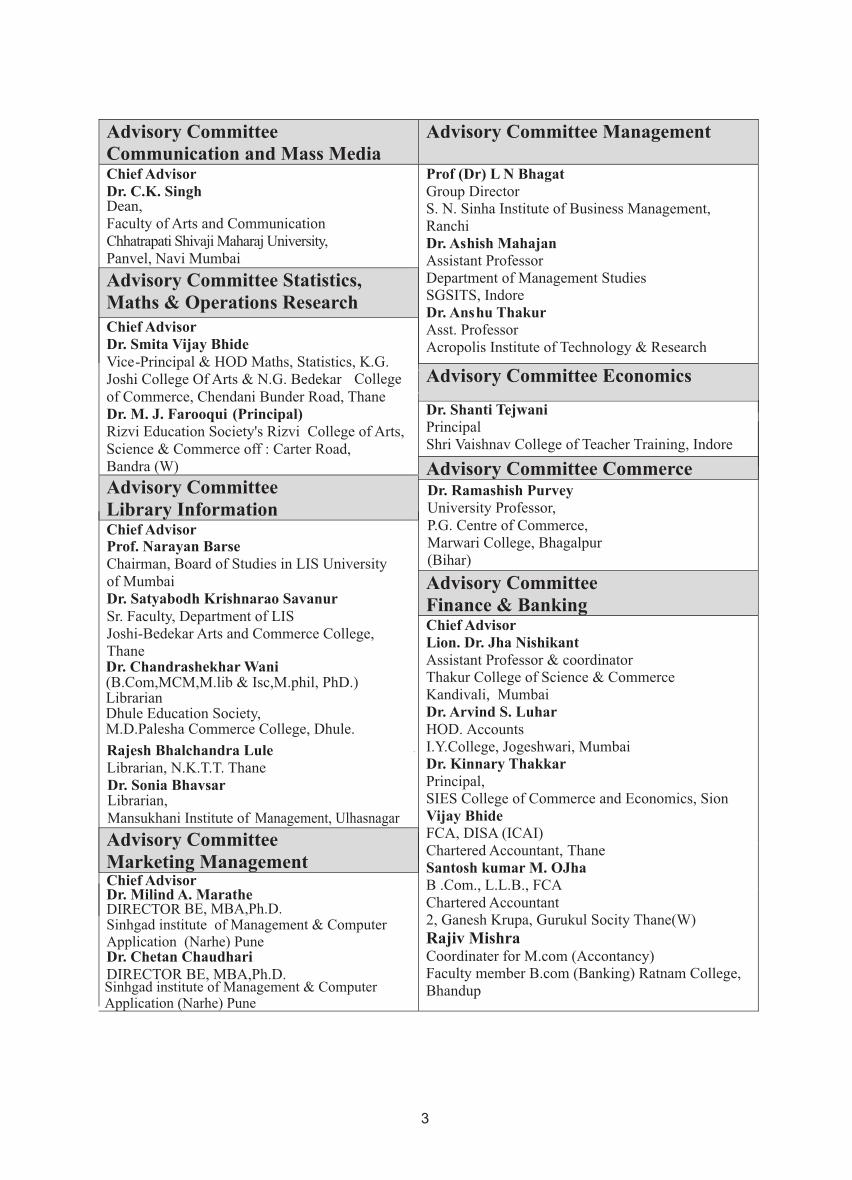
Editorial Board Mrs . Sharayu C. Ashtikar : Chief Editor Dr. C.D.Ashtikar : Founder Editor Dr. S. Ravi shankar : Member Dr. Indrajit Prasad Roy : Member Dr. Ramashish Purvey : Member Dr. Shraddha B home : Member Dr. Mayuresh Mule : Member Dr. Chandrashekhar Wani : Member
Page 5
5
CONTENTS
Sr. No.
Author’s Name Title Name Page No.
1 Anshu Veenapani
Smart Village Concept and Sustainable
Development : Issues
in India
6
2 Dr. Dimpal Rani An Analysis of NPAs in Commercial
Banks 10
3 Dr. Kumari Anita Roy Role of Indian regional Rural banks in
the priority sector lending 15
4 Dr. Sanyukta Kumari Performance of Public Sector
Enterprises (PSEs) 20
5 Dr. Sandeep Kumar Yadav Policies and Programmes to Regulate
Stock Market by SEBI 25
6 Kishor Kumar Mishra An Analysis of NPAs in Public &
Private Sector Banks 31
7 Dr. Lucy Kumari A Study On Extent of Agricultural
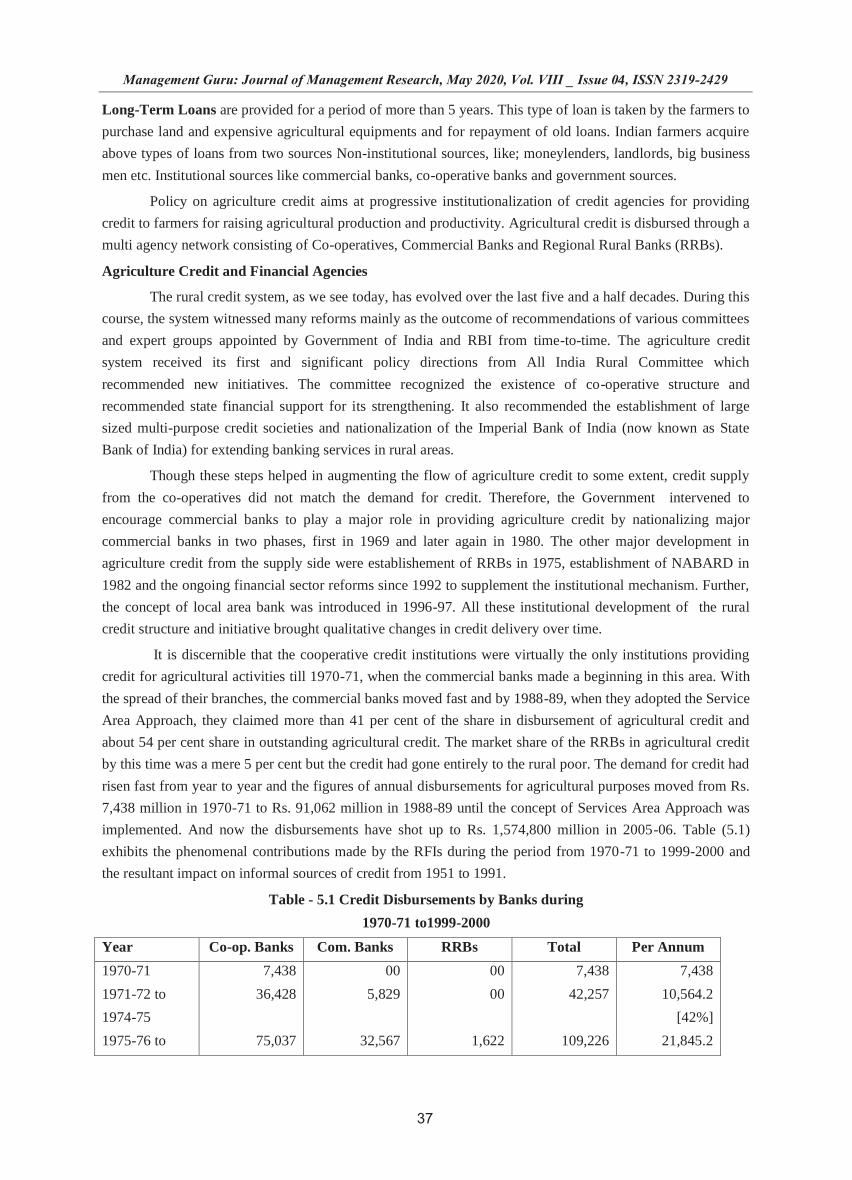
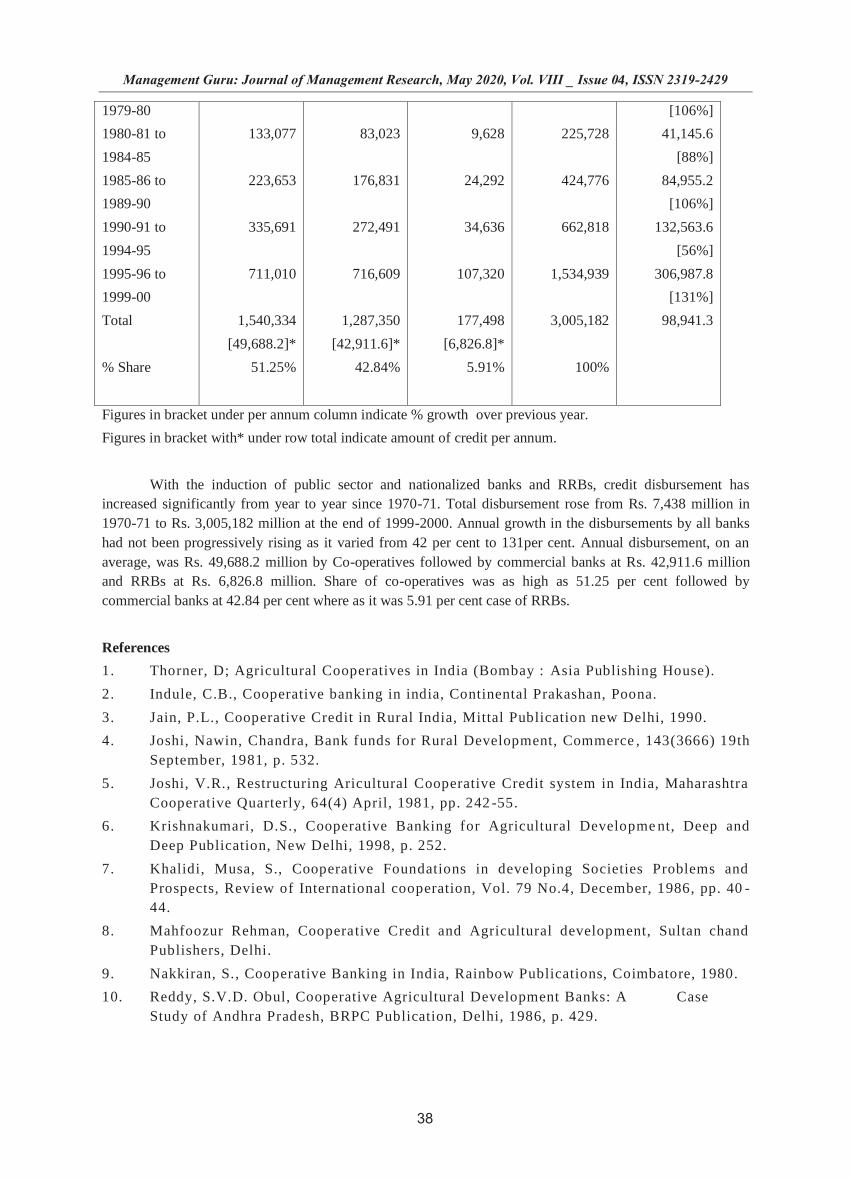
Credit Disbursements 36
8 Dr. Md. Izhar Ali Challenges Faced by Womens
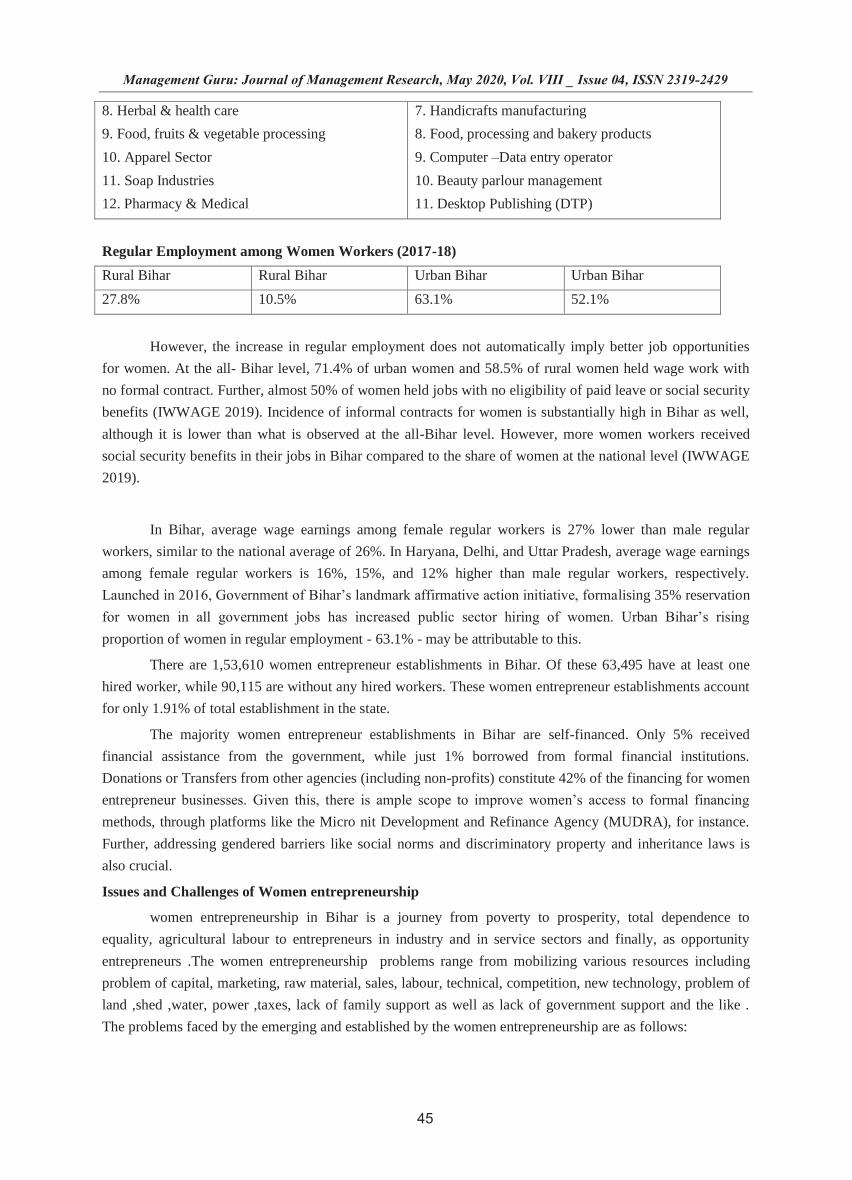
Entreprenures in Bihar 44
9 Nirlesh Kumar Rural Development in India : Issues &
Challenges 49
10 Dr. Niru Kumari Development and Working of
Commercial Banks in Khagaria District 56
11 Dr. Rajesh Pathak Problems related to Agricultural Credit
in India 62
12 Sachin Raj Performance of LIC of India 65
13 Sapana Kumari A Study on Women Entreprenures in
India 69
14 Dr. Santosh Kumar Role of Cooperative Banks in Motihari
(East Champaran) 74
and Challenges
15
79Dr. Rupesh Kumar
Growth of National Thermal Power
Corporation Limited (NTPC)
Page 6
Smart Village Concept and Sustainable Development : Issues
and Challenges in India
Anshu Veenapani Research Scholar
Univ. Deptt. of Commerce & Business Administration
T.M. Bhagalpur University, Bhagalpur
Introduction
According to Niti Ayog, a settlement with a maximum population of 15,000 is considered as a village.
Much of Indian’s rural population lives in nucleated villages, which have a settlement form described as
shapeless agglomerate. India being a rural dominated country, the smartness concept is not even thought about
in the rural areas. The population of rural areas comprised of 68.84 percent as per 2011 census in India. Large
scale migration of people from rural to urban areas has its own risk parameters on the urban centres. If the
vision of the founders of the nation is to be respected and implemented, then we will have the responsibility to
make our villages smart, which means self-sufficient, healthy and educated villages. To make the villages
smart means to make the country self-reliant, stronger and secured. Some of the ways include offering basic
facilities, education, employment generation activities, technology etc.
Conceptual framework
The concept of the smart village is not constructed on the image of a city or a very developed village
of some states or nations. It is not an adopted smartness, but an avenue to show the inherent smartness of the
villages.
One of the most important factors totally disregarded by the development policies and programmes,
misinterpreted heavily and ill considerate for many years is to make the villagers’ sense of progressiveness
and belonging to their own villages more concrete and visible through public policies or institutions. The soul
of India lives in its villages. Close to 70 percent of India’s population still insides in more than 2.5 lakh
villages. This is the food basket of the nation. Village Panchayats have become the centres of grass root
democracy. However, the holistic development of rural India is still under tremendous pressure owing to the
declining farm output, increasing trend of distressed migration, absence of basic amenities and emerging
problems of environmental pollution and comforts.
The general imagination of the people in urban areas is that the rural is a static, timeless domain
where people are bare a minimalists who lack ambition and entrepreneurship. Given an opportunity, a village
has all the potential to be at par with all sorts of development socially, scientifically, economically and
environmentally. If we know the ecosystem of the Indian villages, truly there are all the opportunities and
avenues to make our villages sustainably developing. A smart village feels that its citizens know its available
resources, applicable services and schemes. It knows what it needs and when it needs. Focused areas of the
smart village initiative are improved resource–use efficiency, empowered local self-governance, access to
assured basic amenities and responsible individual and community behaviour to build a vibrant and happy
society. The major thrust behind the concept on ‘smart village’ is that the technology should act as a means
for development, enabling education and local business opportunities, improving health and welfare,
enhancing democratic engagement and overall enhancement of rural village dwellers. The Information and
Communication Technology has proved its potential in various sectors of development in rural and urban
areas. And here in the smart village concept, the use of information and tele-communication is surely a major
priority area.
The concept of smart village includes a bundle of dozens of services delivered effectively to the
residents and businesses in an efficient manner. These services could be location specific depending on the
demography of the village and occupations of the residents. For the development of smart village, a cluster
approach can be followed. Each district may be divided in cluster of 10 to 15 villages (consisting of a specific
Management Guru: Journal of Management Research, May 2020, Vol. VIII _ Issue 0 , ISSN 2319-2429 4
6
Page 7
number of population say 50–75,000). Each district could have seven to twenty such clusters of village
depending on its size of population and then design the blue print to develop infrastructure like roads,
buildings, bridges, water, sewage, schools, colleges, hospitals and other facilities as per need based on local
talent available, local raw materials/facilities available, service/vocational avenues available locally or in the
district or within the state.
The smart village concept should formulate growth strategies for the villages to make it self-sufficient
taking into account the investment climate and protecting native occupation and heritage of the village. The
residents should be trained in providing those services and the funding agencies, microfinance institutions and
NGOs can be approached for creating a financial ecosystem to develop a development chain.
Need for Smart Village
The smart village concept is needed for a sustainable and secure future. This will act as a catalyst to
appreciate and facilitate the challenges and welcome the outcomes of an empowered village. It is about
understanding the villages towards the growth model which is inclusive. It is about achieving a higher goal
without compromising the roots and the sense of belongingness of the masses. The concept of smart village is
contemporary and very reliable today as there is a limit of the growth of cities leading to creation of urban
jungles, where the population ratio and its related issues per km. of land is way above the desired norms. A
smart village should be interactive and multi-functional and provisions must be there for active participation
of the masses. A smart village is one which will automatically link local production with local procurement
and local distribution. A smart village will also have the power, knowledge, healthcare, technology
entrepreneurship and quicker connectivity in terms of information acquiring and dissipation besides being
capable to excuse the responsibilities to the best possible manner. A smart village will not bring internet
connection to the rural lands, but will also provide support to sustainable agricultural practices. Indian villages
are located in different geographical ecosystems with definite and concretely embedded respective differences
in terms of needs, cultures, values and requirements. Emptying village is no longer considered a growth
imperative. Focus on the village economy farming on their our land, producing more from their own fields
shall lighten the burden of the migrants to the cities looking for menial jobs. The simplest method to push for
rural-urban migration has been to starve agriculture of adequate financial support and keep the farmers
impoverished by giving them low prices for their produce.
Challenges of Smart Village : Some Parameters
Agriculture and Agro-based Services
The Indian economy is still highly dependent on the agriculture sector. A huge population essentially
translates into a need to address the growing food demands each year. The Indian villagers and the villages
where they are residing are dependent on agricultural activities. Hence, aiming for a smart village in India
requires us to see the agricultural activities happening in the villages. Strengthening village economy should
be the priority for a smart village. It is important to turn farming economically viable not only because a large
proportion of the population is engaged in agriculture, directly as well as indirectly, but also to provide
financial support for setting up rural infrastructure. To provide urban amenities in the rural areas is very
important. Facilities like educational institutions, colleges, hospitals along with agro-based industries in the
villages as well as at the block level will create opportunities within rural areas, thereby drastically reducing
the migration to urban centres. Making the villages self-reliant as far as their food security needs are
concerned, this would require synergy of the provisions under food security law with farming systems. Every
cluster of village at the block or tehsil level should be encouraged to follow the principles of ensuring local
production, local procurement and local distribution.
Electronic Delivery of Citizen – Centric Service
Electronic services if managed properly are a great equalizer. They are transparent, efficient and cost
effective. Various access points for delivery of various electronic services in villages in India must be
arranged. This will surely contribute to a digitally, socially and financially inclusive society.
Management Guru: Journal of Management Research, May 2020, Vol. VIII _ Issue 0 , ISSN 2319-2429 4
7
Page 8
Mobile Health Unit
To transform rural areas to economically, socially and physically sustainable spaces, the health
condition of the people in rural areas need to be taken care of. Health care is now regarded as the public right
and as an important responsibility of governments to provide this care to all people irrespective of race, caste,
creed, religion, urban or rural, rich or poor. Villagers in India even today are so distantly placed as far as the
provisioning of the health care is concerned. Here, mobile health care shall act as an important bridge to
connect the gaps. In this regard, the mobile health unit that visit and share the health care to the rural areas
must be guided by relevance that, it should be based on the health needs and demands of the people. If the
system lacks the local participation, it will not be long lasting and sustainable.
Pure Drinking Water Supply and Sanitation
Pure drinking water and good sanitation are essential prerequisites for good health and hygiene. Most
of the epidemics and ill health in India are mainly due to communicable diseases caused by oral foecal routes.
Open defecation along with contaminated water is still the major challenge in our villages today. A smart
village must have this aim to eliminate the above mentioned problems. Innovative approaches to improve
water supply and sanitation must be tested well and introduced in the villages. Community led total sanitation
and public-private partnerships to supply of pure drinking water and sanitation should be practised.
Skill Development Training for Economic Activities
Considerable evidences are there for marginalization of rural populations and the incidence of poverty
within rural areas. In terms to access to services, including education and training, rural people in general, are
the inaugurator. Skills and knowledge are essential driving forces of economic growth and social development
of any country. They have become even more important in the increasing pace of globalisation and
technological change that is taking place in the world. Countries with higher and better levels of skills adjust
more effectively to the challenges and opportunities of globalisation. Smart villages should take best
opportunities to showcase the area and region specific skills and wisdom to the world.
Street Lights
Solar powered streetlights have all the required means today to lighten up the villagers in terms of the
sense of security. Solar LED street lighting will provide a high quality, sustainable lighting solution for people
in remote areas who do not have access to the conventional electricity grid. It will help in increasing the level
of safety on roads and streets and allowing for more economic and social activity.
Waste Management
Everywhere there is a rise of a consumer culture and the villages are being introduced to the invading
culture. Unorganised growth model has seen in the forms of mammoth heaps of waste in many cities. This
form of growth that generates more waste than efficient consumption of resources must not be replicated in
our villages. Sustainable waste management, conversion of rural waste into rural wealth will help our villages
to become free from unwanted waste that is left uncollected. This will make the working conditions much
better and definitely help in improving the life expectancy of the locals.
Climate and Biodiversity
Climate change today is a reality and no longer a fiction. Climate change directly or indirectly affects
the culture, productivity, disease outbreak and many other socio-economic problems. Practical steps must be
taken up for the rural people to adopt their livelihood activities to secure and dependable food supplies. Every
practical adaptation option to improve food security and resistance must be properly scrutinised and efforts be
made to promote the better ones with priority.
Biodiversity is the totality of the varieties, variability among the organisms and the habitats of the
environment where they are found. It is an important natural resource. Conservation of biodiversity and
renewable exploitation of the biodiversity shall help in sustaining the economic health and welfare of the
villages. Conservation of biodiversity is for the sustainable rural livelihoods besides enjoying the fruits of the
balanced conditions of the surroundings.
Management Guru: Journal of Management Research, May 2020, Vol. VIII _ Issue 0 , ISSN 2319-2429 4
8
Page 9
Smart villages can translate into improved farm productivity, water conservation and economic
independence to village youth. It makes great social, economic and political sense.
Conclusion
Creation of opportunities for youths in villages is the major requirement priority for a smart village
programme and policy. Discouraging migration to cities should not be an advice or suggestion, rather making
the villages self-sufficient and serviceable shall attract the villagers to remain productive in their homes and
villages. Proper guidance and monitoring to small farmers on how to get the best yield for the market at
remunerative prices must be provided. The benefits of the schemes of the Government must be directed
efficiently. Every villager must be educated to rediscover his strengths and opportunities available in his
village. Creating an ecosystem that makes youth interested in working from their villages is a challenge that is
worth taking.
References
1. Mishra, R.P. (1969) : Regional Planning, Concepts, Techniques and Policies, Univ. of Mysore, Mysore.
2. Chand, M. Puri and : Regional Planning in India, U. K. (1983) Allied Publishers, New Delhi.
3. Bhatt, L.S. (1973) : Regional Planning in India, Statistical Publishing Society, Calcutta.
4. Kant Surya et.al (eds) (2000) : Reinventing Regional Development, Rawat Publications, Jaipur.
Management Guru: Journal of Management Research, May 2020, Vol. VIII _ Issue 0 , ISSN 2319-2429 4
9
Page 10
An Analysis of NPAs in Commercial Banks
Dr. Dimpal Rani Univ. Deptt. of Commerce & Business Administration
T. M. Bhagalpur University, Bhagalpur ABSTRACT
Banking in modern times is the kingpin of all economic activities. It is instrumental in shaping the
economic destiny of a country. Banks are considered as the nerve-centres of economics and finance of any
nation and the barometer of its economic prospective. Since the banks have stupendous investment potential,
they can make a significant contribution in eliminating poverty and problem of unemployment. It can bring
about a progressive reduction in inter-regional/ state, inter-sectoral and inter-personal disparities in India.
The banking sector is facing the problem of rising NPAs at present. The purpose of the study is to measure the
impact of NPAs on the profitability of Indian scheduled commercial banks for the period of ten years.
KEYWORDS: Gross NPA, Net NPA, Gross Advances, Net Advances, Total Assets and
Profitability.
INTRODUCTION
Commercial banks play an important role in the development of a country. A sound, liberal and
dynamic banking system is an essential requirement for economic development of any nation. As an important
sector of an economy, commercial banks act as the backbone of economic growth and wealth by acting as a
substance in the process of development of nation. They instruct the habit of saving and mobilize funds from
several small households and business firms feast over an extensive geographical area. The funds so
mobilized are used for productive purposes in agriculture, industry, trade and commerce. In this present
scenario, non-performing assets become very serious problem for the banks while extending loans. The
increase in the profitability of a bank is always preceded by the composition of assets and liability.
Nonperforming assets are defined as an advance where, on the date of the balance sheet, an amount to be paid
to the bank is due for a period of 180 days. The loans which are unpaid beyond the due dates are categorized
as non-performing assets or non-performing loans. Nonperforming assets can be Gross NPAs and Net NPAs.
Non-performing loans raise to such an extent that revenues fall off and loan loss expenses, as well as
operating costs engage all the incomes that continue. The causes of NPAs include disaster, sickness of the
industries, in effective recovery process, business cycle, lending policy, absence of monitoring and follow up
loan and managerial problems. The proportion of nonperforming assets on selected variables is identified with
the help of the following ratios:
i) Ratio of Gross NPA to Gross Advances;
ii) Ratio of Net NPA to Net Advances;
The non-performing assets increased up to Rs. 95825 crores as per the CRISIL report. The gross NPA
increased from 3.3% in 31.03.2013 to 4% in 31.03.2014. Banks and other financial institutions are facing the
problem of recovery of dues and banks‟ approach in managing fraudulent activities in the banking sector. It is
important for a developing economy and the failure of NPA may have adverse effect on the banking sector
and financial Institutions. The different aspects of literature review related to non-performing assets over the
period have been collected and used for this study purpose. But there is an enormous gap existing for the
complete research of non-performing assets on quality aspects. Most of the research and studies are being
done on causes, and management aspects of NPAs. This study will fill the gap on the impact of NPAs on the
profitability in Indian Scheduled Commercial Banks. The objectives of the study are to analyze the impact of
NPA on the profitability of Indian scheduled commercial banks, to find out the Gross NPA and Net NPA of
Scheduled Commercial Banks in India, to offer suitable solution for the management of NPA in banks.
LITERATURE REVIEW
Many researchers have done research related to NPA and they find out different implications.
Chijoriga (2000) and Batra (2003), in their study, stated that in banks, irrespective of profitability, liquidity
and competitive functioning, NPA has a serious effect on the psychology of bankers related to disposition of
Management Guru: Journal of Management Research, May 2020, Vol. VIII _ Issue 0 , ISSN 2319-2429 4
10
Page 11
funds towards credit delivery and credit expansion. Michael et al. (2006) insisted that, NPA affects
profitability, liquidity and solvency position of banks by affecting its operational efficiency. It is essential to
have a serious look on NPA, since it may affect the growth and survival of banks. Borbora (2007) pointed out
that, banking sector must maintain efficient NPA management system to avoid negative financial
performance. Panta (2007) emphasized that, after the initiation of banking sector reforms in 1992, most of the
banks are taking initiatives to maintain NPA level and try to improve their profitability position. Banks also
consider the guidelines of RBI related to income recognition, asset classification and its norms related to
various provisions. Panta (2007) pointed out that, relationship exists between NPA and bank failure all over
the world. Rajput et al (2011), in their study increasing level of non-performing assets (NPAs) in the banking
sector can sternly affect the economy of the country. The reason for financial and economic reduction which
in turn bad signals when NPAs are not correctly managed. Kumar and Gupta (2012) try to find out the effect
of NPA on public sector banks of India by analysing their financial performance.
Rajput et al. (2011) try to find out the effect of NPA on public sector banks of India by analysing their
financial performance. Chaudhary and Sharma (2011), using projection of trend analysis, try to find out the
efficiency of public and private sector banks in NPA management. Kumar and Singh (2012) conducted a
study on NPA by selecting top performers of public sector banks and few foreign banks in India and analysed
the important factors which cause NPA problems and also try to find the effective measures which are
essential for effective NPA management. Patidar and Kataria (2012) conducted a research on the comparative
study between SBI and Associates, Old Private Banks and New Private Banks and Nationalized Banks of the
benchmark category and try to find out the significant difference of NPA and its impact on priority sector
lending on the total NPA. For the study, they used regression analysis and ratio analysis. Chatterjee et al.
(2012) conducted a study and the result of their findings are NPAs have a negative effect on the achievement
of capital adequacy level, funds mobilization, banking system credibility and productivity on the overall
economy. Their study also reveals that private sector banks can protect themselves by adapting to the
changing environment whereas public sector banks are facing enormous problems.
Mir and Jegadeeshwaran (2013) conducted a study, “NPA and causes for NPA”. They collected
secondary data for five years and carried out analysis by using various tools like mean, CAGR, ANOVA and
Rank. In their findings, they ranked the performance of banks based on NPA management. Das and Dutta
(2014) conducted a study, “The growth of NPA in the public and private sector banks in India”. They
collected data from „report on trend and progress of banking in India, RBI report on currency and finance,
RBI economic surveys of India‟ and analysed by focusing on sector wise nonperforming assets of the
commercial banks. The result of their study shows that the performance of the banks is low because of worse
NPA management. Ranjan and Dhal (2013) conducted a research on the Indian commercial banks‟
nonperforming loans by using regression analysis and they analysed the terms of credit, risk preference based
on the size of the bank and macroeconomic shocks. Das and Dutta (2014) conducted a study, “The growth of
NPA in the public and private sector banks in India”. They collected data from „report on trend and progress
of banking in India, RBI report on currency and finance, RBI economic surveys of India‟ and analysed by
focusing on sector wise non-performing assets of the commercial banks. The result of their study shows that
the performance of the banks is low because of worse NPA management.
Arora and Ostwal (2014) conducted a study titled, “The classification and comparison of loan assets
of public and private sector banks”; the results of the study show that, public sector banks and financial
institutions are having high level of NPAs compared to private sector banks. Tripathi et al. (2014) conducted a
study on the impact of priority sector advances, unsecured advances and advances made to sensitive sectors by
banks like SBI group and other nationalised banks on Gross NPAs of banks using multiple regression model.
Parmar (2014) states that the management of NPA is a challenging task for every bank as it affects banks‟
profitability position and performance. Loan defaulters are the main reason for NPA.
Tandon et al. (2017) focuses on banks‟ specific, macroeconomic determinants of the non-performing
loans and their impact on the banking profitability. They selected 35 public and private sector banks for the
period 2007 -2016 and used multivariate analysis to find out the result. Their study conveys that, PSU banks -
NPA management requires more attention to increase their profitability and performance. According to Swain
Management Guru: Journal of Management Research, May 2020, Vol. VIII _ Issue 0 , ISSN 2319-2429 4
11
Page 12
et al. (2017), the present core financial problem of banks is NPA. The proper recovery of loans can boost the
performance of banks in India. Therefore, an attempt is made to measure the effectiveness of NPA recovery
measures. Selected recovery measures like Lok Adalat, Debt Recovery Tribunal and SARFAESI Act are
taken for the study purpose and the efficiency of NPA recovery. From the study, the recovery of NPAs is still
a major concern for commercial banks in India. The reasons for the poor recovery from NPAs are the
mechanism created and banks are not able to derive full benefits. Banerjee and Mitra (2018), In their study
NPA have a direct influence on the profitability, liquidity and solvency of the bank. Growing NPA has been
one of the major problems of Indian Banking System. To know the position of NPA in banking groups and it
anticipated the facts of Gross NPA of all Public Sector Bank, Nationalised Bank, SBI Group, Private Sector
Bank, All Scheduled Commercial Bank. Manu and Maheshwari (2018), in their study, the Non-performing
assets have been varying from time to time which effect the bank's profitability during the study period. The
study reflects ROA, ROE and ROCE as measures bank's profitability, Gross NPA and Net NPA as measures
non-performing assets of the banks. The study recommends rigorous policies to be executed by governing
system to control constant increasing of Banks's NPA which will provide loss of tax payer's money in India.
Valliammal and Manivannan 2018, in their study the impact of non-performing assets on the financial
performance is the emphasis for this study. there is a very high relationship between decrease of profits and
increase in various assets related to the study. Banking groups essential to emphasis more on handling
financial assets in order to increase profitability of the banks. Varma (2018) presents growing problem of
NPAs in Indian banking sector and its management. Bank frauds involving Punjab National Bank (PNB) and
the companies associated with businessmen like Nirav Modi and Mehul Choksi as well as the Rotomac case
could not have come to a worse time. The Indian banking system is already reeling under the pressure of
growing NPAs, or non-performing assets. This has already caused a slowdown in disbursal of bank credit, in
turn affecting productive investment. The key issue is one of poor regulation. This paper analyses the various
schemes introduced to restriction of non-performing assets, which emerged out as a greatest challenge for
government as well as for the RBI to reduce NPAs.
RESULTS AND DISCUSSION
RATIO OF GROSS NPA TO GROSS ADVANCES
The data were used to analyze the gross advances and gross NPAs outstanding and gross NPA % of
scheduled commercial banks over a ten years period as shown in Table 1. Sontakke and Chandan (2013)
provides the amount of Gross Advances to Gross NPA and the percentage of Gross NPA from 2008 to 2012.
The amount of advances increased from Rs. 25079 crore in 2008 to 51,589 crore in 2012. The amount of NPA
also increased from Rs. 564 to Rs. 1,423 from 2008 to 2012. Similarly, NPA percentage rose from 2.3 in 2008
to 3.1 in 2012. This study supports the present research. Table 1 indicates the amount of Gross advances,
Gross NPA and % of Gross NPA from 2007-2008 to 2016-2017. The amount of Gross advances increased
from Rs.25,078 crore in 2007- 08 to Rs.85,139 crore in 2016-2017. The amount of gross NPA increased from
Rs.563 crore in 2007-2008 to Rs.7,918 crore in 2016-2017. Similarly, % of Gross NPA increased from 2.3%
in 2007-2008 to 9.3% in 2016-2017.
Table 1 Ratio of Gross NPA to Gross Advances.
Management Guru: Journal of Management Research, May 2020, Vol. VIII _ Issue 0 , ISSN 2319-2429 4
12
Page 13
RATIO OF NET NPA TO NET ADVANCES
The data were used to analyze the Net advances and Net NPAs outstanding and as a Net NPA % of
Scheduled Commercial Banks over the 10 years period (Table 2).
Ravindra et al. (2013) provide the amount of Net Advances, Net NPA and the percentage of Net NPA
from 2008 to 2012. The amount of advances increased from Rs. 24,770 crore in 2008 to 50,842 crore in 2012.
The amount of NPA also increased from Rs.247 crore to Rs. 649 crore from 2008 to 2012. The percentage of
Net NPA increased from 1.1.in 2008 to 1.12 in 2010. Then it declined to 0 .97% in 2011 due to increase in
provisions. Later the percentage of NPA again increased to 1.4 in 2012. The amount of Net advances
increased from Rs.24,769 crore in 2007-08 to Rs.81,716 crore in 2016-17. The amount of Net NPA also
increased from Rs.247 crore in 2007-08 to Rs.4.331 crore in 2016-17. Similarly, % of Net Gross NPA
increased from 1% in 2007-2008 to 5.3% in 2016-2017.
Table 2 Ratio of Net NPA to Net Advances
IMPLICATIONS AND FUTURE SCOPE OF STUDY
The success of banking sector is determined by its profit and quality of assets. Though banks are
providing various services like, lending, networks and generating employment to the public, its growth and
survival depends on the quality of assets it possesses and the profitability position it holds. The greatest
challenge for banking sector is the existence of Non-Performing Assets (NPA). NPA creates threat to the
assets of the banks and for its survival by affecting its liquidity and profitability. Hence, it becomes essential
to strengthen the financial systems in the developing economies and emerging markets. It is evident that,
sound financial systems will assist in achieving economic growth through fund mobilization and utilizing
them productively to transform various risks involved. The banking sector can improve their recovery process
by focusing on large borrowers and they can implement some strict norms to solve this problem. It is the right
time that, government should take some effective measures to improve the settlement of pending cases and
banks can avoid mandatory lending to some priority sector. Thus, serious concern is essential on the part of
NPA, otherwise it may collapse the profitability of banks and that in turn may affect the growth on Indian
economy.
It is the onus on the concerned bank which has given the loan to tackle the problem of NPA.
Therefore, the recommendations of Narasimham Committee which suggest that, the asset management
companies or asset reconstruction fund must redress the NPAs to be reviewed. The use of technology will
bring important change in the way banks manage their NPAs. Bankers may resort to Compromise Settlement
or One Time Settlement for the recovery measures. Lok Adalats and Debt Recovery Tribunals are other ways
for the recovery of dues as a part of NPA remedial measures. RBI may take actions against defaulters by
publishing their names in Newspapers, broadcasting the information in media, which may enable other banks
and financial institutions. Banks may prefer one-time settlement as a corrective measure and other existing
ways to recover dues are Lok Adalats and Debt Recovery Tribunals. If banks found that dues are because of
genuine reasons like, draught, floods or other natural calamities then they can restructure their plans
accordingly.
Management Guru: Journal of Management Research, May 2020, Vol. VIII _ Issue 0 , ISSN 2319-2429 4
13
Page 14
CONCLUSION
It can be concluded that, non-performing assets on the profitability have an adverse impact on the
scheduled commercial banks in India. The non-performing assets or bad loans are adversely affecting the
world economy from time to time. This leads to crisis around the world. Now, the central banks are taking
effective steps against the non-performing assets and they try to create a safe and productive banking sector.
The study on NPA is the need of the hour and many authors had made efforts to study the performance of
NPA and its impact on banking sector. In this paper the authors had tried to give critical view on NPA and try
to give some possible solution to resolve the effect of NPA on banking sector. The increasing level of NPA
can severely affect the banking sector. It was found from the study that, there was evidence for increase in the
non-performing assets. The various analyses were used to find out the impact of NPAs on the profitability of
the scheduled commercial banks. It was significantly related to the Ratio of Gross NPA to Gross advances and
Ratio of Net NPA to Net Advances, Ratio of Gross NPA to Total Assets and Ratio of Net NPA to Total
Assets is insignificantly related to each other. Thus, the profitability of the banks has reduced, due to rise in
the non-performing assets of the scheduled commercial banks in India.
REFERENCES :
1. Arora N, Ostwal N (2014). Unearthing the Epidemic of Non-Performing Assets: A Study of Public and
Private Sector Banks. Management Insight 10(1):1-8.
2. Banerjee R, Mitra R (2018). Non-Performing Assets of the Indian Banking System: A Critical
Evaluation. Asian Journal of Research in Banking and Finance 8(6):1-16..
3. Chaudhary M, Sharma M (2011). Performance of Indian Public Sector Banks and Private Sector Banks:
A Comparative Study. International Journal of Innovation, Management and Technology 2(3):249-256.
4. Chatterjee C, Mukherjee J, Das R (2012). Management of nonperforming assets -a current scenario.
International Journal of Social Science and Interdisciplinary Research 2012(1):11.
5. Das S, Dutta A (2014). A Study on NPA of Public Sector Banks in India.
6. Kumar M, Singh G (2012). Mounting NPAs in Indian commercial banks. International Journal of
Transformations in Business Management 1(6):1-6.
7. Manu KS, Maheshwari R (2018). Relationship between Non-Preforming Assets (NPA) and Profitability
of Development Banks: The Case of India. Asian Journal of Research in Banking and Finance 8(6):99-
111.
8. Patidar S, Kataria A (2012). An Analysis of NPA in Priority Sector Lending: A Comparative Study
between Public Sector Banks and Private Sector Banks of India. Bauddhik 3(1):54-69.
9. Rajput N, Arora AP, Kaur B (2011). Non-performing assets in the Indian public sector banks: an
analytical study. Retrieved from Banks and Bank Systems 6:4.
10. Parmar R (2014). Non-Performing Assets (NPAs): A comparative analysis of SBI and ICICI Bank.
International Journal for Management and Pharmacy 3(3):68-72.
11. Swain RK, Sahoo M, Mishra AP (2017). Non-Performing Assets of Scheduled Commercial Banks in
India. Its regulatory framework, Parikalpa, 154. Available at:
http://ksom.ac.in/wpcontent/uploads/2018/01/Parikalpana-13ii.pdf#page=160
12. Tandon D, Chaturvedi A, Vidyarthi H (2017). Non-performing assets and profitability of Indian banks:
an econometric study. International Journal of Business Competition and Growth 6(1):60-76.
13. Tripathi LK, Parashar A, Mishra S (2014). A Comparative Study of Advances Contributing to Non -
Performing Assets Between SBI Group and Nationalised Banks. International Journal of Marketing,
Financial Services and Management Research 3(7):1-12.
14. Valliammal M, Manivannan SK (2018). A Study on Non-Performing Assets and Its Impact on Public
Sector Banks in India.
15. Varma S (2018). The Burgeoning Problem of Npas in Indian Banking Sector and its Management.
Zenith International Journal of Multidisciplinary Research 8(4):118-123.
Management Guru: Journal of Management Research, May 2020, Vol. VIII _ Issue 0 , ISSN 2319-2429 4
14
Page 15
Role of Indian regional Rural banks in the priority sector lending
Dr. Kumari Anita Roy
Univ. Deptt. of Commerce and Business Administration
T. M. Bhagalpur University, Bhagalpur
Abstract
The important of the rural banking in the economic development of a country cannot be overlooked.
As Gandhi said “real India lies in village” and village economy is the backbone of Indian economy. Without
the development of the rural economy, the objective of economic planning cannot be achieved. Hens, banks
and other financial institutions are considered to be a vital role for the development of the rural economy in
India. Regional Rural Banks (RRBs) were established in October 2, 1975 and are playing a pivotal role in the
economic development of the rural India. The main goal of establishing Regional Rural Banks in India is to
provide credit to the rural people who are not economically strong enough, especially the small and marginal
farmers, artisans, agricultural laborers and even small entrepreneurs.
Keywords : Rural Economic, Economic Development, Regional Rural bank, Farmers, Entrepreneurs,
Credit
Introduction
Activities of modern economy are significantly influenced by the functions and services of banks.
Banking sector constitutes the core part of economic system. Indian economy is agricultural economy and real
India lies in villages. Village economy is the backbone of Indian economy. Even after 60 years of
independence, the rural economy in India is still handicapped in terms of infrastructure and other chronic
problems of cultivators. In fact, economic progress and industrial development are determined by the rural
sector. More than 70% of Indians depend on agriculture; 60% of industries are agro based; 50% of national
income is contributed by rural sector and the agricultural sector is the largest foreign exchange earner to India.
Such an essential and key sector is neglected by financial institutions and especially by the banks. Regional
Rural Banks (RRBs) are constituted to meet the financial and banking needs of weaker sections of the rural
areas with a special attention on small and marginal farmers, agricultural laborers, artisans, landless farmers,
small traders, tint enterprises etc. Hence, RRBs were established in India in 1975 essentially for the purpose of
taking banking service to the doorsteps of rural people, particularly in places where banking facilities are not
available. In general, RRBs are commercial banks but they adopt some of the principles of cooperatives such
as location in areas, work for rural population in a limited area etc. Thus they are hybrid institutes. RRBs
operate under the control of two institutions, the National Agricultural Bank and Rural Development
(NABARD) and Reserve Bank of India (RBI). The primary objective of this study is to analyze the
performance in terms of loans provided to the priority and non-priority sectors of the country and especially
various types of loans such as crop loans, term loans, loans to rural artisans, retail trade, small scale industries
and self-help groups etc.
Regional Rural Banks (RRBs) in India-An Overview
Rural people in India such as small and marginal farmers, landless agricultural laborers, artisans and
socially and economically backward castes and classes, have been exploited in the name of credit facility by
informal sectors. The rural credit market consists of both formal and informal financial institutions and
agencies that meet the credit needs of the rural masses in India. The informal sector advances loans at very
high rates of interest; the terms and conditions attached to such loans have given rise to an elaborate structure
of intimidation of both economic and non-economic conditions in the rural population of India. The supply of
total formal credit is inadequate and rural credit markets are imperfect and fragmented. Moreover, the
distribution of formal sector credit has been unequal, particularly with respect to region and class, cast and
gender in the country side.
Management Guru: Journal of Management Research, May 2020, Vol. VIII _ Issue 0 , ISSN 2319-2429 4
15
Page 16
The history of Regional Rural Banks in India dates back to the year 1975. It’s the Narasimham
committee that conceptualized the foundation of Regional Rural Banks in India. The committee felt the need
of regionally oriented rural banks’ that would address the problems and requirements of the rural people in
India. Regional Rural Banks were established under the provisions of an Ordinance promulgated on the 26th
September 1975 and the RRB Act, 1975 with an objective to ensure sufficient institutional credit for
agriculture and other rural sectors. The RRBs mobilize financial resources from rural/semi-urban areas and
grant loans and advances mostly to small and marginal farmers, agricultural laborers and rural artisans. For
the purpose of classification of bank branches, the Reserve bank of India defines rural area as a place with a
population of less than 10,000.RRBs are jointly owned by Government of India, the concerned State
Government and Sponsor Banks; the issued capital of a RRB is shared by the owners in the proportion of
50%, 15% and 35% respectively. The objectives of RRBs can be summarized as follows:
1. To provide cheap and liberal credit facilities to small and marginal farmers, agriculture
2. Laborers, artisans, small entrepreneurs and other weaker sections.
3. To save the rural poor from the moneylenders.
4. To act as a catalyst element and thereby accelerate the economic growth in the particular region.
5. To cultivate the banking habits among the rural people and mobilize savings for the economic
development of rural areas.
6. To increase employment opportunities by encouraging trade and commerce in rural areas.
7. To encourage entrepreneurship in rural areas.
8. To cater to the needs of the backward areas which are not covered by the other efforts of the
Government?
9. To develop underdeveloped regions and thereby strive to remove economic disparity between regions.
Review of Literature
According to Nathan, Swami (2002), policies of current phase of financial liberalization have had an
immediate, direct and dramatic effect on rural credit. There has been a contraction in rural banking in general
and in priority sector ending and preferential lending to the poor in particular.
Chavan and Pallavi (2004) have examined the growth and regional distribution of rural banking over
the period 1975-2002. Chavan’s paper documents the gains made by historical underprivileged region of east,
northeast and central part of India during the period of social and development banking. These gains were
reversed in the 1990s: cutbacks in rural branches in rural credit deposits ratios were the steepest in the eastern
and northeastern states of India. Policies of financial liberalization have unmistakably worsened regional
inequalities in rural banking in India.
Professor Dilip Khankhoje and Dr. Milind Sathye (2008) have analyzed to measure the variation in
the performance in terms of productive efficiency of RRBs in India and to assess if the efficiency of these
institutions has increased post-restructuring in 1993-94 or not.
Dr. M. Syed Ibrahim (2010) carried out a study on the topic “Performance Evaluation of Regional
Rural Banks in India”. In this study, it was concluded that RRBs in India showed a remarkable performance in
the post-merger period.
RRBs occupy an important position in the rural credit market. Loans provided to the needy people
have been categorized into two. One is priority sector and the other one is non-priority sector. Priority sector
bank lending is an active instrument of Indian financial policy with an aim to restore sectoral balance within
credit disbursement and to channel credit to the weaker sections of the society. Priority Sector is a sector
which is given priority in offering financial services by the banks. The concept of priority sector was first
brought into the financial system in 1968, when the government imposed social control over the banks. Banks
were directed to lend some percentage of loans to the sectors listed in the priority sector. In 1968 there were 3
sectors; agriculture, small industry and exports. Gradually, the list of segments under priority sector increased.
At present it consists of agriculture, small scale industry, small transport operators, exports, small business
Management Guru: Journal of Management Research, May 2020, Vol. VIII _ Issue 0 , ISSN 2319-2429 4
16
Page 17
housing, self employed persons, professionals, education etc. Recently the micro finance through Self-Help
Groups (SHG) is also included in priority sector.
Loans given to priority sectors by RRBs consists of short-term loans, term loans, loans to rural
artisans, small scale industries, retail trade, and self-help groups’ etc.
Table 1 - Exhibits the sector-wise loans issued by the RRBs
Table 1 reveals the year-wise loans issued to both priority and non-priority sectors in the country. It is
important to observe from the table that the loans issued to priority sector constitute more percentage than the
loans provided to the non-priority sector.
Loans for Crops (Short-term Loans) and Agriculture and Allied Activities (Term - Loans)
Agriculture is the mainstay of Indian economy. More than 70 % of the population depends on
agriculture and its allied activities. The RRBs are taking care of this sector by providing short-term and term-
loans. Table 2 exhibits the year-wise loans provided for crops and agricultural activities.
Table 2 Disbursement of Short-Term and Term-Loans (Rs. in Crores)
In the table 2, it is exhibited that the short-term loans for crop has been increasing year after year. The
disbursements of short-term loans were Rs. 4, 834 crores in 2002-03 which has gone up to Rs. 22,851 crores
in 2008-09. The year 2006-07 registered a higher rate of percentage i.e., 35.43.
The disbursement of term-loans for agriculture and allied activities by the RRBs are not quite
encouraging. It has been increased from Rs.1, 045 crores in 2002-03 to Rs.3, 648 crores in 2008-09. The
increase over the period was 3.49 times.
Disbursement of Loans to Priority Sectors by RRBs (Rs. in Crores)
Rural credit policy in India envisaged the provision of a range of credit services, including long-term
and short-term loans to rural community. During the operation of three decade, the RRBs in India have
recorded a significant growth in the disbursement of loans. Table 3 provides the loans issued to various groups
apart from the short-term and term-loans in the priority sector.
Management Guru: Journal of Management Research, May 2020, Vol. VIII _ Issue 0 , ISSN 2319-2429 4
17
Page 18
Table 3 - Disbursement of Loans to Various Groups in the
Priority Sectors by RRBs (Rs. in Crores)
It has been observed from the above table that the loans provided by the RRBs to various groups have
been increasing year after year. The loans to rural artisans have been increased from Rs.238 crores in 2002-03
to Rs.552 crores in 2008-09. The increase over the period was 2.3 times. Likewise, all the groups have been
provided loans by the RRBs in an increasing amount.
Disbursement of loans to Agriculture V/s Non-Agriculture (%)
RRBs are providing loans to agricultural sectors for their development in the country. In this context,
the total loans provided by RRBs are categorized into two groups namely agriculture and non-agriculture. The
year wise percentage of loans outstanding to agriculture and non-agriculture is furnished in table 4.
Table 4 - Loans Outstanding to Agriculture V/s Non-Agriculture (%)
In the table 7, it is exhibited that the RRBs have been quite successful in its agricultural loans. During
the period under reference, the banks have been able to mark a rising trend in its loans outstanding with 46%
in the year 2002-03 to 64% in 2008-09.
Conclusion
The real growth of Indian economy lies on the emancipation of rural masses from poverty,
unemployment and other socio-economic backwardness. Keeping this end in view, Regional Rural Banks
were established by the Government of India to develop the rural economy. With the passage of three decades,
the RRBs are now looked upon with hope for rejuvenating the rural India. In the present study, the role of
RRBs in the rural credits structure has been deeply analyzed. The rural credit structure consists of priority
sector and the non-priority sector. There has been tremendous achievement in disbursing loans to both the
sectors. The priority sector loans constituted higher in percentage throughout the study. RRBs have lent
money to the agricultural sector through the short-term and term-loans for the development of the agriculture
sectors in the economy. The disbursements of short-term loans for crops during the study period are
encouraging and it constituted a higher rate than that of term-loans. Also the loans provide by the RRBs to
various groups in the priority sector shows an increasing trend. The years 2007-08 and 2008-09 registered
higher growth. When compared to the loans to non-agricultural activities, the highest share is recorded in the
agriculture. However, it is the responsibility of the banks and the management to look into the matter of
providing sufficient amount of loans to non-priority sector as well. The gap between short-term loans for crop
Management Guru: Journal of Management Research, May 2020, Vol. VIII _ Issue 0 , ISSN 2319-2429 4
18
Page 19
and the term-loans for agricultural and allied activities need to be minimized. The banks need to encourage the
agricultural sector by providing larger amount of term loans. Generally, non-agricultural sector indirectly
helps the rural economy in many ways. Keeping in view, the RRBs may enhance the percentage of loan to this
sector. This finding may be considerable use to rural banking institutions and policy makers in developing and
shaping the appropriate credit structure as RRBs are integral part of the rural credit structure in India.
References :-
1. Bhatt, Nitin and Thorat, Y. S. P. (2006). India’s Regional Rural Banks: The Institutional Dimension of
Reforms. Journal of Microfinance, 3 (1), pp: 65-94.
2. NABARD, Annual Report, Various Issues.
3. RBI, Annual Report and Report on Trends and Progress of Banking in India, Various Issues.
4. Second Narasimhan Committee, 1997. Committee on Banking Sector Reform, Gazette of India-
Extraordinary Notification, Part II, Sec 3 (ii), Ministry of Finance, Government of India.
5. Shajahan, K.M. (1998). “Priority Sector Bank Lending: Some Important Issues”. Economic and
Political Weekly, Vol.33,No.42/43 Oct.17-30.
6. Subramanyam, G. (1993). “Productivity Growth in India’s Public Sector Banks: 1979-89”, Journal of
Quantitative Economics, 9, 209-223.
7. Syed, Ibrahim M. (2012). Role of Indian regional Rural banks in the priority sector lending-an analysis
International Management Journal Vol. 1 No. 1-2 (January-December,).
8. Syed, Ibrahim, (2010). “Performance Evaluation of Regional Rural Banks in India”, International
Business Research- CCSE, Vol-3, No.4.October.
9. Thakur, S. (1990). Two Decades of Indian Banking: The Service Sector Scenario, Chanakya
Publications New Delhi, India.
10. Tyagarajan, M. (1975). “Expansion of Commercial Banking- An Assessment”, Economic and Political
Weekly, 10, 1819-1824.
Management Guru: Journal of Management Research, May 2020, Vol. VIII _ Issue 0 , ISSN 2319-2429 4
19
Page 20
Performance of Public Sector Enterprises (PSEs)
Dr. Sanyukta Kumari Univ. Deptt. of Commerce & Business Administration
T. M. Bhagalpur University, Bhagalpur
Abstract
The Public Sector Undertakings (PSUs) are considered as major instruments of state intervention in
economic activities in the developing economies. It is well known that the PSEs were dominant till the late
1980s. But due to the unsatisfactory performance of PSEs, the Government of India has taken some policy
measures in the early 1990s, i.e., New Industrial Policy, 1991. Thereby, the government followed a plan-led
development strategy wherein the major role was given to the public sector.
Keyowords : Public Sector Undertakings, State Intervention, Economic Activity,
Developing Economies, New Industrial Policies.
Introduction
In the pre-liberalization period, the role of PSEs in economic activities was dominant. The
government provided protection to PSEs through various policy measures (like IPR [1948 and 1956], MPTP,
Industrial Licensing, etc.) for their development. These protective measures did not provide any incentive to
the PSUs to upgrade their technology and consequently improve productivity. As a result of this, a large
number of PSEs have become economically unviable. To improve the performance of the PSEs, the
government adopted some policy measures in the early 1990s under the name of Structural Adjustment
Program (SAP). With the implementation of SAP, the existing industrial policy was revised to improve the
performance of existing enterprises. The major policy initiatives introduced in the 1990s are listed here. Under
1991 IPR, the number of reserved industries for PSEs was reduced from 18 to 8 in 1991 and further to 3 in
2001. The focus of public sector was reduced to strategic, high-tech and essential infrastructure. The
Government of India established a Board for Industrial and Financial Reconstruction (BIFR) for the
investigation of sick units. Some PSEs, chronically loss making or sick, were referred to the BIFR for revival
and rehabilitation schemes . Further, the government encouraged PSUs to participate in capital market to raise
funds for investment.
In 1996, the government came up withthe Common Minimum Program (1996) . The object of this
program was to develop professional management along with decision making autonomy to make these
enterprises operate in a competitive environment. In addition, the government stopped privatization of profit-
making entities. In 2004, the government established the Board for Reconstruction of Public Sector
Enterprises (BRPSE) to advise the government on strengthening the central PSEs and financing the PSUs, and
also to suggest chronically sick units for disinvestment (or close down). As per Sick Industrial Company Act,
1985, if a company accumulated loss in any financial year equal to 50%, then it is considered as a sick unit.
Once the ministry refers any PSU unit to the board, the board should make recommendations within two
months.
However, the government also ensured special status to the profit-making public sector entities under
the name of Navratnas . The status of Navratnas was decided on the basis of their past performance. On July
4, 1997, the government identified nine enterprises as Navratnas, and two more were added to this list in the
subsequent period. These enterprises were decided in terms of their size in relation to investment, turnover
and profits in recent period. Further, to make Navrantna enterprises more competitive, the government
substantially enhanced the autonomy and operational freedom of the Board of Directors. With this, these
Management Guru: Journal of Management Research, May 2020, Vol. VIII _ Issue 0 , ISSN 2319-2429 4
20
Page 21
enterprises were eligible for incurring capital expenditure, entering into joint ventures, creating and winding
up post below Board level. Further, the government also identified some profit-making enterprises and
declared them as Miniratnas6 . With this status, these enterprises got some autonomy in decision making.
Now Miniratna-I can incur capital expenditure without any government approval up to 300 cr or equal to their
net worth capital, whichever is lower, and Miniratna-II can make capital expenditure up to 150 cr or up to
50% of their net-worth capital, whichever is lower.
Review of Literature
Ravinder and Rupinder’s (2007) study compares the pre- and post-disinvestment financial and
operational performance of 15 PSEs of India that experienced partial disinvestment during the period of 1991-
92 to 2002. The empirical evidence supports the positive effects of privatization on PSEs’ performance. These
privatized units have significantly improved the level of profitability, sales, operational efficiency, earnings
per share and dividend payments after disinvestment. Nagaraj (2006) studied the long-run performance of the
public sector on the basis of some selected aspects in relation to economic aggregates, mainly using National
Accounts Statistics (NAS). He concluded that the public sector share steadily rose to the domestic output,
even though the public sector share in domestic investment reduced to nearly half. This improvement in the
performance has occurred due to a rise in the physical efficiency in electricity generation, a fall in the public
sector employment and increase in the profitability of PSEs. Mishra and Lakshmi (2006) tried to analyze the
performance of PSEs in the era of economic liberalization by using the primary and secondary level data. He
revealed that the PSEs have performed well in the era of economic liberalization. PSEs’ profitability and
internal resource mobilization have improved in the post-liberalization period. Jain and Yadav (2005)
analyzed the financial management of the PSEs in terms of profitability by using the secondary data of 137
PSEs and primary data of 41 PSEs for the period of 1991 to 2002. The results showed that the sample PSEs
have earned a satisfactory rate of return on the capital employed. The better profitability of PSEs may be the
result of the liberalization policy measures taken by the government. Baijal (2002) argued that to ensure a
higher level of investment with higher efficiency and productivity, complete restructuring of the economic
industrial policy is required. Therefore, the reform has been undertaken with the objective of efficiency
enhancement, domestic and foreign resource mobilization and to generate adequate level of competitiveness
in the economy. Rath (2001) explained the rationale behind the disinvestment of PSEs. The study explains
that the changing global environment and unsatisfactory performance of PSEs put new challenges and
opportunities for the government to minimize the role of public sector activities. Instead of investing resources
in industries, trade and business, the government developed social and economic infrastructure for facilitating
the activities of the private sector. Analyzing the success of PSE reforms from 1991 to 1998, Ghuman (1999)
showed that there was limited success in the first phase with regard to disinvestment and the abolition of the
monopoly status of PSEs. The pace of disinvestment has improved with the setting up of Disinvestment
Commission. The major restrictions in the way of reform have been the administrative ministries, employees
and interest groups. Das (1997) analyzed the overall efficiency— technical, allocate and scale—of the public
sector banks. He found a decline in the overall efficiency during 1990-96. This occurred because there was a
decline in technical efficiency, both pure and scale. The study pointed out that the deterioration in technical
efficiency was mainly on account of four nationalized banks.
On the basis of existing studies, it is noticed that PSEs showed better performance in the post-reform
period as compared to the pre-reform period. The better performance can be viewed in terms of rising
completion that forced PSEs to improve their performance by ensuring high productivity and reducing cost of
production.
Management Guru: Journal of Management Research, May 2020, Vol. VIII _ Issue 0 , ISSN 2319-2429 4
21
Page 22
The process of disinvestment of PSUs has not been free of criticism. Malik (2003) argues that the
Indian approach to disinvestment seems to have gone wrong, being positioned in the middle between the
doctrinarian extreme on the one end and the laissez faire extreme on the other. While all political parties and
economists believe in the principle of divestments/ privatization, they devise escape routes for non-
implementation by taking recourse to statements such as: “We agree in principle but differ in the details’;
“First bring in a strategic partner and then divest”; “First increase the equity base through a public offer and
then divest”; “It is videshi, swadeshi” etc. The industry and business express their doubts about raising such
huge funds to buy and acquire PSUs. The foreign investors are critical of the entire process and are often seen
withdrawing from the bidding process. In essence, there is something seriously wrong in India’s approach to
disinvestment and implementation.
Mishra et al. (1993) and Sankar et al. (1994) highlight the large differences between the amounts
actually realized through disinvestment and the amounts potentially realizable under the best value method.
The argument is that shares were deliberately underpriced to ensure quick disposal. In short, the criteria
adopted in the selection of PSEs and the methods involved in the valuation of shares lacked the essential
transparency needed to gain public confidence in the process.
Arun and Nixson (2000) argue that the main aim of disinvestment has been to reduce the public sector
borrowing requirement at the cost of restructuring and rationalization of PSEs in particular and the public
sector in general. He expressed dissatisfaction with the disinvestment process because of alleged underpricing
of shares sold, lack of transparency, limited public support for disinvestment and the absence of a common set
of objectives between the Government of India and the Disinvestment Commission.
Gouri (1996) has argued that the lack of a clear policy on privatization and PSE restructuring in India
may favor considerations of political expediency in the short run but at the cost of sacrificing sound economic
management over the longer term.
The available literature pointed that: first, PSEs performed well in the post-reform period in terms of
profitability, sales, operational efficiency, earnings per share, dividend payments, etc; second, factors like
inadequate returns from investment, low production efficiency and changing global policies compelled the
government to go for economic reforms; and third, the pace of disinvestment was slow in the first few years of
reforms. With the setting up of Disinvestment Commission, the disinvestment pace has improved.
Objective of the Study
• To analyze the Performance of PSEs
Performance of PSEs
This paper is an attempt to understand the performance of PSEs in response to liberalization measures
announced in the early 1990s. The performance of CPSE has been examined on the basis of certain selected
indicators, namely, number of profit- and loss-making units, share of CPSEs in GDP, share of CPSEs in
GDCF, profitability to total capital employed, number of employees, research and development expenditure as
a percentage of the total sale.
Table 1 outlines the trends in the total investment and number of enterprises in various plan periods. It
shows that the cumulative investment in CPSEs grew from 29 cr in five enterprises as on April 1,1951 to
538,951 cr in 246 enterprises as on March 31, 2009. This growth in investment in CPSEs includes mining,
manufacturing, services, under construction over the planning period. During the 8th Plan, the structure of the
Indian economy underwent a major change. Therefore, literature assumed priory to 8th Plan period as the pre-
reform period, and the later period as the post-reform period. Given the division of pre- and post-reform
period, it is noticed that both plan investment and number of PSUs increased very rapidly in the pre-reform
Management Guru: Journal of Management Research, May 2020, Vol. VIII _ Issue 0 , ISSN 2319-2429 4
22
Page 23
period as compared to the post-reform period. In the post-liberalization period, the pace of investment has
become slow and the number of PSEs has started decreasing because the government has disinvested stakes in
some PSEs and some of the loss-making units have been closed following the recommendation by BIFR.
Table 1 – Growth in Investment
Employment in PSEs
The number of employees in CPSEs is presented in Figure 6. From the figure, it can be seen that the
number of workers in the CPSEs increased till 1989-90, which then shows a downfall in the later period,
except in 2001-02. For instance, the number of employees increased from 17.75 lakh in 1980-81 to 22.39 lakh
in 1989-90. Contrary to these trends, the number of employees declined from 22.79 lakh in 1989-90 to around
15 lakh in 2007-08. The fall in the number of employees in PSEs is a result of the voluntary retirement
scheme. Under this scheme, the government provided various advantages to the employees along with full
compensation with the objective of reducing overstaffing in the pre-reform period. A marginal rise in 2001-02
is on account of the shift of employees from the department of telecommunications to BSNL, incorporated as
a corporate entity (Nagaraj, 2002). The expenditure on research and development activities is the key
determinant of competitiveness of every enterprise. Presents the research and development expenditure of
PSEs. R&D intensity was high in the pre-reform period compared to the post-reform period. R&D expenditure
is an input indicator of innovation. To measure innovation in output indicators, we need to calculate the
number of patents received by these enterprises. Therefore, R&D gives only a partial picture about the
innovation behavior of any firm and industry.
The pattern of resource mobilization of PSEs has undergone a major change in the post reform period.
In the early years of independence, CPSEs were started with complete assistance from the central government
in the form of grant via equity route. In the later period, these enterprises moved to the budgetary support
under which the equity or debt is allotted on the basis of project justification. With the introduction of a series
of reform measures, CPSEs moved to the capital market for resource mobilization. The results show that
budgetary support to CPSEs declined from 50% of plan outlay in 1985-86 to around 1% in 2008-09. On the
other hand, the percentage share of internal resources mobilization19 increased from 30% in 1988-89 to 55%
of plan outlay in 2008-09. This is because the CPSEs started mobilizing money via new financial instruments.
Further, financing to working capital dramatically decreased in the postreform period. It is so because CPCEs
started raising money from commercial banks and capital market to finance the working capital.
Management Guru: Journal of Management Research, May 2020, Vol. VIII _ Issue 0 , ISSN 2319-2429 4
23
Page 24
Conclusion
On the basis of certain selected indicators, it is noticed that PSEs performed better in the postreform
period compared to the pre-reform period. The interesting point to be noticed here is that the sources of
financing to CPSEs have undergone a major change in the recent period. In the early years of establishment,
most of the funding to these enterprises was in the form of budgetary support. In the post-reform period, the
share of budgetary support declined to around 1% and the share of internal resource mobilization increased to
55% in 2008-09. Further, overstaffing had also reduced with the implementation of voluntary retirement
scheme. And, the profitability of PSEs showed improvement and made them raise resources internally. These
findings suggest that the performance of PSEs has improved in response to the liberalization measures.
References :-
1. Arun T G and Nixson F I (2000), “Disinvestment of Public Sector Enterprises: The Indian
Experience”, Oxford Development Studies, Vol. 28, No. 1, pp. 19-32.
2. Baijal Pradip (2002), “Privatisation Option and Compulsion: Options for Economic Reform”,
Economic and Political Weekly, October 12.
3. Central Statistics Organization (2007), National Accounts Statistics, Sources and Methods, New
Delhi, Ministry of Programme Implementation, Government of India.
4. Das Abhiman (1997), “Technical, Allocative and Scale Efficiency of Public Sector Banks in
India”, RBI Occasional Papers, June-September 18.
5. Dutt Ruddar and Sundhram K P M (2005), Indian Economy, S Chand and Company Ltd., Ram
Nagar, New Delhi.
6. Ghuman B S (1999), “Public Enterprises in India: Phases of Reform in the 1990s”, Asian Journal
of Public Administration, Vol. 21, No. 2, pp. 220-233.
7. Gouri G (1996), “Privatization and Public Sector Enterprises in India: Analysis of Impact of a
Non-Policy”, Economic and Political Weekly, November 30, pp. M63-M74.
8. Government of India (2001), Department of Science and Technology, Research and
Development Statistics, India.
9. Government of India (2001-2003), Economic Survey 2001-03, Ministry of Economics Division,
Government of India. New Delhi, India.
10. Government of India (2005-2006), Economic Survey 2005-06.
11. Government of India (2008-2009), Public Enterprises Survey, Vol. 1, Department of Public
Enterprises, Ministry of Heavy Industries & Public Enterprises, New Delhi.
12. Jain P K and Surendra S Yadav (2005), “Financial Management of Public Sector Enterprises in
India, Analysis of Profitability”, Economic and Political Weekly, September 24.
13. Malik and Vipan (2003), “Disinvestment in India Needed the Change in Mindset”, Vikalpa, Vol.
28, No. 3.
Management Guru: Journal of Management Research, May 2020, Vol. VIII _ Issue 0 , ISSN 2319-2429 4
24
Page 25
Policies and Programmes to Regulate Stock Market by SEBI
Dr. Sandeep Kumar Yadav Department of Commerce,
Daroga Prasad Rai Degree College, Siwan (Bihar)
Email : [email protected]
Abstract
The smooth functioning of the capital market depends on the regulators, participants and investors.
The past decade has been a golden age for securities market in India. It is now a far more important source of
finance than traditional financial intermediaries for corporate sector which is poised to dominate the future of
corporate finance in India. Reforms in the securities market, particularly the establishment and empowerment
of SEBI, market-determined allocation of resources, screen-based nation-wide trading, dematerialization and
electronic transfer of securities, rolling settlement and ban on deferral products, sophisticated risk
management and derivatives trading, have greatly improved the regulatory framework and efficiency of
trading and settlement. Indian market is now comparable to many developed markets in terms of a number of
qualitative parameters
Key words : Women, Working Environment, Untapped Skills, Personality, Government, Goal.
Introduction
The SEBI was set up in 1988 through an administrative order, and it became a statutory body in 1992.
The SEBI is governed by six member board of Governors appointed by the Government of India and RBI.
Operationally, it is divided in to seven departments. Its head office is in Mumbai and regional offices are at
Delhi, Calcutta and Chennai. Its objectives are to protect the investors and to regulate the financial system in
order to bring about its healthy development. It seeks to increase the efficiency of mobilization and allocation
of resources through the security market. It has wide powers to issue rules, regulations and guidelines in
respect of both the primary and secondary securities market. It is empowered to summon all categories of
market intermediaries, to investigate their working, to impose penalty and to initiate prosecution against them.
But the Government of India can supersede the SEBI under certain circumstances, and in respect of all policy
matters, the Government of India can give directions to SEBI. The Government of India‟s decision is final in
every case. The success rate in resolving investor‟s complaints claimed by the SEBI is suspect. The empirical
evidence shows that the SEBI has failed to protect the small and individual investor and to check the unfair,
unethical practices in the market. The SEBI has exhibited a lack of will in taking action against wrong doers.
It has dithered in vital matters, for example, in the carry forward system of trading. It is said to have been
more corporate and market intermediaries‟ friendly than investor friendly. The SEBI ought to be made an
autonomous and independent regulatory body which at present it is not. The SEBI was established to create
an environment to facilitate mobilization of adequate resources through the security market. This environment
includes rules and regulations, institutions and their interrelationships, instruments, practices, infrastructure
and policy framework.
Policies and Programmes related to Stock Market by SEBI during 2015-16
The reform of the Indian securities market continues to be top priority in top gear for the Government
of India. 2015-16 saw the merger of the FMC with SEBI. SEBI initiated a host of policies and programmes
during 2015-16 with the objectives of:
Protecting the interests of investors in securities.
Promoting the development of the securities market.
Regulating the securities market.
Management Guru: Journal of Management Research, May 2020, Vol. VIII _ Issue 0 , ISSN 2319-2429 4
25
Page 26
1) Policy for Annulment of Trades Undertaken on Stock Exchanges
In order to bring about uniformity and transparency in the process followed by stock exchanges with
respect to the mechanism for annulment of trades resulting from material mistakes or erroneous orders the
following provisions have been issued:
Examination of trade(s) for annulment may be taken up, either suo-moto by the stock exchange or on
the receipt of a request from a stock broker.
Requesting stock exchanges for the annulment to be submitted within 30 minutes from the execution
of the trade(s). Stock exchanges may consider requests received after 30 minutes, but no longer than
60 minutes, only in exceptional cases.
The stock exchanges shall expeditiously, not later than the start of the next trading day, examine and
decide upon such requests.
As an alternate mechanism, stock exchanges may consider resetting the price of the trade(s) under
consideration to an appropriate price(s).
The stock exchanges shall undertake the annulment or the price reset only in exceptional cases after
recording the reasons in writing in the interests of the investors, market integrity, and maintaining the
sanctity of the price discovery mechanism.
Stock exchanges shall convey their reasoned decisions on the annulment of the trade(s) or the price
reset to all the counterparties to the trade(s) under consideration. Stock exchanges will also publish
the details of such a decision on its website.
A mechanism to request a review of the decisions taken by stock exchanges will be provided. To this
end, the aggrieved party has to submit such a request to the stock exchange before the pay-out
deadline of the trades.
Stock exchanges will charge an application fee equal to 5 percent of the value of the trade(s) for
accepting the annulment request from a stock broker, subject to a minimum fee of Rs.1 lakhs and
maximum fee of Rs.10 lakhs.
2) Review of the Capacity Planning Framework of Stock Exchanges and Clearing Corporations
Being critical infrastructure of the securities market, it is imperative for stock exchanges and clearing
corporations to continuously assess and monitor their system capacities. Stock exchanges and the clearing
corporations have been advised to ensure fulfilment of the following requirements while planning capacities
of their trading, clearing and settlement and risk management related infrastructure:
The installed capacity has to be at least 1.5 times (1.5x) of the projected peak load.
The projected peak load will be calculated for the next 60 days based on the per-second peak load
trend of the past 180 days.
All the systems in the trading, clearing and settlement ecosystem will be considered in this process,
including all technical components such as network, hardware and software and will be adequately
sized to meet capacity requirements.
In case the actual capacity utilisation exceeds 75 per cent of the installed capacity, immediate action
will be taken to enhance capacity.
3) Co-location/Proximity Hosting Facility Offered by Stock Exchanges
SEBI has issued guidelines for stock exchanges on co-location/proximity hosting to ensure fair, transparent
and equitable access to the co-location facility wherein the stock exchanges are required to:
Ensure that all the participants who avail of the co-location/proximity hosting facility have fair and
equal access to the facilities and the data feeds provided by the stock exchange.
Ensure that all stock brokers and data vendors using co-location/proximity hosting experience similar
latency with respect to the exchange provided infrastructure.
Management Guru: Journal of Management Research, May 2020, Vol. VIII _ Issue 0 , ISSN 2319-2429 4
26
Page 27
Ensure that the size of the co-located/proximity hosting space is sufficient to accommodate all he
stock brokers and data vendors who are desirous of availing the facility.
Provide flexibility to avail rack space in the co-location/proximity hosting so as to meet the needs of
all the stock brokers desirous of availing such a facility.
Facilitate the stock brokers to receive data feeds from other recognised stock exchanges at the co-
location facilities and allow the routing of the orders to other recognised stock exchanges from the co-
location facility.
Publish suitable quarterly reports on the latencies observed at the exchange on their websites.
Ensure that the facility of co-location/proximity hosting does not compromise the integrity and the
security of the data and trading systems.
4) Cyber Security and Cyber Resilience Frameworks of Stock Exchanges, Clearing Corporations and
Depositories
SEBI has laid down a detailed framework with regard to cyber security and cyber resilience that stock
exchanges, clearing corporations and depositories are required to adopt. The framework, inter-alia, covers
areas such as governance, identifying critical assets and cyber risks (threats and vulnerabilities), accessing
controls, physical security, network security management, security of data, hardening of hardware and
software, application security and testing, patch management, disposal of systems and storage devices,
vulnerability assessment and penetration testing (VAPT), monitoring and detection, response and recovery,
sharing of information, training and periodic audits.
5) Review of the Offer for Sale (OFS) of Shares through the Stock Exchange Mechanism
Offer for sale (OFS) through the stock exchange mechanism is one of the mechanisms available to
promoters/large shareholders for offloading their shareholdings in listed companies. Market participants have
found the OFS mechanism useful as it ensures transparency, wider participation and quicker settlement. In
order to further streamline the OFS process with the objective of encouraging greater participation of all
investors including retail individual investors, the following modifications have been introduced in the OFS
framework:
The seller will notify the stock exchanges its intention of the sale of shares latest by 5:00 pm on the T-
1 day (T day being the day of the OFS). The stock exchanges will inform the market immediately on
receipt of such a notice.
On the commencement of OFS on T day, only non-retail investors will be permitted to place their
bids. The cut-off price will be determined based on the bids received on T day as per the extant
guidelines.
Retail individual investors will bid on T+1 day and they may place a price bid or opt for bidding at the
cut-off price. The seller will make appropriate disclosures in this regard in the OFS notice.
The settlement for bids received on T+1 will take place on T+3 days (T+1 day being the trade day for
retail individual investors). Discount, if any to retail individual investors, will be applicable to bids
received on T+1 day.
In order to ensure that the shares reserved for retail individual investors do not remain unallocated due
to insufficient demand from retail individual investors, bids of non-retail investors will be allowed to
be carried forward to T+1 day.
The unsubscribed portion of the shares reserved for retail individual investors will be allocated to non-
retail bidders (the un-allotted bidders on T day, who choose to carry forward their bids onto T+1 day)
on T+1 day at a price equal to the cut-off price or higher as per the bids. In this regard, an option will
be provided to such non-retail bidders to indicate their willingness to carry forward their bids to T+1
day. If non-retail bidders choose to carry forward their bids to T+1 day, they may then be permitted to
revise such bids. The settlement for such bids will take place on T+3 day.
6) Revision of the Activity Schedule of the Auction Session
Management Guru: Journal of Management Research, May 2020, Vol. VIII _ Issue 0 , ISSN 2319-2429 4
27
Page 28
In the equity segment of stock exchanges, in case of default by the selling broker in a normal
settlement, the security delivered short is bought in the auction session (conducted on T+2 day) and is
delivered to the buying broker on T+3 day. With a view to facilitating reduction of the time involved in
delivering the shares to the buying broker in case of default by the selling broker clearing corporations have
been provided the flexibility to decide the time for conducting the settlement of the auction session on or
before T+3 day. Thus, the activity schedule for conducting the settlement of the auction session and the close-
out has been revised as:
Auction session - By T+2
Pay-in/pay-out of auction and close-out - By T+3
7) Review of the Minimum Contract Size in the Equity Derivatives Segment
The requirement of the minimum contract size of 2 lakhs in the equity derivatives segment has been
reviewed and increased to 5 lakhs. Further, the mechanism to fix the trading lot of the derivatives contracts
has been modified to give flexibility to stock exchanges to set the lot size in such a manner that the contract
value of the derivatives on the day of the review is within 5 lakhs and 10 lakhs.
8) Introduction of Exchange Traded Cash Settled Interest Rate Futures (IRF) on 6-Year and 13-Year
Government of India Security
SEBI had earlier prescribed a framework for stock exchanges to launch cash settled interest rate
futures (IRFs) on Government of India (GoI) securities having a residual maturity between nine and eleven
years as on the day of the expiry of the IRF contract. In order to provide hedging instruments for managing the
interest rate exposure across different maturities and to further enhance the depth and the liquidity in the
underlying bond market, SEBI permitted the stock exchanges to introduce cash settled IRFs on 6-year
(residual maturity between four and nine years) and 13-year (residual maturity between 11 and 15 years) GoI
securities. Effectively, the stock exchanges are now permitted to launch IRF contracts on GoI securities with a
residual maturity between four and 15 years as on the day of the expiry of the IRF contract. Additionally,
SEBI has also permitted the stock exchanges to introduce three quarterly contracts of the
March/June/September/December cycle in addition to the three serial monthly contracts of IRFs. This will
enable market participants to take a longer-term view on the movement of interest rates.
9) Revision of Limits Relating to the Requirement of Underlying Exposure for Currency Derivatives
Contracts
SEBI, along with RBI has revised the limits relating to the requirement of the underlying exposure for
the exchange traded currency derivatives contracts as:
Clients (FPIs and domestic clients) may take long as well as short positions per stock exchange upto
US$ 15 million in US$-INR contracts. Also, a US$ 5 million limit is provided for EUR-INR, GBP-
INR and JPY-INR currency pairs all put together. These limits are without the requirement of having
to establish the existence of any underlying exposure.
Stock exchanges have been permitted to prescribe fixed limits for EUR-INR, GBP-INR and JPY-INR
currency pairs within the equivalent of US$ 5 million.
10) Clearing Corporations Required to File Monthly Reports with SEBI
In order to regulate the clearing corporations more effectively and with a view to bringing about
uniformity in the matter of obtaining information from them in the areas of, inter-alia, administration, clearing
and settlement related activities, net worth and shareholding, SEBI advised the clearing corporations to submit
a monthly report in the prescribed format providing details, inter-alia, with respect to daily settlement value,
settlement shortages, penalties imposed, corpus of the core settlement guarantee fund (SGF) and composition
of the governing board and shareholding pattern.
11) Database of Distinctive Numbers (DN) of Shares
Depositories have been directed to create and maintain a database of the distinctive numbers (DN) of
the equity shares of the listed companies with details of the DN with respect to all the physical shares and the
Management Guru: Journal of Management Research, May 2020, Vol. VIII _ Issue 0 , ISSN 2319-2429 4
28
Page 29
overall DN range for the dematerialised shares to ensure a centralised record of all the securities, including
both physical and dematerialised shares, issued by a company and its reconciliation thereof. The DN database
will make available information on issued capital, such as the DN range, the number of equity shares issued,
the names of the stock exchanges where the shares are listed, the date of in-principle listing / final trading
approval / dealing permission, whether the shares are held in physical or demat form, the date of allotment and
the shares dematerialised under temporary (frozen) International Securities Identification Number (ISIN) or
permanent (active) ISIN in one place.
12) Risk Management Policy at the Depositories
Based on the recommendations of Depository Systems Review Committee (DSRC), depositories were
advised to establish a clear, comprehensive and well documented risk management framework which should
include:
An integrated and comprehensive view of the risks to the depository, including those emanating from
participants, participants‟ clients and third parties to whom activities are outsourced, etc.
List out all the relevant risks, including technological, legal, operational, custodial and general
business risks and the ways and means to address them.
Systems, policies and procedures to identify, assess, monitor and manage the risks that arise in or are
borne by the depository.
The depository‟s risk-tolerance policy.
Responsibilities and accountability for risk decisions and decision making processes in crises and
emergencies.
13) Review of Annual Custody/Issuer Charges
With the dual objective of promoting financial inclusion and expanding the reach of depository
services to Tier II and Tier III towns, the Depository Systems Review Committee (DSRC) has recommended
that the revenue sources of the depositories may be augmented and depository participants (DPs) may be
incentivised by setting out a revenue sharing mechanism between the depositories and DPs. It has also
suggested that annual issuer charges may be enhanced and the incremental revenue be shared suitably by the
depositories with their DPs for promoting basic services demat accounts (BSDAs) and for opening new
accounts in Tier II and Tier III towns. Based on DSRC‟s recommendations, per folio charges were revised
from Rs.8.00 to Rs.11.00, subject to a certain minimum amount. Further, in order to compensate DPs for the
cost of opening and maintaining BSDAs, the depositories were advised to pay an incentive of Rs.100.00 for
every new BSDA opened by their DPs in cities other than the Top 15 ones. In addition, the depositories were
advised to pay Rs.2 per folio per ISIN to the respective DP in respect of the International Securities
Identification Number (ISIN) positions held in BSDA in order to incentivise the DPs to promote holdings in
BSDAs.
14) Guidelines on Outsourcing by Depositories
Guidelines on outsourcing by depositories have been issued based on DSRC‟s recommendations
wherein the depositories have been advised that the core and critical activities of the depositories will not be
outsourced. Guidelines have also been prescribed with regard to due diligence while selecting a third party for
outsourcing, risk management and monitoring and audit of outsourced activities.
15) Facility for Basic Services Demat Account (BSDA)
SEBI introduced the facility of the basic services demat account (BSDA) with limited services for
eligible individuals with the objective of achieving wider financial inclusion and for encouraging the holding
of demat accounts. In order to facilitate eligible individuals to avail of the benefits of SDA, depository
participants have been advised to convert all the eligible Demat accounts into BSDAs unless such beneficial
owners (BOs) specifically opt to continue to avail the facilities of regular Demat accounts.
Management Guru: Journal of Management Research, May 2020, Vol. VIII _ Issue 0 , ISSN 2319-2429 4
29
Page 30
REFERENCES :-
1. Bajpai, G. N. (2009). Indian Securities Markets –New Bench Marks. SEBI Bulletin, 1(8), 5-14.
2. Rangarajan, C. (1997). Financial Sector Reforms: The Indian Experiences. RBI Bulletin, L1(7), 549-
559.
3. Machiraju, H. R. (1999). Indian Financial System. Vikas Publishing House Private Limited, Chennai.
pp. 3.
4. Varshney, P. N. and Mittal, D. K. (2002). Indian Financial System. Sultan Chand and Sons, New
Delhi. pp. 5].
5. Tarapore, W. and Russi, J. (2006). The Union Budget 2005 -06 and the Capital Market. BMA
Review, III(26), 278.
6. Misra, B. M. (1998). Fifty years of the Indian Capital Market: 1947-97. In Rajkapila and Umakapila,
(Ed.), Banking and Finance Sector Reforms in India, 6, Academic Foundation Publications, New
Delhi
7. Levine and Ross. (2008). Stock market Development and Economic Growth. The world Bank
Economic Review, 1012, 323 –339.
8. Pathak, B. V. (2003). Indian Financial System. Pearson Education, New Delhi, pp. 129.
9. Biswas, J. (2006). Indian Stock Market in Comparison. Economic and Political Weekly, XLI(10),
1747.
10. Roy, M. K. (2001). Stock Market in a Liberalized Economy- Indian Experiences. Economic and
Political Weekly, XXXVI(4), 364.
Management Guru: Journal of Management Research, May 2020, Vol. VIII _ Issue 0 , ISSN 2319-2429 4
30
Page 31
An Analysis of NPAs in Public & Private Sector Banks
Kishor Kumar Mishra Research Scholar,
L.N. Mithila University, Darbangha
Abstract
In the earlier 90s, the Indian banking sector is dominated by public sector banks. After liberalization,
the India has seen many private sector banks and foreign banks. One of the major objectives of banking sector
reforms was to encourage operational self-sufficiency, flexibility and competition in the system and to improve
banking standards in India to the international best practices. Based on the recommendations of various
committees’ especially the Committee on Financial Sector Reforms under the chairmanship of Mr. M.
Narasimham. But every year, the rate of NPA of public sector banks has been increased. The CRISIL said that
the asset quality woes of banks will continue in the current fiscal with gross non-performing assets (NPA)
ratio for the system growing at 0.20 per cent to 4.5 per cent by March 2016. Many people mentioning on their
research publication on NPA that public sector banks don’t have ability to decrease and eradicate the
problems of NPA, even there are some acts to prevent this disease and also they argue that private sector
banks do their best than public sector banks. So, in this juncture it is necessary to make the comparison
between the level of NPA of Private sector banks (ICICI & HDFC) and Public sector banks (SBI & PNB) in
India.
Keywords : NPAs, Public Sector Banks, Private Sector Banks, Assets Quality, Finalcial Sector Reforms.
Introduction
Asset quality was not prime concern in India banking sector till 1991, but was mainly focused on
performance objectives such as opening wide networks/branches, development of rural areas, priority sector
lending, higher employment generation, etc. While the primary function of banks is to lend funds as loans to
various sectors such as agriculture, industry, personal loans, housing loans etc., but in recent times the banks
have become very cautious in extending loans. The reason being mounting nonperforming assets (NPAs) and
nowadays these are one of the major concerns for banks in India.
Narasimham Committee that mandated identifications and reduction of NPAs to be treated as a national
priority because NPA direct toward credit risk that bank faces and its efficiency in allocating resources.
Profitability and earning of banks are affected due to NPA numbers. If we glance on the numbers of non-
performing assets we may come to know that in the year 1995 the NPAs were Rs. 38385 crore and reached to
71047 crorer in 2011 in Public sector banks and comparatively in the year 2001 the NPAs were Rs. 6410 crore
and reached to Rs. 17922 crorer in 2011 in Private Sector Banks.
The CRISIL said that the asset quality woes of banks will continue in the current fiscal with gross
non-performing assets (NPA) ratio for the system growing at 0.20 per cent to 4.5 per cent by March 2016.
Many people mentioning on their research publication on NPA that public sector banks don’t have ability to
decrease and eradicate the problems of NPA, even there are some acts to prevent this disease and also they
argue that private sector banks do their best than public sector banks. So, in this juncture it is necessary to
make the comparison between the level of NPA of Private sector banks and Public sector banks in India.
Review of Literature
Many published articles are available in the area of non-performing assets and a large number of
researcher have studied the issue of NPA in banking industry. A review of the relevant literature has been
described. Kumar (2013) in his study on A Comparative study of NPA of Old Private Sector Banks and
Foreign Banks has said that Non-performing Assets (NPAs) have become a muisance and headache for the
Indian banking sector for the past several years. one of the major issues challenging the performance of
commercial banks in the late 90s adversely affecting was the accumulation of huge non-performing assets
(NPAs). Selvarajan & Vadivalagan (2013) in A Study on Management of Non-Performing Assets in Priority
Sector reference to Indian Bank and Public Sector Banks (PSBs) find that the growth of Indian Bank’s lending
to Priority setor is more than that of the Public Sector Banks as a whole. Indian Bank has slippages in
Management Guru: Journal of Management Research, May 2020, Vol. VIII _ Issue 0 , ISSN 2319-2429 4
31
Page 32
controlling of NPAs in the early year of the decade. Singh (2013) in his paper entitled Recovery of NPAs in
Indian commercial banks says that the origin of the problem burgeoning NPA’s lies in the system of credit
risk management by the banks. Banks are required to have adequate preventive measures in fixing pre-
sanctioning appraisal responsibility and an effective post-disbursement supervison. Banks should continously
monitor loans to identify accounts that have potential to become non-perforing. Gupta (2012) in her study A
Comparative Study of Non-Performing Assets of SBI & Associates & Other Public Sector Banks had
concluded that each bank should have its own independence credit rating agency which should evaluate the
financial capacity of the borrower before credit facility and credit rating agencies should regularly evaluate the
financial condition of the clients. Rai (2012) in her study on Study on performance of NPAs of Indian
commercial banks find out that corporate borrowers even after defaulting continously never had the fear of
bank taking action to recover their dues. This is because there was no legal framework to safeguard the real
interest of banks. Chatterjee C., Mukharjee J. and Das (2012) in their study on Management of non-
performing assets – a current scenario has concluded that banks should find out the original reasons/purposes
of the loan required by the borrower. Proper identification of the guarantor should be checked by the bankk
including scrutiny of his/her wealth. Kaur K. and Singh B. (2011) in their study on Non-performing assets of
public and private sector banks (a comparative study) studies that NPA’s are considered as an important
parameter to judge the performance and financial health of banks. The level of NPAs is one of the driers of
financial stability and growth of the banking sector. Prasad GV.B. and Veena (2011) in their study on NPAs
Reduction Strategies for commercial Banks in India stated that the NPAs do not generate interest income for
banks but at the same time banks are required to privide provisions for NPAs from their current profits, thus
NPAs have desructive impact on the return on assets in the following ways, Chaudhary K. and Sharma M.
(2011) in their research stated that An efficient management information system should be developed. The
bank staff involved in sanctioning the advances should be trained about the proper documentation and charge
of securities and motivted to make measures in preventing advances turning into NPA. Karunakar (2008), in
his study Are non-Performing Assets Gloomy or Greedy from Indian Prespective, has highlighted problem of
losses and lower profitability of Non-Performing Assets (NPA) and liability mismatch in Banks and financial
sector depend on how various risks are managed in their business. The lasting solution to the problem of
NPAs can be achieved only with proper credit asseesment and risk management mechanism. Bhartia (2007)
in his research paper explores that NPAs are considered as an important parameter to judge the performance
and financial health of banks. The level of NPAs is one fo the drivers of financial stability and growth of the
banking sector. Kaur (2006) in her thesis titled Credit management and problem of NPAs in Pulic Sector
Banks, suggested that for effective handling of NPAs, there is an urgent need for creating proper awareness
about the adverse impact of NPAs on profitability amongst bank staff, particularly the field functionaries,
Bankers should have frequent interactions and meeting with the borrowers for creating better understanding
and mutual trust. Balasubramaniam C.S. (2001) highlighted the level of NPAs is high with all banks currently
and the banks would be expected to bring down their NPA. This can be achieved by good credit appraisal
procedure, effective internal control systems along with their efforts to improve asset quality in their balance
sheets.
In the earlier 90s, the Indian banking sector is dominated by public sector banks. After liberalization,
the India has seen many private sector banks and foreign banks. One of the major objectives of banking sector
reforms was to encourage operational self-sufficiency, flexibility and competition in the system and to
improve banking standards in India to the international best practices. Based on the recommendations of
various committees’ especially the Committee on Financial Sector Reforms under the chairmanship of Mr. M.
Narasimham. But every year, the rate of NPA of public sector banks has been increased.
OBJECTIVES OF THE STUDY
To understand Advances and NPAs of Public sector Banks and Private Sector Banks.
To understand the growth of the Public sector Banks and Private Sector Banks.
To know the relationship between NPA of Public and Private Sector Banks.
Management Guru: Journal of Management Research, May 2020, Vol. VIII _ Issue 0 , ISSN 2319-2429 4
32
Page 33
RESEARCH METHODOLOGY
The present article is based on secondary data. Data is collected through RBI bulletins, newspapers, RBI
website etc.
Table 1Advances of Public Sector and Private Sector Banks
Year Public Sector Banks
Private Sector Banks
PNB SBI ICIC
I
HDF
C
Advan
ces
Incre
ase
in Rs
Perce
ntage
Increa
se
Advan
ce
Incre
ase
in Rs
Perce
ntage
Increa
se
Adva
nce
Incre
ase
in Rs
Perce
ntage
Increa
se
Adva
nce
Incre
ase
in Rs
Perce
ntage
Increa
se
20
12
29377
4.76
86757
8.89
25372
7.66
19542
0.13
20
13
30872
5.21
1495
0.45
5.08 10456
16.55
17803
7.66
20.52 29024
9.44
3652
1.78
14.39 23972
0.64
4430
0.51
22.66
20
14
34926
9.13
4054
3.92
13.13 12098
28.72
16421
2.17
15.70 33870
2.65
4845
3.21
16.69 30300
0.27
6327
9.63
26.39
20
15
38053
4.40
3126
5.75
8.95 13000
26.39
90197
.67
7.45 38752
2.07
4881
9.42
14.41 36549
5.03
6249
4.74
17.65
20
16
41232
5.80
3179
1.40
8.35 14637
00.42
16367
3.61
12.59 43526
3.94
4774
1.87
12.31 46459
3.96
9909
8.93
30.32
*Advances: Gross Advances = Net Advances
Table 2 Gross NPA of Public Sector and Private Sector Banks
Year Public Sector Banks
Private Sector Banks
PNB SBI ICICI HDF
C
Gross
NPA
Incre
ase
in Rs
Percen
tage
Increa
se
Gross
NPA
Incre
ase &
Decre
se in
in Rs
Percen
tage
Increa
se &
Decres
e
Gross
NPA
Incre
ase
in Rs
Percen
tage
Increa
se
Gros
s
NPA
Incre
ase
in Rs
Percen
tage
Increa
se
20
12
8719.
62
9676.
46
9475.
33
1999
.39
20
13
1346
5.79
4746.
17
54.43 5118
9.39
1151
2.93
29.01 9607.
75
132.4
2
1.39 2334
.64
335.2
5
16.76
20
14
1888
0.06
5414.
27
40.20 6160
5.00
1041
5.61
20.34 1050
5.84
898.0
9
9.34 2989
.28
654.6
4
28.04
20
15
2569
4.86
6814.
80
36.09 5672
5.00
-
4880.
00
-7.92 1509
4.69
4588.
85
43.67 3438
.38
449.1
0
15.02
Management Guru: Journal of Management Research, May 2020, Vol. VIII _ Issue 0 , ISSN 2319-2429 4
33
Page 34
20
16
5581
8.33
3012
3.47
117.23 9817
2.80
4144
7.80
73.06 2622
1.25
1112
6.56
73.71 4392
.83
954.4
5
27.75
Table 3 Net NPA of Public Sector and Private Sector Banks
Year Public Sector Banks
Private Sector Banks
PNB SBI ICIC
I
HDF
C
Net
NPA
Incre
ase
in Rs
Percen
tage
Increas
e
Net
NPA
Incre
ase &
Decre
se in
in Rs
Percen
tage
Increas
e &
Decres
e
Net
NPA
Incre
ase
in Rs
Percen
tage
Increas
e
Net
NPA
Incre
ase
in Rs
Percen
tage
Increas
e
20
12
4454.
23
1581
8.85
1860.
84
352.
33
20
13
7236.
50
2782.
27
62.46 2195
6.48
6137.
63
38.79 2230.
56
369.7
2
19.86 468.
95
116.6
2
33.09
20
14
9916.
99
2680.
49
37.04 3109
6.07
9139.
59
41.62 3297.
96
1067.
40
47.85 820.
03
351.0
8
74.86
20
15
1539
6.50
5479.
51
55.25 2759
0.58
-
3505.
49
-11.27 6255.
53
2957.
57
89.67 896.
28
76.23 9.29
20
16
3542
2.56
2002
6.06
130.06 5580
7.02
2821
6.44
102.26 1296
3.08
6707.
55
107.22 1320
.37
424.0
9
47.31
Interpretation and Findings
Table 1 exhibits the advances of Public Sector Banks increased by 8.95% during the period of 2014-
2015 than that of 2012-2013, whereas the advances of Private Sector Banks increased by 14.41% during that
period. The advances of Public Sector Banks increased from the level of Rs.14950.45 crores to level of
Rs.31265.75 crores during the period of 2012-2013 to 2014-2015. The trends of Public sector Banks are
flexible but Private Sector Banks show increasing trends.
Table 2 shows the Gross NPA of Public Sector Banks increase from Rs.4746.71 crores in 2012-2013
to Rs.6814.80 Crores in 2014-2015. During 2014-2015 the Gross NPA of Public Sector Bank decreased by
7.92% than that of previous year, but during the same period in Private Sector Banks it has been increased by
43.67%. In 2013-2014 the gross NPA of Public Sector Bank increased by 40.20% than the previous year,
whereas, in Private Sector Banks it has increased only by 9.34%. According to Table 2, the NPA of Private
Sector Banks is less than the Public Sector Banks.
Table 3 briefly explains that the Net NPA of Private Sector Banks is in decreasing trends and in
Public Sector Banks also it shows increasing trends. During the period 2012-2013, 2013-2014, 2014-2015, the
Net NPA of Private Sector Banks is in decreasing trends and in same period Public Sector Banks exhibits
increasing trends. During 2014-2015 the Net NPA of Public Sector Banks decreased by 11.27% than that of
previous year but it is increased by 9.29% for Private Sector Banks. During 2014-2015 Percentage of NPA in
advances is less than zero for the Public Sector Banks, but it is more than zero for Private Sector Banks.
Hence it can be understood that the Private Sector Banks control its level of NPA than the Public Sector
Banks.
Management Guru: Journal of Management Research, May 2020, Vol. VIII _ Issue 0 , ISSN 2319-2429 4
34
Page 35
References :-
1. Aravanan S and Vijayakumar N, “Impact of NPAs on Performance of Banks, Indian Economic
Panorama”, Vol.17, No.3A, pp 18-21, 2007.
2. D. Nagarajan, Sathyanarayan and A. A. Ali, “Non-Performing Asset is a threat to India Banking
Sector- A comparative study between priority and non-priority sector lending in public sector banks”,
International Journal of Advanced research in Management and Social Sciences, 2(11), 39, 2013
3. Dr. Bimal Jaiswal and Ms. Saloni Bhasin, “An Analysis of Priority Sector Lending by Regional Rural
Banks (With Special Reference to Indian Agriculture Sector)”, Acme Intellects International Journal
of Research in Management, Social Sciences & Technology ISSN 2320 – 2939 (Print) 2320-2793,
Vol- 9 No. 9 Jan 2015.
4. Dr. M. M. Gandhi, “Re-Prioritizing Priority Sector Lending for Inclusive Growth Agenda for India”,
Pezzottaite Journals, Volume 4, Number 2, April – June’ 2015 ISSN (Print):2319-9059,
(Online):2319-9067, SJIF (2012): 3.946, SJIF (2013): 5.017, SJIF (2014): 5.912. 2015.
5. Ghosh S, “Management of Non-Performing Assets in Public Sector Banks: Evidence from India”, In
International Conference on Management, Conference Master Resources, (ICM 2011) Proceeding
(No. 2011-057-173), June, 2011.
6. Mehta L and Malhotra M, “Empirical Analysis of Non-Performing Assets Related to Private Banks of
India”, International Journal of Management Excellence, 3(1), 386-391, 2014.
7. N. Rani and D. Gaba, “Analysis of Non-Performing Assets of Public Sector Banks”, GJRA- Global
Journal for Research Analysis, 3(9), 2014.
8. Shabbir N and Mujoo R, “Problem of Non-Performing Assets in Priority Sector Advances in India”,
Journal of Economics, 2(1), 241-275, 2014.
9. T Vara Lakshmi and M Srinivasa Reddy, “Priority Sector Advances and Its Share in Development of
Weaker Sections by Scheduled Commercial Banks in India”, International Journal of Latest
Technology in Engineering, Management & Applied Science –IJLTEMAS, ISSN 2278 – 2540,
Volume V, Issue III, March 2016.
10. Veerakumar K, “Non-performing assets in priority sector: A threat to Indian scheduled commercial
banks”, International Research Journal of Finance and Economics, (93), 2012.
Management Guru: Journal of Management Research, May 2020, Vol. VIII _ Issue 0 , ISSN 2319-2429 4
35
Page 36
A Study On Extent of Agricultural Credit Disbursements
Dr. Lucy Kumari University Department of Commerce & Business Administration
T.M. Bhagalpur University, Bhagalpur
Abstract
Agriculture has been the most important sector contributing to the overall economic growth, as well as,
providing livelihood to a very significant proportion of rural population in India, besides having been an
instrument of food security to children and women in particular. Agriculture contributes 22 per cent to the
Gross Domestic Product (GDP) [over Rs. 6000 billion] of the Indian economy. It employs around 57 per cent
of the labour force on a total of 163 million hectares of land. It has a significantly decisive role in achieving
the expected GDP growth rate of 8 to 10 per cent during the tenth five year plan.
Key words : Agriculture, Economic Growth, Livelihood, Role Population, Indian Economy
Introduction
Agriculture has been the most important sector contributing to the overall economic growth, as well as,
providing livelihood to a very significant proportion of rural population in India, besides having been an
instrument of food security to children and women in particular. Agriculture contributes 22 per cent to the
Gross Domestic Product (GDP) [over Rs. 6000 billion] of the Indian economy. It employs around 57 per cent
of the labour force on a total of 163 million hectares of land. It has a significantly decisive role in achieving
the expected GDP growth rate of 8 to 10 per cent during the tenth five year plan.
It is, therefore, legitimate for the Government of India and States to support agricultural development
through formulation and implementation of national policies and programmes that can make country self-
reliant in its food requirements and create large scale employment in rural area. This should lay emphasis on
integrating agricultural research, extension and education system on the one hand and establishing efficient,
sustainable and cost effective functioning of rural financial markets, on the other. After country’s
independence, Government of India and Reserve Bank of India, both are committed to expand and deepen the
rural financial intermediaries in the country side, so as to facilitate the rural households easy access to credit
for farm sector development. Entire banking system comprising cooperative, private/public
sector/nationalized/foreign/Regional Rural Banks (RRBs) is geared up and its performance is
reviewed/monitored periodically in such a way that each one plays its role in this significantly important area
of development through provision of credit.
Three types of loans are provided to Indian farmers to meet their financial requirements:
1. Short-term loans
2. Medium-term loans
3. Long-term loans
Short-Term Loans are provided for a period of less than 15 months to meet their expenses of routine farming
and domestic consumptions. This type of loans is demanded by farmers for purchasing seeds, fertilizers and
for meeting out family requirements.
Medium-Terms Loans are provided for a period of 15 months to 5 years to purchase agricultural equipments,
animals and for land improvements.
Management Guru: Journal of Management Research, May 2020, Vol. VIII _ Issue 0 , ISSN 2319-2429 4
36
Page 37
Long-Term Loans are provided for a period of more than 5 years. This type of loan is taken by the farmers to
purchase land and expensive agricultural equipments and for repayment of old loans. Indian farmers acquire
above types of loans from two sources Non-institutional sources, like; moneylenders, landlords, big business
men etc. Institutional sources like commercial banks, co-operative banks and government sources.
Policy on agriculture credit aims at progressive institutionalization of credit agencies for providing
credit to farmers for raising agricultural production and productivity. Agricultural credit is disbursed through a
multi agency network consisting of Co-operatives, Commercial Banks and Regional Rural Banks (RRBs).
Agriculture Credit and Financial Agencies
The rural credit system, as we see today, has evolved over the last five and a half decades. During this
course, the system witnessed many reforms mainly as the outcome of recommendations of various committees
and expert groups appointed by Government of India and RBI from time-to-time. The agriculture credit
system received its first and significant policy directions from All India Rural Committee which
recommended new initiatives. The committee recognized the existence of co-operative structure and
recommended state financial support for its strengthening. It also recommended the establishment of large
sized multi-purpose credit societies and nationalization of the Imperial Bank of India (now known as State
Bank of India) for extending banking services in rural areas.
Though these steps helped in augmenting the flow of agriculture credit to some extent, credit supply
from the co-operatives did not match the demand for credit. Therefore, the Government intervened to
encourage commercial banks to play a major role in providing agriculture credit by nationalizing major
commercial banks in two phases, first in 1969 and later again in 1980. The other major development in
agriculture credit from the supply side were establishement of RRBs in 1975, establishment of NABARD in
1982 and the ongoing financial sector reforms since 1992 to supplement the institutional mechanism. Further,
the concept of local area bank was introduced in 1996-97. All these institutional development of the rural
credit structure and initiative brought qualitative changes in credit delivery over time.
It is discernible that the cooperative credit institutions were virtually the only institutions providing
credit for agricultural activities till 1970-71, when the commercial banks made a beginning in this area. With
the spread of their branches, the commercial banks moved fast and by 1988-89, when they adopted the Service
Area Approach, they claimed more than 41 per cent of the share in disbursement of agricultural credit and
about 54 per cent share in outstanding agricultural credit. The market share of the RRBs in agricultural credit
by this time was a mere 5 per cent but the credit had gone entirely to the rural poor. The demand for credit had
risen fast from year to year and the figures of annual disbursements for agricultural purposes moved from Rs.
7,438 million in 1970-71 to Rs. 91,062 million in 1988-89 until the concept of Services Area Approach was
implemented. And now the disbursements have shot up to Rs. 1,574,800 million in 2005-06. Table (5.1)
exhibits the phenomenal contributions made by the RFIs during the period from 1970-71 to 1999-2000 and
the resultant impact on informal sources of credit from 1951 to 1991.
Table - 5.1 Credit Disbursements by Banks during
1970-71 to1999-2000
Year Co-op. Banks Com. Banks RRBs Total Per Annum
1970-71
1971-72 to
1974-75
1975-76 to
7,438
36,428
75,037
00
5,829
32,567
00
00
1,622
7,438
42,257
109,226
7,438
10,564.2
[42%]
21,845.2
Management Guru: Journal of Management Research, May 2020, Vol. VIII _ Issue 0 , ISSN 2319-2429 4
37
Page 38
1979-80
1980-81 to
1984-85
1985-86 to
1989-90
1990-91 to
1994-95
1995-96 to
1999-00
Total
% Share
133,077
223,653
335,691
711,010
1,540,334
[49,688.2]*
51.25%
83,023
176,831
272,491
716,609
1,287,350
[42,911.6]*
42.84%
9,628
24,292
34,636
107,320
177,498
[6,826.8]*
5.91%
225,728
424,776
662,818
1,534,939
3,005,182
100%
[106%]
41,145.6
[88%]
84,955.2
[106%]
132,563.6
[56%]
306,987.8
[131%]
98,941.3
Figures in bracket under per annum column indicate % growth over previous year.
Figures in bracket with* under row total indicate amount of credit per annum.
With the induction of public sector and nationalized banks and RRBs, credit disbursement has
increased significantly from year to year since 1970-71. Total disbursement rose from Rs. 7,438 million in
1970-71 to Rs. 3,005,182 million at the end of 1999-2000. Annual growth in the disbursements by all banks
had not been progressively rising as it varied from 42 per cent to 131per cent. Annual disbursement, on an
average, was Rs. 49,688.2 million by Co-operatives followed by commercial banks at Rs. 42,911.6 million
and RRBs at Rs. 6,826.8 million. Share of co-operatives was as high as 51.25 per cent followed by
commercial banks at 42.84 per cent where as it was 5.91 per cent case of RRBs.
References
1. Thorner, D; Agricultural Cooperatives in India (Bombay : Asia Publishing House).
2. Indule, C.B., Cooperative banking in india, Continental Prakashan, Poona.
3. Jain, P.L., Cooperative Credit in Rural India, Mittal Publication new Delhi, 1990.
4. Joshi, Nawin, Chandra, Bank funds for Rural Development, Commerce , 143(3666) 19th
September, 1981, p. 532.
5. Joshi, V.R., Restructuring Aricultural Cooperative Credit system in India, Maharashtra
Cooperative Quarterly, 64(4) April, 1981, pp. 242 -55.
6. Krishnakumari, D.S., Cooperative Banking for Agricultural Developme nt, Deep and
Deep Publication, New Delhi, 1998, p. 252.
7. Khalidi, Musa, S., Cooperative Foundations in developing Societies Problems and
Prospects, Review of International cooperation, Vol. 79 No.4, December, 1986, pp. 40 -
44.
8. Mahfoozur Rehman, Cooperative Credit and Agricultural development, Sultan chand
Publishers, Delhi.
9. Nakkiran, S., Cooperative Banking in India, Rainbow Publications, Coimbatore, 1980.
10. Reddy, S.V.D. Obul, Cooperative Agricultural Development Banks: A Case
Study of Andhra Pradesh, BRPC Publication, Delhi, 1986, p. 429.
Management Guru: Journal of Management Research, May 2020, Vol. VIII _ Issue 0 , ISSN 2319-2429 4
38
Page 39
Challenges Faced by Womens Entreprenures in Bihar
Dr. Md. Izhar Ali
Faculty of Commerce,
J.P. University, Chapra Abstract
Women is treated as the second citizen or subordinate to men. Though various efforts are being made
to improve the status of women, women folk has not made their maximum use and still remains backward in
Bihar. The Bihari sociological setup has been traditionally a male dominated one. Women are considered as
weaker sex and always to depend on men folk in their family and outside, throughout their life. They are left
with lesser commitments and kept as a dormant force for a quite long time. The Biharn culture made them
only subordinates and executors of the decisions made by other male members in the basic family structure.
The traditional set up is changing in the modern era. The transformation of social fabric of the Biharn society
in terms of increased educational status of women and varied aspirations for better living, necessitated a
change in the life style of Bihari Women.
Key words : Women Population, Traditional, Sociological, Culture, Life Style.
Introduction
Family managed business is also a sort of entrepreneurship in Bihar. Nearly 95 percent firms are
family business in Bihar family business is also played important role in economical development of the
nation. Majority of them are engaged in the un-organized sector like agriculture, agro based industries,
handicrafts, hand loom and cottage base industries. Majority was concentrated in low-paid, low-skilled, low –
technology and low productivity jobs in the rural and unorganized sector. In Bihar women entrepreneurship is
found to be less than men entrepreneurship Any strategy aimed at economic development will be log-sided
with and involving women who constitute half of the population. The policy makers and planners have
become astutely aware of the economic significance of women‟s productive activities and the nature of their
contribution to income generation.
Worker Population Ratio (WPR) : Bihar‟s WPR among women is also the lowest in the country at
4.3%. WPR among men in Bihar is 65.2%. 32% of women in Bihar are who are usually engaged in domestic
duties are willing to accept work at their homes.
The most preferred sectors are for women who are willing to work are: Tailoring (27%), Dairy (19%),
Other (14%), Other Animal Husbandry (14%), Spinning & Weaving (10%), Food Processing (9%), Poultry
(5%), Manufacturer of Wood & Cane Products (1%), Leather Good Manufacturer (1%).
Women’s are under taking entrepreneurship in deferent areas as follows:-
Educated Women Entrepreneurship Uneducated Women Entrepreneurship
1. Eco-friendly technology
2. Bio-technology
3. IT enabled enterprises
4. Event Management
5. Telecommunication
6. Plastic materials
7. Mineral water
1. Sericulture
2. Dairy farming
3. Sheep rearing
4. Commercial floriculture , and plant
nursery management
5. Hand embroidery and Dress Designing
6. Soft toys making
Management Guru: Journal of Management Research, May 2020, Vol. VIII _ Issue 0 , ISSN 2319-2429 4
39
Page 40
8. Herbal & health care
9. Food, fruits & vegetable processing
10. Apparel Sector
11. Soap Industries
12. Pharmacy & Medical
7. Handicrafts manufacturing
8. Food, processing and bakery products
9. Computer –Data entry operator
10. Beauty parlour management
11. Desktop Publishing (DTP)
Regular Employment among Women Workers (2017-18)
Rural Bihar Rural Bihar Urban Bihar Urban Bihar
27.8% 10.5% 63.1% 52.1%
However, the increase in regular employment does not automatically imply better job opportunities
for women. At the all- Bihar level, 71.4% of urban women and 58.5% of rural women held wage work with
no formal contract. Further, almost 50% of women held jobs with no eligibility of paid leave or social security
benefits (IWWAGE 2019). Incidence of informal contracts for women is substantially high in Bihar as well,
although it is lower than what is observed at the all-Bihar level. However, more women workers received
social security benefits in their jobs in Bihar compared to the share of women at the national level (IWWAGE
2019).
In Bihar, average wage earnings among female regular workers is 27% lower than male regular
workers, similar to the national average of 26%. In Haryana, Delhi, and Uttar Pradesh, average wage earnings
among female regular workers is 16%, 15%, and 12% higher than male regular workers, respectively.
Launched in 2016, Government of Bihar‟s landmark affirmative action initiative, formalising 35% reservation
for women in all government jobs has increased public sector hiring of women. Urban Bihar‟s rising
proportion of women in regular employment - 63.1% - may be attributable to this.
There are 1,53,610 women entrepreneur establishments in Bihar. Of these 63,495 have at least one
hired worker, while 90,115 are without any hired workers. These women entrepreneur establishments account
for only 1.91% of total establishment in the state.
The majority women entrepreneur establishments in Bihar are self-financed. Only 5% received
financial assistance from the government, while just 1% borrowed from formal financial institutions.
Donations or Transfers from other agencies (including non-profits) constitute 42% of the financing for women
entrepreneur businesses. Given this, there is ample scope to improve women‟s access to formal financing
methods, through platforms like the Micro nit Development and Refinance Agency (MUDRA), for instance.
Further, addressing gendered barriers like social norms and discriminatory property and inheritance laws is
also crucial.
Issues and Challenges of Women entrepreneurship
women entrepreneurship in Bihar is a journey from poverty to prosperity, total dependence to
equality, agricultural labour to entrepreneurs in industry and in service sectors and finally, as opportunity
entrepreneurs .The women entrepreneurship problems range from mobilizing various resources including
problem of capital, marketing, raw material, sales, labour, technical, competition, new technology, problem of
land ,shed ,water, power ,taxes, lack of family support as well as lack of government support and the like .
The problems faced by the emerging and established by the women entrepreneurship are as follows:
Management Guru: Journal of Management Research, May 2020, Vol. VIII _ Issue 0 , ISSN 2319-2429 4
40
Page 41
1. Raw materials:
A major problem that the women entrepreneurship faces is the procurement of raw materials. The
failure of many entrepreneurial units is due to the inadequacy of raw materials. The prices of raw materials are
quite high.
2. Problem of finance:
Finance is one of the most important problems faced by wom en entrepreneurship. As finance is the
life blood of a business organization and no business organization can function properly in the absence of
adequate funds.
3. Problem of marketing:
One of the major problems faced by entrepreneurship is in the field of marketing. It has not in a
position to get first hand information about the market i.e. information about completion, taste, liking disliking
of consumers. Therefore, it is not able to upgrade the products according to the changing business
environment. As a consequence, the product quality compares UN favorably with the quality of the products
of the large scale industries.
4. Problem of under utilization of capacity:
Most of the entrepreneurship suffering from the problem of under utilization of capacity. Units are
making only 40 to 50 percent use of the installed capacities due to various reasons such as shortage of finance,
raw-materials, power and under-developed markets for the products.
5. Outdated technology:
Most of the entrepreneurship is depend upon old techniques and equipment. These units find it very
difficult to modernize the plant and machinery due to limited capacity and capital. The quality of products and
productivity tend be low in the absence of modern technology and that too at higher cost.
6. Poor project planning
Poor project planning is another problem faced by women entrepreneurship. In the absence of
education and experience, this entrepreneurship does not attach much significance to viability studies.
Inexperienced and incompetent women entrepreneurs
often submit unrealistic feasibility reports and incomplete documents which invariably result in delays in
completing promotional formalities. They cannot afford to avail services of project consultants due to limited
financial resources.
7. Inadequate infrastructure:
Insufficient quality and quantity of transportation, communication and other basic services
particularly in backward areas is another problem. Inadequate infrastructure results in under utilization of
capacity and wastages.Inadequate infrastructures also adversely affect the quality, quantity and production
schedule of the enterprises operating in these areas. Therefore, their functioning will become uneconomical
and unviable.
8. Problem of unskilled:
Women entrepreneurship located in backward area may not have problem of unskilled workers but it
may be exposed to the problem of non-availability of skilled workers. Skilled workers may be reluctant to
work in their areas enterprise may not afford to pay the wages and other facilities demanded by these persons.
Management Guru: Journal of Management Research, May 2020, Vol. VIII _ Issue 0 , ISSN 2319-2429 4
41
Page 42
Unavailability of skilled manpower results in lower productivity, deterioration of quality, increase in
wastages, and rise in other overhead costs and finally adverse impact on the profitability.
9. Managerial problem:
Another serious problem for women entrepreneurship is managerial inadequacies. Modern business
demands vision, knowledge, skill, aptitude and whole hearted devotion. The managerial competence of the
entrepreneur is very important for the success of any venture.
10. Lack of Confidence :
Other problems‟ like society‟s attitude towards woman entrepreneurship, unequal opportunities
between women and women and very important amongst all the „Lack of Confidence‟ in women are also
haunting entrepreneurs.
11. Socio personal problems:
Wrong attitude of the society against women due to lack of proper education and information,
economic backwardness and low risk bearing capacity.
12. Motivational Factor:
Self motivation, Attitude to take up risk and behaviour towards the business society, family support, financial
assistance from public and private Institutions and also environmental suitable for Women to establish
business units.
13. Lack of Education :
In Bihar around 60% of women are still illiterate. Illiteracy is the root cause of socio- economic
problem. Due to the lack of education women are not aware of business, technology and market knowledge.
Also lack of education causes low achievement
motivation among women.
14. Training Facilities :
Training programs are essential to rural and young entrepreneurs .The programs enrich the skill and potential
of women entrepreneurship. Training and skill are essential for the development of entrepreneurship.
15. Other problems :
In addition to above discussed problems, the women entrepreneurship is constrained by a number of
other problems such as trained technicians, technological obsolescence, unorganized nature of operation etc .
Conclusion and Suggestions
The study of women entrepreneurship is significant factor in Bihar owing to the unemployment and
weak economic development of women . Women participation in workforce in the field of non-traditional
sector is key point in economicgrowth of the nation . Central and state government should assist women
entrepreneurs to participate in international trade fair, exhibitions and conference. Successful women in the
field of entrepreneurship have to help other women in starting and sustaining in their business. So women
entrepreneurship should be in the growth of their skill, up gradation managerial skills production and
marketing along with development programmes work health and nutrition women and child welfare etc. The
development of women entrepreneurship is a challenging aspects in Bihar. Rural women entrepreneurs should
be provided with special training facilities for developing their talents and skills.
Management Guru: Journal of Management Research, May 2020, Vol. VIII _ Issue 0 , ISSN 2319-2429 4
42
Page 43
REFERENCES :-
1. Alagu Pandian and Dr. Jeyaprakash.M (2012), “Growth And Performance Of Women
Entrepreneurship In Bihar” International Journal of Physical and Social Sciences, Volume 2, Issue 6 ,
June, pp- 262-275
2. Arakeri Shanta . V (2001), “ Women Entrepreneurship in Bihar” National Monthly Refereed Journal
Of Research In Arts & Education , Volume NO.1,
3. ISSUE NO.3 pp :1 – 7 Geetha Sulur Nachimuthu and Barani Gunatharan(2012), “Empowering
Women through Entrepreneurship: A study in Tamil Nadu, Bihar” International Journal of Trade,
Economics and Finance , Vol. 3, No. 2, April pp 143-147.
4. Jai parkash (2011) , „„women entrepreneurship in Bihar-problems and prospects‟‟ International
Journal of Multidisciplinary Research Vol.1 Issue 5, September.
5. Nagendra Kumar Jha (2012) , “Development Of Women Entrepreneurship – Challenges And
Opportunities - A Case Study Of Bihar”, Ninth AIMS International Conference on Management ,
January 1-4 , pp 214-222
6. Ray Sarbapriya and Aditya Ray Ishita (2011), “Some aspects of women entrepreneurship in
Bihar” Asian Journal Of Management Research , Volume 2 Issue 1, pp : 1-13
7. Dr. Roshan Lal, Dr. H S Badrinarayan ZENITH (2011), “The Role Of Women Entrepreneurs As A
Change Agent In The Society: A Case Study” International Journal of Business Economics &
Management Research , Vol.1 Issue 1, Oct 2011.
8. Sujata Kumari , Vandana Kaushik and Neeta Lodha(2010), “Problems Faced by Rural Women
Entrepreneurs of Rajasthan” Stud Home Comm Sci, 4(2): 115-119.
9. Syed Ahmed Wajih1, Mohd Imtiaz (2012), “Impact Of Socio-Cultural Values And Its Diffusion On
The Entrepreneurial Performance Of Biharn Middle Class Women Entrepreneur: An Analytical
Study” International Journal of Computing and corporate Research, Volume 2 ,Issue 3 , May.
10. Shruti Lathwal (2011), “Women Entrepreneurs In Bihar” International Journal of Research in IT &
Management , Volume 1, Issue 3 July, pp 115-139
Management Guru: Journal of Management Research, May 2020, Vol. VIII _ Issue 0 , ISSN 2319-2429 4
43
Page 44
Challenges Faced by Womens Entreprenures in Bihar
Dr. Md. Izhar Ali
Faculty of Commerce,
J.P. University, Chapra Abstract
Women is treated as the second citizen or subordinate to men. Though various efforts are being made
to improve the status of women, women folk has not made their maximum use and still remains backward in
Bihar. The Bihari sociological setup has been traditionally a male dominated one. Women are considered as
weaker sex and always to depend on men folk in their family and outside, throughout their life. They are left
with lesser commitments and kept as a dormant force for a quite long time. The Biharn culture made them
only subordinates and executors of the decisions made by other male members in the basic family structure.
The traditional set up is changing in the modern era. The transformation of social fabric of the Biharn society
in terms of increased educational status of women and varied aspirations for better living, necessitated a
change in the life style of Bihari Women.
Key words : Women Population, Traditional, Sociological, Culture, Life Style.
Introduction
Family managed business is also a sort of entrepreneurship in Bihar. Nearly 95 percent firms are
family business in Bihar family business is also played important role in economical development of the
nation. Majority of them are engaged in the un-organized sector like agriculture, agro based industries,
handicrafts, hand loom and cottage base industries. Majority was concentrated in low-paid, low-skilled, low –
technology and low productivity jobs in the rural and unorganized sector. In Bihar women entrepreneurship is
found to be less than men entrepreneurship Any strategy aimed at economic development will be log-sided
with and involving women who constitute half of the population. The policy makers and planners have
become astutely aware of the economic significance of women‟s productive activities and the nature of their
contribution to income generation.
Worker Population Ratio (WPR) : Bihar‟s WPR among women is also the lowest in the country at
4.3%. WPR among men in Bihar is 65.2%. 32% of women in Bihar are who are usually engaged in domestic
duties are willing to accept work at their homes.
The most preferred sectors are for women who are willing to work are: Tailoring (27%), Dairy (19%),
Other (14%), Other Animal Husbandry (14%), Spinning & Weaving (10%), Food Processing (9%), Poultry
(5%), Manufacturer of Wood & Cane Products (1%), Leather Good Manufacturer (1%).
Women’s are under taking entrepreneurship in deferent areas as follows:-
Educated Women Entrepreneurship Uneducated Women Entrepreneurship
1. Eco-friendly technology
2. Bio-technology
3. IT enabled enterprises
4. Event Management
5. Telecommunication
6. Plastic materials
7. Mineral water
1. Sericulture
2. Dairy farming
3. Sheep rearing
4. Commercial floriculture , and plant
nursery management
5. Hand embroidery and Dress Designing
6. Soft toys making
44
Management Guru: Journal of Management Research, May 2020, Vol. VIII _ Issue 0 , ISSN 2319-2429 4
Page 45
8. Herbal & health care
9. Food, fruits & vegetable processing
10. Apparel Sector
11. Soap Industries
12. Pharmacy & Medical
7. Handicrafts manufacturing
8. Food, processing and bakery products
9. Computer –Data entry operator
10. Beauty parlour management
11. Desktop Publishing (DTP)
Regular Employment among Women Workers (2017-18)
Rural Bihar Rural Bihar Urban Bihar Urban Bihar
27.8% 10.5% 63.1% 52.1%
However, the increase in regular employment does not automatically imply better job opportunities
for women. At the all- Bihar level, 71.4% of urban women and 58.5% of rural women held wage work with
no formal contract. Further, almost 50% of women held jobs with no eligibility of paid leave or social security
benefits (IWWAGE 2019). Incidence of informal contracts for women is substantially high in Bihar as well,
although it is lower than what is observed at the all-Bihar level. However, more women workers received
social security benefits in their jobs in Bihar compared to the share of women at the national level (IWWAGE
2019).
In Bihar, average wage earnings among female regular workers is 27% lower than male regular
workers, similar to the national average of 26%. In Haryana, Delhi, and Uttar Pradesh, average wage earnings
among female regular workers is 16%, 15%, and 12% higher than male regular workers, respectively.
Launched in 2016, Government of Bihar‟s landmark affirmative action initiative, formalising 35% reservation
for women in all government jobs has increased public sector hiring of women. Urban Bihar‟s rising
proportion of women in regular employment - 63.1% - may be attributable to this.
There are 1,53,610 women entrepreneur establishments in Bihar. Of these 63,495 have at least one
hired worker, while 90,115 are without any hired workers. These women entrepreneur establishments account
for only 1.91% of total establishment in the state.
The majority women entrepreneur establishments in Bihar are self-financed. Only 5% received
financial assistance from the government, while just 1% borrowed from formal financial institutions.
Donations or Transfers from other agencies (including non-profits) constitute 42% of the financing for women
entrepreneur businesses. Given this, there is ample scope to improve women‟s access to formal financing
methods, through platforms like the Micro nit Development and Refinance Agency (MUDRA), for instance.
Further, addressing gendered barriers like social norms and discriminatory property and inheritance laws is
also crucial.
Issues and Challenges of Women entrepreneurship
women entrepreneurship in Bihar is a journey from poverty to prosperity, total dependence to
equality, agricultural labour to entrepreneurs in industry and in service sectors and finally, as opportunity
entrepreneurs .The women entrepreneurship problems range from mobilizing various resources including
problem of capital, marketing, raw material, sales, labour, technical, competition, new technology, problem of
land ,shed ,water, power ,taxes, lack of family support as well as lack of government support and the like .
The problems faced by the emerging and established by the women entrepreneurship are as follows:
45
Management Guru: Journal of Management Research, May 2020, Vol. VIII _ Issue 0 , ISSN 2319-2429 4
Page 46
1. Raw materials:
A major problem that the women entrepreneurship faces is the procurement of raw materials. The
failure of many entrepreneurial units is due to the inadequacy of raw materials. The prices of raw materials are
quite high.
2. Problem of finance:
Finance is one of the most important problems faced by wom en entrepreneurship. As finance is the
life blood of a business organization and no business organization can function properly in the absence of
adequate funds.
3. Problem of marketing:
One of the major problems faced by entrepreneurship is in the field of marketing. It has not in a
position to get first hand information about the market i.e. information about completion, taste, liking disliking
of consumers. Therefore, it is not able to upgrade the products according to the changing business
environment. As a consequence, the product quality compares UN favorably with the quality of the products
of the large scale industries.
4. Problem of under utilization of capacity:
Most of the entrepreneurship suffering from the problem of under utilization of capacity. Units are
making only 40 to 50 percent use of the installed capacities due to various reasons such as shortage of finance,
raw-materials, power and under-developed markets for the products.
5. Outdated technology:
Most of the entrepreneurship is depend upon old techniques and equipment. These units find it very
difficult to modernize the plant and machinery due to limited capacity and capital. The quality of products and
productivity tend be low in the absence of modern technology and that too at higher cost.
6. Poor project planning
Poor project planning is another problem faced by women entrepreneurship. In the absence of
education and experience, this entrepreneurship does not attach much significance to viability studies.
Inexperienced and incompetent women entrepreneurs
often submit unrealistic feasibility reports and incomplete documents which invariably result in delays in
completing promotional formalities. They cannot afford to avail services of project consultants due to limited
financial resources.
7. Inadequate infrastructure:
Insufficient quality and quantity of transportation, communication and other basic services
particularly in backward areas is another problem. Inadequate infrastructure results in under utilization of
capacity and wastages.Inadequate infrastructures also adversely affect the quality, quantity and production
schedule of the enterprises operating in these areas. Therefore, their functioning will become uneconomical
and unviable.
8. Problem of unskilled:
Women entrepreneurship located in backward area may not have problem of unskilled workers but it
may be exposed to the problem of non-availability of skilled workers. Skilled workers may be reluctant to
work in their areas enterprise may not afford to pay the wages and other facilities demanded by these persons.
46
Management Guru: Journal of Management Research, May 2020, Vol. VIII _ Issue 0 , ISSN 2319-2429 4
Page 47
Unavailability of skilled manpower results in lower productivity, deterioration of quality, increase in
wastages, and rise in other overhead costs and finally adverse impact on the profitability.
9. Managerial problem:
Another serious problem for women entrepreneurship is managerial inadequacies. Modern business
demands vision, knowledge, skill, aptitude and whole hearted devotion. The managerial competence of the
entrepreneur is very important for the success of any venture.
10. Lack of Confidence :
Other problems‟ like society‟s attitude towards woman entrepreneurship, unequal opportunities
between women and women and very important amongst all the „Lack of Confidence‟ in women are also
haunting entrepreneurs.
11. Socio personal problems:
Wrong attitude of the society against women due to lack of proper education and information,
economic backwardness and low risk bearing capacity.
12. Motivational Factor:
Self motivation, Attitude to take up risk and behaviour towards the business society, family support, financial
assistance from public and private Institutions and also environmental suitable for Women to establish
business units.
13. Lack of Education :
In Bihar around 60% of women are still illiterate. Illiteracy is the root cause of socio- economic
problem. Due to the lack of education women are not aware of business, technology and market knowledge.
Also lack of education causes low achievement
motivation among women.
14. Training Facilities :
Training programs are essential to rural and young entrepreneurs .The programs enrich the skill and potential
of women entrepreneurship. Training and skill are essential for the development of entrepreneurship.
15. Other problems :
In addition to above discussed problems, the women entrepreneurship is constrained by a number of
other problems such as trained technicians, technological obsolescence, unorganized nature of operation etc .
Conclusion and Suggestions
The study of women entrepreneurship is significant factor in Bihar owing to the unemployment and
weak economic development of women . Women participation in workforce in the field of non-traditional
sector is key point in economicgrowth of the nation . Central and state government should assist women
entrepreneurs to participate in international trade fair, exhibitions and conference. Successful women in the
field of entrepreneurship have to help other women in starting and sustaining in their business. So women
entrepreneurship should be in the growth of their skill, up gradation managerial skills production and
marketing along with development programmes work health and nutrition women and child welfare etc. The
development of women entrepreneurship is a challenging aspects in Bihar. Rural women entrepreneurs should
be provided with special training facilities for developing their talents and skills.
47
Management Guru: Journal of Management Research, May 2020, Vol. VIII _ Issue 0 , ISSN 2319-2429 4
Page 48
REFERENCES :-
1. Alagu Pandian and Dr. Jeyaprakash.M (2012), “Growth And Performance Of Women
Entrepreneurship In Bihar” International Journal of Physical and Social Sciences, Volume 2, Issue 6 ,
June, pp- 262-275
2. Arakeri Shanta . V (2001), “ Women Entrepreneurship in Bihar” National Monthly Refereed Journal
Of Research In Arts & Education , Volume NO.1,
3. ISSUE NO.3 pp :1 – 7 Geetha Sulur Nachimuthu and Barani Gunatharan(2012), “Empowering
Women through Entrepreneurship: A study in Tamil Nadu, Bihar” International Journal of Trade,
Economics and Finance , Vol. 3, No. 2, April pp 143-147.
4. Jai parkash (2011) , „„women entrepreneurship in Bihar-problems and prospects‟‟ International
Journal of Multidisciplinary Research Vol.1 Issue 5, September.
5. Nagendra Kumar Jha (2012) , “Development Of Women Entrepreneurship – Challenges And
Opportunities - A Case Study Of Bihar”, Ninth AIMS International Conference on Management ,
January 1-4 , pp 214-222
6. Ray Sarbapriya and Aditya Ray Ishita (2011), “Some aspects of women entrepreneurship in
Bihar” Asian Journal Of Management Research , Volume 2 Issue 1, pp : 1-13
7. Dr. Roshan Lal, Dr. H S Badrinarayan ZENITH (2011), “The Role Of Women Entrepreneurs As A
Change Agent In The Society: A Case Study” International Journal of Business Economics &
Management Research , Vol.1 Issue 1, Oct 2011.
8. Sujata Kumari , Vandana Kaushik and Neeta Lodha(2010), “Problems Faced by Rural Women
Entrepreneurs of Rajasthan” Stud Home Comm Sci, 4(2): 115-119.
9. Syed Ahmed Wajih1, Mohd Imtiaz (2012), “Impact Of Socio-Cultural Values And Its Diffusion On
The Entrepreneurial Performance Of Biharn Middle Class Women Entrepreneur: An Analytical
Study” International Journal of Computing and corporate Research, Volume 2 ,Issue 3 , May.
10. Shruti Lathwal (2011), “Women Entrepreneurs In Bihar” International Journal of Research in IT &
Management , Volume 1, Issue 3 July, pp 115-139
48
Management Guru: Journal of Management Research, May 2020, Vol. VIII _ Issue 0 , ISSN 2319-2429 4
Page 49
Rural Development in India : Issues & Challenges
Nirlesh Kumar Asst. Professor, Deptt. of Sociology,
T.N.B. College, Bhagalpur
T.M. Bhagalpur University, Bhagalpur
Abstract
The Rural development generally refers to the process of improving the quality
of life and economic welfare of people living in relatively isolated and sparsely
populated areas. India is emerging as a major power economy and our cities and urban
centers are beginning to display marks of affluence. Unfortunately our development is
lopsided. The rural hinterlands are not able to march in tandem with urban India.
About 69% of the country's total population continues to live in rural India There is no
trickledown effect. The benefits of economic growth are not percolating to more than
two-thirds of the people. The vital sectors such as agriculture, infrastructure
development, and community and social services, and in rural development as a whole,
our performance is not appreciable. Economic development in any country to a greater
extent depends on rural development and it assists the economy to grow and sustain. In
the rural areas agriculture is the main source of livelihood to the people. There is a
direct relationship between agriculture production, income and the demand for
industrial goods. People living in the rural areas have to struggle to earn wages or are
forced to migrate to urban areas. The migration pattern varies with the region,
opportunities and socio-economic status of the families. The poorest families,
particularly the landless and marginal holders owning poor quality land tend to
migrate with the entire family. Many tribal families migrate to cities as construction
workers and return at the onset of the rains. Such migrations severely affect the quality
of life, due to poor health, lack of education and social pressures leading to erosion of
moral values
Key words : Rural Development, Agriculture, Infrastructure, Landless, Moral Value.
Introduction
Rural development is the backbone for any country's economic development and
its helps the economy to grow and sustain .Rural development is the axis of the
economy involving the labor ethics impacting the potential of business in big way. It is
a popular belief that economic development takes place because of rapid
industrialization. But the industrial development itself cannot take place without
agriculture. Specifically, agriculture contributes to economic development by product
contribution and market contribution. Agricultural sector is the long-term strategy for
the economic development. The agriculture is volatile and fluctuating industry because
it depends on the monsoon and the weather conditions. This sector of development of
Management Guru: Journal of Management Research, May 2020, Vol. VIII _ Issue 0 , ISSN 2319-2429 4
49
Page 50
the economy is important to feed the nation and country though people have become
modernized in the urban sector depending more on non-vegetarian food for their
survival needs. The people in the rural sector are facing the problems of poverty and
exploitation which is impacting the total productivity of the Indian agriculture. The
agriculture is the economic face of any country. It is important for the prosperity and
growth of the country. The aim is to build the country with the development potential
so to give the value of growth to the Indian economy. The demand for the industrial
products will be generated if the industrial production is high Fluctuations in
agricultural output play a key role in the state of the national economy. Rural
consumption of industrial goods is nearly three times that of urban consumption. As a
matter of fact, the current spurt in the rural consumption of durable goods has led to
redefinition consumer demographics itself. Obviously, there is a direct relationship
between agriculture production, income and the demand for industrial goods. Similarly,
performance in agriculture also influences total demand via government savings and
public investments. Agriculture is the main contributor to national income and it is the
primary source of savings and capital formation which influences the economic growth
of any economy. The Indian rural faces the tough conditions of drought and famine
which impact the life of people because are uneducated and they depend on agriculture.
The rural people are facing the problems of undulation and poverty. The people are
unemployed because they lack the skills to take up opportunities in life. If the rural
sector is educated and advanced, it is easier to do business and the development is high.
The economic development and the rural society have a kind of relationship which is
generally interlocked because the issues of the external environment impact the values
of economic development. It is necessary for the government to move in the direction
and rhythm with the society because their sustainability is dependent on the long term
benefits derived from the economic, social and environmental issues connected to rural
basics.
OBJECTIVE OFTHE STUDY:
To analyse the Issues and challenges of rural economy in India.
RESEARCH METHODOLOGY:
The study is theoretical in nature and the required material for the study is
collected through secondary sources like books, journals, reports.
Objectives of Rural Development:
Following are the primary objectives of rural development:
To improve the living standards by providing food, shelter, clothing,
employment and education.
To Increase productivity in rural areas and reduce poverty.
Management Guru: Journal of Management Research, May 2020, Vol. VIII _ Issue 0 , ISSN 2319-2429 4
50
Page 51
To involve people in planning and development through their participation in
decision making and through centralization of administration.
To ensure distributive Justice and equalization of opportunities in the society.
The Issues of the Indian rural economic Environment:
The basic issues of the rural economy are related to the economic environment
and the noneconomic environment. The economies are impacted by the national and the
international environment. The noneconomic environment consists of the socio-
cultural environment, natural demographic physical and the political environment. The
economic elements of the rural environment directly put an impact on the Indian
business market. The business has to understand the needs of the rural environment and
change according to the rural markets so enhance the value to the society. The rural
economic environment is a complicated process because it encompasses the rural
values, ethics and culture. The adaptation of government's values into the rural
environment includes the following elements:
Rural environment as a complex and dynamic strategy.
It involves rural people's satisfaction and loyalty.
Changing attitude of the rural society.
Focusing on continuous people service.
Maintain a constant updating technological changes.
High technological purgation and modernization.
Implement of the people friendly policies.
Assimilation of rural growth and development.
Challenges of the Rural Environment:
The business is facing massive challenges in today's highly competitive market
and to acquire the maximum possible market share in an overcrowded market. The
following are the threats that force the business to design and implement better
solutions and services to the customers.
The nature of competition has become global.
The rate of change is accelerating out of control.
The rural people have been impacted by the changes through the media
The rural economy is expanding.
The internet is transforming the business landscape.
Industry barriers are collapsing enabling major brands to enter new markets of
rural sector through market penetration strategies
Management Guru: Journal of Management Research, May 2020, Vol. VIII _ Issue 0 , ISSN 2319-2429 4
51
Page 52
The Perspectives of the Rural Economic Development:
The Indian rural economic development is an important part of the Indian
economy where the government has to foster growth by providing employment and
business opportunities to the people. The government is in pressure to provide high
quality services in the global environment of high competition. The service providers
on the part of government can design the package to form the value chain which
generally governs the economies of the scale. The basic objectives of the rural
economic development are as follows:
Human Perspective:
The economic development of the rural sector has to look after the individual
needs of the farmers because if he is given attention he will give better products and
enhance the productivity and efficiency of the rural economy
Social Perspective: For every sector of development, the social issues are
important because we are existing in this society which is the web of human
emotions and feelings. The rural people have to be respected, their social and
cultural values are important and the government development policies have to
incorporate the values of the rural society.
Economic Perspective: The society or any economy can only be successful if
the design, implementation and feedback are according to the specific needs of a
particular section of the society. Every policy related to the economic
development requires a unique profit oriented strategy for growth and
sustainability.
National Perspective: government has the national objective for enhancing the
gross domestic product of the country so as to increase the national income of
the country through the rural and urban development.
Global Perspective: The government policy has to focus on the global issues
because now we are connected to the world through the technological up
gradation happening in the world.The economy is liberalized where global
influence cannot be ignored.
The proposed strategy to develop the rural economy:
The aim of economic development is to produce high business potential in the
rural environment. The development can touch all the dimensions of human growth to
generate employment, better opportunities and high potentials for connectivity. The
rural people have to be connected to their resources related to the land through
agricultural development. The sub drivers of economic environment development are
clean and comfortable conditions and healthy perceptions of work ethics.
Management Guru: Journal of Management Research, May 2020, Vol. VIII _ Issue 0 , ISSN 2319-2429 4
52
Page 53
Profits & Growth:
The government has to design polices to simply sell the benefits and growth to
the people in terms of generating options for small scale industrial development.
Availability of revenues and resources:
The economic development can be through the connectivity of the business
needs and resources to the processes in term of man, material and money.
Financial resources:
The government policy has to generate money and investment for the better
growth of the organization. Money is the fluid which pumps the blood of development
to the society to create a better tomorrow.
The role of government in upgrading the rural environment:
The rural economic development involves the integration of cross functional
areas and this delivers critical policies for the change to give sustainable development
to the rural sector. The practice of using better and upgraded policies helps in better
performance so to enhance the overall productivity integrating the various variable of
the rural economic environment. The total economic system is impacted by the forces
of operation in the markets because they connect the people and business. The
government has to understand the needs of the people and provide them the
employment opportunities through project based growth. The government needs to
invest in education so as enhance the empowerment and ability of people.
ROLE OFNGOs AND SHGs:
Voluntary social services have been an integral part of the sociocultural and
religious ethos of our society from ancient times. The objective has been to increase
human capacities by promoting noneconomic factors such as education, health and
nutrition, which in turn would speed up the process of economic development. The role
of NGOs is both co-operative and complementary to the state. The existence of NGOs
assumes importance in the context of rural settings, as living conditions have
deteriorated. State-NGO partnership alone cannot resolve all the socio-economic
problems; hence it has to be in co-ordination with all agents of social change, i.e., the
state, local selfgovernments, the corporate sector, academics and civil society groups.
NGOs can play a significant role in strengthening local selfgovernment by
facilitating interaction and co-operation with state departments and also acting as
catalysts to effectively implement various departmental schemes. The role of
voluntary agencies in the development of rural areas can be to supplement
efforts of government for the upliftment of the poor and needy disseminate
Management Guru: Journal of Management Research, May 2020, Vol. VIII _ Issue 0 , ISSN 2319-2429 4
53
Page 54
information about development schemes and programmes of the government to
rural people; make people aware of the consequences of female feticides and
imbalance in sex ratio; mobilize financial resources from the community; help in
upgradation of skills of rural youths for self-employment opportunities; facilitate
the formation of self-help groups and micro-finance; ensure protection of women
and children's rights and abolish ills of child labour; and, make available
technologies in a simpler form to the rural poor.
SHGs: When individuals, on their own initiative, act in a conglomeration to
meet their individual and common needs with the primary focus on self-reliance,
it can be called a Self Help Group (SHG). The benefits of self-help groups are
based on cooperation rather than competition. They provide benefits of
economies of scale, cost effective alternatives for different financial services,
collective learning, democratic and participatory culture and a firm base and
platform for dialogue and co-operation. SHGs develop from a common binding
force, common need, interest and concern, especially for the rural poor. It is this
common binding force, which makes SHGs function more efficiently. The
effectiveness of SHGs would be considerably enhanced if a symbiosis could be
worked out between them and Panchayati Raj Institutions (PRIs). The key to this
is the integration of SHGs with the democratically elected and empowered
panchayats. There is urgent need to work out a mechanism that will allow the
SHGs and the PRIs to work in coordination and establish a system of supporting
each other's work.
CONCLUSION
The government has realized that they need to put their resources in front to
support a strategic changes happening in the economic environment. The economic
business development is a comprehensive approach which provides seamless
integration of every area of rural society. The economic development touches the life of
people and integrates the people, process and technology, taking advantage of the
revolutionary impact of the internet. The government is facing massive challenges in
today's highly competitive market and strives to acquire the maximum possible
development. The economic development can be successful if the design and
implementation of the government's processes are according to the changes happening
in the environment. The economic development of the rural environment can be by the
government through the establishment, development, maintenance and optimization of
long term mutually valuable relationships between the business and macroeconomic
environmental variables.
Management Guru: Journal of Management Research, May 2020, Vol. VIII _ Issue 0 , ISSN 2319-2429 4
54
Page 55
REFERENCES:
1. Atal Yogesh 1981, `The Call for Indigenization, International Social Science
ournal Vol. XXXIII, No. 1, pp 189-197.
2. India: Human Development Report, National Council for Applied Economic
Research, Oxford University Press, New Delhi, 1999.
3. India Panchayati Raj Report-2001 Volume I & II, National Institute of Rural
Development, Hyderabad, January 2002.
4. Johl, S.S. and Ray, S.K. 2002, Future of Agriculture in Punjab, Centre for
Research in Rural and Industrial Development, Chandigarh.
5. Local Initiative Program in RCH (Final Report), Centre for Research in Rural
and Industrial Development, Chandigarh- July 2002.
6. Malhotra Rashpal: Impact of 73rd Constitutional Amendment on Rural
Industrialization in India: Issues and Policies, paper presented at expert group
seminar on Rural industrialization – Issues and Policies, organized by South
Asia Multi-Disciplinary Advisory Team (SAAT) ILO at Gurgaon (25-26 August
2000)
7. “Manpower Profile”, India Year Book 2001, Institute of Applied Manpower
Research, New Delhi.
8. National Family Health Survey, India 1998-99, Punjab Series, International
Institute for Population Sciences, Mumbai, India
Management Guru: Journal of Management Research, May 2020, Vol. VIII _ Issue 0 , ISSN 2319-2429 4
55
Page 56
Development and Working of Commercial Banks in Khagaria District
Dr. Niru Kumari University Department of Commerce & Business Administration
T.M. Bhagalpur University, Bhagalpur
Abstract
Credit gap is widening indicating banks’ inability to meet day by day rising costs of cultivation. Due to
numerous reasons the bank management lagging behind ideal norm set by the NABARD for recovery
performance. As such immediate attention of the bank management/administration as well as the Government
of Bihar is drawn to this sorry of affairs.
Key words : Credit Gap, Cultivation, Bank Management, Administration
Introduction
Number of branches of Commercial Bank operating in Khagaria district as on 30-07-2006.
The Bank wise and Block wise number of branches of commercial banks operating in Khagaria
district has been presented under table 1
Table 1: Commercial banks operating in Khagaria district
Sl.
No. Name of Bank Khagaria Gogri Prabatti Alloli Chouthem Beldour Total
1 Central bank of India 6 3 - - - 1 10
2 State Bank of India 7 4 - - 3 - 14
3 Union Bank of India - 3 2 - 1 - 6
4 Allahabad Bank - - 2 - - - 2
5 M.K.G.B. (R.R.B.) 4 2 2 6 6 4 24
6 United Commercial Bank 3 1 1 - - - 5
Total Commercial Banks 20 13 7 6 10 5 61
Source: The United Commercial Bank, Lead Bank Office, Khagaria.
The total number of branches of commercial banks in the district as on 31.12.2006 was 61 comprising
of Central banks of India ten branches, State bank of India- 14 branches, Union Bank of India 6 branches,
Allahabad Bank only 2 branches, Munger Kshetriya Gramin Bank (RRB) 24 branches and the united
Commercial bank 5 branches. The RRB played prominent role in financing agriculture as it had highest
number of branches i.e. 24 working in the district followed by the State Bank of India Which had 14 branches.
The third place was occupied by the Central Bank of India which had 10 branches followed by the
Union banks. Bank having 6 branches. The United Commercial Bank and Allahabad Bank had only 5 & 2
branches respectively.
In respect of block wise number of branches of different commercial banks operating in the districts
Khagaria Developing Block occupied top position having highest number of branches i.e., 20 which is about
29.41 per cent of the total number of branches operating in the district. Gogri and Chautham Development
Block ranked second having 13 and 10 branches followed by Allouli 6 branches, Parbatti 7 branches and the
last place was occupied by Thautham Development Block which had only 5 branches.
Management Guru: Journal of Management Research, May 2020, Vol. VIII _ Issue 0 , ISSN 2319-2429 4
56
Page 57
As per national norm in 1985 the national norm of population served by each branch of the commercial
branch in rural sector was 17,000. In table No. 2 the required number of branches actual number of branch
working in each block and short fall in the block wise number of branches as per national norm of population
to be served by each branch has been shown.
Table 2
Khagaria District Branch Expansion Programmee
Particulars Khagaria Allouli Chouthem Beldour Gogri Prabatti Total
Total No. of
Branches
Required
15 11 6 5 9 7 45
Total No. of
Branches
Existing
10 5 6 3 6 4 34
No. of new
Branches
Required
- 3 - 2 3 3 11
Source: The United Commercial Bank Lead Bank Office, Khagaria.
Only two blocks Khagaria and Chautham fulfilled national norm of population to serve by each branch in
rural areas. Three blocks namely Allouli, Gogri and Parbatti had short fall of 3 branches each whereas Beldour
block required only a more branches to fulfill the national norm of branch expansion programme. On an
average the district a whole 45 branches as per national norm but it had only 34 branches in 1984 requiring 11
more branches to meet the national criteria of branch expansion programme. The district attained the objective
of branch expansion programme in 1989-90 and exceeded it in 1997-98 when total number of branches of
commercial banks went upto 37 excluding co-operative banks. The District central co-operative Banks and the
Primer Co-operative had Development taken together had a branches in 1997-98. Thus in respect of branch
expansion programme in the district is fully satisfactory as shown in Table No. 3.
Table No. 3
Block wise Bank wise Number of Branches in 1997-98
Sr.
No.
Name of Block Name of Bank Place
1 Gogri 1. Union Bank of India
2. Union Bank of India
3. State Bank of India
4. State Bank of India
5. Bank of Baroda
6. Munger Regional Rural Bank
7. Munger Regional Rural Bank
8. Munger Regional Rural Bank
9. Munger Regional Rural Bank
10. Khagaria Central Co-operative Bank
11. Land Development Bank
Gogri
Gogri
Gogri
Maheshkhut
Banni
Rampur, Gogri
Maheshkhut
Pasraha
Fudkichak
Gogri
Maheshkhut
Management Guru: Journal of Management Research, May 2020, Vol. VIII _ Issue 0 , ISSN 2319-2429 4
57
Page 58
2 Khagaria 1. UCO Bank
2. UCO Bank
3. UCO Bank
4. Central Bank of India
5. State Bank of India (A.D.B.)
6. State Bank of India
7. State Bank of India (Main Branch)
8. State Bank of India Krishi Bazar, Samiti
9. Munger Regional Rural Bank
10. Munger Regional Rural Bank
11. Munger Regional Rural Bank
12. Munger Regional Rural Bank
13. Munger Regional Rural Bank
14. Munger Regional Rural Bank
15. Land Development Bank
16. Khagaria Central Co-Operative Bank
Khagaria
Rahimpur
Labhgaown
Khagaria
Khagaria
Khagaria
Khagaria
Khagaria
Khagaria
Mathurapur
Marar
Sansarpur
Jalkora
Bela Sisri
Khagaria
Khagaria
3 Allouli 1. Bank of Baroda
2. Munger Regional Rural Bank
3. Munger Regional Rural Bank
4. Munger Regional Rural Bank
5. Munger Regional Rural Bank
6. Munger Regional Rural Bank
7. Khagaria Central Co-Operative Bank
Amba
Allouli
Chatar
Sansi
Haripur
Bahadurpur
Allouli
4 Beldour 1. Union Bank of India
2. Munger Regional Rural Bank
3. Munger Regional Rural Bank
4. Munger Regional Rural Bank
5. Khagaria Central Co-Operative Bank
Pimagara
Beldour
Bela
Usraha
Beldour
5 Chouttam 1. Union Bank of India
2. Munger Regional Rural Bank
3. Munger Regional Rural Bank
4. Munger Regional Rural Bank
5. Khagaria Central Co-Operative Bank
Pirnagara
Beldour
Bela
Usraha
Beldour
6 Mansi 1. State Bank of India
2. Munger Regional Rural Bank
3. Munger Regional Rural Bank
4. Munger Regional Rural Bank
5. Khagaria Central Co-Operative Bank
Mansi
Saidpur
Bahlabazar
Mansi
Mansi
Source: Service Area Approach in Khagaria District Annual Credit Plan,1997-98, p.2.
Management Guru: Journal of Management Research, May 2020, Vol. VIII _ Issue 0 , ISSN 2319-2429 4
58
Page 59
Credit Deposit Ratio
Credit Deposit Ratio (CDR) is the proportion of credit sanctioned and disbursed by banks in their area of
operation to the deposit mobilized in that area during a particular period of time. It is indicative of benefit to
be accrued to the region from its deposit. It is also an indicator or credit absorbing capacity of the region
concerned and the attitude and attachment to the development of the people of the area of operation of banks.
In respect of CDR the situation or rural areas in general and urban areas in particular in Bihar is far from
satisfactory. Commercial banks having urban orientation prefers urban sector to rural sector in extending
development finance. As a result in the urban sector of state’s economy CDR was as high as 70:30 in 1995-96
whereas it was just 40:60 in rural economy in case of commercial banks. Khagaria being an industrially
backward district, virtually no industry district, reveals more dismal situation in respect of CDR. The CDR in
the district has been shown in the following table 4.
Table No. 4
CDR of Commercial Banks in Khagaria District
Year CDR of Commercial Banks Co-Operative Banks
1981-82 20:80 70:30
1982-83 22:78 67:33
1983-84 27:73 60:40
1984-85 30:70 62:38
1989-90 34:66 60:40
1994-95 37:63 60:40
1996-97 40:60 60:40
1997-98 42:58 60:40
Source : Lead Bank, Khagaria.
The Table No. 4 shows two features of commercial banks with regard to credit deposit ratio of
commercial banks:
(i) The CDR is increasing thought at very slow rate. In 1981-82 it as has as 20:80 which increased to
42:58. The low CDR of commercial banks in the district is due to lack of cottage and village
industries here and very low level of modernization of agriculture which impedes the credit
utilization capacity of the area.
(ii) The second feature of the CDR of commercial banks in the district is that in all of the year under
consideration banks. It is due to existence of hesitation incase of commercial banks to finance
agriculturally prominent risky rural sector. Special attention of commercial banks in particular
and that of the Government of Bihar in general is drawn towards this situation.
5.3 Bank-wise Disbursement of farm loan by commercial Banks
The bank wise disbursement of farm credit during 1997-98 has been shown in Table No. 5
Management Guru: Journal of Management Research, May 2020, Vol. VIII _ Issue 0 , ISSN 2319-2429 4
59
Page 60
Table 5
Bank-wise Progress of Advances (Outstanding ) in Khagaria District
Sl.
No.
Name of the Bank 1987 Amount 1988 Amount 31.3.90
Amount
1997-98
Amount
1 UCO Bank (Lead Bank) 76.38 122.00 145.56 58.00
2 State Bank of India 699.00 769.00 813.76 249.00
3 Central Bank of India 177.24 195.00 312.54 64.00
4 Union Bank of India 252.57 262.00 301.44 282.00
5 Allahabad Bank 31.45 54.00 77.89 97.00
6 Munger Kshetriya
Gramin Bank
398.47 449.00 582.50 272.00
7 Bank of Baroda - 2.86 14.20 91.00
TOTAL 16,35.11 1853.86 2247.35 1113.00
Co-operative Credit
8 K.D. Central Bank N.A. N.A. 400.00 400.00
9 Land Development Bank N.A. N.A. 58.20 148.00
TOTAL - - 458.20 548.00
GRAND TOTAL 1635.11 1853.86 27.0 1661.00
(of which non-farm credit -448)
Source : UCO Bank Khagaria Service Area Approach, Annual Credit Plan of Respective Years.
The above table reveals that the State Bank of India played most vital role in creating farm credit
including loans for non-farm sector like cottage industries, transport and business sector in the economy of the
district under study till 31st March 1990. Its share in total rural credit was to the extent of 68.25 per cent in
1987, 36.21 per cent in 1989-90 and 22.03 per cent in 1997-98. It is evident though the amount extended by
the State Bank of India increase in absolute terms. Its percentage share continued to decline. It implies that all
the other banks including co-operative bank increased their contribution to agriculture loans including non-
farm credit to rural sector. The second place was occupied by R.R.R. Munger followed by Union Bank of
India, Central Bank of India, UCO Bank (Lead Bank), Allahabad and the Bank of Baroda.
In 1997-98 in terms of absolute credit granted to farm sector in the district the first place was
occupied by Union Bank of India among commercial bank which extended Rs. 282 lakhs. It has 25.34 per
cent of the total farm credit sanctioned by commercial bank working in the district Munger Kshetriya Gramin
Banks was at the second place by sanctioning farm credit to the tune of Rs. 272 lakhs in 1997-98 which was
34.44 per cent of the total farm credit extended by commercial banks. The State Bank of India come down to
third place in respect of financing agriculture in 1997-98. During the period under consideration its
contribution to agricultural sector was of Rs. 249 lakhs which was 15 per cent of the total farm credit. The
Allahabad Bank stood at 4th place by extending farm credit of Rs. 97 lakhs, followed by Bank of Baroda (Rs.
91 lakhs), the Central Bank of India (Rs. 64 lakhs) and the UCO Bank at the last place (Rs. 58 lakhs) only.
The contribution of the Khagaria District Central Co-operative Bank was of Rs. 400 lakhs and that of
the Land Development Bank of Rs. 58 lakhs in 1990-91 to agricultural credit which were 14.78 per cent and
2.15 per cent respectively. In 1997-98 the share of the Khagaris District Central Co-operative Bank remained
constant as in 1990-91i.e. Rs. 400 lakhs whereas contributions of Land Development Bank increase from Rs.
58.20 per cent in 1990-91 to Rs. 148 lakhs in 1997-98 showing the increase of 39.32 per cent. The share of co-
Management Guru: Journal of Management Research, May 2020, Vol. VIII _ Issue 0 , ISSN 2319-2429 4
60
Page 61
operative credit, both short term and medium term credit extended by the Khagaria District Central Co-
operative Banks and the long term credit extended by the Land Development Bank was significant. The
share of both types of credit taken together in total agriculture credit was 16.94 per cent in 1990-91 and 46.72
per cent in 1997-98. Thus in terms of percentage contribution of co-operative credit to total farm credit in the
district is still significant.
References
1. The United Commercial Bank, Lead Bank Office, Khagaria.
2. Service Area Approach in Khagaria District Annual Credit Plan,1997-98, p.2.
3. Lead Bank, Khagaria.
4. UCO Bank Khagaria Service Area Approach, Annual Credit Plan of Respective Years.
Management Guru: Journal of Management Research, May 2020, Vol. VIII _ Issue 0 , ISSN 2319-2429 4
61
Page 62
Problems related to Agricultural Credit in India
Dr. Rajesh Pathak PG Deptt. of Commerce, J.P. University, Chapra
Abstract
Agricultural credit is considered as one of the most basic inputs for conducting all agricultural development
programmes. In India there is an immense need for proper agricultural credit as Indian farmers are very
poor. From the very beginning the prime source of agricultural credit in India was moneylenders. After
independence the Government adopted the institutional credit approach through various agencies like co-
operatives, commercial banks, regional rural banks etc. to provide adequate credit to farmers, at a cheaper
rate of interest. Moreover, with growing modernisation of agriculture during post-green revolution period the
requirement of agricultural credit has increased further in recent years.
Key words : Agricultural Credit, Input, Agricultural Development, Indian Farmers, Moneylenders.
Introduction
Agricultural credit is considered as one of the most basic inputs for conducting all agricultural development
programmes. In India, there is an immense need for proper agricultural credit as Indian farmers are very poor.
From the very beginning, the prime source of agricultural credit in India was moneylenders.
After independence, the Government adopted the institutional credit approach through various agencies like
co-operatives, commercial banks, regional rural banks etc. to provide adequate credit to farmers, at a cheaper
rate of interest. Moreover, with growing modernisation of agriculture during the post-green revolution period,
the requirement of agricultural credit has increased further in recent years.
Types of agricultural credit
Considering the period and purpose of the credit requirement of the farmers of the country,
agricultural credit in India can be classified into three major types
Short term credit: The Indian farmers require credit to meet their short term needs viz., purchasing
seeds, fertilizers, paying wages to hired workers etc. for a period of less than 15 months. Such loans
are generally repaid after harvest.
Medium-term credit: This type of credit includes credit requirement of farmers for a medium period
ranging between 15 months and 5 years and it is required for purchasing cattle, pumping sets, other
agricultural implements etc. Medium-term credits are normally larger in size than short term credit.
Long term credit: Farmers also require finance for a long period of more than 5 years just for the
purpose of buying additional land or for making any permanent improvement on land like the sinking
of wells, reclamation of land, horticulture etc. Thus, the long term credit requires sufficient time for
the repayment of such loan.
Sources of agriculture credit
Apart from the moneylenders, cooperative credit sources and the government, nowadays, the long term and
short term credit needs of institutions are also being met by National Bank for Agricultural and Rural
Development (NABARD).
Sources of agricultural credit can be broadly classified into institutional and non-institutional sources. Non-
Institutional sources include moneylenders, traders and commission agents, relatives and landlords, but
institutional sources include co-operatives, commercial banks including the SBI Group, RBI and NABARD.
Management Guru: Journal of Management Research, May 2020, Vol. VIII _ Issue 0 , ISSN 2319-2429 4
62
Page 63
Commercial banks
In the initial period, the commercial banks of our country have played a marginal role in advancing rural
credit. With the help of “village adoption scheme” and service area approach the commercial banks started to
meet the credit and other requirements of the farmers. They also sponsored various regional rural banks for
extending credit to small and marginal farmers and rural artisans just to save them from the clutches of village
moneylenders.
Commercial banks are finding difficulty in advancing loans to the farmers particularly in respect of lending
techniques, security, recovery etc. and are expected to overcome these gradually. But the commercial banks
are not very much interested to advance loan to small and marginal farmers.
Government:
Another important source of agricultural credit is the Government of our country. These loans are known as
taccavi loans and are lend by the Government during emergency or distress like famine, flood etc. The rate of
interest charged against such loan is as low as 6 per cent. During 1990-91, the state Governments had
advanced nearly Rs 350 crore as a short-term loan to agriculture. But the taccavi loan failed to become very
much popular due to official red-tapism and corruption.
Credit facility to farmers:
Kissan credit card: The Kissan Credit Card (KCC) scheme was launched in 1998 with the aim of providing
short-term formal credit to farmers. Owner cultivators, as well as tenant farmers, can avail loans to meet their
agricultural needs under this scheme at attractive rates of interest. The government has also simplified the
application process to increase interest among farmers. Repayment is also simplified and dependent on the
harvesting season, reducing the farmers’ debt burden.
Investment loan: Loan facility to the farmers is available for investment purposes in the areas viz. Irrigation,
Agricultural Mechanization, Land Development, Plantation, Horticulture and Post-Harvest Management.
Interest subvention scheme: The interest subvention scheme for farmers aims at providing short term credit
to farmers at the subsidised interest rate. The policy came into force with effect from Kharif 2006-07. The
scheme is being implemented for the year 2018-19 and 2019-20.
The interest subvention will be given to Public Sector Banks (PSBs), Private Sector Banks, Cooperative
Banks and Regional Rural Banks (RRBs) on use of own funds and to NABARD for refinancing to RRBs and
Cooperative Banks.
The Interest Subvention Scheme is being implemented by NABARD and RBI.
Problems regarding Agricultural credit in India
Insufficiency: In spite of the expansion of rural credit structure, the volume of rural credit in the
country is still insufficient as compared to its growing requirement arising out of the increase in prices
of agricultural inputs.
Inadequate amount of sanction: The amount of loan sanctioned to the farmers by the agencies is
also very much inadequate for meeting their different aspects of agricultural operations. Considering
the amount of loan sanctioned as inadequate and insignificant, the farmers often divert such loan for
unproductive purposes and thereby dilute the very purpose of such loan.
Lesser attention of poor farmers: Rural credit agencies and its schemes have failed to meet the
needs of the small and marginal farmers. Thus, lesser attention has been given on the credit needs of
the needy farmers whereas the comparatively well-to-do farmers are getting more attention from the
credit agencies for their better creditworthiness.
Inadequate institutional coverage: In India, the institutional credit arrangement continues to be
inadequate as compared to its growing needs. The development of co-operative credit institutions like
Primary agricultural credit societies, land development banks, commercial banks and regional rural
banks, have failed to cover the entire rural farmers of the country.
Management Guru: Journal of Management Research, May 2020, Vol. VIII _ Issue 0 , ISSN 2319-2429 4
63
Page 64
Red tapism: Institutional agricultural-credit is subjected to red-tapism. Credit institutions are still
adopting cumbersome rules and formalities for advancing loan to farmers which ultimately force the
farmers to depend more on costly non-institutional sources of credit.
Solutions
To monitor the taccavi loan offered by the Government in a serious manner.
Co-operative credit societies should be organised to make it efficient and purposeful for delivering the
best in terms of rural credit. Moreover, these societies may be transformed into a multi-purpose
society with sufficient funding capacity.
Middlemen existing between credit agencies and borrowers should be eliminated.
Reserve Bank of India should arrange sufficient fund so that long term loans can be advanced to the
farmers.
Power and activities of the Mahajans and moneylenders should be checked so as to declare an end to
the exploitation of farmers.
The banks should adopt procedural simplification for credit delivery through rationalisation of its
working pattern.
In order to check the fraud practices adopted by the farmer, for getting loans from different agencies
by showing same tangible security, a credit card should be issued against each farmer which will
show the details about the loans taken by them from different agencies.
Credit should also monitor the actual utilisation of loans by developing an effective supervisory
mechanism.
Management Guru: Journal of Management Research, May 2020, Vol. VIII _ Issue 0 , ISSN 2319-2429 4
64
References
1. Chari, T.S.K. – Cooperative Banking at Cross Road, New Delhi, 1976
2. Choubey, B.N. – Agricultural Banking in India, New Delhi, 1983
3. Choubey, B.N. – Institutional Finance and Agricultural Development, Pune 1977.
4. Desai, S.S.M. – Rural Banking in India, Bombay, 1983
5. Dubhashi, P.R. – Principales and Philosophy of Cooperation, Poona, 1970
6. Gadgil, D.R. – Cooperation and National Development, New Delhi, 1971
7. Ghosal, SN. – Agriculture Finance in India, Bombay, 1972.
Page 65
Performance of LIC of India
Sachin Raj
Research Scholoar (Faculty of Commerce)
J. P. University, Chapra
Abstract
The insurance industry has undergone a drastic change since liberalization, privatization and
globalization of the Indian economy in general and the insurance sector in particular. For almost four
decades LIC has been sole player with virtual monopoly in the life insurance sector. The entry of so many
companies in this sector was likely to affect the performance of Life Insurance Corporation. Thus the LIC
public sector giant, which never faced competition earlier, now has to compete with the private players who
boast of the rich and long experience of their partners from the developed countries of the world. It becomes
imperative at this instance to appraise the performance of Life Insurance Corporation of India, succeeding
sectoral reforms. And for evaluating the performance of LIC in progression, key determinants are identified
and listed.
Keywords : Insurance Industry, Libberalization, Privatization, Globalization, Indian Enconomy, LIC.
Introduction
The setting up of the Insurance Regulatory and Development Authority (IRDA) was a clear signal of
the end of the monopoly in the insurance sector. It has become imperative for LIC to face the competition
posed by the entry of new private players. If under this pressure, Life Insurance Corporation of India improves
its performance, the whole economy will be benefited. The insurance industry has undergone a drastic change
since liberalization, privatization and globalization of the Indian economy in general and the insurance sector
in particular. For almost four decades LIC has been sole player with virtual monopoly in the life insurance
sector. The entry of so many companies in this sector was likely to affect the performance of Life Insurance
Corporation. Thus the LIC public sector giant, which never faced competition earlier, now has to compete
with the private players who boast of the rich and long experience of their partners from the developed
countries of the world. It becomes imperative at this instance to appraise the performance of Life Insurance
Corporation of India, succeeding sectoral reforms. And for evaluating the performance of LIC in progression,
key determinants are identified and listed. The present paper is an attempt to examine the performance of LIC
of India in this competitive age.
The LIC was founded in 1956 when the Parliament of India passed the Life Insurance of India Act
that nationalized the private insurance industry in India. Over 245 insurance companies and provident
societies were merged to create the state owned Life Insurance Corporation. LIC's slogan is sanskrit
"yogakshemam vahamyaham" which translates in english as "Your welfare is our responsibility". This is
derived from the Ancient Hindu text, the Bhagavad Gita's 9th Chapter, 22nd verse. The slogan can be seen in
the logo, written in Devanagiri script.
REVIEW OF THE LITERATURE
1. Mishra, K.C. and Simita Mishra (2000) in their article on “Insurance Industry: Recipe for a Learning
Organization” say that like any other industry, insurance industry in India suffers from one challenge
repeatable a hundred times, that is the constraints of infrastructure.
2. Balasubramanian, T.S. and Gupta, S.P. (2000) in their book on “Insurance Business Environment” explain
at length the global and Indian pictures of Insurance systems. The impact of globalization and also
liberalization on Insurance business environment is also discussed analytically to have a clear understanding
of the challenges faced by the insurance industry.
Management Guru: Journal of Management Research, May 2020, Vol. VIII _ Issue 0 , ISSN 2319-2429 4
65
Page 66
3. Mitra Debabrata (2000) in the thesis entitled “Employees and the PSU: A Study of their Relationship with
Special reference to Jalpaiguri Division of the Life Insurance Corporation of India” opines that the State-
owned Undertakings provide all sorts of facilities and amenities to employees along with usual emoluments.
But, their productive rate is low when compared it with the private sector undertakings. In the Jalpaiguri
Division, the employee relationship with the LIC is clearly discussed and some suggestions are also given in
the thesis.
4. Wadikar Ashok Laxaman (2001) in his thesis on “Innovativeness in the Insurance Industries”, Ph.D. Thesis
submitted to the Department of Management, University of Pune, Pune, 2001. Confirms a general opinion that
innovativeness in every activity alone rules and dominates the industry. But, at the same time, the practicality
and economic justification of that innovativeness are also to be analysed.
5. BalachandWran, S. (2001) in his book on “Customer Driven Services Management” concludes that the
insurance industry is fast growing and mostly becoming a customer driven and customer centric one. He also
advocates that when the insurance products are attractive to the customers, then only the insurance industry
flourishes in the market and serves its purpose of profit earning and also income generation.
6. Srivastava, D.C. and Srivastava, S. (2001) in their book on “Indian Insurance Industry–Transition and
Prospects” discuss analytically the financial significance of insurance industry, its contribution to Indian
economy and alsothe transitory prospects and challenges of insurance industry due to liberalization and the
opening up of the sector to private players.
7. Mark S. Dorfman (2002) in his book on “Introduction to Risk Management and Insurance” reviews the
salient features of the insurance industry and also the role played by the private enterprise. The different types
of insurance intermediaries are also discussed at length with suitable illustrations incorporated wherever
necessary.
8. Charles P Jones (2002) in his book on “Investment Analysis and Management” explains clearly about the
framework for evaluating portfolio performance through return and risk considerations. The Risk-Adjusted
measures of performance and also the problems associated with Portfolio Measurement are also discussed.
9. Ajay Mahal (2002) in his article on “Assessing Private Health Insurance in India–Potential Impacts and
Regulatory Issues” asserts that the entry of private health insurance companies in India is likely to have an
impact on the costs of health care, equity in the financing of care and the quality and cost-effectiveness of
such care. However, he mentions that an informed consumer and a well-implemented insurance regulation
regime in many cases eliminate some of the bad outcomes.
10. Dan Segal Leonard N. Stern School of Business New York University “An Economic Analysis of Life
Insurance Company Expenses” has analysed the expenses of the Life Insurance Companies.
DATA ANALYSIS
Life Insurance Corporation (LIC) is doing business of Insurance in India since 1961. By providing
insurance, as such it tries to secure the human life value and there by adds further security to the person
having insurance policy. As mentioned earlier that as per the type and nature of the data available researcher
has analyzed major five components of the expenses of the sampled unit. All Expenses are analyzed through
statistical measures. This chapter goes further, and Descriptive Analysis has been being carried out. The
following table shows the major five variables which are taken for the analysis.
Management Guru: Journal of Management Research, May 2020, Vol. VIII _ Issue 0 , ISSN 2319-2429 4
66
Page 67
Components of Expenses (Table N0. 1)
Source: Secondary Data
The above table shows the performance of claims paid. Table also indicates that base year (2005-06)
amount of claims paid, and in the same line calculated percentages of five years during the period of the study.
The highest percentage was in the year 2009 – 10. The lowest percentage was in the year 2006 – 07, depicts
that year by year amount paid by Way of claims get increased. All other components Commission paid,
Operating Expenses, Investments 1 (Shareholders’), and Investments (Policyholders’) showing upward trend.
SUGGESTION
The overall performance evaluation of Life Insurance Corporation of India is consistent. The working
groups have been worked hard for their functions but still some drawbacks are left behind, for that suggestions
are as under:
1. LIC should try to increase their selling of plans to introduce new plans with different kinds of facilities,
so that it can increase its income amount, especially Premium amount.
2. As private insurance companies capture the market now a day, therefore, LIC should strengthen their
working & should launch plans with more facilities.
3. The Corporation should strive to increase its business by issuing more and more policies in order to
retain its market share in the competitive scenario.
4. Operating cost as compared to premium underwritten should be controlled.
5. A comparative statement of performance between LIC and various insurance companies may help
increase the business
6. A comparative statement of performance of operating expenses of LIC and various insurance companies
may help to narrow down the cost.
7. LIC of India should continue making investments, but secured investments should be made.
8. LIC need to find out which attribute of the operating expenses need to be controlled.
CONCLUSION
LIC has been successfully able to create value for its policyholders. The performance evaluation
shows consistent increase in its business. During the period of the study there is no major change in the
performance of the LIC. So it clarifies that the performance is unchanged and LIC has maintained the market
value of their products. After introduction of IRDA (Insurance Regulatory & Development Authority), LIC
has become more conscious for their products. As private players are coming up now a day, competition is
increasing and LIC has made efforts to continue its business. Apart from this, LIC need to control the
investment level. As above table also reflects that the investment (Policy holders’) has this second highest
variance, so investment (policyholders’) also need to reduce. Researcher has evaluated the various
components of expenses with scientific methodology to justify the performance; so to conclude, LIC is doing
good job, managing the products, and related marketing strategies effectively. But as per analysed data we can
say that LIC need to control the Operating Expenses, to not affect its income. LIC is pioneer institute in Indian
Management Guru: Journal of Management Research, May 2020, Vol. VIII _ Issue 0 , ISSN 2319-2429 4
67
Page 68
economy; so after IRDA and privatization of insurance sector, the way of achieving the effective result is not
smooth task, but LIC has to work.
“The woods are lovely dark and deep, but LIC has to keep promises and miles to go before it sleeps”.
References :-
1. Agarwal Raj, Business Environment, Excel Books, New Delhi, Second Edition – 2002.
2. Agrawal Raj & Diwan, Parag, Business Environment, First Edition, Excel Books, Delhi-2000.
3. Bhole L. M., Financial Institutions & Markets, Tata Mc Graw – Hill Limited, New Delhi, Third
Edition, 2003.
4. Bodla B. S., Garg M. C., Singh K. P., Insurance – Fundamentals, Environment & Procedures, Deep &
Deep Publications Pvt. Ltd., Rajouri Garden, New Delhi, First Edition – 2003.
5. Chidambaram K. & Alagappan V., Business Environment, Vikas Publishing House Pvt. Ltd., New
Delhi, 1999.
6. Colinvaux Raoul, The Law of Insurance, Sweet & Maxwell Ltd., London, 1979, Fourth Edition.
7. Crawford M. L., Life & Health Insurance Law, Mc Graw Hill, Irwin, 1998.
8. Mathew M. J., Insurance Theory & Practice, RBSA Publisher, SMS Highway, Jaipur (India), First
Edition 1998
9. Ready Reckoner – LIC’s Book – January 1998, Anand Publications, Himmat Nagar.
10. Manual for Agents – January 2003, Sixteenth Edition, published by LIC of India, Mumbai.
11. Yogakshema Vahamyaham – LIC of India, Western Zone, Mum.
Management Guru: Journal of Management Research, May 2020, Vol. VIII _ Issue 0 , ISSN 2319-2429 4
68
Page 69
A Study on Women Entreprenures in India
Sapana Kumari
Research Scholar (Faculty of Commerce),
J.P. University, Chapra
Abstract
Women in the 20th century have taken a long stride in our country with respect to their freedom and
autonomy in many avenues, supported by government by providing liberal & equal opportunities and facilities
in the field of education, employability as labour force, conducive and healthy participation in democratic
political system and their socio-economic development. The Government in India has played a key role by
implementing such policies which emphasized mainly on eliminating the handicaps which women often faced,
to strengthen their bargaining capacity, to educate them and to enhance awareness among them about their
legitimate rights, to broaden their avenues of employability, to provide them a very conducive working
environment with fair wages, to ensure their participation in social and political system of the country, to
polish their untapped skills and personality; and to ensure them respect and social acceptability in every
sphere. The ultimate goal of the government has been to build a very strong.
Key words : Women, Working Environment, Untapped Skills, Personality, Government, Goal.
Introduction
Entrepreneurship is a relatively new concept in many developing and transition economies. However,
women in these economies have started playing an important role by venturing into new innovative
businesses. The emergence of women entrepreneurs and their contribution to the national economy is quite
visible in India. The number of women entrepreneurs has grown over a period of time, especially in the
1990s. Women entrepreneurs have demonstrated their potential, but still the fact remains that they are capable
of contributing much more than what they already are. Women entrepreneurship has been recognized during
the last decade as an important untapped source of economic growth. They are playing an increasingly
important role in promoting growth and development. Women are changing the face of modern business.
They are in the forefront of the service sector, the fastest growing sector of the economy. They have instituted
innovative systems and schedules.
THE ENTREPRENEURSHIP ‘PYRAMID’ IN INDIA:
On the basis of sectors and numbers of people engaged into entrepreneurial activities in India,
National Knowledge Commission (2008) has illustrated an Entrepreneurship ‘Pyramid’, which provides an
understanding of the type of sectors in which entrepreneurship takes place in India. The structure of the
“Entrepreneurship Pyramid” is illustrated below-
1. Level (1) : Agriculture and other activities: Crop production, Plantation, Forestry, Livestock, Fishing,
Mining and Quarrying.
2. Level (2) : Trading services: Wholesale and retail trade; Hotels and Restaurants.
3. Level (3) : Old economy or traditional sectors: Manufacturing, Electricity, Gas and Water supply.
4. Level (4) : Emerging sectors (including knowledge intensive sectors): IT, Finance, Insurance and
Business services, Construction, Community, Social & Personal Services, Supply Chain,
Transport-Storage-Communications etc.
Management Guru: Journal of Management Research, May 2020, Vol. VIII _ Issue 0 , ISSN 2319-2429 4
69
Page 70
Source: National Knowledge Commission (2008) on Entrepreneurship
Levels 2 and 3 represent Trading and Manufacturing activities, primarily the traditional areas of
Entrepreneurship. Around 41% of all existing enterprises in India fall under Level 2 and 18% are engaged in
activities falling under Level 3. Level 4 in the pyramid belongs to rather emerging/modern sectors of
Entrepreneurship with rising growth rates. In context to the global perspective, it is expected that in future
Levels 3 and Level 4 of pyramid may broaden by virtue of activities migrating from Levels 1 and Level 2.
Such trends are already being seen with emergence of new companies over the past few years. The growth of
companies in Level 4 is much faster as compared to those in the other levels. It is also important to note that
majority of enterprises in Levels 1 and 2 do not register themselves as companies and instead function largely
as self-employed entities.
ENTREPRENEURIAL VENTURES AMONG WOMEN IN INDIA:
The advent of industrialization, urbanization, growth of educational level, introduction of professional
education and a rise in the awareness of democratic values has brought about changes in the thought process
of an Indian woman. The Indian society is undergoing change and now women are found venturing into more
and more entrepreneurial activities. These changes are a result of the change in the thinking of the women,
who are confident of handling both, the work and household front simultaneously with considerable
satisfaction.
The share of women entrepreneurs is virtually rising in all the sectors. All these aspects pose a big
challenge to Indian women. Only a small segment of the privileged population is able to set up and sustain the
enterprise on their own. In country like India, where social inequality is quite prominent, it serves as a biggest
hurdle for women to venture and sustain into entrepreneurship.
The women entrepreneurs of the West are free to take up an activity of their choice like, electronics,
engineering, construction etc. which are considered as male dominated in India. The traditional and cultural
upbringing of the Indian women makes them indulge in activities which are low budget and low cost items.
The fields where the Indian women generally venture are food items (pickles, papads etc.), embroidery,
handicrafts, lunch packages, crèches, florist shops, tutorials, managing girls‟ hostels etc. There have been
innumerable examples of successful women entrepreneurs in the small and medium size companies. Now, this
Management Guru: Journal of Management Research, May 2020, Vol. VIII _ Issue 0 , ISSN 2319-2429 4
70
Page 71
does not mean that the Indian women entrepreneurs lack talent or confidence. Their main drawback is lack of
family encouragement and conducive environment to take up challenges on a large scale.
Women entrepreneurial activities can be seen in various sectors from trade and services, to tailoring,
beauty parlours, printing, crèches etc. Their contribution can also be seen in running of family businesses
mostly in the form of unpaid labour and skills. At places, enterprises run by women (in which women have a
major share) are run and governed by men in their name. The main decision making authority and the
operations are controlled by men. Programmes meant for women can be successful only when there is a
change in the thought process of the society and their attitudes encourage the involvement of women folk in
the real meaning, right from risk bearing to decision making.
The spread of education and awareness has motivated the women to shift from the kitchen activities,
handicrafts and cottage industries to the non-traditional higher level activities. The new industrial policy
which was introduced by the Indian Government also laid emphasis on conducting special training programs
related to entrepreneurial ventures, which might help women to start their own enterprise.
Financial institutions and Banks have also set up special cells in which they give entrepreneurial
guidance to women and this effort is gradually escalating the percentage of the women entrepreneurs in India.
It is really praiseworthy that co-operatives have been created that have encouraged women to seek self-
reliance and economic freedom. There are associations like the Federation of Indian Women Entrepreneurs
who have helped women to become successful entrepreneurs and be empowered economically. Spread of
education and the need to earn has also made the women to move out and work whether it is an
entrepreneurial activity or some wage/salary based career.
The growth of Women Entrepreneurs over the last few decades is increasing at a regular pace. We can
understand many causes which have ushered the women of India to take a step forward and enter into the field
of entrepreneurship. An important category of women who step into the entrepreneurial field can be termed as
affluent. These females belong to the rich business families, who have all the support of their family members
as far as finances and other resources are concerned. They are also ready to take up any kind of risk involved.
These enterprises are in the form of beauty parlours, restaurants, book publishing, printing, film distribution,
interior decoration etc., just to name a few. Their family support is there to share the responsibility and
moreover, their livelihood is not dependent on these enterprises.
Another category of entrepreneurial women belong to the middle class, who are not only educated but
also want to take up something challenging whether they have experience in that particular field or not.
Besides taking up a challenge these women want to do something new and be economically independent.
They start up medium sized ventures where the risk factor is low and are ready to take loans from banks and
other sources. Their ventures include service centers, play schools, beauty parlours, food catering, event
management, grocery shops etc. The women belonging to the low income group are forced to enter into
entrepreneurial ventures in order to sustain themselves.
Single women and widows form another category of entrepreneurs who are forced by circumstances to take
up an entrepreneurial venture in order to support their family and overcome the financial difficulties. They
need to take up the family business or start something new in order to improve their family condition.
Although, the number of such women entrepreneurs is quite small.
Women entrepreneurs in the rural category develop something according to their resources and technical
know-how. In this group we can find dairy produce, pickles, fruit juices, papads and jaggery (gur) making.
The rural women venture usually in those fields where limited transport, monetary transactions, minimum risk
factor and least organizing skills are required.
Management Guru: Journal of Management Research, May 2020, Vol. VIII _ Issue 0 , ISSN 2319-2429 4
71
Page 72
Last, but not the least is the category of those self-employed women who belong to the very poor
group of the society and have to depend on their own efforts for a livelihood. Fruit and vegetable vendors,
brooms making, knitting, tailoring, fisheries etc. are some of the jobs done by such women.
All the above mentioned categories point out to the fact that the main reason for women entrepreneurs
to step out in the entrepreneurial activities is for their sustenance and very few are there to take up challenges.
Whereas, now with the advent of increase in literacy rate and self-recognition by the women folk, more and
more educated females are stepping forward to take up challenges and make a place for themselves in the man
dominated entrepreneurial world.
If we go back in history, it is quite evident that women have been the best managers of household and
kitchen. This impact has been so deep-rooted that the general assumption of people is that they can be good
entrepreneurs in the making of pickles, papads, masalas etc. This misconception is easily broken by the
entrepreneurial women of today who have successfully ventured into the non-traditional fields. They have
shown their capabilities in excellent decision-making and are not only flourishing as successful business
woman but have also proven the age old myths wrong. They can be seen as excellent consultants, machinery
exporters, producers of electric machinery, garment manufacturers, interior decorators etc.
The arrival of the women folk in the entrepreneurial world and their achievements thereafter prove to
be commendable after the number of hurdles they cross in order to establish their enterprise. Establishing their
enterprise means that the women are economically free which is much more important than political freedom.
A woman who is not economically free has to be dependent on someone or the other, and dependents are
never free. These were the ideas of our first prime minister, Pandit Jawaharlal Nehru, who always highlighted
the importance of women independence. “When women move forward, the families move, the village
moves.” These words are of Pandit Jawaharlal Nehru who was a believer that if women are in the mainstream
of progress only then any social and economic development can be considered to be meaningful (Poornima
Charantimath, 2009)
The women- owned enterprises are thus contributing significantly towards the economy of our
country. This contribution is ready to grow in the future years. The decades of 1990s and thereafter have seen
a rapid increase in the number of the women entrepreneurs. The new generation of women entrepreneurs is all
set to seek capital for their enterprise, use modern technology and find a place for themselves in both domestic
and foreign markets. Here, it is important that as today‟s women entrepreneur possesses talent and potential
and are an important source to the Indian economy, they should be encouraged by formulating strategies to
support, sustain and direct their efforts in a fruitful direction for nation building.
In the recent past, Indian economy has grown with more than 8%, it thus requires a very constructive
contribution of all sections of society, especially women to sustain the economy and to ensure participatory
growth in the country. Women of our country have to play the role of equal partners in development process.
In order to achieve these landmarks, the Government has to take some deliberate policy steps, which are
critical to achieve gender equality and women empowerment.
Women through entrepreneurial activities are able to support their family financially and improve
their standard of living. The emergence of women as entrepreneurs is a significant development for securing
them a place in the society. This proves to be an important contribution to their household economy and thus
to their development in gaining confidence, decision-making experience and an enhanced control over their
lives.
Management Guru: Journal of Management Research, May 2020, Vol. VIII _ Issue 0 , ISSN 2319-2429 4
72
Page 73
REFERENCES
1. Baudeau, N. (1910), Premiere introduction a la philosophie economique, Dubois, A. (ed.). Paris: P.
Geuthner. ([Originally 1767).
2. Brenner, O.C., Pringle, C.D. & Greenhaus, J.H. (1991), “Perceived fulfillment of organizational
employment versus entrepreneurship: Work values and career intentions of business college
graduates”. Journal of Small Business Management, 29(3): 62–73.
3. Colleen De Baise (2005), “Women Business Owners Form Zenith,” Wall Street Journal, June 1, 2005,
p. B-5A; “Women-Owned Businesses in the United States, 2002: A Fact Sheet,” Center for Women‟s
Business Research, 2002,
4. Goffee, R. & Scase, R. (1985), “Women in charge: The experiences of female entrepreneurs”,
London: George Allen & Unwin.
5. Hannah Orwa Bula (2012), “Evolution and Theories of Entrepreneurship: A Critical Review on the
Kenyan Perspective”, International Journal of Business and Commerce, Vol. 1, No.11: Jul 2012.
6. Kamal Nath (2007), “India’s Century: The Age of Entrepreneurship in the World’s Biggest
Democracy’, 2007, page 3-5 where he extols Jugaad as „innovation…a survival tool for Indians,
where every obstacle became an opportunity
7. Konrad, A.M. & Cannings, K. (1997), “The effects of gender role congruence and statistical
discrimination on managerial advancement”, Human Relations, 50(10): 305–329.
8. Schumpeter, J. A. (1934), The Theory of Economic Development, translated by R. Opie from the 2nd
German edition [1926]. Cambridge: Harvard University Press.
9. Smith, A. (1976), “An Inquiry into the Nature and Causes of the Wealth of Nations”, Campbell, R. A.
and A. S. Skinner (eds.). Oxford: Oxford University Press. [Original 1776].
10. Turgot, A. R. J. (1977), The Economics of A. R. J. Turgot, edited and translated by P. D.
Groenewegen. The Hague: Martinus Nijhoff.
Management Guru: Journal of Management Research, May 2020, Vol. VIII _ Issue 0 , ISSN 2319-2429 4
73
Page 74
Role of Cooperative Banks in Motihari (East Champaran)
Dr. Santosh Kumar University Department of Commerce & Business Administration
T.M. Bhagalpur University, Bhagalpur
Abstract
Cooperative Banks occupy an important place in rural economy. They provide working capital to farmers and
rural Artisans. It is a well known fact that farmers and rural artisans, in general, have meager resources to
finance their business activities. This was the reason that they had long been exploited by the village money-
lenders. It was to free them from the clutches of village money lenders that cooperative credit institutions
came into existence in almost all countries having pre dominantly rural base In our country also.
Key words : Cooperative Banks, Rural Economy, Working Capital, Farmers, Rural Artisans.
Introduction
Cooperative Banks occupy an important place in rural economy. They provide working capital to farmers and
rural Artisans. It is a well known fact that farmers and rural artisans, in general, have meager resources to
finance their business activities. This was the reason that they had long been exploited by the village money-
lenders. It was to free them from the clutches of village money lenders that cooperative credit institutions
came into existence in almost all countries having pre dominantly rural base In our country also. Cooperative
Banking structure emerged on the pattern of German Raffelsiens banks. Though the cooperative credit
movement in our country emerged as an outcome of the public initiative, it started growing. at a rapid rate
only after receiving government patronage. Immediately after granting or legal status to co-operative credit
institutions through the enactment of All India Act in 1904, a Registrar of Cooperative Credit Societies was
appointed in each provice (now State), to guide and supervise the movement. This is regarded as the real
beginning of cooperative credit movement in India. However, the Co-operative Credit structure now existing
in our country got its present shape only after publication of the report of movement. This is regarded as the
real beginning of cooperative credit movement in India. However, the Co-operative Credit structure now
existing in our country got its present shape only after publication of the report of Maclagan Committee 1914,
which became the "Qita for Cooperative Movement". As exists today, the Cooperative Banking structure in
our country as three-tier federal pattern of structure comprising State cooperative Bank at the apex level.
Central Cooperative Banks at the middle level and Primary Agricultural Credit Societien at the base level..
Bihar never lagged behind in respect of cooperative movement. The base level institutions of Cooperative
Banking structure had come into existence in 1902 even before legal support wag accorded to the movement.
The present Apex Co operative Bank in the State was registered in 1914 by which time many Central
Cooperative Banks had also started working.
Of the Cooperative Banking structure, The Central Cooperative Banks have to perform double roles. They
have to feed and nurse the lower tier of the structure, i.e. the Primary Cooperative Credit Societies and they
have to serve as the principal agent of the Apex Cooperative Bank in distributing the finance made available
to the system through the Apex Bank Therefore, any attempt to have a healthy cooperative organization
cannot be successful without giving proper attention to the Central Cooperative Banks in the State. Our
analysis of the history of Cooperative banking structure in Bihar in Chapter III bears testimony to the fact that
the Central Co operative Banks in particular, received special attention from the State Government. Attempts
have been made to reform, reorganize and strengthen them. For rationalizing the structure at the middle level
with a view to having only one Central cooperative Bank in each revenue district, their total number (as
brought down from 51 in 1956-57 to 28 in 1968-69. The ideal behind reduction in the number of Central
Management Guru: Journal of Management Research, May 2020, Vol. VIII _ Issue 0 , ISSN 2319-2429 4
74
Page 75
Cooperative Banks through the process of amalgamation and absorption was to make these banks viable units
so as to give them the status of getting adequate financial accommodation from the Reserve Bank of India /
NABARD. As per this scheme the number of Central Cooperative banks has been kept increasing with the
increase in the number of districts. However, the working of Central Co-operative Banks in Bihar has never
been upto the expectations of the planners of cooperative credit movement in the State.
It is a well known fact that efficient working of an enterprise depends upon its organizational structure and
administrative set up. Our analytical study of the organization and management of Central Cooperative Banks
in Bihar has led us to conclude that these banks have been organizationally very weak and are also not well
managed
Share capital of the Central Cooperative Banks is provided by the State Government and the various
Cooperative Societies which are members of these banks. The contribution of the State Government towards
share capital has been around 50 percent which is as per the norm suggested by the different committees on
cooperative Credit Movement. So, there is also very limited scope of increasing capital base through
increasing the contribution of the State Government. This leaves no option but to make efforts towards
increasing deposits and borrowings which is possible only thorough good credit planning.
Lending operations of the Central Cooperative Banks have indicated continuous rise in the quantum of loans
advanced But, this increase has not been adequate and satisfactory. These Banks are meant to meet working
capital needs of the farmers and artisans. These banks have granted largely short-term loans. Thus making no
contribution to helping the farmers in increasing their capabilities for arranging small agricultural tools and
implements on their own
It is needless to mention over here that the Central Cooperative banks is considered to be the leader of the Co
operative movement at the district level and has to perform promotional and developmental role in the area of
its jurisdiction. It has also to promote the growth of non-credit societies, e.g marketing processing, industrial
societies, at the district level since the district has been recognized as the basis for development and credit
planning, and cooperatives as a major source of rural credit have been assigned an important role under the
District Credit Plan / Annual Action Plan. Hence, it was felt essential to have a district level organization for
implementing and monitoring various credit based development schemes, for ensuring effective coordination
with other institutional agencies. And for this we have taken into consideration the importance and need of
agriculture, source of credit, etc.
While going through the historical aspect of cooperative banking in Bihar, we found that it could attract from
the richer urban classes also and more suitably equipped to serve as a channel between the cooperative
movement and commercial banks
AS regards the origin and growth of Central Cooperative banks in Bihar, it has been found that the primary
co-operative societies in compact areas federated themselves into banking unions and forced central Banks to
collect funds from the village societies. Thus every district in the State got one or more central banks. Since
recent past there is only one central bank in a district. The State Government reiterated its confidence in the
future potentialities of these banks and decided to rehabilitate them-Besides, the Government has also ensured
their future expansion in order to make rural life richer and fuller in every way. The Government is holding
enquiries in their viability in order to do away with the uneconomic units.
Management Guru: Journal of Management Research, May 2020, Vol. VIII _ Issue 0 , ISSN 2319-2429 4
75
Page 76
The study of the organizational structure of the Central Cooperative banks in Bihar indicates that the
management of these banks has been their driving force, which is based on organizational setup wherein-
functional area have been identified, responsibility and authority of different functionaries defined and
operational relationship established. The different functionaries should be correlated with the fulfillment of
the pre determined objectives of the bank.
The discussion on the financial resources of the Central Cooperative banks has proved that their main sources
of finance are : Shares, deposits, loans, etc. But they are not adequate. The recovery of loans is also poor. The
mounting overdoes have anded the banks in a precarious position and they are not able to mobilize local
deposits to the desired an extent
The study of the lending policies and procedures shows that the procedures are complicated and dilatory. The
lending policies are not liberal. The bank is not very popular among the marginal and sub-marginal farmers:
The bank does not reach the needy and deserving loanees. There is a great need for simple and understandable
loaning policies and procedures.
In order to assess as to how far the Central Cooperative bank have been able to achieve their objectives in the
East Champaran. We have taken up the study of banks of all the five districts of the Divison. Our analysis
indicates that none of banks of the Division is functioning well. There is lack of professional management.
The offices are maintained in a disorderly fashion. The staff is untrained or ill-trained. The books of accounts
are not properly maintained. Recovery percentage is very discouraging in almost all the bank. Defaulter
members have also been found on Board of Directors. None of the banks have been classified under category
'A'. The financial and other irregularities have been found in them. The Government has superseded all the
banks on this account. So their working is not very satisfactory.
The problems being posed before these cooperative bank are lack of spontaneity, excessive state control and
interference illiteracy and ignorance of our rural folk, absence of Cooperative Cadre, dominance of vested
interests, lack of honesty among the members, lack of operational efficiency, lack of formal or formal training
of the elected directors, inclusion of politics in management, lack of professional management
mismanagement, lack of proper leadership, fictitious display of democratic spirit, inadequate internal financial
resources.
Excessive dependence on outside borrowings, defective and complicated lending policies and procedures,
laxity in realization of loans
In order to bring the Central Cooperative Banks of the East Champaran on a sound footing and make them
viable and useful. It is imperative on the part of the Government, Co operative leaders and the employees to
take stern measures. The factors responsible for the malfunctioning of these banks should be x-rayed and
valuable suggestions, on the basis of experiences gained so far, should be highlighted and implemented. Our
analysis and discussion lead us to the following suggestions :-
Since the modern states are custodians of welfare of the people. They have every right to regulate, guide and
mould the activities of the cooperatives: it does not mean that there should be excessive government control
and interference These Central Cooperative Banks have a special role to play in the promotion of socio-
economic welfare of our rural poor, as such, concerted efforts should be made to run thorn as successful and
operationally efficient institutions.
Management Guru: Journal of Management Research, May 2020, Vol. VIII _ Issue 0 , ISSN 2319-2429 4
76
Page 77
The governmental has either withdrawn certain facilities or s extended similar facilities to other business
institutions, which are functioning as financing agencies. Under the circumstance, the Central Cooperative
banks can survive only when their operational efficiency and functional superiority are not only established
but maintained and sustained.
There should be an awareness of the fact the persons in charge of managing a cooperative bank are
answerable for their actions and conduct to the general body of members which constitutes the highest
authority and has the supreme power to do or undo the decisions taken or proposal to be taken. Hence, nothing
detrimental to the objectives of the bank should be done.
Mismanagement of found should be avoided in order to enable the banks to channelise the scarce resources to
their best economic advantage.
In banks honesty is capital. If the element of honesty is lacking the capital in the form of money will slowly
and gradually wither away and the bank will come to a grief. Financial discipline should be maintained
scrupulously.
The Central Cooperative Banks face great difficulties due to the mounting overdues. This has placed the banks
in grave situation. The banks with the help of government agencies should try to take up strenuous recovery
drives. Persuasive methods can also be applied. Coercive action could be taken against defaulters who are
difficult of being disciplined. It is, therefore, urged that the official and non-officials concerned should make
frantic efforts for the recovery of overdues to bring the banks on a sound financial footing.
The staff employed by the banks has no prospect of promotion to the level of key officers and hence they have
no incentive for effective and efficient work. This is because of the fact that there is no cadre of the
cooperative personnel of the banks. It is therefore, necessary for the banks to have a cadre or well trained and
qualified staff
We have noticed deficiencies in their working, which hamper the development of these institutions. Hence,
some programmes should be chalked out which could aim at cradicating deficiencies in their working and
placing them on a firm base by evolving some arrangement to take care of the mistakes of the past which have
crippled their working.
Strong cooperative banks are essential for the revitalization of rural life. And for building up good cooperative
banks, we need leadership with dedication and determination wedded to the ideology of co-operation. But
these cooperative banks have been used as spring boards for political power. Intrusion of politics has got to be
done away with if these banks are to achieve the current socio-economic objectives.
Mobilization of deposits is very poor. The banks will have to adopt greater dynamism than at present. They
may have to bestow greater attention for giving proper face-life to their existing offices. Towards this end,
they may approach the Bihar State Co-operative Bank for sanctioning suitable medium-term loans. The banks
will have to appropriate a portion of their future profits for meeting the repayment of loan instalments.
The banks may also consider introducing new deposits schemes and extends such facilities and services as
would accelerate their programmes of deposit mobilization.
Management Guru: Journal of Management Research, May 2020, Vol. VIII _ Issue 0 , ISSN 2319-2429 4
77
Page 78
The lending policies and procedures in these banks are not simple. They are complicated and beyond the
understanding of our illiterate or semiliterate cultivators. These people are ignorant of cooperative principles
and practices also therefore the loaning policies and procedures should be simple and liberal.
Every person associated with such a bank must know about its objectives. This is not possible by untrained
personnel. The untrained worker instead of being an asset to the instituton becomes a Hability. His out turn is
much inferior. Hence, there arises the need for training. Besides introducing training some sort of orientation
course is also essential. Hence, the banks should make provision for imparting training to their employees by
arranging lectures, organizing training camps, re-orientation course, etc. to enable the employees to be more
knowledgeable and effective on their jobs.
These banks have not been able to develop an image of sound, banking institutions and are suffering from
various deficiencies, viz. Managerial, financial and organizational. These Central Cooperative banks will have
to be developed economically viable institutions in order to fulfil the programmes of rural banking
development.
The Central Cooperative Banks are mainly composed of uneducated members, the problems which confront
them are not always easy and the handing of money involves certain temptations. These conditions call for
constant and vigilant scrutiny, examination and verification of the account books. An efficient cooperative
audit implies an acquaintance with the cooperative background and special cooperative requirements. The
State Government should provide adequate and well trained audit staff and there should be arrangements for
concurrent audit. The defects revealed by audit should be promptly rectified.
Thus, the suggestions made above, if implemented in righ perspective, would bring the Central Cooperative
banks of Motihari (East Champaran) in particular and Bihar in general, on a sound footing to achieve their
predetermined objectives. This lead to true decentralization of economic power which in turn will also help in
stabilizing our democracy.
References
1. Bansal, P.C. – Agricultural Problem of India, Delhi 1975
2. Bedi, R.O. – Theory, History and Practice of Co-operation, Merrut, 1971
3. Bose, S.R. – A Study of Bihar Agriculture, Patna 1967
4. Chari, T.S.K. – Cooperative Banking at Cross Road, New Delhi, 1976
5. Choubey, B.N. – Agricultural Banking in India, New Delhi, 1983
6. Choubey, B.N. – Institutional Finance and Agricultural Development, Pune 1977.
7. Desai, S.S.M. – Rural Banking in India, Bombay, 1983
8. Dubhashi, P.R. – Principales and Philosophy of Cooperation, Poona, 1970
9. Gadgil, D.R. – Cooperation and National Development, New Delhi, 1971
10. Ghosal, SN. – Agriculture Finance in India, Bombay, 1972.
Management Guru: Journal of Management Research, May 2020, Vol. VIII _ Issue 0 , ISSN 2319-2429 4
78
Page 79
Growth of National Thermal Power Corporation Limited (NTPC)
Dr. Rupesh Kumar
S/o Dr. Ram Nandan Sah
Professor Colony, Road No. 1, Rambagh, Purnea-854105, Bihar
Abstract
National Thermal Power Corporation (NTPC) was incorporated on the seventh of November 1975 by
the Government of India as a Government company under the provisions of the Companies Act, 1956. The
Government of India cleared the first project for NTPC in December 1976 in what was to be NTPC's first
Super Thermal Power Project at Singrauli, with a sanctioned installed capacity of 2,000 Mega Watts (MW).
The first unit of 200 MW in Singrauli Thermal Power Plant was cormnissioned on 13th February 1982, which
marked the entry of NTPC in India's power sector. From a modest beginning in 1975, NTPC moved ahead to
become India's largest thermal power supplier. With a power generation capacity of 19,435 MW (1999-2000),
NTPC accounts for India's 19 o/o operating capacity, generating over 26 % of the cmmt:ry' s power
requirements, giving an output of 1,18,676 million units (1999-2000). This in itself can be considered as a
phenomenal achievement as compared to 1,220 million units (MU) in 1982-83.
Keywords : NTPC, Installed Capicity, Thermal Power, Generation Capacity, Output, Power Project
Introduction
NTPC Limited (previously known as National Thermal Power Corporation Limited) is an Indian
Central Public Sector Undertaking (CPSU) under the Ministry of Power, Government of India possessed with
the matter of period of power and bound together activities. It is an association solidified under the
Organizations Demonstration 1956 and an Organization within the significance of the exhibition. Base camp
of NTPC is in New Delhi. NTPC's fundamental objective includes time and offer of vitality to state-ensured
power diffusing affiliations and State Power Sheets in India. The affiliation additionally tries consultancy and
turnkey meander comprehends that fuse arranging, meander association, change association along with
operational management and assessment of power plants.
This organization has additionally wandered towards ‗oil and gas‘ investigation along with coal
mining exercises. This organization can be proudly declared the biggest power organization of our country
which is capable enough of generating 45,548 MW electricity. Despite of contributing almost 16% to
aggregate national limit it adds to more than 25% of aggregate power era because of its consideration on
working its vitality plants at higher adequacy levels (approx. 80.2% against the national PLF rate of 64.5 %).
The bedrock of this association was founded through Indian administration in 1975. This organization
which is greatest power affiliation of our country got merged in November 7, 1975 to restore power change in
India. Today, it has made as Planned Power Major, with chief locale in the whole respect chain of power
period business. This association has present conveying cut-off of 30,144 MW, NTPC it has left on
approaches to twist up a 75,000 MW relationship by 2017. It‘s constantly working for establishing an isolated
power major with area in the whole respect chain of the power time business. Close to power period, which is
the establishment of the affiliation, NTPC has beginning now wandered to explore consultancy, power
exchanging, slag utilization and coal mining.
Total aggregate introduced most extreme affiliations for it being 30,144 MW (checking JVs) with 15
coal based and 7 gas based stations organized all over nation. Also in the categories of JVs, 3 stations are coal
based and one such station utilizes naphtha/ LNG as fuel. NTPC has structured and applied for itself a
rainbow platter change structure that wires limit advancement by lush-green farm meanders, extending current
power plants, co-operative endeavours, associates and reincarnation of grand old-daddy plants.
NTPC operates its stations with excellent efficiency. Despite the point that this organization has
18.79% of the total national farthest point it contributes 28.60% of total power period on account of its
79
Management Guru: Journal of Management Research, May 2020, Vol. VIII _ Issue 0 , ISSN 2319-2429 4
Page 80
accentuating profitability. NTPC launched its First offer of stock (Initial open offering) in 2004. In the same
year NTPC started holding 89.5% of the quality offer amount, remaining part comes under control of
Institutional Financial experts plus related comprehensive groups. It proved out to be a reverberating
achievement. This institution is a part of the kitty that holds five superb organizations of our motherland with
respect to market capitalization.
At NTPC individuals before Plant Load Component is the mantra that associates all HR related
approaches. Is the honour of being topmost, having best working environment in India among expansive
relationship for the year 2008, by the Incomparable Work environment Establishment, India Part as a
gathering with The Financial Times.
The possibility of Corporate Social Obligation is significantly instilled in NTPC's lifestyle. Through
its broad CSR exercises NTPC tries to make basic trust with the gatherings that envelop its vitality stations.
Starting from basic to formative work of the get-together including communal harmony and getting
noteworthy self-sufficiency; the ironclad move is towards systematizing moral duty at different levels.
In a matter of seconds, NTPC creates power from Coal and Gas. Starting with introduced limit of
30,144 MW, NTPC is the biggest power creating major in the nation. Now, it is trying its luck in varying
fields like hydro power, coal mining, power hardware producing, oil and gas investigation, power exchanging
and conveyance. With expanding vicinity in the power esteem chain, NTPC is well on its approach to turning
into a Coordinated Power Major. NTPC was the first among power utilities in India to begin Environment
Sway Evaluation (EIA) examines and strengthened it with Intermittent Ecological Reviews and Audit and
reviews.
History of NTPC
NTPC Ltd has the honour of being biggest power producing organization of our nation both as far as
introduced limit and created yield. The organization is occupied with the matter of era and offer of mass
power. This organization can be sub-divided into these sections: era and different business. Different fields of
NTPC incorporate giving consultancy to other sub-ordinate firms, wander organization and supervision, oil
and gas examination, and coal mining. This association pours in 28.6% of the total power period of India. This
organization bags the honour of holding 317thposition in the 2009, Forbes Worldwide 2000 associations.
This association came into existence in November 1975 as National Warm Power Partnership Private
Restricted. Its first operation began in 1976 at Singrauli in Uttar Pradesh. Now it came to be known as
National Warm Power Organization Constrained. In 1983, NTPC began business operations (of offering
power) and earned advantages of INR 4.5 crores in financial year 1982-83. Prior to the end of 1985, it had
fulfilled power time breaking point of 2000 MW.
The year 1986, witnessed the synchronization of its underlying 500 MW unit at Singrauli. In 1988, it
designated two 500 MW units, one each in Rihand and Ramagundam. In 1989, it started a consultancy
division. In 1992, it picked up Feroze Gandhi Unchahar Warm Power Station (with 2 units of 210MW farthest
point each) from Uttar Pradesh RajyaVidyutUtpadan Nigam of Uttar Pradesh. Before the end of 1994, its
presented limit crossed15,000 MW.
The year 1995, saw it accepting control over the Talchar Warm Power Station from Orissa State
Power Board. Indian administration garlanded it with "Navratna" status in 1997. During this very period it
managed to fulfil the perspective of 100 billion units of power in a year. In 1998, it dispatched its first
naphtha-based plant at Kayamkulam with a farthest point of 350 MW. In 1999, its plant in Dadri, which had
the most raised plant load variable (PLF) in India of 96%, was guaranteed with ISO 14001. In the midst of
2000, it began improvement of its first hydro-electric power wander, with 800 MW limit, in Himachal
Pradesh.
80
Management Guru: Journal of Management Research, May 2020, Vol. VIII _ Issue 0 , ISSN 2319-2429 4
Page 81
NTPC Centered the charts of BSE and NSE on 5 November 2004. Initial issue cost of each share was
INR 62, it wound up with INR 75.55 for each share. In, its infancy only it turned sinto third biggest
organization in India as far as business sector capitalization.
NTPC Project Profile Capacity in operation
I. Coal based Projects: The vanous coal based ,projects in operation under National Thermal Power
Corporation are:
i. The first super thermal power project at Singrauli in Uttar Pradesh was cleared by
Government of India in December, 1976. It's installed capacity was 2,000 MW.
ii. The Kobra Super Thermal Power Station, Bilaspur, Chattisgarh was commissioned in
1982-83 with an installed capacity of 2,100 MW.
iii. Ramagundam Super Thermal Power Station, Kareem Nagar, Andhra Pradesh ~gan
commercial operation in October, 1983 with an installed capacity of2,100 MW.
iv. Farakka Super Thermal Power Station, Murshidabad, West Bengal entered operational
phase in January, 1986. The installed capacity of this unit was 1,600 MW.
v. Vindhyachal Super Thermal Power Project, Seedhe, Madhya Pradesh, with first unit of
210 MW came onstream in October, 1987, which now has a capacity of 2,260 MW, which
was its installed capacity.
vi. Rihand Super Thermal Power Project, Sonbhadra, U.P., with first unit of 550 MW was
commissioned in March 1988. The installed capacity of this unit was 1,000 MW and the
project was cleared by Government of India in 1982 with British assistance.
vii. National Capital Power Station, Dadri, Ghaziabad, Uttar Pradesh was commissioned in
1991 and had an installed capacity of840 MW.
viii. Kahalgaun Super Thermal Power Project, Bhagalpur, Bihar went onstream by
synchronizing its first unit in 1992 with an installed capacity of 840 MW.
ix. Feroze Gandhi Unchahar Thermal Power Project, Unchahar, Rae Bareli, U.P. with an
installed capacity of 420 MW was taken over from the Uttar Pradesh Rajya Vidyut
Utpadan Nigarn (UPR VUN) in the year 1992. NTPC achieved a complete turnaround in
the operation of the station. Two units with a capacity of 210 MW each were
commissioned by NTPC after takeover. Total installed capacity of this project was 840
MW.
x. Talcher Super Thermal Power Project, Orissa, saw its first unit commissioned in 1995. The
installed capacity of Talcher Kaniha and Talcher Thennal was 1,000 MW and 460 MW
respectively.
xi. Tanda Thermal Power Station of Uttar Pradesh State Electricity Board (UPSEB) was taken
over by NTPC in the year 2000, its capacity being 440 MW. The total installed capacity of
coal based projects = 15,480 MW.
II. Gas Based Projects
The various gas based projects in operation under NTPC are as follows :
i. Anta Gas Based Power Station, Bara, Rajasthan was provided assistance by World Bank
in 1984 and its installed capacity was 413 MW. It achieved full capacity in 1990.
ii. Auraiya Gas Based Power Station, Itawah, U.P. was also provided assistance by the
World Bank in 1984 with an installed capacity of 652 MW.
iii. Kawas Gas Based Power Station, Surat, Gujarat too was provided financial assistance by
World Bank in 1984 (World Bank agreed to provide U.S. $ 485 million for three
combined cycle projects at Kawas, Auraiya and Anta). The installed capacity of this unit
was 645 MW which became fully operational by the year 1993.
iv. National Capital Gas Based Station, Dadri, Ghaziabad, U.P. with installed capacity of 81
7 MW becarp.e operational in 1993.
v. Jhanor - Gandhar Gas Based Power Project, Gujrat had an installed capacity of 648 MW
and the project was synchronized in 1994.
81
Management Guru: Journal of Management Research, May 2020, Vol. VIII _ Issue 0 , ISSN 2319-2429 4
Page 82
vi. Kayamkulam Gas Based Power Project, Kerela, with a capacity of 350 MW came
onstream in 1998. It was the first Naphta based plant of the country.
vii. Faridabad Gas Project with a capacity of 430 MW was approved by the Government in
the year 1997.
The total installed capacity of various gas based projects is equal to 3,955 MW.
The total combined power generating capacity of both coal based and gas based projects reaches a
towering height of 19,435 MW (15,480 + 3,955) in the year 2000, moving towards substantial capacity of
40,000 MW capacity by the year 2012.
Two units namely Badarpur Thermal Power Station, Badarpur, New Delhi and Balco Captive Power
Plant, Bilaspur, Chattisgarh with installed capacity of 705 MW and 270 MW respectively are also managed by
NTPC.
Table 1 NTPC Thermal Power Stations
Projects I Stations Units Installed
Capacity (MW)
Total Installed
Capacity (MW)
Singrauli (U.P.)
Korba (M.P.)
Rarnagundam ( A.P.)
Farakka (W.B.)
Vindhyachal (M.P.)
Rihand (U.P.)
Kahalgaon (Bihar)
National Capital Thermal Power
Plant (U.P.)
Talcher (Orissa)
Badarpur (Delhi)
Unchahar (U .P.)
Gas Based Projects
i. Auraiya (U. P.)
ii. Kawas (Gujarat)
iii. Anta (Rajasthan)
TOTAL
5 X 200 + 2 X 500
3 X 200 + 3 X 500
3 X 200 + 3 X 500
3 X 200 + 2 X 500
6 X 210
2 X 500
4 X 210
4 X 210
2 X 500
720
600
600
430
2,000
2,100
2,100
1,600
1,260
1,000
840
840
1,000
720
1,630
15,090
Source : The Hindustan Times, March 24, 1999.
NTPC not only emphasizes on power generation but also the quality of power it supplies to its
customers, and also the efficiency of its power plants. This is evident from consistent high operating
performance of NTPC power plants as compared to national operating perfonnance. Measured in terms of the
ratio between actual output and installed capacity or Plant Load Factor (PLF), NTPC stands much above the
national average. In year 2000-2001 PLF of NTPC stood at 81. 8 % as compared to national average of 69 %.
82
Management Guru: Journal of Management Research, May 2020, Vol. VIII _ Issue 0 , ISSN 2319-2429 4
Page 83
Amongst India's top ten performing power plants, six belong to those of NTPC with its Dadri Power
Plant acclaimed to be the best performing unit with a Plant Load Factor (PLF) of96.12 %.
The high performance standards of NTPC has also been recognized internationally. Data Monitor of
U.K. has ranked NTPC as the world's sixth largest in thermal power generation and the world's second most
efficient in capacity utilization (based on 1998 data).
In 1984, for the first time World Bank agreed to provide U.S. $ 485 million to NTPC for its projects
which in itself was a big achievement. World Bank, initially reluctant to provide funds to organizations with
less experience wanted NTPC to collaborate with a foreign company for a degree of assurance in terms of
perfonnance, but was convinced by NTPC of its capabilities, and started providing funds to it. Besides
financial assistance, the World Bank also assisted NTPC in management through consultancy. The emphasis
was on :
1. Long term strategic corporate planning.
2. A systems approach as a primary management tool making.
3. Establishment of a systematic quality assurance programme.
4. Build-up of high quality in-house engineering capability helping to identify technical innovations
and
5. Implementation of a comprehensive manpower development programme, contributing to attract
the best professionals.
The efforts of NTPC was appreciated by the World Bank when its President visited the Singrauli
Power Plant in August 1985. To quote him, "You are on time ; you are within budget and you are generating
profits. These are all phenomenon and characteristics that the World Bank likes to, be associated with".
The relevance and importance of NTPC became evident way back in 1978 when the Central
Government handed over the Badarpur Thermal Power Station (Delhi) to NTPC for better management and
improved performance. NTPC successfully turned around the Badarpur Power Plant achieving a Plant Load
Factor of 81. l % in the year 1999-2000 as compared to 31.94 % in 1978 at the time of its takeover, thus
adequately proving its capabilities.
Today NTPC has 19 power stations in all, of which 12 are coal based and 7 are gas based. Besides
these NTPC also manages two power plants. These have been listed in the following Table 2.
Table 2 Power Plants of NTPC
Name of Power Plant Location Installed Capacity
(MW)
Coal Based
Korba Super Thermal Power Station
Ramagundam Super Thermal Power Station
Farakka Super Thermal Power Station
Rihand Super Thermal Power Project
Vindhyacbal Super Thermal Power Project
Kahalgaun Super Thermal Power Project
National Capital Power Station Dadree
Talcher Super Thermal Power project
Feroze Gandhi Unchahar Thermal Power Project
Singrauli Super Thermal Power Project
Talcher Kaniha Super Thermal Power Project
Tanda Thermal Power Station
Bilaspur (M.P.)
Kareem Nagar (AP.)
Mursidabad (W.B.)
Sonbbadra (U.P.)
Seedhe (M.P.)
Bhagalpur (Bihar)
Ghaziabad (U.P.)
Angul (Orissa)
Unchahar (U.P.)
Singrauli (U.P.)
Angul (Orissa)
Tanda (U.P.)
2100
2600
1600
2000
2260
840
840
460
840
2000
1000
440
83
Management Guru: Journal of Management Research, May 2020, Vol. VIII _ Issue 0 , ISSN 2319-2429 4
Page 84
Gas Based
Anta Gas Based Power Station
Auraiya Gas Based Power Station
Kawas Gas Based Power Station
National Gas Based Power Station
Jhanor-Gandhar Gas Based Power Station
Kayamkulam Gas Based Power Station
Faridabad Gas Based Power Station
Managed by NTPC
Badarpur Thermal Power Station
BALCO Captive Power Plant
Bara (Rajasthan)
Itawah (U.P.)
Surat (Gujrat)
Dadree (U .P.)
Bahraich (Gujrat)
Kerela
Haryana
Delhi
Bilaspur (M.P.)
413
652
645
817
648
350
430
705
270
NTPC has set itself an ambitious objective of achieving a power generation of 40,000 MW by the
year 2012 against present generation of 19,435 MW. To meet this demanding target, NTPC has envisaged
more power projects to be implemented in near future. Four projects are already under construction and
fourteen more projects have been identified for implementation in a phased manner. The completion of these
projects will add 19,670 MW to its existing installed capacity. These projects have been listed in the following
Table.
Table 3 Future Project of NTPC
Future Projects I Capacity Addition Location Installed Capacity
(MW)
Under Construction I Capacity Addition
Simhardi
Talcher-Kaniha III
Ramagundam III
RihandII
Future ImRlementation I CaRacit)'. Addition
Sipat I
Kahalgaon II
Barh
Vindhyachal III
Sipat II
Anta II
Auraiya II
Kawas II
Jhanor-Gandhar II
North Karanpura
Unchahar II
Dad.ri II
Kayamkulam 11
Cheyyur
A.P.
Orissa
A.P.
U.P.
Chattisgarh
Bihar
Bihar
M.P.
Chattisgarh
Rajasthan
U.P.
Gujrat
Gujrat
Jharkhand
U.P.
U.P.
Kerela
Tamil Nadu
1,000
2,000
500
1,000
1,980
1,320
1,980
1,000
660
650
650
650
1,980
210
490
1,950
1,000
84
Management Guru: Journal of Management Research, May 2020, Vol. VIII _ Issue 0 , ISSN 2319-2429 4
Page 85
In a short span of 25 years since its inception, NTPC has become the largest power generator of India
accounting for one fourth of its total power requirements. NTPC, today, is one of the largest power utilities in
Asia. The sound practices and efficient management ofNTPC has made it a benchmark in the power sector of
the country.
NTPC has set itself a target of generating 40,000 MW of power by the year 2012. The past track
record and growth pattern, in itself: is an assurance of its capabilities and abilities to achieve this target.
The achievements made by and performance of NTPC may be seen from the following Table 4 :
Table 4 Performance of NTPC
Details 1996-97 1997-98 1989-99 1999-00 2000-01
Value Added
(Rs. Crore)*
Turnover
(Rs. Crore)*
Generation
(MU)*
Manpower*
(a)Value added I Emp.
(Rs. Lakh)
(b) Turnover I Emp.
(Rs. Lakh)
(c) Generation I Emp.
(MU)
5486
9840
97609
21407
25.63
45.97
4.56
6552
12741
106290
20710
31.64
61.52
5.13
7633
14057
109450
20808
36.68
67.56
5.26
9116
16102
118676
21265
21265
75.72
5.58
10334
19045
130154
21289
48.54
89.46
6.11
*All figures excluding Badarpur and BALCO power stations.
Source: Annual Reports of NTPC
References :
1. Annual Report NTPC-2012.
2. "Government of India Ministry of Power Monthly Report," December 2011.
3. Kahalgaon STPS Coal Station India, Global Energy Observatory, accessed March 2012
4. RAJIB CHATTERJEE , Anil Sasi, "From Jhajjar to Farakka, new to old, fuel shortage hits 130 power
units," Indian Express, March 14, 2012
5. "New projects," Bihar State Electricity Board, accessed February 2012
85
Management Guru: Journal of Management Research, May 2020, Vol. VIII _ Issue 0 , ISSN 2319-2429 4