Page 1
CHAPTER V
Management of Interest Rate Risk and
Liquidity RIsk
The changes in interest rates and liquidity problems in the Post-
Reform Period havc pavet1 thc w a y for risks of different dimensions and
this has afTected the bzu~k's perlbrrnance and operating results. The
following analysis focuses on these aspects.
(a) Interest Rate Risk Assessment and its Management
Interest Rate Risk normally means changes in the interest
income due to changes in the rate of interest which will ultimately
affect the value of 1)ank's assets, liabilities and off-balance sheet
instrurncnts. A fall i n itilcresi rate may adversely affect the interest
income from atlvances. Hut tlrposits will have to bo carried at higher
cost till their maturity if they have already been mobilized for long'term
tenure on fixed interest basis.
The Interest Rate Risk Management of the banks can be studied
by analysing the growth of Interrst Income, Interest Expenses, Spread
and Burden and also by analysing the Interest Rate Sensitivity of the
banks.
Interest Expense to Interest Income Ratio
This ratio has a direct impact on the profitability of the banks as
it reflects the efficiency of raising resources and their deployment. It
shows the proportion of' interest Income expended on the payment of
interest. In all other banks except in IOB the ratio shows an increase
Page 2
dur ing thc pcriotl of s tudy . In I 0 1 3 t he proportion of ln tcrcs t Expense
to Interest lncorne is vcry high du r ing t h e y e a r s 1992-93 and 1993-94
(i.e. 92 .28 pcr c e n t and 85.83 per c e n t respectively) and t h e bank has
sufferrtl loss dur ing I h r sillnc. pc.~.~otl (oidc. 'l'ablc 1V (24)).
Table V (1)
Interest Expense to Interest Income Ratio of the Selected
Banks from 1991-92 to 2001-02
Year .. Name .- - of the Selected Banks IOU UUI FB SIB D L 6 81 90 62.82 60.87 62.65 61.11
- -- -- - - 75.42 73.39 66.67
1993-94 X S 83 69 14 68.53 71.01 66.67
1994-95 76.38 63.74 67.46 70.06 67.3 1
~ -~
1995-96 71.37 76.02 64.87 74.94 67.80 69.05
~ ~~ - ~
1996-97 72 72 77.03 66.85 81.52 77.06 76.80
1097-98 72.7 1 7 5 10 67.37 80.34 76.99 75.37
~~~ .. .-
71.00 89.87 78.00 79.58
~~ ~ .- .
'72 89 71 13 79.48 74.84 75.46
2000-0 1 60 96 68 49 07 35 74.21 72.22 77.40
..~ ~
200 1-02 66.71 73.51 74.80 76.24
~ p~ - .. -
lnterest I I90 17.13 26.66 24.88 31.13
Interest 2337 22.35 27.76
Source ( 'onl l~~led and Coniputed lio111 Ar~li~lal llepo~ts of the Selected Banks
Page 3
By the year 2001--02, the ratio has been reduced to 69.41 per
cent. In FB the ratio was high during the year 1998-99 as compared to
other years and the bank could earn only an extraordinary low profit
during the same year (vide. 'Table 1V (24)).
The Average An~lual Growth (AAG) rate of Interest Expenses and
lnterest Income of Private Sector Banks is higher than that of the
Public Sector Banks. l'he AAG of Interest Expense of all other banks
except IOU is higher than the AAG of lnterest Income. From this
analysis it can be inferred that the Interest Spread (Interest lncome -
Interest Expense) of the banks are showing a declining trend.
Non-Interest Income to Non-Interest Expense Ratio
'I'hc Non-Interest 11lcornc of the banks should be sumcient to
meet the Non-interest. Expense, otherwise it would become a burden for
the banks. tlere thc ratio indicales as to what extent the Non Interest
Expense can be covered by the Non-lnterest Income. Except in IOB
and UBI, the proportion of Non-lnterest lncome to Non-Interest
Expense of other banks is showing a consistent increase during the
period of study. In IOB, the ratio which was 46.13 per cent in the year
1991-92 has been rctluced to 17.85 per cent during the year 1992-93,
the loss-ln:rkirig yc;lr. l'hc r:ltio rc:~-r~;~inctl low in sornc years and by the
end of 2001-02 the same has reached a level of 41.81 per cent. In the
case of UUI thc ratio ranges [jetween 22.69 per cent lo 32.79 per cent
over the years. The low ratio reveals high burden of the bank.
Page 4
In SI.YI', I'U, SIB and L)l,B the ratio has increased from 22.70 per
cent, 21.67 per cent, 28.57 per cent and 22.22 per cent respectively in
the year 1991-92 to 43.07 per cent, 53.01 per cent, 59.48 per cent and
64.84 per cent respccl.ively by the year 2001-02. In the declining
interest rate era the t ~ a n k s are concentrating more on the Non-Interest
Income to sustain ancl increase the profit.
Table V (2) Non-Interest Income to Non Interest Expense Ratio of the
Selected Banks from 1991-92 to 2001-02 (Per cent)
7-- . _ - . ~ .- I
Source C'on~piled and Co~i~puted tiotii Annual Reports of the Selected Banks
Year ~
Name of the Selected Banks DLB 22.22
SIB 28.57
-
F B 21.67
.-
~ .-~ LOB ~ . ~ - T - "b , 46.13 23.12
.
S UI'
~-
1996-97 37 35 26.68 53 3 9 27.85 36.36
-~
1997-98 42.21 35.20 51.1 1 3 1.33 38.46
1998-99 57.07 31.09 33.33
1999-2000 -17 56 20.42 25.89 49.44 44.3 1 46.30 ~ ... ~~ - -- ~
2000-0 1 1 30 43 ? X 3 0 23.60 41.53 40.33 44.07
-- .. . ~~~ - --.-. .
2001-02 ~ / 4.1 07 1 4 I 8 I 32.7') 53.01 50.48 64.84
- . ~
18.96 19.31 3R.91 39.54 49.24 Non lntcrcst
lnco~nc 30 22 15.30 22.84 23.10 27.35
Expense - ~ ~ ~
1991-92
1992-93
~-
22.70
17.85
.. .. -. -
30. 00
28.57
40.91
25.00
38.60 33.13
+- ..
30 58
- --
32.50
28.38
- ~ -
2557
1993-94
1994-95
27.27
36.52
57.93 1995-96
53.23
.
40.32
25.26
4.181
.- ~~ ~ ~
4 1.70
- ---
33.42
~~~~~
36.49
~ ~
37.86 26.50 23.35
Page 5
A s compared to the Public Sector Banks, the Private Sector
Banks under studv have been able to increase the Non-Interest Income
to cover the Non-Interest Expenses during the period of study.
Net Interest Income (Net Interest Margin)
Asset Liability Management focuses its emphasis on the growth
of Market Value of Equity (MVE) and improvement in Net Interest
Income (NIII. Optimising Net Interest Income is one of the objectives of
ALM. NII or Spread is the difference between Interest Income and
Interest Expense. NII of the bank should be adequate to leave certain
profits for the bank after having adjusted the Burden (Difference
between Non-Interest Expense and Non-Interest Income]. For the
industq-wise comparison of a bank's performance Net Interest Margin
(NII as a percentage of Total Fund) is used.
Net Interest Income to Total Fund Ratio (Spread)
The impact of deregulation of interest rate and competition
among banks with regard to interest rate in the Post-Reform Period can
be revealed from the declining Net Interest Income to Total Fund Ratio
of the selected banks (Table V (3)). The declining interest rate in the
Post-Reform Period on both deposits and advances has reduced the
Spread of the banks. In IOB the ratio is very low in the beginning of
the period of study when compared to other banks. In the year
1992-93 the Spread of IOB is lower than the Burden (vide. Table V(4)).
Page 6
Table V (3)
Net Interest Income to Total Fund Ratio (Spread) of the
Selected Banks from 199 1-92 to 2001-02 ~ ~ -, - ~~~ .. ~ . ~
- - - I ~ ~ 7
Source: Compiled and Computed from Annual Reports of the Selected Banks
In SBT, UBI, FB, SIB and DLB the ratios which were 3.30 per
cent, 3.81 per cent, 3.22 pel- cent, 3.76 per cent and 3.85 per cent
respeclivelv in the year 1991-92 have been reduced to 2.58 per cent,
3.01 per cent, 2,72 per cent, 2.36 per cent, 2.28 per cent respectively
DLB 3.85
3.36
3.14
3.23
3.11
2.38
2.79
2.10
2.51
2.36
2.28
21.79
27.97
Year Name of the Selected Banks
by the year 2001-02 Thus ttir 1:111 in NIM is visible across all thc bank
SIB 3.76
SBT IOB UBI - - - 1991-92 1.72 3.81
FB 3.22
~~~ ~ ~ -~
1902-93 0.62 2 54
1993-94 2 41 1 .06 2 02
2.20
2.73
3.37
2.43
~
1994-95
1995-96
1996-97
2.65
2.89
- 3.05
- 3.70
~-
1997-98 2.93 2 3 0 3.17 1.89 2.55
~ - - --- 1998-99 2 I I 2 6 6 1.08 2.46 1 ~~ ~ ~ ~ ~ . . ~ - - -. --
1999-2000 2 27 2 10 2.73 2.37 2.65 ~- --
2000-0 1 3.13 2.68 2.88
200 1-02 '. 7 58 . 3 01 2.72 2.36
--- .~ -~ ~. ~- AAG 16.58 24.57 19.08
. - -.
2 63
-- 3 3 3
3 18
Ncl 111lcrcsl Illcollle
2 1 ~ u 1 1 d
2.1 l
1 79
~- -~ I!. 12
: ! 3 8 2.70
-. --
.-- .. 17.00 ~ ~ 4 ~ ~~ ---. 1138 ~
- -. 17.76
3.32
-~ .
3.40
3.41
p-
20.59 23.16
Page 7
categorics. Cost reduction is assuming great importance in this respect
and eveq bank will be required to consistently bring down its cost of
raising funds by arriving at an ideal deposit mix. Similarly, attention
will have to be paid to the reduction of Burden also.
Non Net Interest Expense to Total Fund Ratio (Burden Ratio)
The difference bctweeri Non-lnterest Expense and Non-Interest
Income is known as Burden as it is a negative figure.
Table V (4) Non Net Interest Expense to Total Fund Ratio (Burden) the
Selected Banks from 1991-92 to 2001-02 -- - (Per cent) r-- 1 -- I
Year Name of the Selected Banks
~- ~~~ . - 199 1 -92 r:r ~ ~ ~ "r~[~Tl 1992-93
- ~ ~- ~. .~ -. .- .~ -- 1993-94 3 73
- - - 1994-95 2 29 1 72 2.70 2.20 2.13 2.47
t . - . .- .- -- 1995-96 2.89 2.10 3.01 1.40 3.45 2.51
~-. - .- - 1997-98 1718 1.86 2.03
1998-09 2.29 1.88
199s-zoo0 ~~'
1.73 2.3 1 2.04 1.82
2000-0 1 2.00 2.53 2.73 2.07 1.95 --
200 1-01 1.84 3 00 2.3 1 1.92 1.43 1.70
I 1 X7 -
46 79 14.55 18.92 17.56 17.93 Non Ncl lntcrcsl
-- Expc~isc -~~ ~~
Total ftiiid 1 17 00 14 38 ~ .- ~ .. .- -- 17.76 20.59 23.16 27.97
Source: ('ontpiled arid C'ornputed fiorn A~lnual Reports of the Selected Banks
Page 8
Table V (4) reveals that the Non-Net Interest Expense to Total
Fund Ratio of the Selected Banks has decreased over the period of
study. In the year 1992-93 the Burden Ratio of IOB (i.e. 7.59 per cent)
was very much higher than their Spread Ratio (i.e. 0.62) and the bank
suffered heavy loss during that year. (vide Table IV (24)) In the year
1993-94 also the Burden Ratio of the bank was higher than the Spread
Ratio and the bank incurred loss during that year too.
When compared to the Public Sector Banks, the Private Sector
Banks have been able to reduce their Burden more by the end of the
period of study. A s the Net Interest Margin (Spread) of the banks is
declining in the Post-Reform Period it is only by reducing the Burden
that the banks can sustain and improve their profitability.
Spread, Burden and Profitability in the Post-Reform Period
From the above analysis it is revealed that the Net Interest
Income (Spread) of the banks has declined in the Post-Reform Phase
but the banks could increase and sustain the profit during the same
period by reducing the Burden.
In order to find out the influence of the Net Interest Income
(Spread) and Non Net lnterest Expense (Burden) on the performance of
banks the following hypothesis were formulated:
H 3 Though the Net Interest Income (Spread) is diminishing in the
Posr-Reform I'eriod the increasing Profitability of the Banks can
be attributed to the reducing Burden of the banks.
Page 9
Table V (5)
Spread, Burden and Profitabiliw: Pearson's Correlations
Details --
Spread anT~rofi tabi l i t~
-- -. -- Burden and Profitability
- -. . .- -
Source: Calculated from Table V (3) and Table V (4).
Karl Pearsons Coefficient of Correlation was applied to test the
hypothesis. From the 'Table V (5) it is inferred that only in IOB and FB,
Spread has significant positive correlation with Profit. In SBT, SIB and
DLB, Spread is negatively correlated though not significantly. But
there is significant negative correlation between Burden and Profit in all
the banks except in FR. Thus the Net Interest Income of the banks has
no significant positive correlation in the Post-Reform Period. But the
Burden is significantly correlated to Profit. Hence the hypothesis H3 is
substantiated.
This reveals that in the Post-Reform Period though the Net
Interest Income (Spread) is diminishing it is the reduction in the
Burden, which has helped the banks to improve their profitability.
Table V (6) shows the declining interest rates on Deposits and
Advances of more than one year in the Post-Refom Period. The
interest rate on Deposits of more than one year has decreased from 13
per cent in 1992 to 8 per cent bv the year 2002. The interest rate on
Page 10
Advances has tlecreasrtl St-otn 19 prr ccnt in 1992 to 12 per cent by the
end of March 2002
Source: A C:otnpe~ldiur~~ oF Inte~est. Itxcllange. Commission, other charges and latest
data on Banking. State Bank Institute of Rural Development, Hyderabad. March
2002 1) 20
Table V (6)
Interest Rates on Deposits and Advances - More than One Year
Fig. V(i) shows the declining interest rates on Deposits and Advances of
more than one year of the selected banks from the year 1991 -92 to
- ~rnleFest on Aclvn~~crs
19
- -- 17
14
15
16
14
13
12
11.25
12
12
IBrriocl
p~ ~- .
1992
.~ ~ ~
1993
~~~
i l l t r i i s t ~ I I i)cposits
~
13
~ . -- ~ ~~-~ --
I I
~ ~~ . , .. - - . . -- 1904 10
- ~~ -- .
1995
~ -~ ~~
~ . ~ ~ -
10
- -
1990 I ? _
~ ~~
I V) 7 t - 12 I
-- ~
1998
~ ~ -- ~
1990
~- ~
10.5
~~~ ~-
0.5
- ~ - I ~ ~ . - ~~. -
2000 8 . 5
~ - 200 1
- ~~ ~~
2002
~
9.0
~~.~ . -~
8.0
- - - 1 ~-
Page 11
191 Fig V( 1)
lnterest Rates on Deposits and Advances of More than One Year from1991-92 to 2001-02
0
199) '13 24 95 96 97 98 9'2 2000 2001 2002
Years
Analysis of lnterest Rate Sensitivity Statement
Thr change in interest rates that will lead to losses for the bank
is termed as Market or Interest Rate Risk. Both rising or falling
interest rates may lead lo losses in any bank. All investments,
advances, deposits, borrowings, purchased funds etc., that mature
within a specified time frame are interest rate sensitive. Similarly, any
principal repayment 01- loan is also rate sensitive if the bank expects to
receive it within the time horizon. The Reserve Bank of India has
implemented the simplest method of constructing a maturity ladder of
Rate Sensitive Assets (RSA) and Rate Sensitive Liabilities (RSL) to
manage the risk arising from maturity or repricing mismatches.
Page 12
In each maturity buckets (1-28 days, 29 days to 3 months etc.)
when interest sensitive assets exceed interest sensitive liabilities in a
particular maturity range, the bank is asset sensitive in a scenario
where interest rates are going to fall and as a result may sustain losses.
On the other hand, if the rate sensitive liabilities exceed the rate
sensitive assets, losses are likely from rising interest rates.
From April 1990 onwards, every bank has to prepare a Gap
Report by grouping Rate Sensitive Assets, Liabilities and Off-Balance
Sheet Positions into tirne buckets according to the residual maturity or
the next repncing period whichever is earlier. The gaps reflected by the
respective time buckets will denote the extent or the measure of
Interest Rate Risk.
By analysing the statement of Interest Rate Sensitivity in the
months of March 2000 and 2001, it is revealed that up to 3 year time
buckets, mainly a negative gap persists. A negative gap where RSL is
more than KSA will prove to be advantageous, if a t the stage of
repricing, interest rates have declined as it will result in an increase in
Net Interest Income. If Rate Sensitive Assets are more than Rate
Sensitive Liabilities, the gap is positive.
A positive gap is an indication that if repricing takes place at the
end of the time bucket, an increase in interest rates will be beneficial
and it will result in increase in the Net Interest Income. When the gap
is zero or nil, it implies that if' repricing take place at the end of the time
Page 13
bucket suggested, the risk is nil. In the declining interest rate scenario
a negative gap is beneficial for the banks.
By analvsing the gap up to 3 year time buckets in (Table V (7)), it
is revealed that in March 2000 a negative gap exists in SBT, except in
the time bucket of 1 to 28 days. In IOB and UBI, except in the time
buckets of 1 to 28 days and 6 months to 1 year a negative gap exists.
In FB a negative gap exists up to the 3 year time bucket except in the
time buckets of 29 davs to 3 months. In SIB except in the time bucket
of 3 months to 6 months and 1 to 3 years, a negative gap exists.
A s per Table V ('7'1 in March 2001, a negative gap exists in SBT in
the time buckets of 20 days to 3 months, 3 months to 6 months and 1
to 3 years. In IOB a negative gap exists only in the time bucket of 29
days to 3 months and 3 months to 6 months. In UBI except in the time
buckets of 3 to 6 months and 1 to 3 years a negative gap exists.
Under the category of Private Sector, FB has negative gap in the
time bucket of 3 to 6 months, 6 months to 1 year and 1 year to 3 years.
In SIB, except in the time buckets of 6 months to 1 year a negative gap
exists in all other time buckets. In DLB a negative gap exists in 1 to 28
days, 29 days to 3 months and 6 months to 1 year.
To know the immediate effect of Interest Rate Risk, gaps up to 3
years is considered as most relevant. The negative gap existing in the
time buckets of the selected banks has helped them to sustain the NII
and improve profitability during the last 3 years of the period of study.
Page 15
I
March 200 1
Figorcs in brackcls sl~ow Gap as a percent to Risk Sensitive Assets Sonrcc: Co~llpilcd and Conlpulcd from ALM Rcporls of tl~e Selcclcd Banks
Page 16
Impact of Deregnlation of Interest Rate Structure
Table V (8) shows the opinion of branch managers regarding the
impact of deregulation of interest rate. 75 per cent of the managers
contacted are of the opinion that the deregulation of interest rate has
adversely afTec:ted the business of their branches and 25 per cent of the
bank managers have not experienced this.
Table V (8)
Impact of Deregulation of Interest Rate Structure -
Particulars
I I (Per cent) (Per cent)
/rn~ilizing s a G i s due to low interest i 38 62
Dereg~lation of interest rate adversely affected the 1 75 I
I rate i
25
--- due consideration to branches
while 6xing interest rates
Source: Survey Report
While 38 per cent of the managers find it difficult to mobilize
savings, 62 per cent did not find any difficulty in mobilizing savings in
the declining interest rate scenario. 65 per cent of the managers
interviewed opine that the Head Office is giving due consideration to the
peculiar nature of the branches such as, competition, business climate
erc. while fixing interest rates. But 35 per cent of the managers have
not agreed to this
Page 17
Earning Capacity of the Branches
The long run sustenance of the banks depends on their ability to
earn Net Interest Income (NIII and this will ultimately improve the
Market Value of Equity (MVE) or the Net Worth of their business.
Table V (9) NII/Non NII Earning Capacity of the Branches
i o n b ~ y ~ t a e e Frequency Per centage Frquenq
Ability of the branch to earn NII
- Ability of the
1 7 i -, i
Source: Survey Report
Table V (9) shows various factors regarding the NII (Spread) about
which the branch managers have expressed their opinion. 51.6 per
cent of the branch managers responded to the question that they were
able to earn Net Interest Income (Spread) every year in their branches
while 36.7 per cent were able to earn Net Interest Income only in some
years. 11.7 per cent of the managers admitted that they have not been
able to earn Net Interest Income (Spread) for the last 10 years.
Only 25 per cent of the bank branches are able to earn Non-Net
Interest Income every year. Majority of the managers (65 per cent) are
of the opinion that their Non-Interest Income has been sufficient to
cover Non-Interest Expense onlv in some years. In 10 per cent of the
Page 18
branches, the Non-Nrt interest incorne has not been always sufficient
' X ensc. to cover the Non Interest C p
ALM Concept at Branch Level
A bank's profitability or rarnings normally depends on two
sources i.e. Net Intercsl income:. IN11) arld Off Balance Sheet Items (fees
chargcd on sprc.iSic s c lv~c r s rrndrred such as issuance of Lcllers of
Credit, Bank Guarantrrs , Hiring of Lockers, Demat Accounts, Cash
Management of Corporates etc)
Table V (10)
Internal Factors Influencing Profitability of Banks
I-- . --
Source Survey ~ e ~ o ; 1
Earnings based on Net Interest income is normally influenced by
internal factor s such as
1. Pricing oi Produt ts
2. Product Mix, a r ~ d
3. Asset ()~~;ility.
Table IV (10) shows va rous factors arranged in order of
preference rxprrssed by the respondents. Bank managers are of
opinion that saving assets from i~ecoming NPA (Asset Quality) is the
most important factor which will influence the profitability of banks. In
Page 19
the deregulated environment, fixing proper interest rate (pricing of
products) is corisiderrd :-lnothrr important factor affecting the Net
lnterest Incolnr ant1 profitability of banks. Decision of the banks
Mix) also inlluerices the profitability of banks.
Table V (1 1)
External Factors Influencing Banks' Earnings / Profitability
-. - -~ .
Business (.limate 4.80
~~. ~ - Interest Rate Risk. 4.07
~ .~~~ k?--i Liquidity Risk - ~- .~ ~
Behaviour of Monetary and Autl.~ority
-- - - ~~ ---- ~- ~ ~
6 / ('apital Adequacy Risk
i__i . .. . _ - .
Source: Survey Report
Due to the introduction of various Prudential Norms in the Post-
Reform period, various factors which were outside the control of the
banks become pretiorr~inarit in influencing bank's profitability.
According to the survey report a s given in Table V ( l l ) , competition
among the balks, changes in the business climate and lnterest Rate
Risk are the three important factors that are influencing the
profitability or earning capacity of the banks. Liquidity Risk and the
Page 20
norms prescribed by the RBI from time to time also affect the
profitability of the banks to a certain extent.
@) Liquidity Risk Assessment and its Management
Measuring and managing liquidity needs are vital activities of
Commercial Banks. By assuring a bank's ability to meet its liabilities
as they become due, Liquidity Management can reduce the probability
of developing adverse situations. Banks normally keep their liquid
funds in Cash and Balance with RBI, Balance with other banks, Money
at Call and Short Notice and also in Investments. To meet the liquidity
gap, banks adjust their surplus / deficit by investing the surplus funds
in short / long term securities and by disinvesting securities or by
borrowing funds from the: market to meet the shortfall.
Composition of Liquid Fund:
Liquid Funds of a bank normally include cash in hand and
balance with RBI, Balance with other banks, Money a t Call and Short
Notice and Investments. The Composition of Liquid Fund (Table V (1 1))
reveals that banks are increasing their investment by keeping the Cash
and Balance with the Reserve Bank of India at the minimum. Except in
IOB in all other banks the Cash and Balance with the RBI was high at
the beginning of the period of study.
A s the RBI has reduced the SLR and CRR requirements from
38.50 per cent and 15 per cent in 1991-92 to 25 per cent and 5.5 per
cent by the year 2001-02, banks have obtained more funds for
deployment.
Page 21
Table V (12) Composition of Liquid Funds of the Selected Banks from 1991-92 t o 2001-02
B:tnli / Partic~~lars AAC
. _ r..-8. -..A R 1- . , , a ,,IILL ,,ilh R R : 8.04
al call a Sl~on Nolicc Investments ?I 49
. . ~
100 I'?;<II and Balance with RBI
I Money a: call a Sbort Notice 47 17 108 1 I I I V C S ~ I I ~ C I I ~ S 19.16
Total I Cash and Balancc with RBI I 9.59 1 Moncy ;I[ ci~ll a Sllort Nolicc 38 46
URI
FR
111vcst111c11ts 'lol;~l Cash and Balancc with RBI Moncy ;II c;~ll 21 Sl~orl Nolicc I ~ ~ v c s l ~ ~ ~ c n l s Tolill Cash and Balance with RBI
SIB Investments 1 24.80 1 64.41 1 63.16 1 6736 1 7152 1 67.96 / 74.35 1 68.34 1 67.80 1 77.12 / 77.59 1 70.32 I Total 23.24 l i)O 100 100 100 100 100 li)o loo 100 100 100
Money at call a Shor( Notice 149.16 1.00 3.45 5.79 0.86 6.56 5.15 13.52 17.23 10.01 10.95 19.97
I8 27 16.64 8.46
45.41 24.37 IX.')O 8.94
D1.B
67 51 100
40.93 4.39 54.6') 100
34.59
Source: Compiled and Computed from Annua l Repor ts of t h e Selected Ranks
Cash and Balance with RBI Money at call a Sllort Notice Investmenls Tol:ll
71 25 100
3300 439 6261
100 33.39
16.85 59.38 29.18 25.78
76 30 100
34.43 0.45 5 2 100
2686
35.35 9.09 55.56 100
67 6 100
2259 3.43 73.99 100
27.62
33.91 6.96 59.13 100
62.50 100
26.06 11.08 62.86
100 25.48
26.32 8.77 6 9
100
6603 100
16.54 13.66 69.80
100 20.51
26.03 6.39 67.58
100
34.20 8.12 57.68 100
66.14 1 67.35 63.60 100
12.28 3.75
83.97 100
12.87
100 14.02 7.56 78.42
100 18.14
21.28 26.64 52.08 100
100 13.43 8.25 78.33 100
14.97
72 00 100 7.46 6.12 86.42 100
11.46
17.10 21.59 61.31
100
76.23 100
10.37 4.94 84.69 100 9.71
23.65 15.86 60.48
100
17.81 6.07 76.1 1 100
11.70 7.63 7.67 100
12.14 9.62 78.24 100
Page 22
In the light of high NPA level with the banks, a high portion of the
additional funds obtained due to the reduction in reserve requirements,
were deployed by the banks in Investments. The sharp rise in the
proportion of Investment of the selected banks reveals this. In SBT,
IOB and UBI, the proportion of Investments in Total Liquid Fund has
increased from 55.15 per cent, 75.81 per cent and 67.51 per cent in
1991-92 to 76.18 per cent, 80.61 per cent, and 76.23 per cent
respectively by the year 2001-02. In the category of Private Sector
Banks the ratio has increased from 54.69 per cent, 64.41 per cent and
55.56 per cent in FB, SIB and DLB respectively in the year 1991-92 to
84.69 per cent, 70.32 per cent and 78.24 per cent respectively by the
year 200 1-02.
Changes in the Statutory Liquidity Ratio (SLR) and Cash Reserve
Ratio (CRR) in the Post-Reform Period
In order to ensure adequate liquidity with banks as well as
reasonable growth in the supply of bank credit in the economy both
SLR and CRR are being maintained by the banks as per the
instructions of RBI.
Under section 42 (1) of the RBI Act 1934 Scheduled Commercial
Banks are required to maintain with the RBI a Cash Reserve Ratio in
certain proportion of their Net Demand and Time Liabilities (NDTL)
between 3 per cent to 15 per cent.
Page 23
Table V (13) Reserve Requirements Prescribed by RBI for Commercial Banks
from 1991-92 to 2001-02
~ ~ - ~ S T a t u t O ~ ~ ~ ~ Liquidity Ratio Ratio
Source: Report on Trend arid Progress of Banks in India: various issues.
Similarlv as per section 24 of the Banking Regulation Act,
Commercial Banks in India are required to maintain, in addition to
Cash Reserve under section 42 of the RBI Act, a Statutory Liquidity
Ratio (SLR) in certain proportion of their Net Demand and Time
Liabilities (NDTL) between 25 per cent to 40 per cent in the form of
certain Liquid Assets.
Page 24
Fig V (2) Reserve Requirements Prescribed by RBI for Commercial
Banks from 1991-92 to 2001-02 60
Years
A S L R . CRR -t Total
Fig V(2) shows the SLR and CRR rates prescribed by the RBI from the
year 199 1 -92 to 200 1-02.
CRK and SLK have b ~ e n introduced mainly to safeguard the
interest of the depos~tors by ensuring that a part of the depositor's
money is kept in liquid form (under CRR requirement) and in near
liquid fornl of assets (under SLR requirement) as well as to regulate the
liquidity with banks w t h a view to control the money supply in the
economy Even though banks are free to mobilize deposits, they cannot
make use of all of them exclusively for lending and investment purpose
because of these regulatory requirements.
Page 25
It can be seen from Table V (13) that in the year 1991-92 the
total Reserve Requirements were 53.5 per cent (i.e, every Commercial
Banks had to keep 38.5 per cent in SLR and 15 per cent in CRR) and
the banks were left with only 46.5 per cent of the deposits for
deployment. The Reserve requirements show a sudden decrease
during the year 1996-97. The total Reserve requirements which were
45.50 per cent in 1995-96 have been reduced to 35.00 per cent in the
year 1996-97. By the year 2001-02 the SLR and CRR have been
continuously reduced and reached a level of 25 per cent and 5.5 per
cent respectively thus leaving sufficient funds (69.50 per cent) with the
banks for deployment.
Liquid h.md to Total Fund Ratio
This ratio reveals the percentage of Liquid fund maintained by
the banks during the period of study. The proportion of Liquid Fund to
Total Fund varies differentlv for different banks under study. In all
other banks except IOH, the ratio shows a declining trend during the
period. In IOB the ratio was only 38.881 per cent in the year 1991-92
and the same reached a level of 52.75 per cent by the end of the period
of study. FB keeps this ratio at a lower level from 1996-97 onwards as
compared to other banks and the ratio ranges between 51 per cent to
38 per cent during the period of study.
By comparing the Public Sector Banks with the Private Sector
Banks, it is revealed that Public Sector Banks have been keeping more
Page 26
funds in liquid form during the second phase of the Reform Period than
the Banks in the Private Sector
Table V (14) Liquid Fund to Total Fund Ratio of the Selected Banks
from 1991-92 to 2001-02 (Per cent)
1994-95 : 42.41
1995-96 ' 44.31
AAG Liquid Fund 17.41
Source: Compiled and Computed from Annual Reports of the Selected Banks.
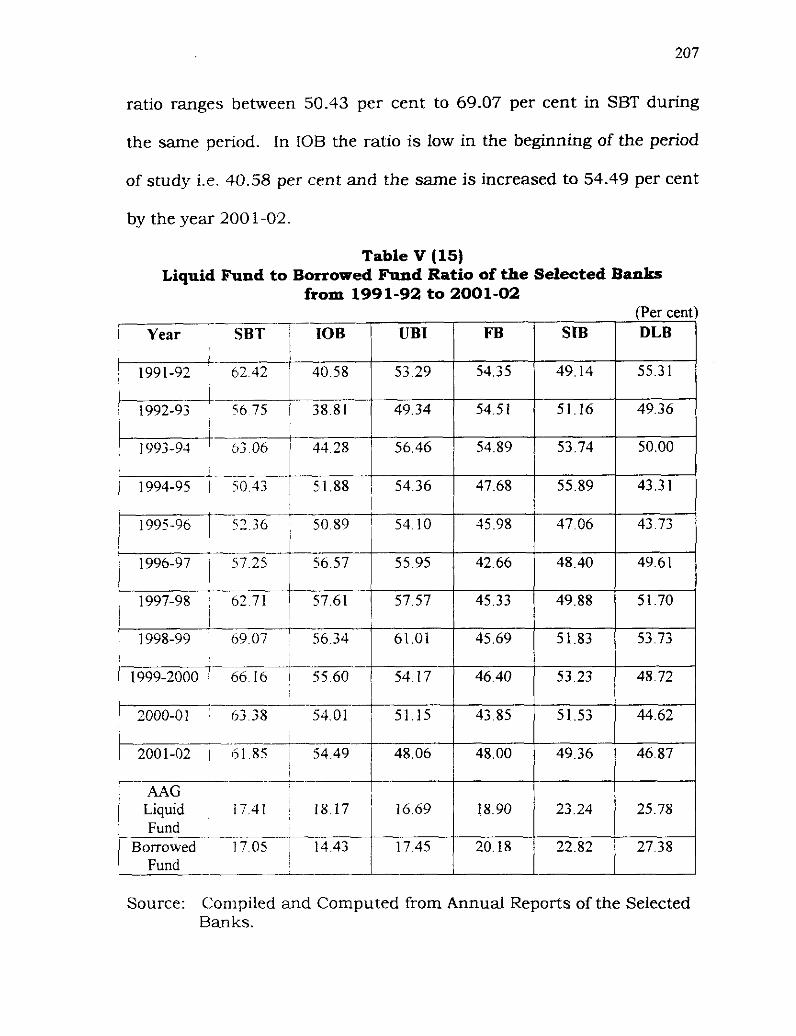
Liquid Fund to Borrowed Fund Ratio
This ratio reveals how much percentage of the borrowed funds is
kept by the banks in liquid assets. SBT keeps more funds in liquid
form as corrlpared to other banks during the period of study and the
Page 27
ratio ranges between 50.43 per cent to 69.07 per cent in SBT during
the same period. In IOR the ratio is low in the beginning of the period
of study i.e. 40.58 per cent and the same is increased to 54.49 per cent
by the year 200 1-02.
Table V (15) Liquid Fund to Borrowed Fund Ratio of the Selected Banks
from 1991-92 to 2001-02 -- (Per cent)
586 75 1 38.81
Source: Compiled and Computed from Annual Reports of the Selected Banks.
Page 28
In UBI, EPB and DL,B, the ratios show a declining trend over the
years where as in SIB the ratio shows a slight increase during the same
period. A s Liquid fund includes Investments, the increase in the ratio
is due to the increase in Investment. The Composition of ~ i q u i d Funds
of the selected banks (Table V (12)) has already revealed this.
Deployment
In case of surplus balance, banks have the option of either
maintaining cash balance or investing these excess funds in securities
or Loan Assets. By holding adequate cash reserve to eliminate
Liquidity Risk and by considering the income forgone while holding
cash balance. banks should make optimum use of its idle funds by
investing in such a way that the ylelds earned are higher. A s the SLR
and CRR have declined sharply during the Post-Reform Period,
especially in the second phase of Reform banks have sufficient funds
with them for deployment. The Advances to Borrowed Fund Ratio and
Investment to Borrowed Fund Ratio of the selected banks will reveal the
deployment pattern of the banks.
Advances to Borrowed Fund Ratio
This ratio shows the percentage of Advances deployed by the
banks out of the Borrowed Funds. In IOB, the Advances to Borrowed
Fund Ratio is high in the year 1991-92 (i.e. 57.42 per cent) as
compared to other banks and by the end of the year 2001-02 the same
reached the lowest position of 44.19 per cent. In all other banks the
ratio has shown an increasing trend over the years. Banks have been
Page 29
able to deploy more funds in Advances due to reduction in SLR and
CRR.
The AAC, of Advances of all other banks except IOB is higher than
the AAG of Borrowed funds during the period of study.
Table V (16)
Advances to Borrowed Fund Ratio of the Selected Banks
from 1991-92 to 2001-02
AAG ! 17.80 11.71 I
19.63 i
23.79 Advances : i
Borrowed 1 17.05 i 14.43 17.45 20.18 22.82 Fund ~
- (Per cent)
Source: Compiled and Computed from Annual Reports of the Selected Banks.
Year SBT T-708 I
SIB LIB1 DLB FB
Page 30
Investment to Borrowed Fund Ratio
Investlr~ent to Bol~owed Fund Ratio reveals the amount deployed
by the banks for Investment out of the Borrowed Funds. The ratios
show a n increasing trend during the period of study in all the selected
banks. In the category of Public Sector Banks, in SBT, IOB and UBI,
the ratios ha.ve increased from 34.42 per cent, 30.77 per cent and
35.97 per cent in 1991.-92 to 47.12 per cent, 43.92 per cent, and 36.46
per cent respectively by the year 2001-02.
Source: Compiled and Computed from Annual Reports of the Selected Banks.
Table V ( 17) Investment to Borrowed Fund Ratio of the Selected Banks
from 1991-92 to 2001-02
UBI
1991-92 34.42 , 30.77 1 35.97
-34 .15 2949 ! 35.15
1993-94 ' 1 1 . 3 7 j 40.33 43.08
FB
29.72
33.15
32.45
35.28
28.90
29.78
35.55
35.79
38.96
37.89
40.65
24.36
I
1 1994-95 1 35 99 ! 36.96 -..A - .
1995-96 1 33.43 i 36.81
36.75
33.81
SIB
31.65
32.3 1
36.20
39.98
31.98
35.99
36.09
35.14
41.05
39.98
34.71
24.80
(Per cent) DLB
30.73
29.18
32.46
29.31
25.22
25.84
31.70
32.50
37.08
34.65
36.68
29.18
36.94
1997-98 43 47 35.56 1 38.07 I
41.09 --
34.50
36.82 1 4 47 12 1 43.12 36.46
27.38
21.49 / 19.16 Investment 1 i Borrowed 1 20.18
18.27
22.82 I
17.45 Fund , I !
Page 31
In the category of Private Sector banks, FB, SIB and DLB have
shown an increase in the ratio, from 29.72 per cent, 31.65 per cent and
30.73 per cent in 1991-92 to 40.65 per cent, 34.71 per cent and 36.68
per cent respectively by the year 2001-02.
The Average Annual Growth of Investment of the selected banks
is more than the Average Annual Growth of Borrowed Funds. In the
Post-Reform Period with the declining Reserve Requirements (in SLR
and CRR), banks have more funds in their hands and have invested
substantial portion of the Borrowed Funds in Investments in the light
of high NPA.
While comparing ,the deployment pattern of the selected banks
during the period of study certain inferences can be drawn.
1. Up to the year 1995-96 the Advances to Borrowed Fund Ratio of
SBT is higher as compared to other banks (Table V (16)). After
1995-96, SBT concentrated more in Investments and the
Investment to Borrowed Fund Ratio of SBT (Table V(17)) is higher
as compared to other banks from 1996-97 to 2001-02.
2. In IOB the Proportion of Advances to Borrowed Fund shows a
dec1inin.g trend during the period of study (Table V (16))
3. During the period of study (i.e. up to 1995-96) the Ratio of
Advancis to Borrowed Fund of UBI (Table V (16)) is low as
compared to other banks where as the proportion of Investment
to Borrowed Fund (Table V (17)) i s higher except in the last three
years than those of the other selected banks.
Page 32
4. After 1095-96 FB has concentrated more on lending and the
Advances to Borrowed Fund Ratio of FB (Table V (16)) is higher
as compared to other banks during the same period.
5 . In SIB the deployment of Borrowed Funds in Investments and
Advances increases proportionately during the period of study.
6 . The Investment to Borrowed Fund Ratio of DLB (Table V (16)) is
low a s compared to other banks during the period of study DLB
is concentrating more on Advances and the AAG of Advances of
DLB is h.igh as compared to that of other selected banks.
Liquidity Risk Management
Ensuring adequate profitability and liquidity are the two
objectives underlying the concept of Asset Liability Management. The
cause and effect of Liquidity Risk are primarily linked to the nature of
the Assets and Liabilities..
Assets commonly considered as liquid like government securities
and other moi~ey market instruments could also become non-liquid
when the market players are unidirectional. Under ALM approach,
liquidity is tracked through maturity or cash flow mismatches. The
maturity profile could be used for measuring the future cash flows of
banks in different time buckets. While the mismatches up to one year
would be relevant since these provide early warning signals of
impending liquidity problems, the main focus should be on the short-
term mismatches because in liquidity management, availability of time
to correct the situation is very important.
Page 33
Table V (1 8) Liquidity Gap Statement of the Selected Banks for March 2000 and March 2001 (Rs. in Crores)
Date / Bank
I -L-
M:rrch2000 SBT ! I
Total outl1ow ( A )
Total Inflow (B)
Mismatch (B-A)
Cumulative Mismatch
Mismatch as a Percent of Outflow Total ournow (A)
Total lnflow (B)
Mismatch (B-A)
Cumulative Mismatch
Mismatch as a I'ercent of Outflow Total Outflow (A)
Total lnflow (B)
Mismatch (B-A)
Cumulative Mismatch
Misrnatcl~ as a Percent orolllllow ... .. . . .~
1-14 6 months 1 year
821.77 563 16 383.09 252.65 ".:.:11 216.95 1 611.86 -704 9 , - 390 .12 I I i 24.86 1 261.81 1 -35205 -1056.11 / -2116.86 I I
1-3 ycaru
5110 20 .. . . .
4413.99
-102621
-3177.07
-18.86
1 1 122 I3
5390 24
-573 I .80
-4998.32
-51.54
13580.81
11140.12
-2440.69
-172.16
-17.07
Total 3-5 ycara
222 15 , 805 20 12434 58 / 0 1 e r 5
>ears
Page 34
- Total Outllo~v (A)
Total lntlow ( U )
Datc
Mismatch (B-A)
Cumulative Mismatch
Bank
Mismatch as a Percent of Outflow Total 011lflow (A)
Total Inflow (B)
Mismatch (B-A)
Cumulative Mismatch
Particuli~rs
Mismatch as a Percent of Outflow Tolal Ot~lflow (A)
1-14 I 15-28 / 29 days-
Total Inflow (B)
Misn~atch (B-A)
3 - 6
Cumulative Mismatch
6 months
Mismatch as a Percent of Outflow
days -
'167 09
207 47
-69 62
-I85 05
-18.97
-- 90.93
90.98
0.05
8.87
0.05
- 45.01
4855
3.54
55.64
7.86
3 months
1094 24
loo') 5')
-24 65
-20') 70
-2.25
I4975
78.23
-7152
62.65
-47.76
294.32
72.72
-221.60
-277.24
-75.2')
months
819.02
484 2 2
-1 34.80
-544 50
-4088
146.34
82.40
-63.94
-126.59
-43.69
142.42
95.55
-46.87
-324.11
-32.01
-1 year
980.83
414 51
-566 32
- I 110 82
-57.74
241.47
124.03
-1 17.44
-244.03
48.64
162.95
84.21
-78.74
-02.85
-48.32
1-3 years
3391.91
2li4')I
-1257 00
-2367 82
-37.06
1056.02
1228 78
172.76
-71.27
16.36
663.40
556.65
-106.75
-509.60
-16.00
3-5 ycars
254.39
080 I I
731.72
-1636 i n
287.64
242.81
787.20
544.39
473.12
224.20
32.86
260.07
227.21
-282.39
691.45
years
1636.10
447.80 I
-473.12
0.00
-27.75
282.30
0.00
281.96
(Contd.. .)
Page 35
Total
. 14482.67
I I I i I I I I I I Mismatch as a Percent I of Outflow Total Ol~lflow iAi
Total Inflow (B)
Mismatch (B-A)
Cumulative Mismatch
Mismatch as a Percent of Outflow Total elfl low (A)
Total Inflow (B)
Mismatch (B-A)
Cumulative Mismatch
Mismatch as a Percent of Outflow
3-5 years
1276.37
1-3 years
6342.71
1 791.63
-484.74
-2474.41
Over 5 years
1688.67
66.24 I 2!.5? 1 -39.54 I 4.66 1 8 1 -17.93 / -37.98 1 I46 53 1
3 - 6 msnths
814 06
29 di~ys - 3 montlls
074.20
Particnlars
~ --
'Toiai inflow (R) I 1 !8!2 I9 1 621.21 1 107 51 1 152 0 2
3630.76
5797 23
2166.47
2166.47
59.67
9846.66
7188.06
-2658.60
-2658.60
-27.00
6 months - 1 year
2085 32
Mismatch (B-A)
1 629 55 1 52054l
1-14 tlilys
~
-1485.77
-852 36
15-28 days
Tol:ll 011lflo!\' (4 ) 1000 09
722.10 1 -1137.31
-1989 67
i I
30294.49
30294.49
I
38977.74
38977.74
1046.93
1129.00
82.07
2248.54
7.84
455.41
400.48
-54.93
-2713.53
-12.06
51 I 2 5
i O 9 . 9 6 - 2 0 6 . 0 1 I 37.96
72210 / 832.06 Cumulative Mismatch
565.45 / 603.41
25x3 42
1483.34
-1 100.08
114846
-42.58
1544.20
2100.12
555.92
-2157.61
36.00
2714.91 1 4213.16
1552.78 ' 4058 55
12947.50
4932.53
-8014.97
-8183.28
-61.90
12720.66
16342.23
3621.57
517.79
28.47
-1 162.13
-13.07
-42.81
1951.70
667.09
-1284.61
-3442.22
-65.82
-154.61
-168.28
-3.67
5028.87
5367.31
338.44
-3103.78
6.73
I
623.15
5292.49
4669.34
-3513.91
749.31
3093.65
1841.71
-1251.94
-734.15
-40.47
2534.66
6048.57
3513.91
0.00
138.63
4336.59
5070.74
734.15
0.00
16.93
Page 36
Date days
Total Inflow (B) 1 9711 61
Mismatch (B-A) 177 45 1 17145 Cumulative Mismatch 1 h4ismatch as a Percent 22.37
2!5&!!~** Tol;~l 011tIlow ( A )
Total Inflow (B) 260.38
Mismatch (B-A) -177.74
Cumulative Mismatch
Mismatch as a Percent -39.75 of Outflow
Total Inflow (B) 112.12
Mismatch (B-A) -21.21 21.21 Cumulative Mismatch
Mismatch as a Percent of Outflow - - - - .
15-28 29 days- 3 - 6 days 3 months months -1 year
-363.36 -4Y0.30 109 1 . Y I
I 1 7 0 3 5 -18anar , I -768.71
years
68.74
0 .00
20.61 / 37529 5470.i*
1661.50 5470 08
1537.25
0.00
342.72
373.78 1717.08
563.07 1717.08
189.29 . 50.64
Source: Compiled and Computed from ALM Reports of the Selected Banks
Page 37
A s per the Prudential Norms set by RBI every bank has to ensure
that the net outgo of funds during the coming 28 days should not
exceed 20 per cent of the total outflow of cash. A huge negative gap in
1-14 days and 15-28 days buckets of liquidity analysis exposes the
liquidity crunch of the banks. The negative gap in other buckets
bevond 28 days also needs effective control. The gap limits will become
the prudential exposure limits for short term, medium term and long-
term scenario.
From the table V (18)) it is revealed that during the year 2000 as
on 3 1 March only The Dhanalakshmi Bank (DB) showed a negative gap
of more than 20 per cent in the gap limit of 1 to 14 days. In FB the
negative Gap in 1 to 14 days and 15 to 28 days buckets is below 20 per
cent i.e. well ~vithin the prudential limit set by RBI. In all other banks
the gap is positive in the time buckets of 1 to 14 days and 15 to 28
days. During the year 200 1 as on 3 1 March, Union Bank of India (UBI)
and the South India Bank (SIB) showed negative mismatch of more
than 20 per cent in the time bucket of 1 to 14 days and 15 to 28 days.
In DLB the gap is negative in 1 to 14 days but below the prescribed
norm of 20 per cent. I n all other banks the gap is positive in the same
bucket. No prudential limit is prescribed by RBI in time buckets for
more than 28 days. Banks are free to set high tolerance level for higher
time buckets. From ciiscussion with the Bank Management of the
selected ban:ks, it is revealed that generally banks keep negative
Page 38
mismatch up to 40 per cent in the time buckets of 29 days to 3 months
and over 3 months and up to 6 months.
From the Ratio Analysis and Liquidity Gap Statement Analysis it
can be inferred that the banks under study are not facing any liquidity
crunch. By k:eeping the idle funds at optimum level, banks have been
able to deploy more funds in Advance and Investment.
Liquidity Risk Management at the Branch Level
The Liquidity Risk Management at the branch level focuses on
the following aspects.
Mismatch at the Branch level
Only 28.3 per cent: of the respondents take into consideration the
maturity of deposits and advances while deploying funds. Majority of
the bank managers (63.4) do not consider the maturity of deposits and
advances while doing business. 8.3 per cent of the bank managers
contacted is of the opinion that it is not possible at the branch level to
consider the matching of Assets and liabilities.
Table V (19)
Loan Portfolio and Maturity of Deposit Match (Per cent)
-- - Yes
Consider matching of Deposits
and Advances at Branch level 28.3
Source: Survey Report
No
63.4
Not possible
8.3
Page 39
Deployment of h d s
The liquidity level .to be maintained by a bank should provide for
deposit withdrawals and accommodate any increase in credit demand.
When the profits are showing increasing growth rates banks would
prefer to maintain tigh~ter liquidity position by utilising the cash
balances for in.vestment or loan disbursals, which will further improve
its profitability levels.
Table V (20)
Preference for Deployment of Funds
1-_.
Source: Survey ~ e ~ o < - I
Opinion ionof Managers
~ e & ; i n ~ more funds in Investment
75 per cent of the managers interviewed, prefer to deploy the
funds for lending purpose. 25 per cent of the managers gave their
opinion that cieploy~ng more funds in Investments will bring better
results to the bank.
Embedded Option Risk
The unpredictability of deposit withdrawals, prepayment of loans,
changes in demand for loan and the uncertainty about volatility in
inter- institutional call and tern-market may lead to great Liquidity
Risk for the banks. Any liquidity problem due to heavy withdrawal of
deposits and pre-payment of loans may force banks to borrow large
Frequency
15
Percentage
25
Page 40
quantum of funds from inter-bank call market at high rates. If such
occurrences are frequent or for a prolonged period, it may seriously
affect the pi-ofitability of the banks. In order to reduce the embedded
option (premature withdrawal of Deposits or closure of Advances)
managers ol'fer different suggestions.
Table V (2 1) Embedded Option Risk
pa Precautions to be taken i
1 'c Commitment charge on Cash Credit 3.40
Per cent
b I
L I Eff'ectiveness.
Source: .s-;vey Report
- -- --
Chang~n_e Penal Interest
Majority of the bank managers (66.60 per cent) opined that by
30 00
persuasion unnecessary withdrawal or closure of funds can be reduced.
30 per cen3t of the managers recommended changing penal interest for
embedded option of customers while 3.4 per cent pointed out the
possibility of imposing commitment charge on Cash Credit not
withdrawn by the borrowers.
86.7 per cent of the respondents do not find any of these
precautions effective while 13.3 per cent are not confident of the
effectiveness of their suggestion.
Page 41
Table V (22) Maturity Pmffle of Foreign Currency Assets and Foreign Currency Liabilities of the Selected Banks for March 2000
and March 2001 (RE. in Lakha) Over 5 years
6 months - 1 year
16540
28-3 months 36707 6260
.- FC A 36251
- 16540 10977
1-3 years
29587
3-6 months
2229 11525
1-14 days
28695 18287
Total
82739 83708
-969 (-1.17%)
Year
2000
T~;;;;I j 10x141 j h312I i 1600x5 138414 10778
3-5 years 15-28 days
15108 1509
Gap
! :(;I3
-- I
Bank
SBT
Particulars
FCA FCL
r Fc:, Gap FC A / UBI FCI. 162961 32723 8 1 2 7 7 5 5 2 56205 7 5
6047 (1.33%) 24781 1
- - , - , - I 8l007 I 4.10XI 1 120577 j 5hh64 1 53660 / 33830 /
17508 5489
890
1127 -
13496
-
I
1
21715 52181
_I ~ , Gap 1 8487(;34.24*?6)
58871
2178 /
2001 Marc11
Soi~rcc:
- ~..
3669
5448
613 11152
29148 6877
82376 42827
79173 1 1763
- 8163 2925
11474 200
1074 1705
5921 1 27918 44634 49867 7330
44465 /
FB
SIB
.~ ~~
DLB
SBT
10B
UBI
FB
SIB
DLB
Stntislicnl
1252 4733
3689
453 42 1
39358 12387
54931 11159
53768 25854
4299 X070
7645 2633
2643 1136
FCA FCL Gap FCA FCL Gap FCA FCL Gap FCA FCL Gap -- FCA FCL Gap FCA FCL A n € !
1074 9796
3351 97
1700 1151
860 18512
30569 66475
56814 55267
123 15061
233 1 2687
3999 2792
- I 17303
15177
699
41689
58638 66636
17180 42658
27092
5106
5888 36917
-3 1029(-526.98) 25162 25258
-96 (-.38%) 3385 4354
-969(-28.62%) 97160 97334
-174 (-O.I8%) - 372790 364832
7958 (2.13%)
594 I 632
and 2000-01
574
11365 9984
428 5 44
16408 16877
71490 73067
~.. ~
842
1309
191 85
11386 992
35533 16998
--
13626 618
4090 188
2146 2189
FCA FCL Gap FCA FCL Gap FCA FCL
12322 3005
T:lblcs rcl;~liag to Batiks in Indi:~ (RBI) 1099-2000
255863 164673
91 190 (35.64%) __ 33279 54398
-2 I I I9 (413.46'%) 25540 243 10
1230 (4.82%) 9862 7822
2040 (20.68%)
35716 26126
Page 42
(c) Foreign Exchange Risk
Banks undertake operations in foreign exchange like accepting
deposits, making loans and advances and quoting prices for foreign
exchange transactions. Dealing in different currencies brings
opportunities as also risks. If the liabilities in one currency exceed the
level of assets in the s a n e currency, then the currency mismatch can
add value or erode value depending upon the currency movements.
The simplest way to avoid Currency Risk (Foreign Exchange Risk) is to
ensure that mismatches, if any, are reduced to zero or near zero.
The maturity profile of Foreign Currency Assets (FCA) and
Foreign Currency Liabilities (FCL) in Table V (22) revealed that in SBT,
IOB and SIB the risk is minimum. The currency mismatch is very high
in FB, followed by UBI and DLB, leading to high risk for the banks.
Table V (23) Computerisation and Awareness of ALM
(Per cent)
/Awarenessof~ tools Yes KO I
-. -- Details Fully computerised
I Partially
computerised
_ _ _ I I 1 Source: Survey Report
& I
60 per cent of the selected branches are fully computerised and
the Branches 1 60
1 Training to Managers I 60
40 per cent of the branches are partially computerised. 92 per cent of
40
40
the managers are aware of the ALM tools and techniques and 38 per
Page 43
cent of the other officers have the awareness of the ALM techniques.
Out of the selected branch managers 60 per cent have attended
training programmes in ALM.
ALM Concept at the Head Office Level
The head office of a bank, whether in the public or private sector,
is the virtual nerve centre that commands and controls the branches.
Strategies and policy level decisions are evolved at the head office and
the feed back after the branch level implementation of such strategies
and policies is collected and analysed by the departments at the head
office of the banks.
On the basis of an Interview Schedule, Structured Interviews
were conducted at the head office level of the banks under study, in
order to evaluate the implementation of ALM strategies. The following
information has been collected and consolidated.
According the RBI norms ALM as a concept has been introduced
in the selected banks in the years 1997, 1998 and 1999. SBT, IOB,
UBI and FB have separate ALM departments while SIB and DLB have
no separate departments for ALM process. In SIB and DLB it is co-
ordinated with the Planning Department of the concerned banks.
Every bank has Asset Lia.bility Committee (ALCo) support group to co-
ordinate Interest Rate Risk, Liquidity Risk and Credit Risk. All the
Assets and Liabilities of the selected banks have been covered under
the ALM system by the year 2000. The primary role of bank branches
in the ALM process is the timely submission of data to the head office.
Page 44
The ALM departments have admitted that in the case of old generation
Private Sector / Public Sector Banks, collection of data from the wide
network of branches spread along the length and breadth of the
country (mostly not fully computerized) has been a great challenge.
The short-term effectiveness of ALM process can be measured by
analysing Net Interest Income (NII) and long-term effect can be
measured by evaluating the Market Value of Equity (MVE). But no
bank has evolved a suitable technique to measure MVE as yet.
In order to quantify the Interest Rate Risk, the banks are
following the simplest method of Maturity Gap. Interest Rate
Sensitivity Statements are being prepared on a monthIy basis to assess
the Interest Rate Risk. Tolerance levels are fued by the banks for
fluctuations in Rate Sensitive Assets and Rate Sensitive Liabilities.
Normally, 25 per cent variation of NII of the previous financial year is
considered as a prudential limit by the banks.
In order to manage the long term Liquidity Risk, banks are
following both Asset Management (Sale of Securities) and Liability
Management (Borrowing funds when the need arises) and to manage
the short tern1 Liquidity banks prefer Cash Flow Approach rather than
Working Fund Approach. To avoid the liquidity crisis banks are
statutorily bound to maintain 5.5 per cent of its NDTL as balance with
RBI. Need based cash holding limits are fued f ~ r individual branches
and adhered to as f a r as possible by Head Offices.
Page 45
For the purpose of measuring the Liquidity Risk, Maturity Gap
method is followed in the banks. For this, banks have been classifying
the oufflows ;and inflows into time buckets as fured by the RBI and
Monthly Liquidity Statements are prepared by the head office of the
banks to measure the Liquidity Risk. RBI has fured tolerance levels in
negative misrriatch in the time buckets of 1 to 14 days and 15 to 28
days a s not more than 20 per cent. From discussion with the bank
officials, it IS revealed that banks have also fured higher tolerance level
in higher maturity buckets in order to analyse the Liquidity Risk i.e.
for 29 days to 3 m0nth.s (40 per cent), over 3 months and up to 6
months (50 per cent) over 6 months and up to one year (50 per cent)
and one year to 3 years (50 per cent).
In order to reduce the impact of embedded option (prepayment of
loans and premature closure of deposits) empirical studies have been
undertaken by the Head Office at their computerized branches. Based
on the behavic~ural pattern and Trend Analysis on historical data, the
Embedded Option Risk is factored in. From discussion with the
officials in the ALM section of the selected banks, it is revealed that as
a precaution for premature closure of deposits, banks are keeping
around 35 per cent of its Net Demand and Time Liabilities (NDTL) as
against the statutory requirement of 25 per cent in SLR securities.
In practice banks are not classifying their Deposits and Advances
on the basis of behavioural pattern. By analysing the behavioural
maturity profil'e banks have found that around 90 per cent of the
Page 46
deposits are renewed on maturity. Eight per cent of Off-balance Sheet
Items are default on due date. The banks under study are in the
piocess of evolving a contingency plan to overcome the specific liquidity
crisis, if any, ;arising due to changes in behavioural pattern of Deposits
and Advances.