61
Introduction to Renagel Management of CKD complications – Bone disease Goce Spasovski, R. Macedonia Istanbul, Istanbul, June 4, 2011 June 4, 2011
Introduction to RenagelManagement of CKD
complications –
Bone disease
Goce Spasovski, R. Macedonia
Istanbul,Istanbul,
June 4, 2011June 4, 2011
Bone disease –
a part of CKD -
MBD
CKD -
MBD
Changes in mineral and hormonal metabolism
Bone disorder
Vascular calcification and cardiovascular disease
Treatment options
Session Objectives -
Mineral and Bone Disorders (MBD)
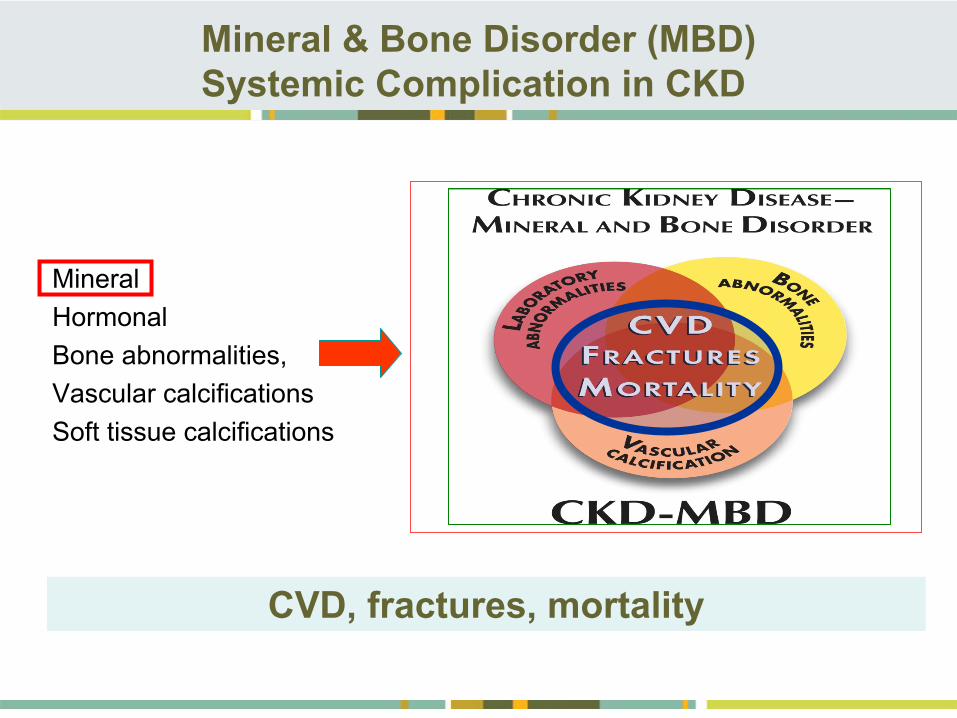
Mineral & Bone Disorder (MBD) Systemic Complication in CKD
•
Mineral•
Hormonal•
Bone abnormalities,•
Vascular calcifications•
Soft tissue calcifications
CVD, fractures, mortality
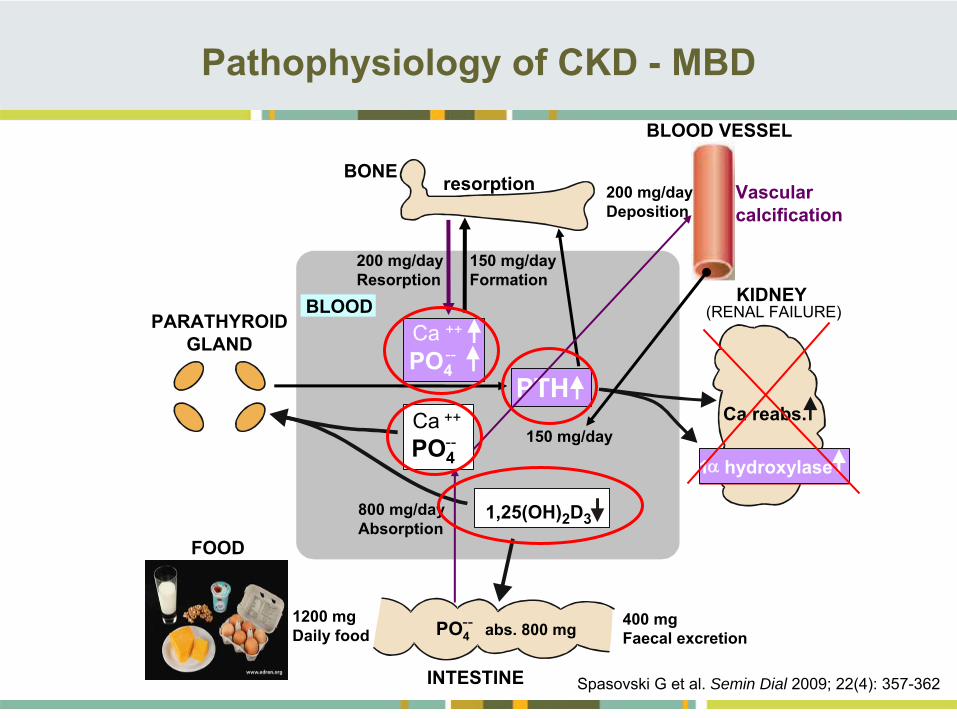
1,25(OH)2D3
Ca reabs. PTH
resorption BONE
KIDNEY(RENAL FAILURE)PARATHYROID
GLAND
BLOOD
Ca ++
1 hydroxylase
1200 mg Daily food PO4
abs. 800 mg--
Ca ++
PO4--
PO4--
800 mg/dayAbsorption
200 mg/dayResorption
400 mg Faecal excretion
150 mg/dayFormation
150 mg/day
200 mg/dayDeposition
Vascular calcification
BLOOD VESSEL
INTESTINE
FOOD
Pathophysiology of CKD -
MBD
Spasovski G et al. Semin Dial 2009; 22(4): 357-362
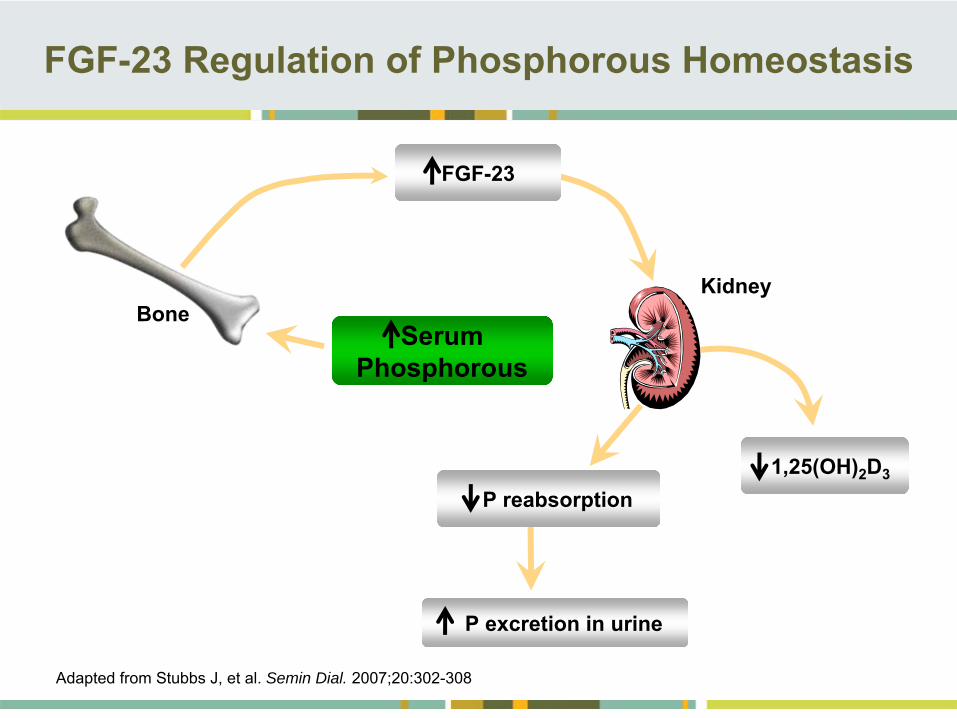
Serum Phosphorous
FGF-23 Regulation of Phosphorous Homeostasis
Adapted from Stubbs J, et al. Semin Dial. 2007;20:302-308
1,25(OH)2
D3
P reabsorption
Kidney
FGF-23
P excretion in urine
Bone
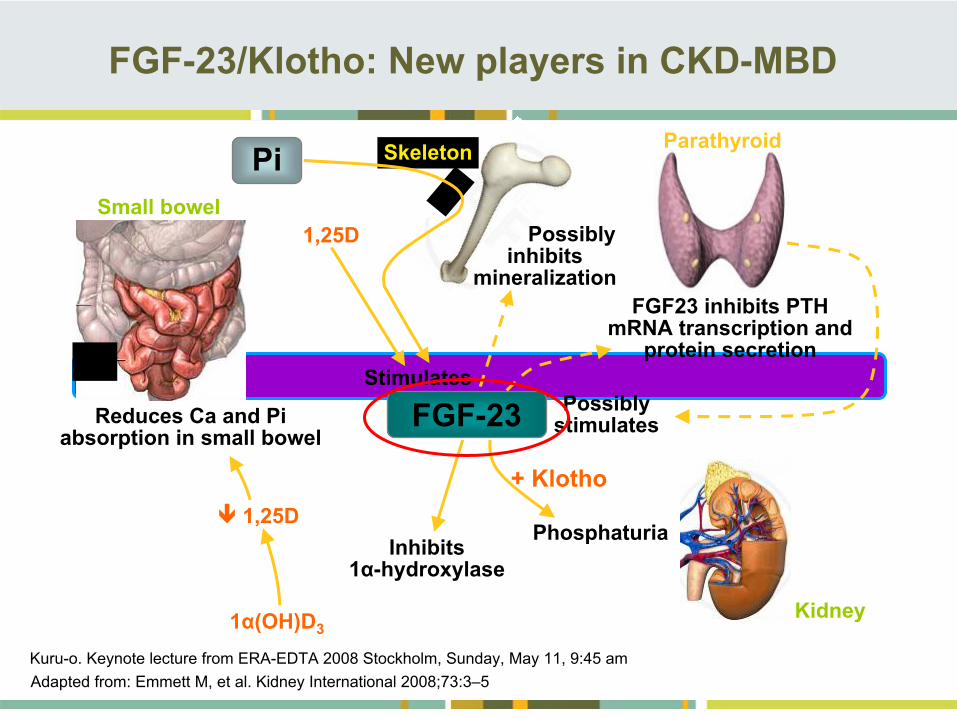
FGF-23/Klotho: New players in CKD-MBD
Adapted from: Emmett M, et al. Kidney International 2008;73:3–5Kuru-o. Keynote lecture from ERA-EDTA 2008 Stockholm, Sunday, May 11, 9:45 am
Pi
1,25DSmall bowel
Reduces Ca and Pi absorption in small bowel
1,25D
1α(OH)D3
Inhibits 1α-hydroxylase
FGF-23
Parathyroid
Possibly stimulates
Phosphaturia
+ Klotho
Stimulates
Skeleton
Possibly inhibits
mineralizationFGF23 inhibits PTH
mRNA transcription and protein secretion
Kidney
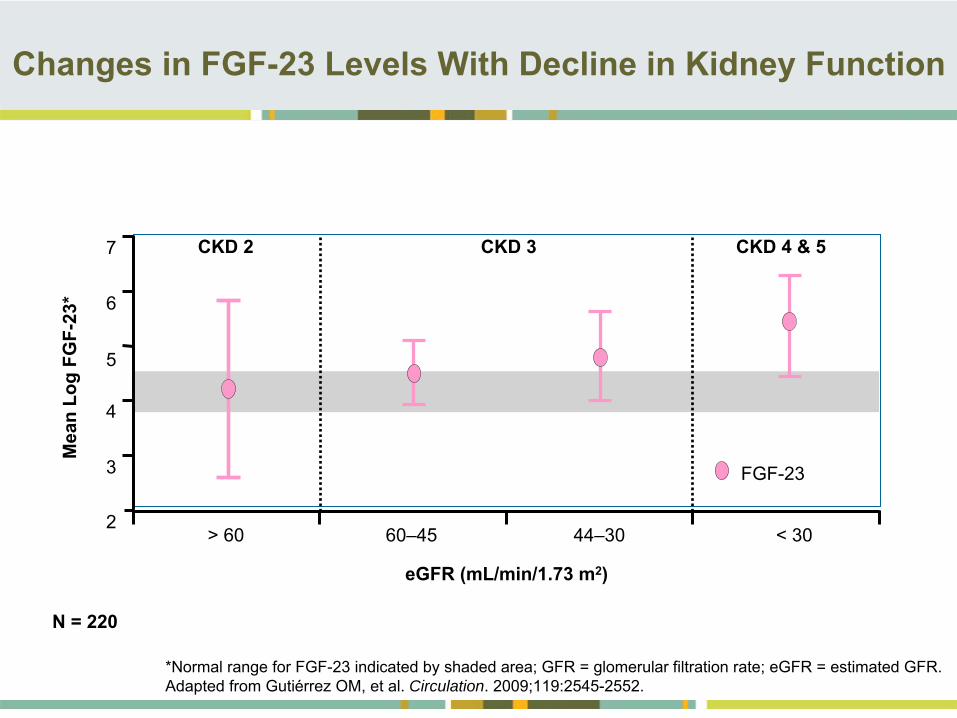
Changes in FGF-23 Levels With Decline in Kidney Function
*Normal range for FGF-23 indicated by shaded area; GFR = glomerular filtration rate; eGFR = estimated GFR. Adapted from Gutiérrez OM, et al. Circulation. 2009;119:2545-2552.
eGFR (mL/min/1.73 m2)
N = 220
2
3
4
5
6
7
Mea
n Lo
g FG
F-23
*
> 60 60–45 44–30 < 30
FGF-23
CKD 2 CKD 3 CKD 4 & 5
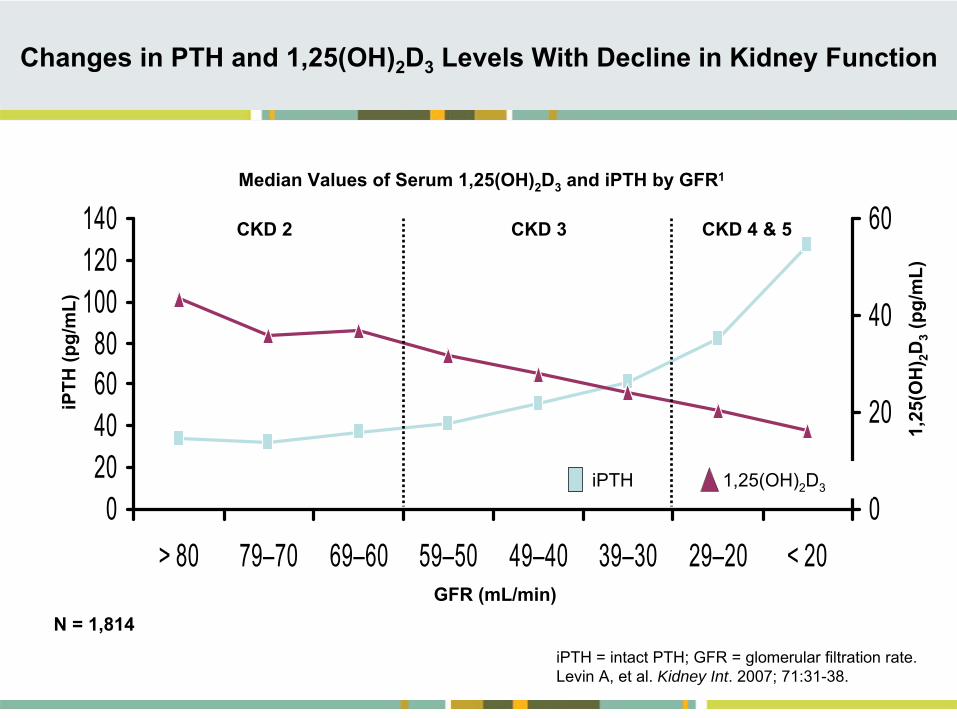
Changes in PTH and 1,25(OH)2
D3
Levels With Decline in Kidney Function
iPTH = intact PTH; GFR = glomerular filtration rate. Levin A, et al. Kidney Int. 2007; 71:31-38.
N = 1,814
020406080
100120140
> 80 79–70 69–60 59–50 49–40 39–30 29–20 < 200
20
40
60
iPTH
(pg/
mL)
1,25
(OH
) 2D3
(pg/
mL)
GFR (mL/min)
iPTH 1,25(OH)2
D3
Median Values of Serum 1,25(OH)2
D3
and iPTH by GFR1
CKD 2 CKD 3 CKD 4 & 5
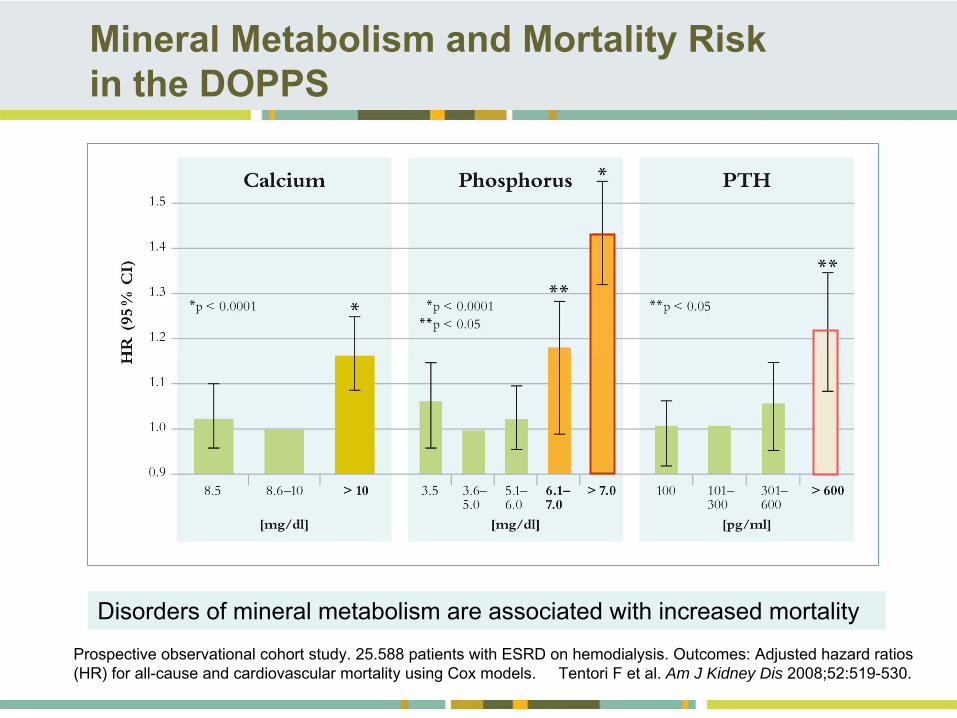
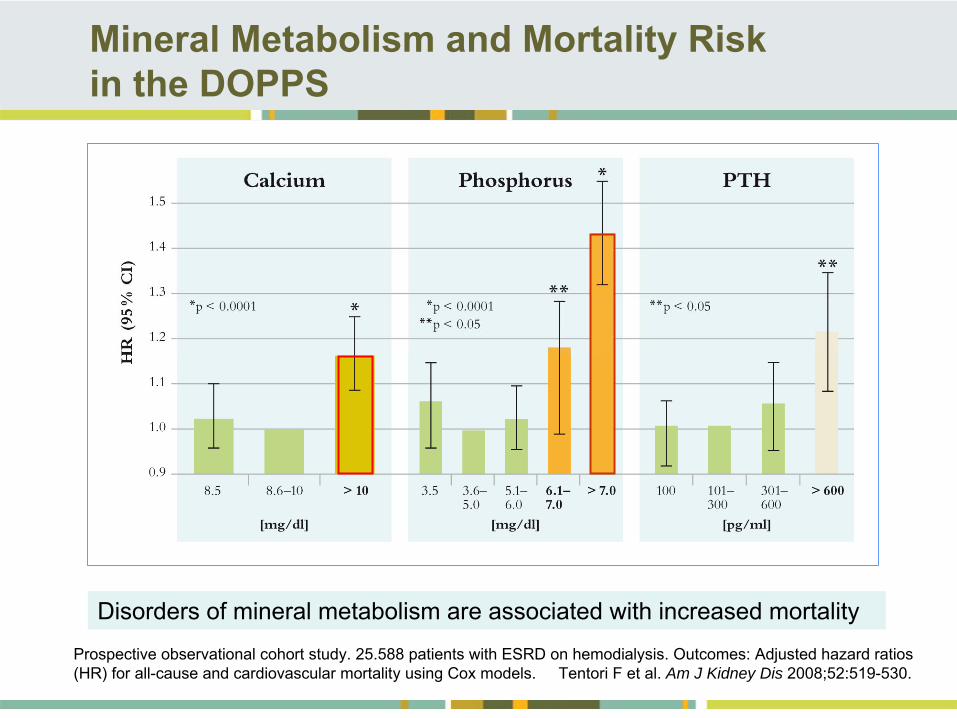
Mineral Metabolism and Mortality Risk in the DOPPS
Prospective observational cohort study. 25.588 patients with ESRD on hemodialysis. Outcomes: Adjusted hazard ratios (HR) for all-cause and cardiovascular mortality using Cox models. Tentori
F et al. Am J Kidney Dis 2008;52:519-530.
Disorders of mineral metabolism are associated with increased mortality
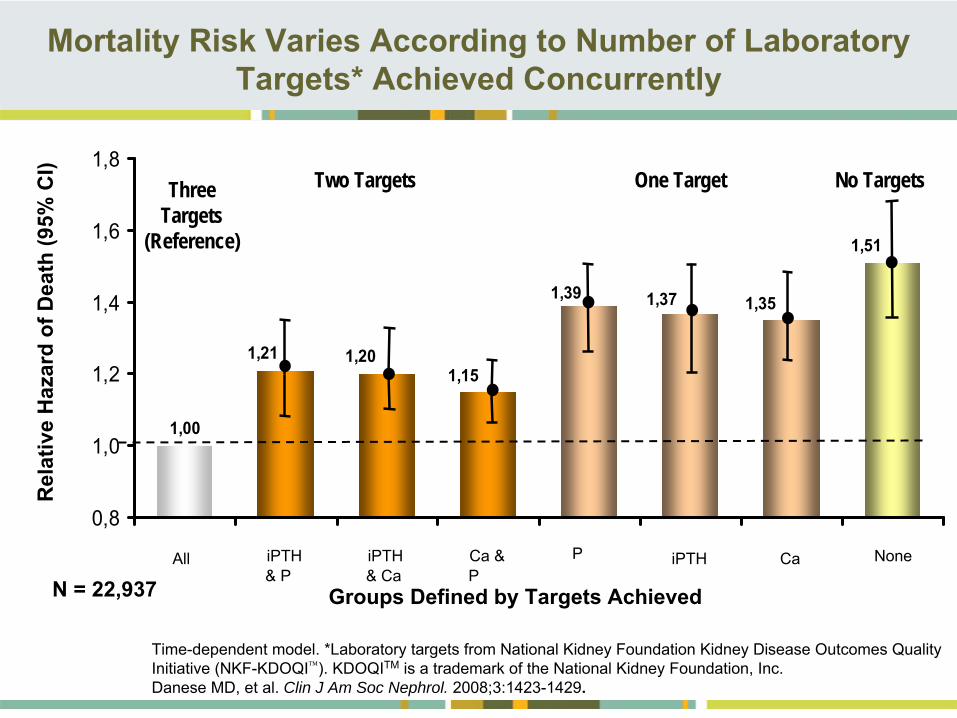
Mortality Risk Varies According to Number of Laboratory Targets* Achieved Concurrently
Time-dependent model. *Laboratory targets from National Kidney Foundation Kidney Disease Outcomes Quality Initiative (NKF-KDOQI). KDOQITM
is a trademark of the National Kidney Foundation, Inc.Danese MD, et al. Clin J Am Soc Nephrol. 2008;3:1423-1429.
iPTH & Ca
Ca &
P
P iPTH Ca NoneAll iPTH & P
Groups Defined by Targets Achieved
1,00
1,21 1,201,15
1,39 1,37 1,35
1,51
0,8
1,0
1,2
1,4
1,6
1,8No TargetsThree
Targets (Reference)
Two Targets One Target
Rel
ativ
e H
azar
d of
Dea
th (9
5% C
I)
N = 22,937
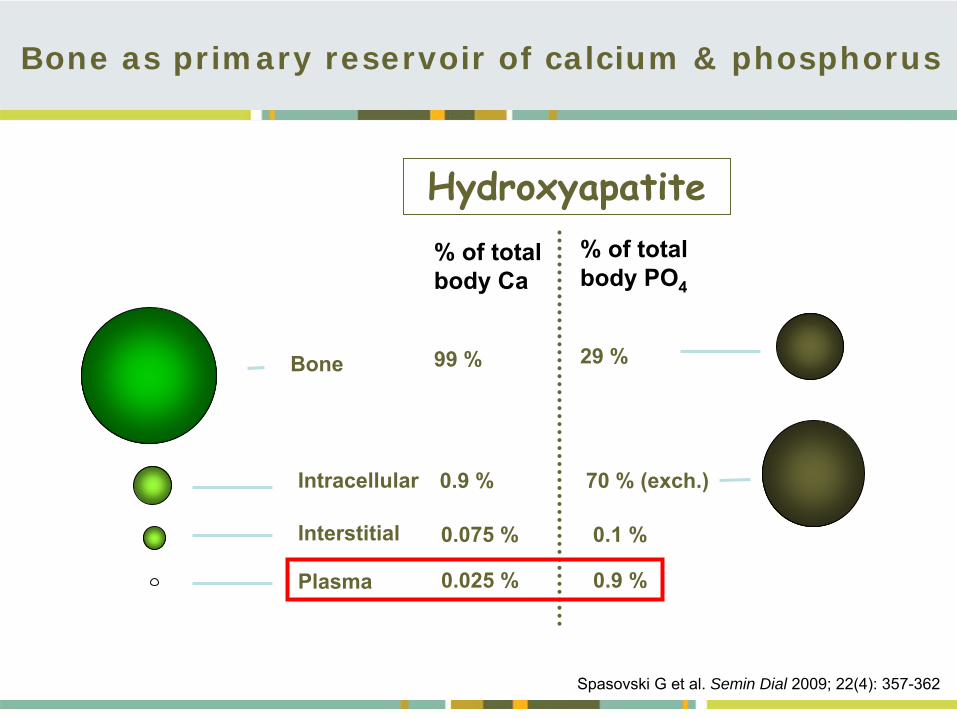
Bone as primary reservoir of calcium & phosphorus
Bone
Intracellular
Interstitial
Plasma
% of total body Ca
99 %
0.9 %
0.075 %
0.025 %
% of total body PO4
29 %
70 % (exch.)
0.1 %
0.9 %
Hydroxyapatite
Spasovski G et al. Semin Dial 2009; 22(4): 357-362
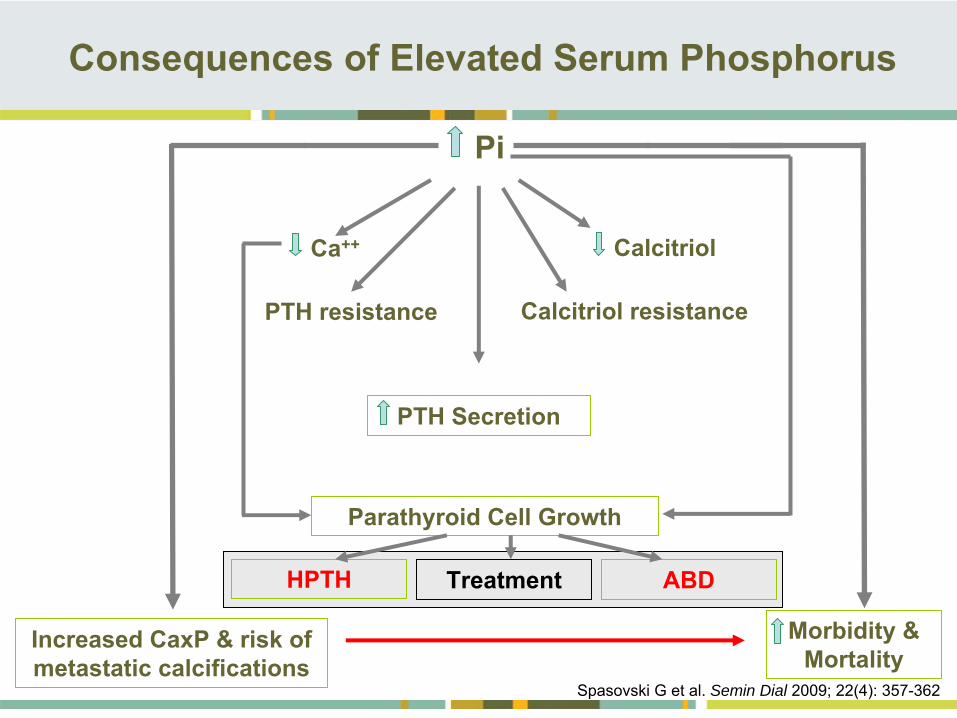
Pi
PTH Secretion
Parathyroid Cell Growth
Increased CaxP & risk of metastatic calcifications
Morbidity & Mortality
Ca++
PTH resistance
Calcitriol
Calcitriol resistance
Consequences of Elevated Serum Phosphorus
Treatment ABDHPTH
Spasovski G et al. Semin Dial 2009; 22(4): 357-362
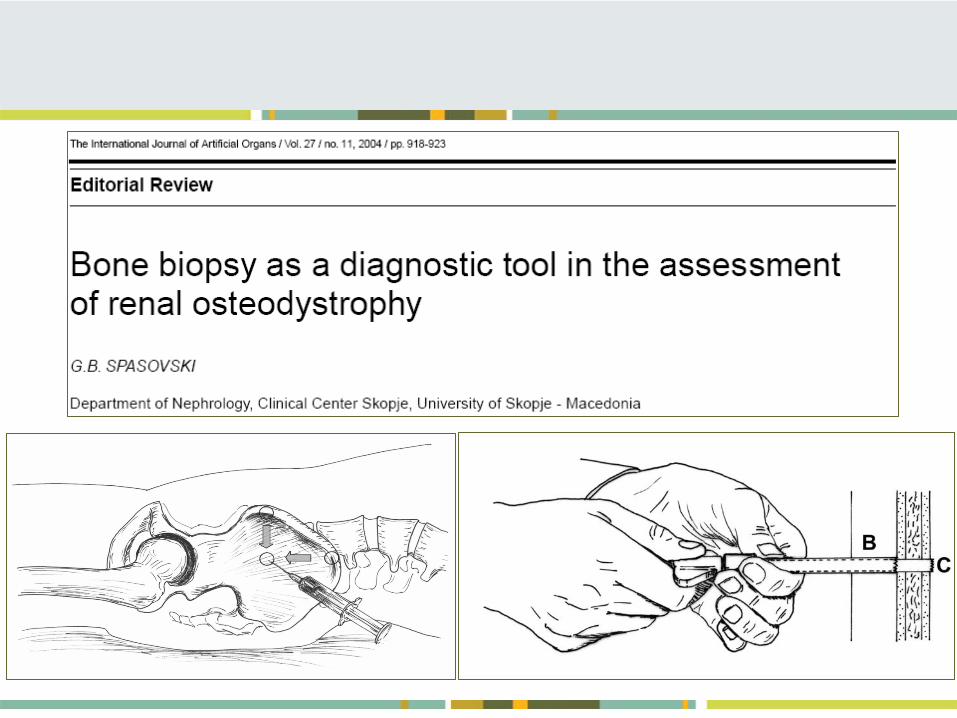
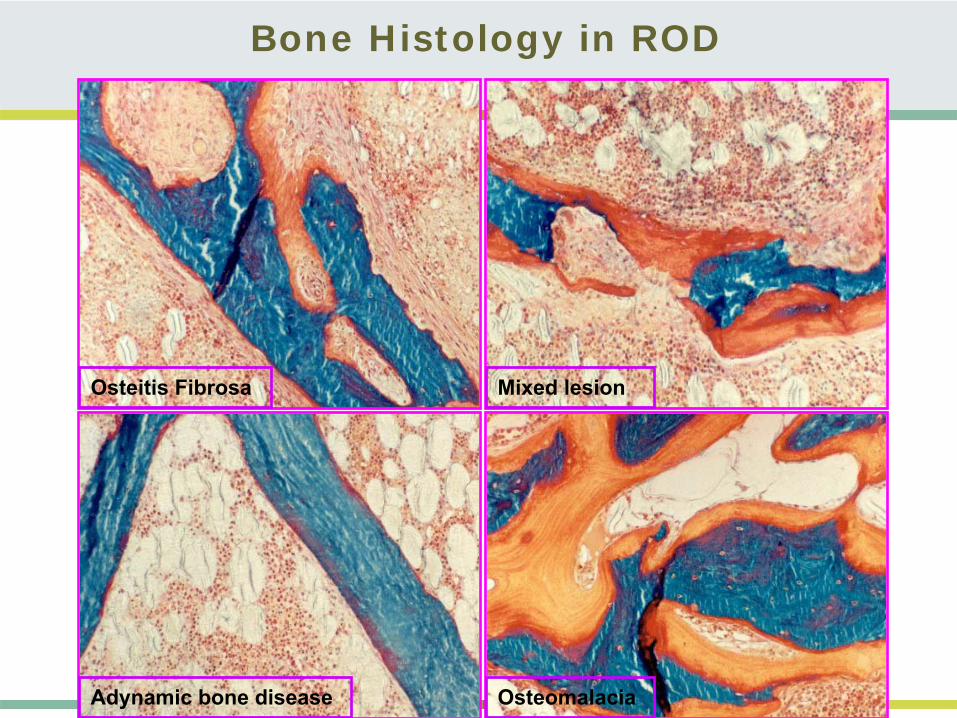
Bone Histology in ROD
Mixed lesion
Osteomalacia
Osteitis Fibrosa
Adynamic bone disease
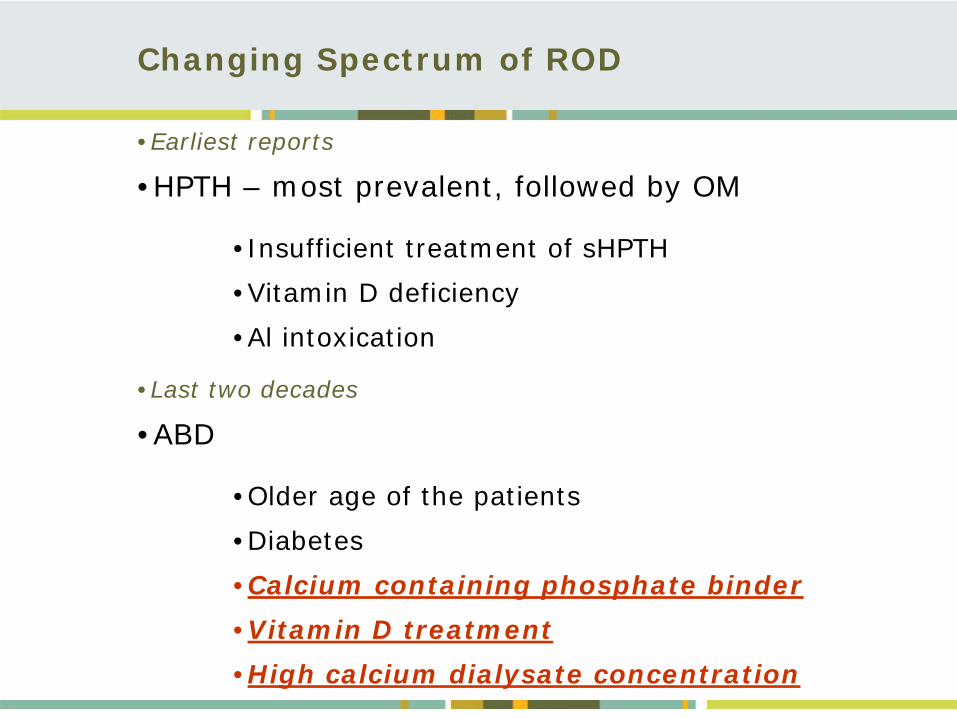
•Earliest reports
•HPTH – most prevalent, followed by OM
•Insufficient treatment of sHPTH•Vitamin D deficiency•Al intoxication
•Last two decades
•ABD
•Older age of the patients •Diabetes•Calcium containing phosphate binder•Vitamin D treatment•High calcium dialysate concentration
Changing Spectrum of ROD
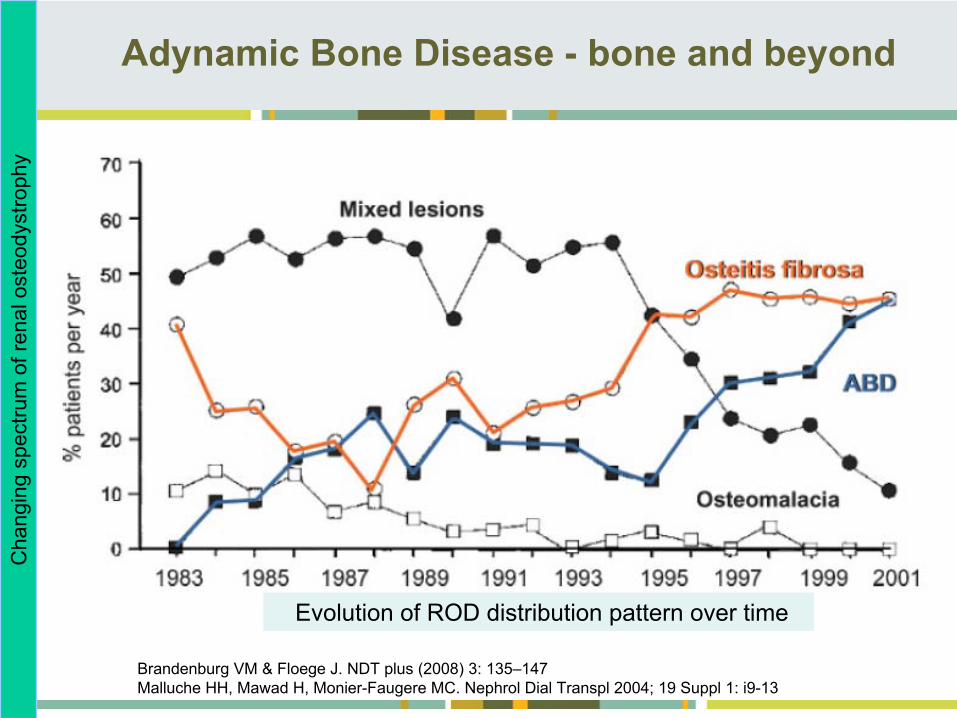
Adynamic Bone Disease -
bone and beyond
Brandenburg VM & Floege J. NDT plus (2008) 3: 135–147Malluche HH, Mawad H, Monier-Faugere MC. Nephrol Dial Transpl 2004; 19 Suppl 1: i9-13
Cha
ngin
g sp
ectru
m o
f ren
al o
steo
dyst
roph
y
Evolution of ROD distribution pattern over time
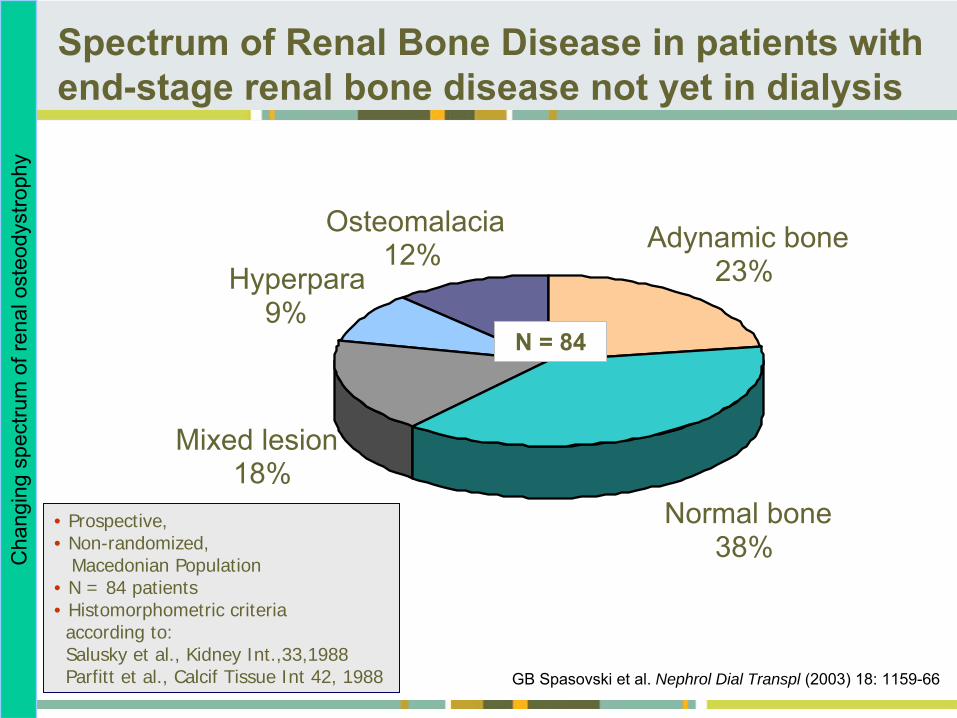
GB Spasovski et al. Nephrol Dial Transpl (2003) 18: 1159-66
Normal bone38%
Mixed lesion18%
Hyperpara9%
Adynamic bone23%
Osteomalacia12%
• Prospective,• Non-randomized,
Macedonian Population• N = 84 patients• Histomorphometric criteria
according to:Salusky et al., Kidney Int.,33,1988 Parfitt et al., Calcif Tissue Int 42, 1988
N = 84
Cha
ngin
g sp
ectru
m o
f ren
al o
steo
dyst
roph
ySpectrum of Renal Bone Disease in patients with end-stage renal bone disease not yet in dialysis
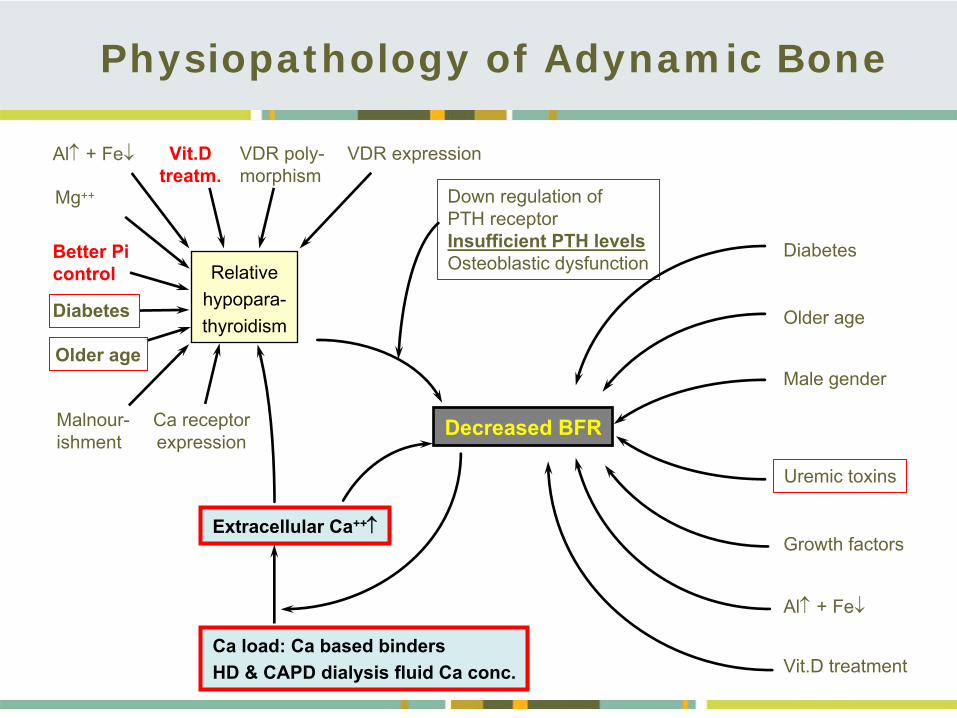
Down regulation ofPTH receptorInsufficient PTH levelsOsteoblastic dysfunction
Uremic toxins
Decreased BFR
Relativehypopara-
thyroidism
Al
+ Fe Vit.Dtreatm.
VDR poly-morphism
Better Picontrol
Diabetes
Older age
Malnour-ishment
Ca receptorexpression
Extracellular Ca++
Ca load: Ca based bindersHD & CAPD dialysis fluid Ca conc.
Diabetes
Older age
Male gender
Growth factors
Al
+ Fe
Vit.D treatment
VDR expression
Mg++
Physiopathology of Adynamic Bone
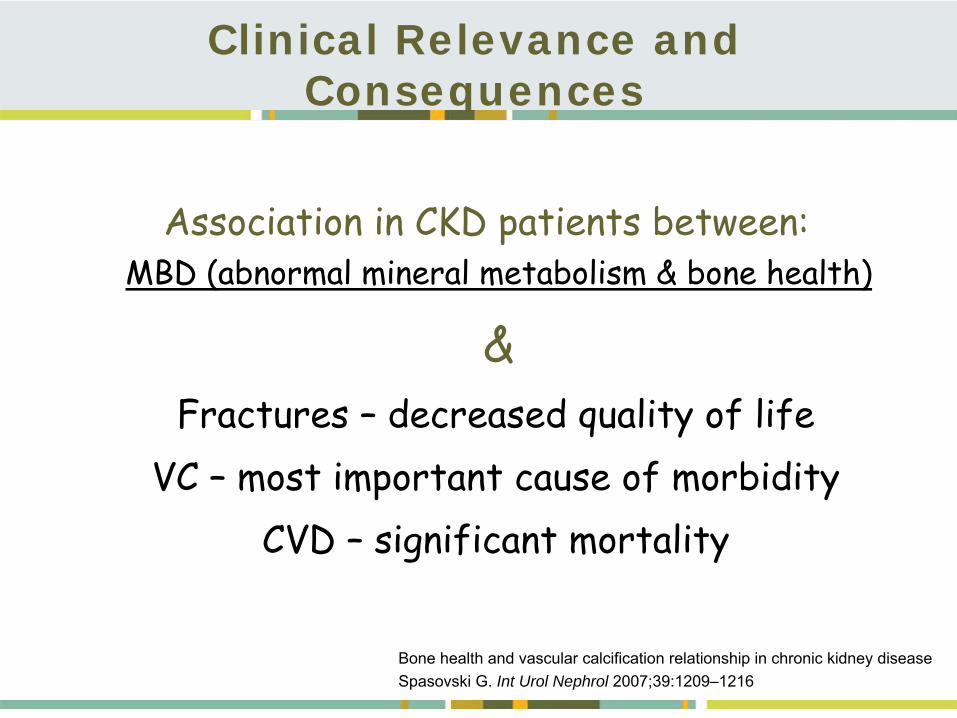
Association in CKD patients between: MBD (abnormal mineral metabolism & bone health)
&Fractures –
decreased quality of life
VC –
most important cause of morbidityCVD –
significant mortality
Clinical Relevance and Consequences
Bone health and vascular calcification relationship in chronic kidney diseaseSpasovski G. Int Urol Nephrol 2007;39:1209–1216
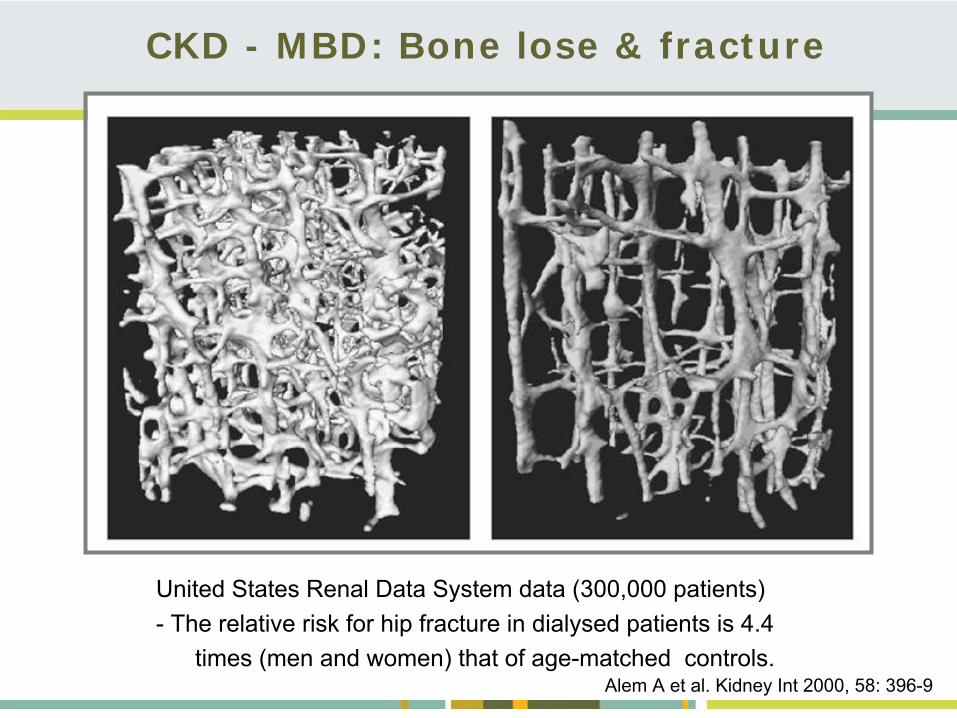
CKD - MBD: Bone lose & fracture
United States Renal Data System data (300,000 patients)-
The relative risk for hip fracture in dialysed patients is 4.4
times (men and women) that of age-matched controls.Alem A et al. Kidney Int 2000, 58: 396-9
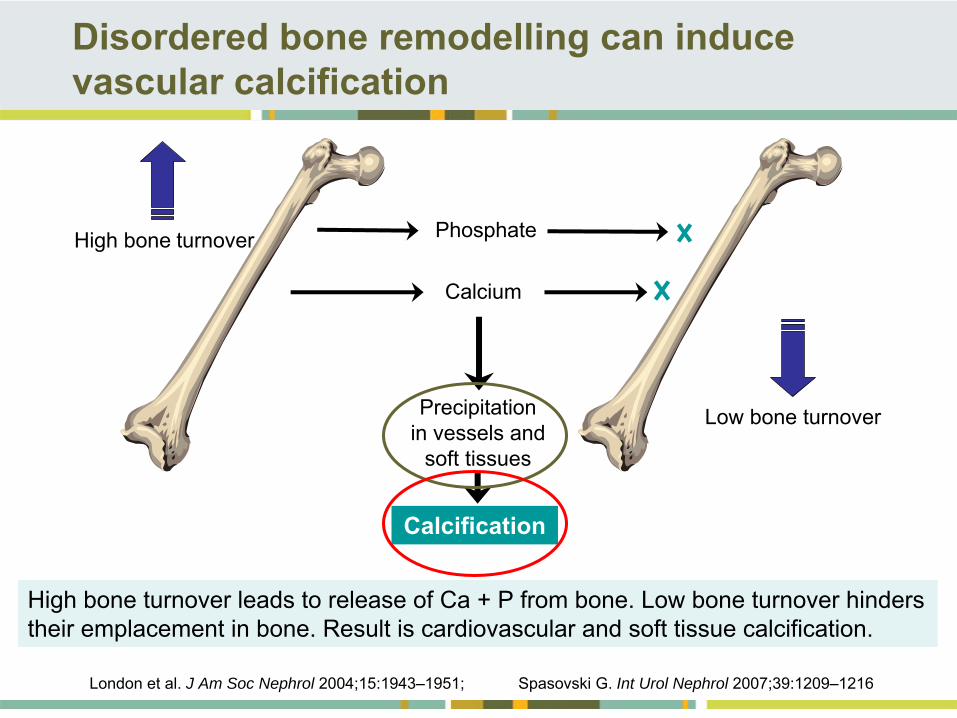
Disordered bone remodelling can induce vascular calcification
High bone
turnover
Low bone turnover
Phosphate
Calcium
Precipitationin vessels and
soft tissues
Calcification
London et al. J Am Soc Nephrol 2004;15:1943–1951; Spasovski G. Int Urol Nephrol 2007;39:1209–1216
High bone turnover leads to release of Ca + P from bone. Low bone turnover hinders their emplacement in bone. Result is cardiovascular and soft tissue calcification.
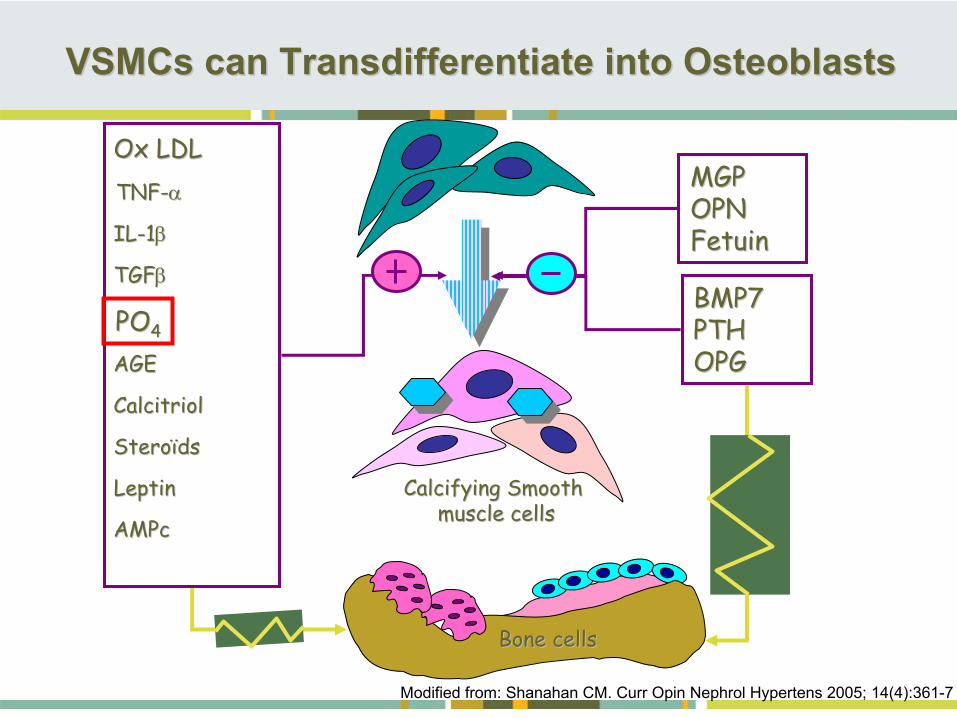
VSMCs can Transdifferentiate into OsteoblastsVSMCs can Transdifferentiate into Osteoblasts
Modified from: Shanahan CM.
Curr Opin Nephrol Hypertens
2005;
14(4):361-7
Calcifying Smooth Calcifying Smooth muscle cellsmuscle cells
BMP7BMP7PTHPTHOPGOPG
POPO44
AMPcAMPc
TNFTNF--
AGEAGE
LeptinLeptin
CalcitriolCalcitriol
Ox LDLOx LDL
SteroSteroïïdsds
ILIL--11
TGFTGF
Bone cellsBone cells
MGPMGPOPNOPNFetuinFetuin
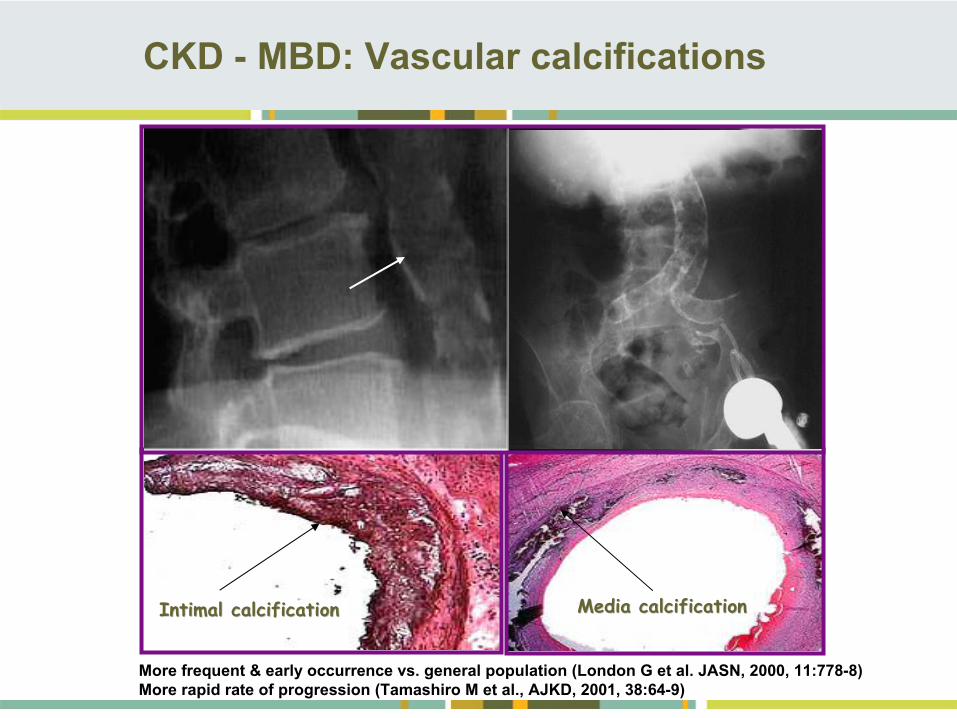
CKD -
MBD: Vascular calcifications
Media calcificationMedia calcificationIIntimantimal l calcificalcificationcation
More frequent & early occurrence vs. general population (London G et al. JASN, 2000, 11:778-8)More rapid rate of progression (Tamashiro M et al., AJKD, 2001, 38:64-9)
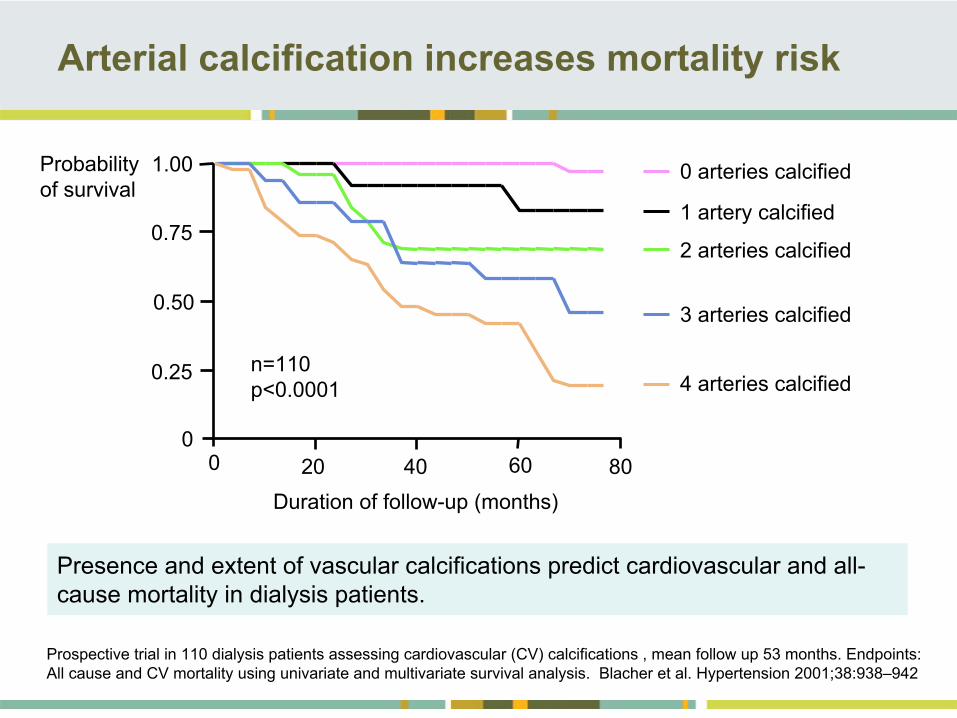
Arterial calcification increases mortality risk
0 arteries calcified
1 artery calcified
2 arteries calcified
3 arteries calcified
4 arteries calcified
Prospective trial in 110 dialysis patients assessing cardiovascular (CV) calcifications , mean follow up 53 months. Endpoints: All cause and CV mortality using univariate and multivariate survival analysis. Blacher et al. Hypertension 2001;38:938–942
Presence and extent of vascular calcifications predict cardiovascular and all- cause mortality in dialysis patients.
Probability of survival
n=110 p<0.0001
1.00
Duration of follow-up (months)
0
0.25
0.50
0.75
0 20 40 60 80
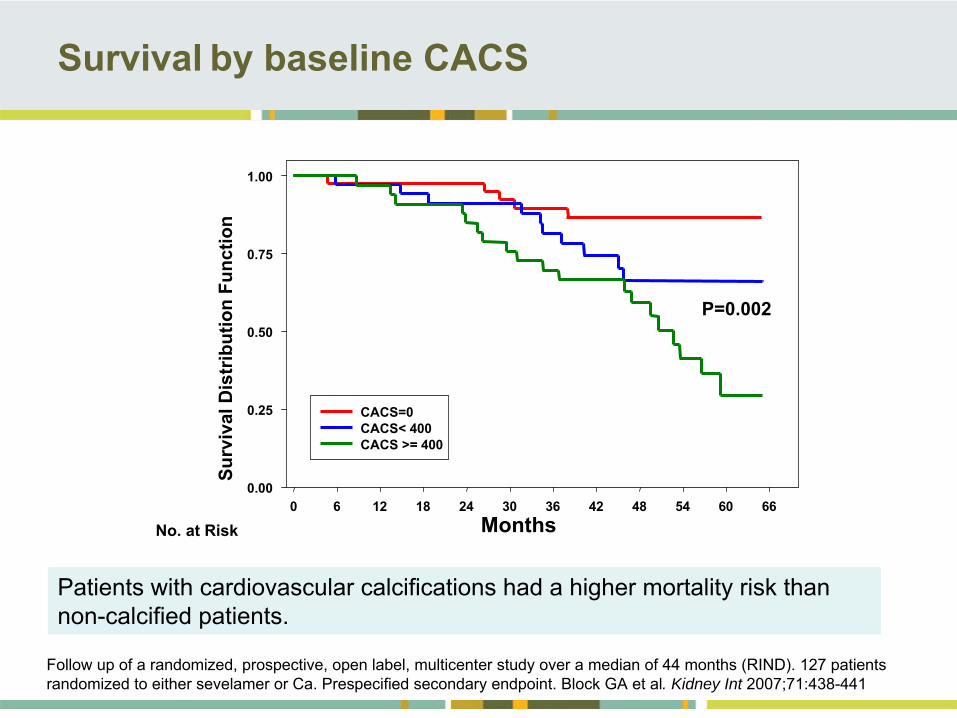
Survival
by baseline CACS
Months0 6 12 18 24 30 36 42 48 54 60 66
Surv
ival
Dis
trib
utio
n Fu
nctio
n
0.00
0.25
0.50
0.75
1.00
CACS=0 CACS< 400CACS >= 400
No. at Risk
P=0.002
Patients with cardiovascular calcifications had a higher mortality risk than non-calcified patients.
Follow up of a randomized, prospective, open label, multicenter study over a median of 44 months (RIND). 127 patients randomized to either sevelamer or Ca. Prespecified secondary endpoint. Block GA et al. Kidney Int 2007;71:438-441
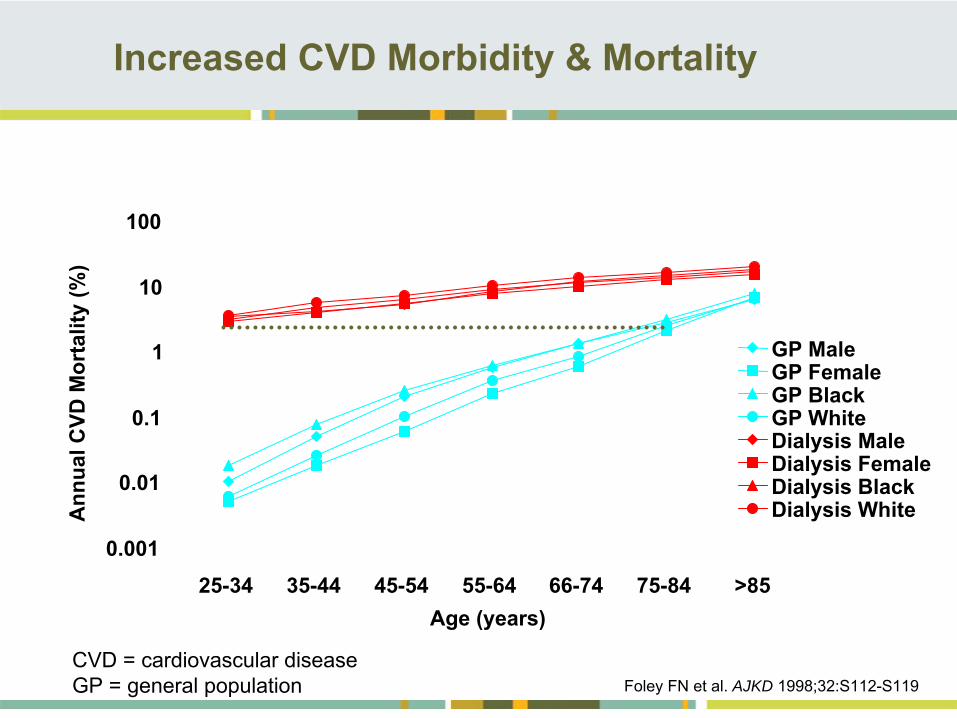
Increased CVD Morbidity & Mortality
0.001
0.01
0.1
1
10
100
25-34 35-44 45-54 55-64 66-74 75-84 >85
GP MaleGP FemaleGP BlackGP WhiteDialysis MaleDialysis FemaleDialysis BlackDialysis White
Age (years)
Ann
ual C
VD M
orta
lity
(%)
CVD = cardiovascular diseaseGP = general population Foley FN et al. AJKD 1998;32:S112-S119
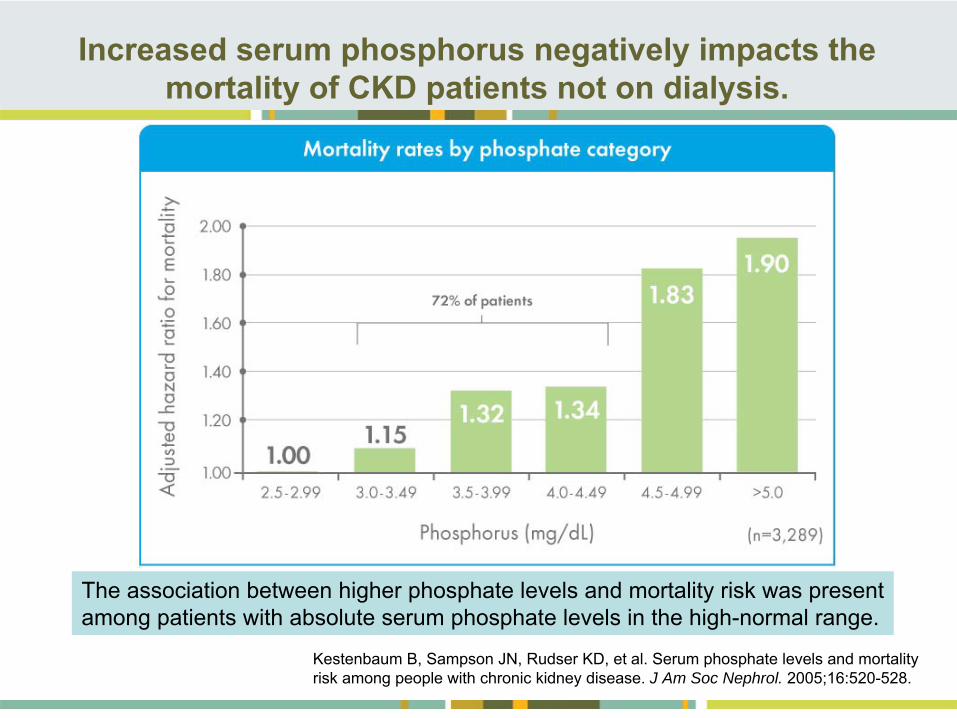
Increased serum phosphorus negatively impacts the mortality of CKD patients not on dialysis.
Kestenbaum B, Sampson JN, Rudser KD, et al. Serum phosphate levels and mortality risk among people with chronic kidney disease. J Am Soc Nephrol. 2005;16:520-528.
The association between higher phosphate levels and mortality risk was present among patients with absolute serum phosphate levels in the high-normal range.
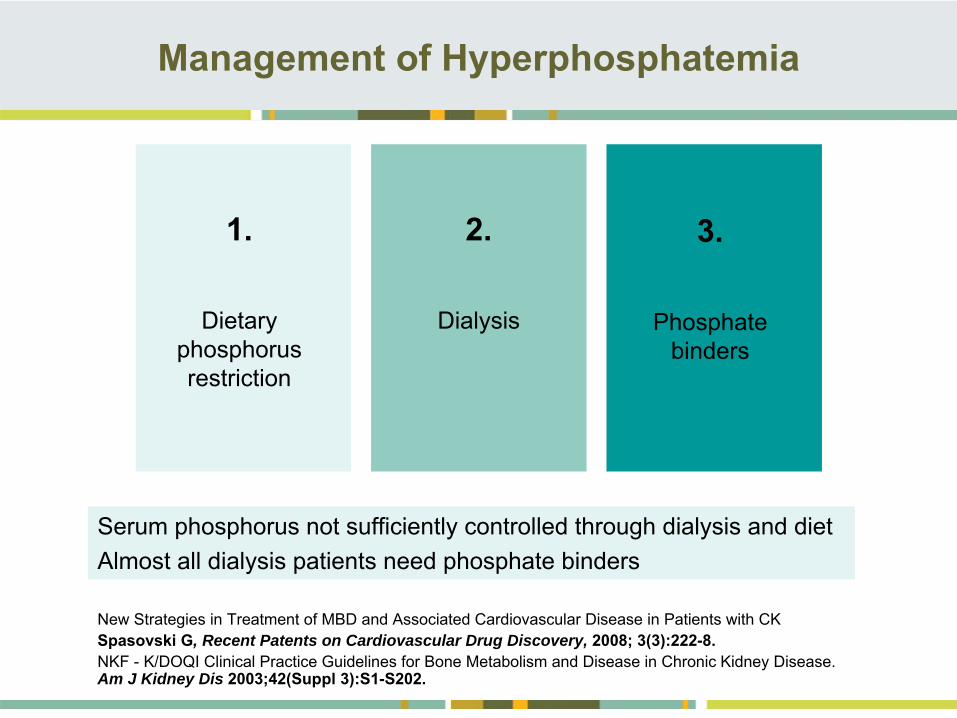
Management of Hyperphosphatemia
Serum phosphorus not sufficiently controlled through dialysis and dietAlmost all dialysis patients need phosphate binders
New Strategies in Treatment of MBD and
Associated
Cardiovascular Disease in Patients with CKSpasovski
G, Recent Patents on Cardiovascular Drug Discovery, 2008; 3(3):222-8. NKF -
K/DOQI Clinical Practice Guidelines for Bone Metabolism and Disease in Chronic Kidney Disease. Am J Kidney Dis 2003;42(Suppl 3):S1-S202.
1.
Dietary phosphorus restriction
2.
Dialysis
3.
Phosphate binders
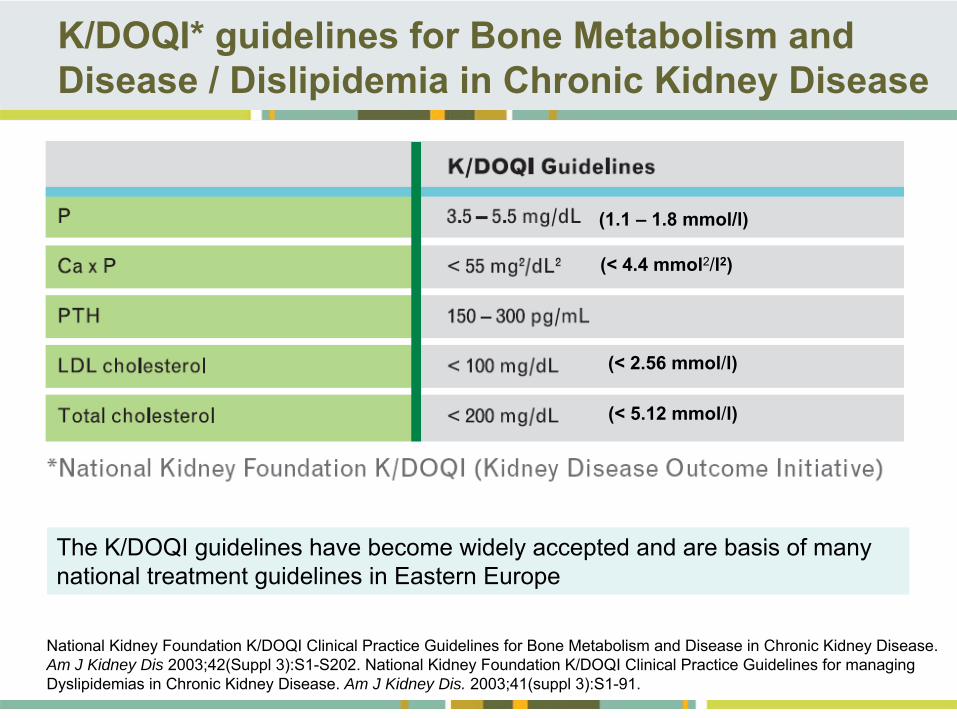
K/DOQI* guidelines for Bone Metabolism and Disease / Dislipidemia in Chronic Kidney Disease
National Kidney Foundation K/DOQI Clinical Practice Guidelines for Bone Metabolism and Disease in Chronic Kidney Disease. Am J Kidney Dis 2003;42(Suppl 3):S1-S202. National Kidney Foundation K/DOQI Clinical Practice Guidelines for managing Dyslipidemias in Chronic Kidney Disease. Am J Kidney Dis. 2003;41(suppl 3):S1-91.
The K/DOQI guidelines have become widely accepted and are basis of many national treatment guidelines in Eastern Europe
(1.1 –
1.8 mmol/l)
(< 4.4 mmol2/l2)
(< 2.56 mmol/l)
(< 5.12 mmol/l)
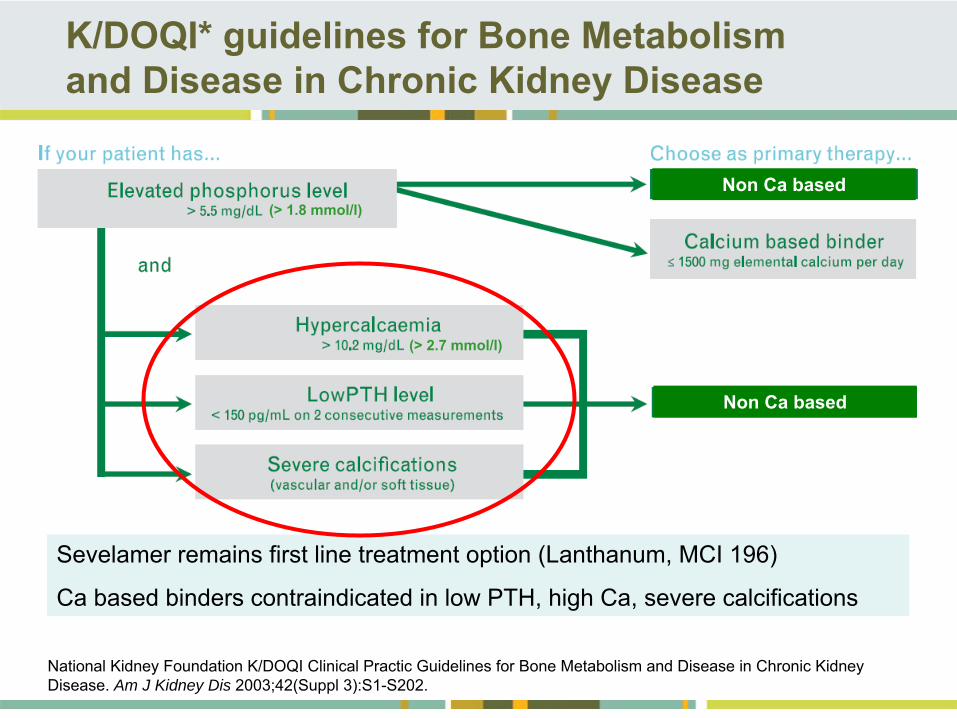
K/DOQI* guidelines for Bone Metabolism and Disease in Chronic Kidney Disease
National Kidney Foundation K/DOQI Clinical Practic Guidelines for Bone Metabolism and Disease in Chronic Kidney Disease. Am J Kidney Dis 2003;42(Suppl 3):S1-S202.
Sevelamer remains first line treatment option (Lanthanum, MCI 196)
Ca based binders contraindicated in low PTH, high Ca, severe calcifications
(> 1.8 mmol/l)
(> 2.7 mmol/l)
Non Ca based
Non Ca based
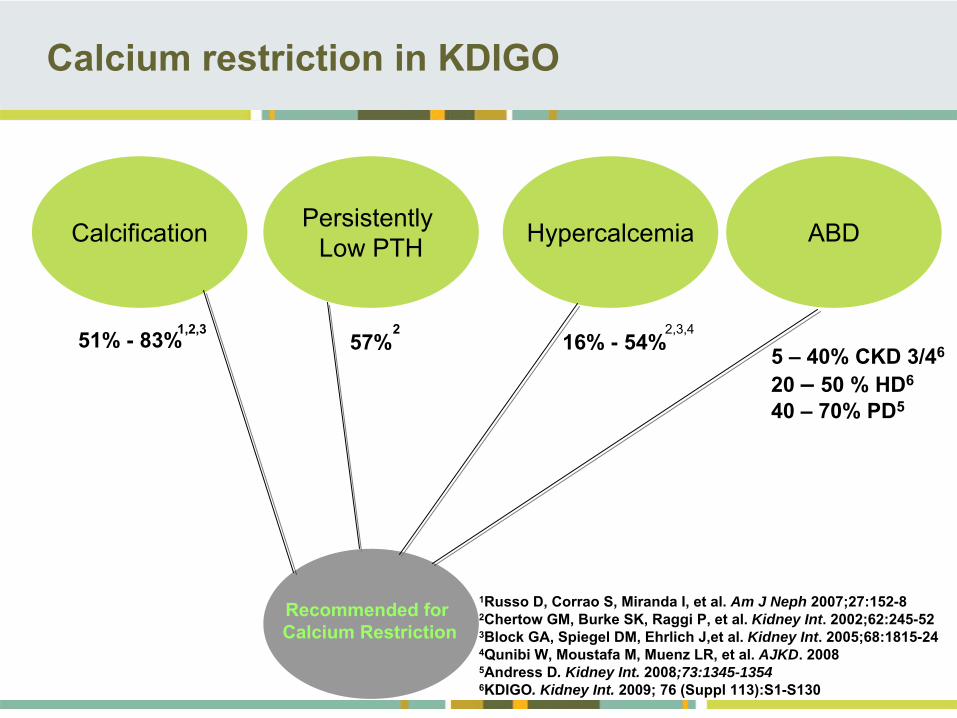
51% -
83% 57% 16% -
54%
Calcification Persistently Low PTH ABDHypercalcemia
1,2,3 2 2,3,4
Calcium restriction in KDIGO
1Russo D, Corrao S, Miranda I, et al. Am J Neph 2007;27:152-82Chertow GM, Burke SK, Raggi P, et al. Kidney Int. 2002;62:245-523Block GA, Spiegel DM, Ehrlich J,et al. Kidney Int. 2005;68:1815-244Qunibi W, Moustafa M, Muenz LR, et al. AJKD. 20085Andress D. Kidney Int. 2008;73:1345-13546KDIGO. Kidney Int. 2009; 76 (Suppl 113):S1-S130
Recommended for Calcium Restriction
5 –
40% CKD 3/46
20 –
50 % HD6
40 –
70% PD5
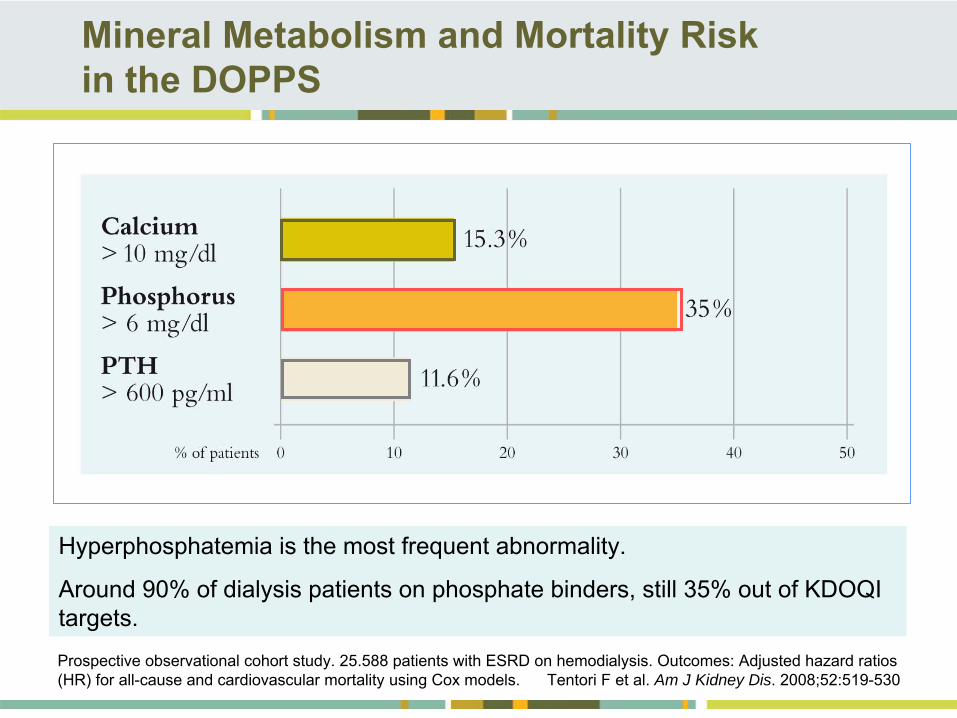
Mineral Metabolism and Mortality Risk in the DOPPS
Prospective observational cohort study. 25.588 patients with ESRD on hemodialysis. Outcomes: Adjusted hazard ratios (HR) for all-cause and cardiovascular mortality using Cox models. Tentori F et al. Am J Kidney Dis. 2008;52:519-530
Hyperphosphatemia is the most frequent abnormality.
Around 90% of dialysis patients on phosphate binders, still 35% out of KDOQI targets.
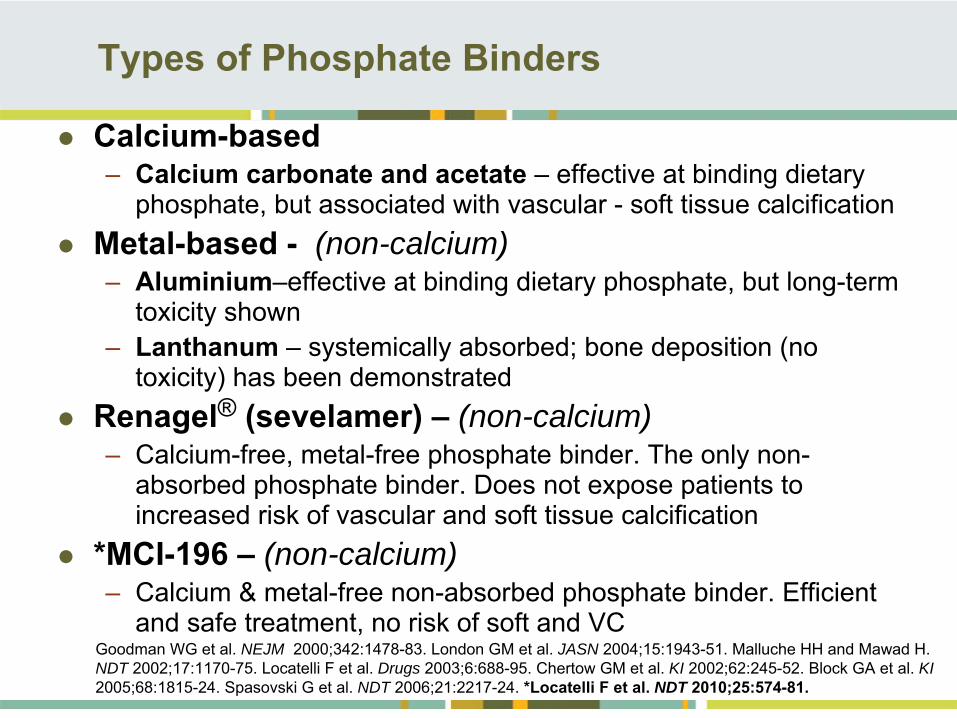
Types of Phosphate Binders
Calcium-based–
Calcium carbonate and acetate –
effective at binding dietary
phosphate, but associated with vascular -
soft tissue calcification
Metal-based -
(non-calcium)
–
Aluminium–effective at binding dietary phosphate, but long-term toxicity shown
–
Lanthanum –
systemically absorbed; bone deposition (no toxicity) has been demonstrated
Renagel®
(sevelamer) –
(non-calcium)
–
Calcium-free, metal-free phosphate binder. The only non- absorbed phosphate binder. Does not expose patients to
increased risk of vascular and soft tissue calcification
*MCI-196 –
(non-calcium)
–
Calcium & metal-free non-absorbed phosphate binder. Efficient and safe treatment, no risk of soft and VC
Goodman WG et al. NEJM 2000;342:1478-83.
London GM et al. JASN 2004;15:1943-51. Malluche HH and Mawad H. NDT 2002;17:1170-75. Locatelli F et al. Drugs 2003;6:688-95. Chertow GM et al. KI 2002;62:245-52. Block GA et al. KI 2005;68:1815-24. Spasovski G et al. NDT 2006;21:2217-24.
*Locatelli F et al. NDT 2010;25:574-81.
Mineral Metabolism and Mortality Risk in the DOPPS
Prospective observational cohort study. 25.588 patients with ESRD on hemodialysis. Outcomes: Adjusted hazard ratios (HR) for all-cause and cardiovascular mortality using Cox models. Tentori
F et al. Am J Kidney Dis 2008;52:519-530.
Disorders of mineral metabolism are associated with increased mortality
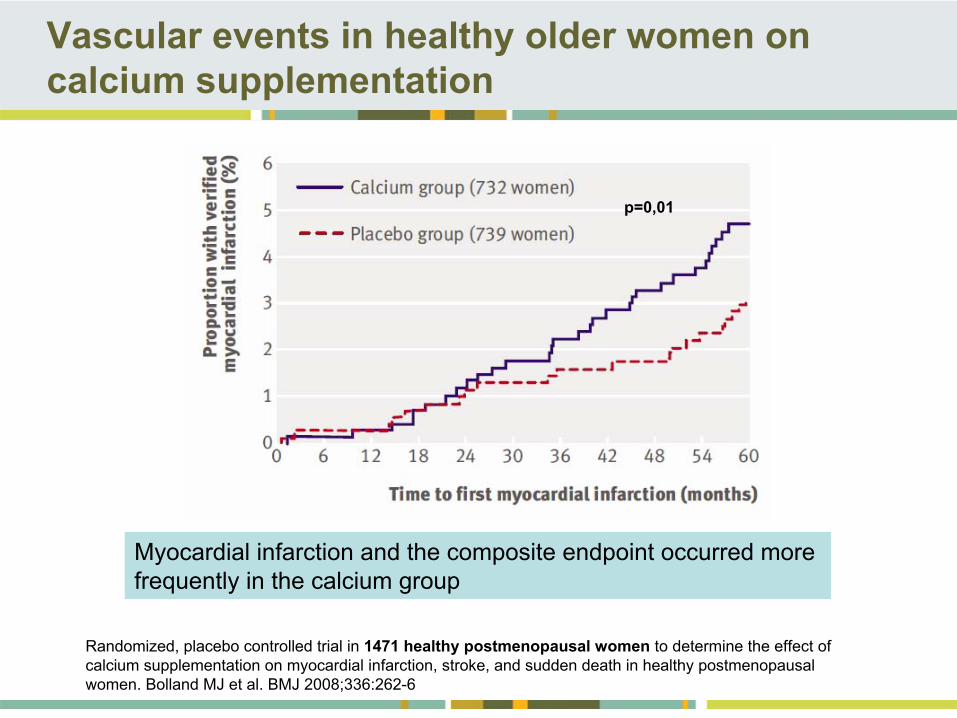
Vascular events in healthy older women on calcium supplementation
Randomized, placebo controlled trial in 1471 healthy postmenopausal women
to determine the effect of calcium supplementation on myocardial infarction, stroke, and sudden death in healthy postmenopausal women. Bolland MJ et al. BMJ 2008;336:262-6
p=0,01
Myocardial infarction and the composite endpoint occurred more frequently in the calcium group
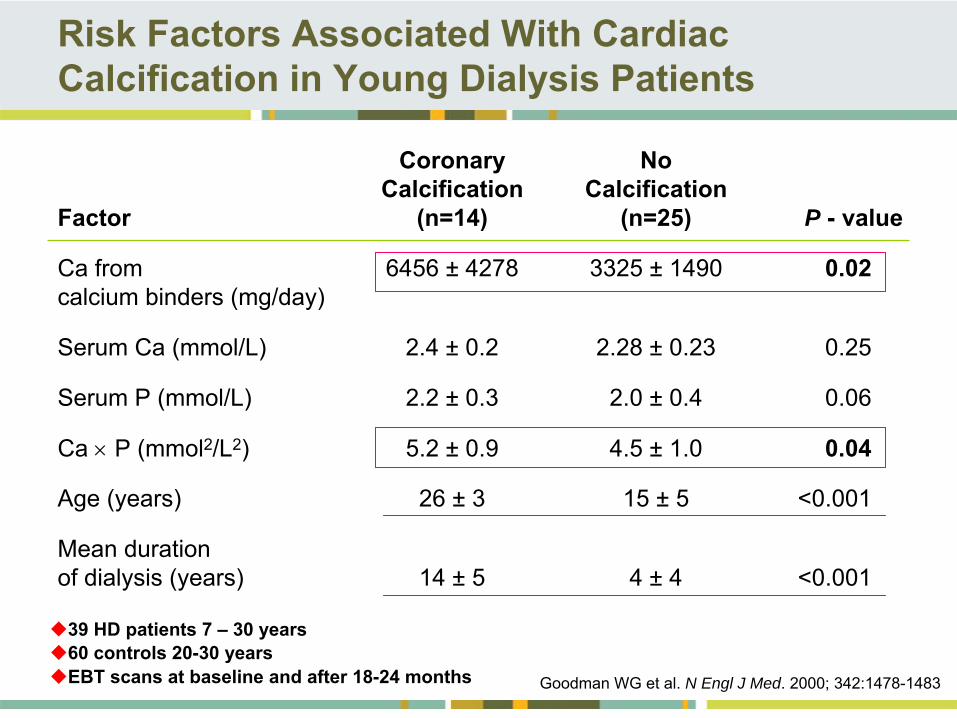
Risk Factors Associated With Cardiac Calcification in Young Dialysis Patients
Coronary
No Calcification
Calcification
Factor
(n=14)
(n=25)
P -
value
Ca from 6456 ±
4278 3325 ±
1490
0.02 calcium binders (mg/day)
Serum Ca (mmol/L)
2.4 ±
0.2
2.28 ±
0.23
0.25
Serum P (mmol/L)
2.2 ±
0.3
2.0 ±
0.4
0.06
Ca
P (mmol2/L2) 5.2 ±
0.9
4.5 ±
1.0
0.04
Age (years)
26 ±
3 15 ±
5 <0.001
Mean duration of dialysis (years)
14 ±
5 4 ±
4
<0.001
Goodman WG et al. N Engl J Med. 2000; 342:1478-1483
39 HD patients 7 –
30 years 60 controls 20-30 yearsEBT scans at baseline and after 18-24 months
PREVENTION OF COMPLICATIONS OF THERAPY
. . .
OF HYPERPHOSPHATEMIA
&
MBD & ROD & VC IN CKD PATIENTS
NEW THERAPEUTIC APPROACH
PREVENTION OF COMPLICATIONS OF THERAPY
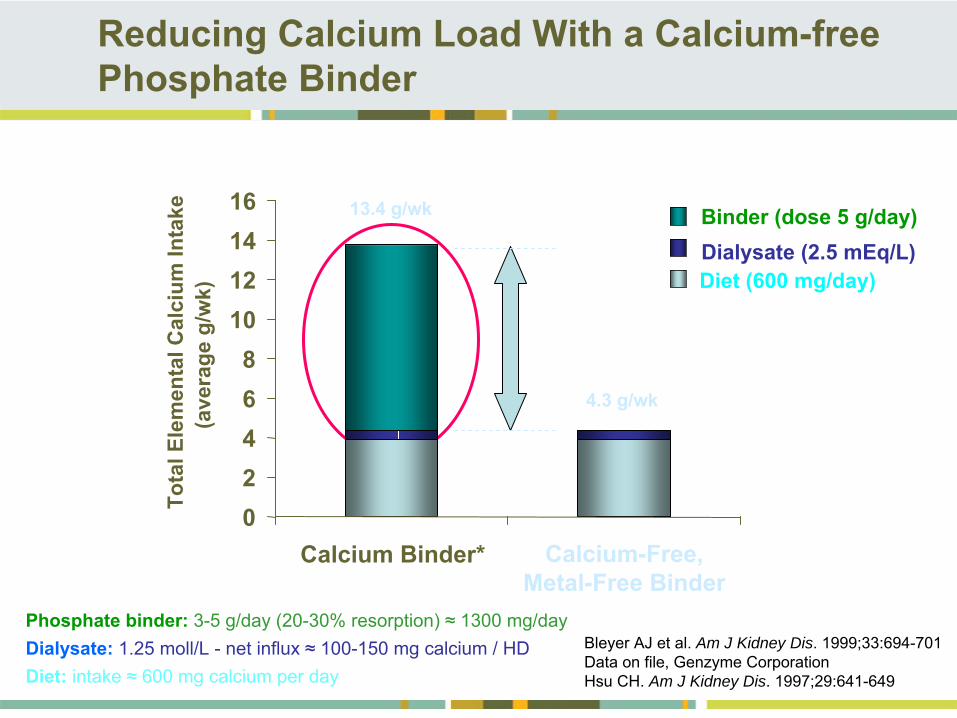
Reducing Calcium Load With a Calcium-free Phosphate Binder
Bleyer AJ et al. Am J Kidney Dis. 1999;33:694-701Data on file, Genzyme CorporationHsu CH. Am J Kidney Dis. 1997;29:641-649
Diet (600 mg/day)
Binder (dose 5 g/day)Dialysate (2.5 mEq/L)
Calcium-Free, Metal-Free Binder
13.4 g/wk
4.3 g/wk
Phosphate binder:
3-5 g/day (20-30% resorption) ≈
1300 mg/dayDialysate:
1.25 moll/L -
net influx ≈
100-150 mg calcium / HDDiet: intake ≈
600 mg calcium per day
02468
10121416
Calcium Binder*
Tota
l Ele
men
tal C
alci
um In
take
(ave
rage
g/w
k)
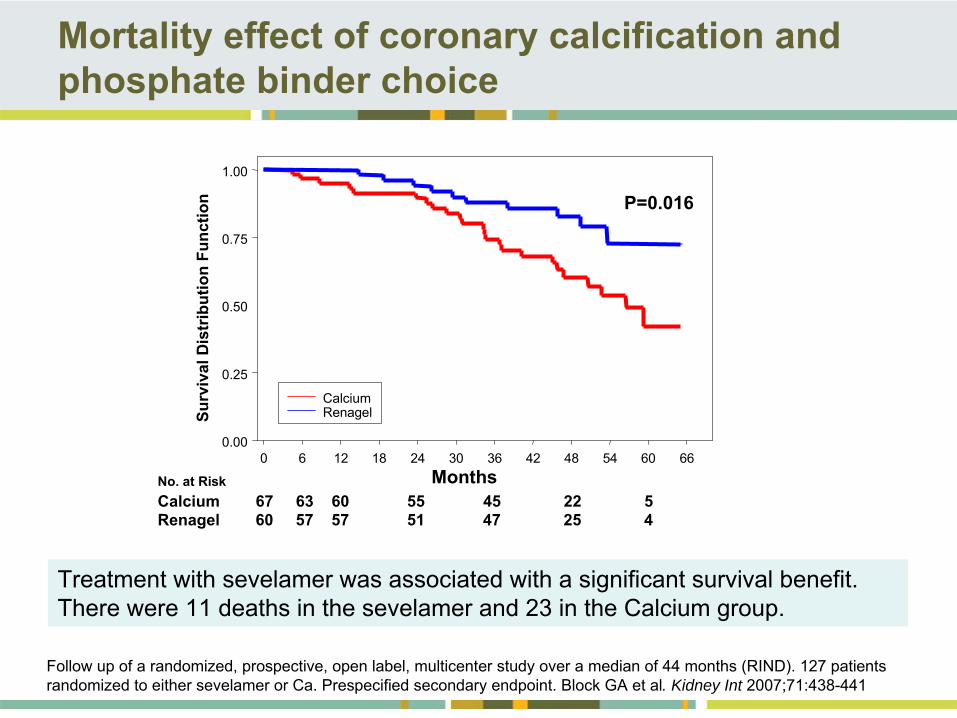
Mortality effect of coronary calcification and phosphate binder choice
Follow up of a randomized, prospective, open label, multicenter study over a median of 44 months (RIND). 127 patients randomized to either sevelamer or Ca. Prespecified secondary endpoint. Block GA et al. Kidney Int 2007;71:438-441
Treatment with sevelamer was associated with a significant survival benefit. There were 11 deaths in the sevelamer and 23 in the Calcium group.
Months
Surv
ival
Dis
trib
utio
n Fu
nctio
n
No. at RiskCalcium 67 63 60 55 45 22 5Renagel 60 57 57 51 47 25 4
0 6 12 18 24 30 36 42 48 54 60 660.00
0.25
0.50
0.75
1.00
Calcium Renagel
P=0.016
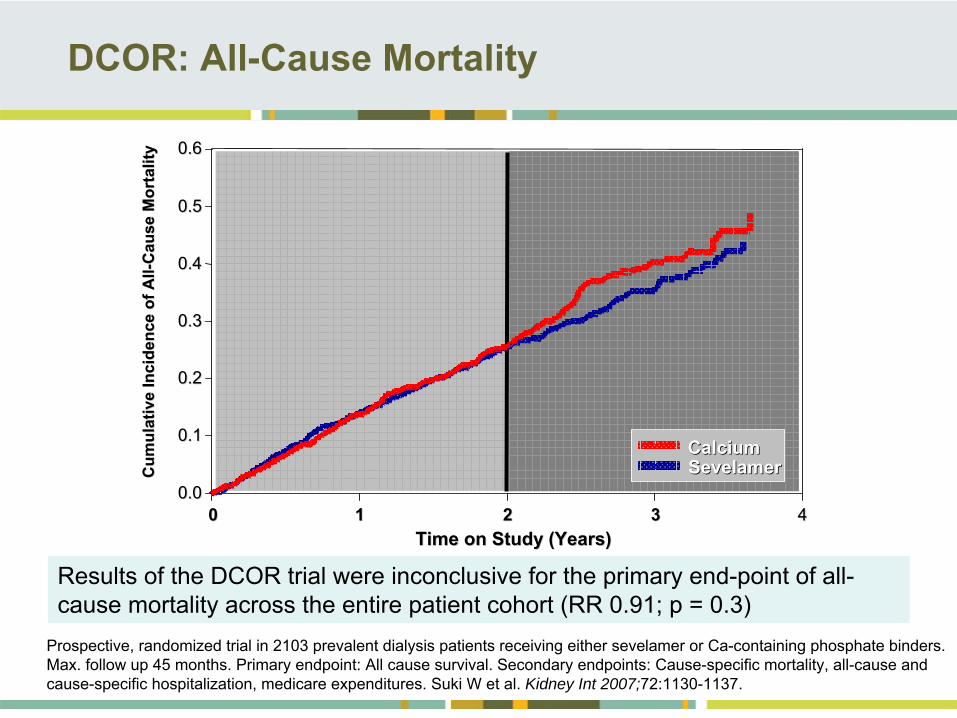
DCOR: All-Cause Mortality
Time on Study (Years)Time on Study (Years)
Cum
ulat
ive
Inci
denc
e of
All
Cum
ulat
ive
Inci
denc
e of
All --
Cau
se M
orta
lity
Cau
se M
orta
lity
11 22 33 44000.00.0
0.10.1
0.20.2
0.30.3
0.40.4
0.50.5
0.60.6
SevelamerSevelamerCalciumCalcium
Results of the DCOR trial were inconclusive for the primary end-point of all- cause mortality across the entire patient cohort (RR 0.91; p = 0.3)
Prospective, randomized trial in 2103 prevalent dialysis patients receiving either sevelamer or Ca-containing phosphate binders. Max. follow up 45 months. Primary endpoint: All cause survival. Secondary endpoints: Cause-specific mortality, all-cause and cause-specific hospitalization, medicare expenditures.
Suki W et al. Kidney Int 2007;72:1130-1137.
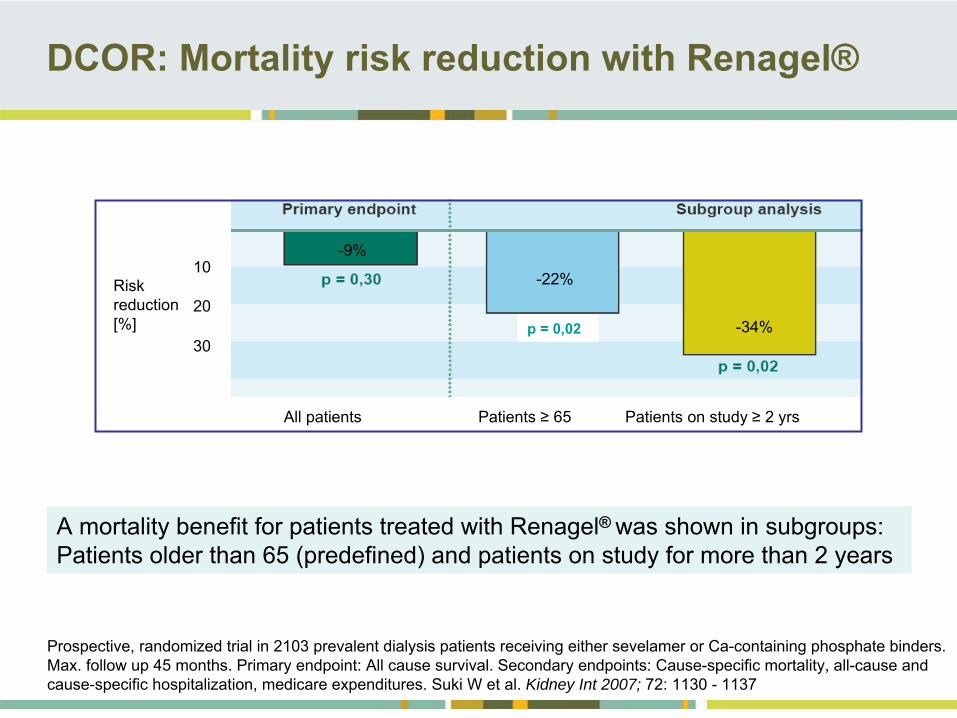
DCOR: Mortality risk reduction with Renagel®
A mortality benefit for patients treated with Renagel®
was shown in subgroups: Patients older than 65 (predefined) and patients on study for more than 2 years
Prospective, randomized trial in 2103 prevalent dialysis patients receiving either sevelamer or Ca-containing phosphate binders. Max. follow up 45 months. Primary endpoint: All cause survival. Secondary endpoints: Cause-specific mortality, all-cause and cause-specific hospitalization, medicare expenditures.
Suki W et al. Kidney Int 2007; 72: 1130 -
1137
p = 0,02
All patients
Patients ≥
65 Patients on study ≥
2 yrs
Risk reduction [%]
10
20
30
-22%
-34%
-9%
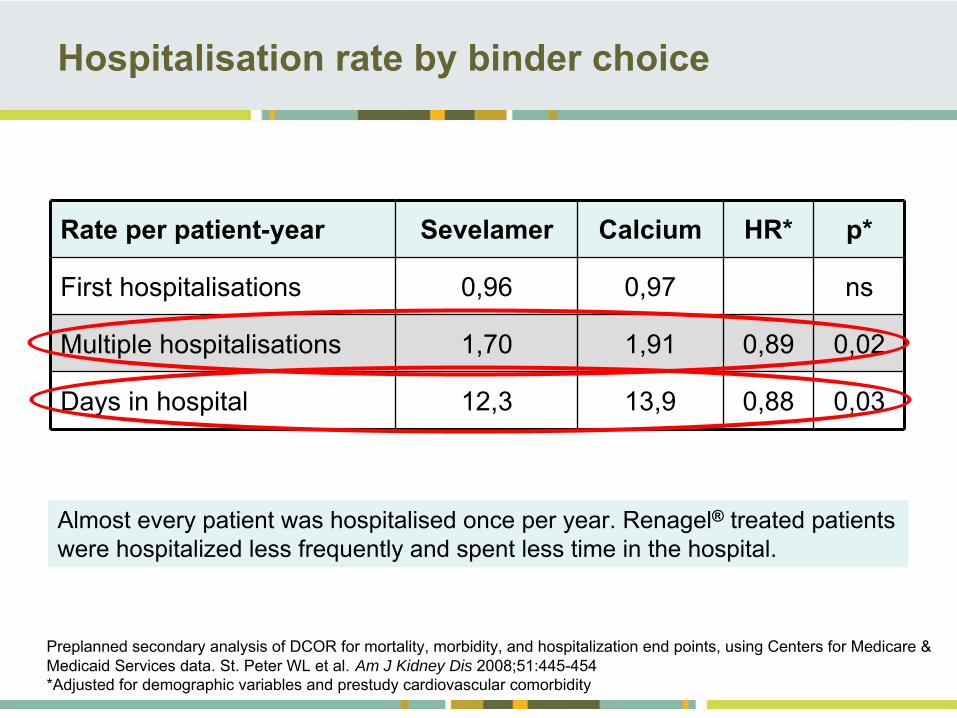
Hospitalisation rate by binder choice
Rate per patient-year Sevelamer Calcium HR* p*
First hospitalisations 0,96 0,97 ns
Multiple hospitalisations 1,70 1,91 0,89 0,02
Days in hospital 12,3 13,9 0,88 0,03
Preplanned secondary analysis of DCOR for mortality, morbidity, and hospitalization end points, using Centers for Medicare & Medicaid Services data. St. Peter WL et al.
Am J Kidney Dis 2008;51:445-454 *Adjusted for demographic variables and prestudy cardiovascular comorbidity
Almost every patient was hospitalised once per year. Renagel®
treated patients were hospitalized less frequently and spent less time in the hospital.
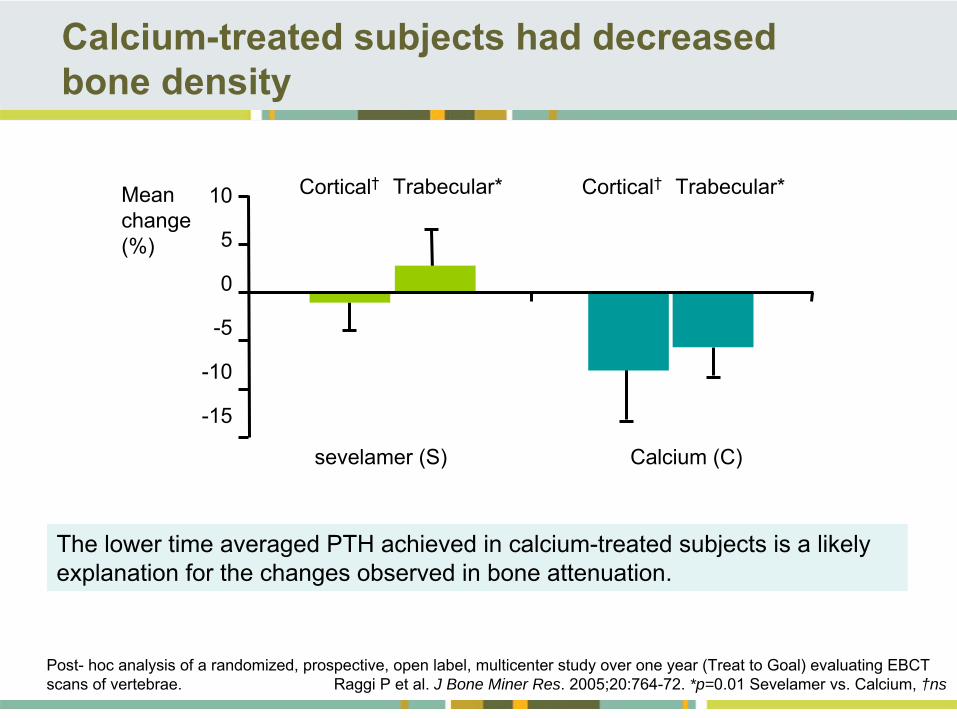
Calcium-treated subjects had decreased bone density
sevelamer (S) Calcium (C)
10
5
0
-5
-10
-15
Mean change (%)
Trabecular*Cortical† Trabecular*Cortical†
Post-
hoc analysis of a randomized, prospective, open label, multicenter study over one year (Treat to Goal) evaluating EBCT scans of vertebrae. Raggi P et al. J Bone Miner Res. 2005;20:764-72.
*p=0.01 Sevelamer vs. Calcium, †ns
The lower time averaged PTH achieved in calcium-treated subjects is a likely explanation for the changes observed in bone attenuation.
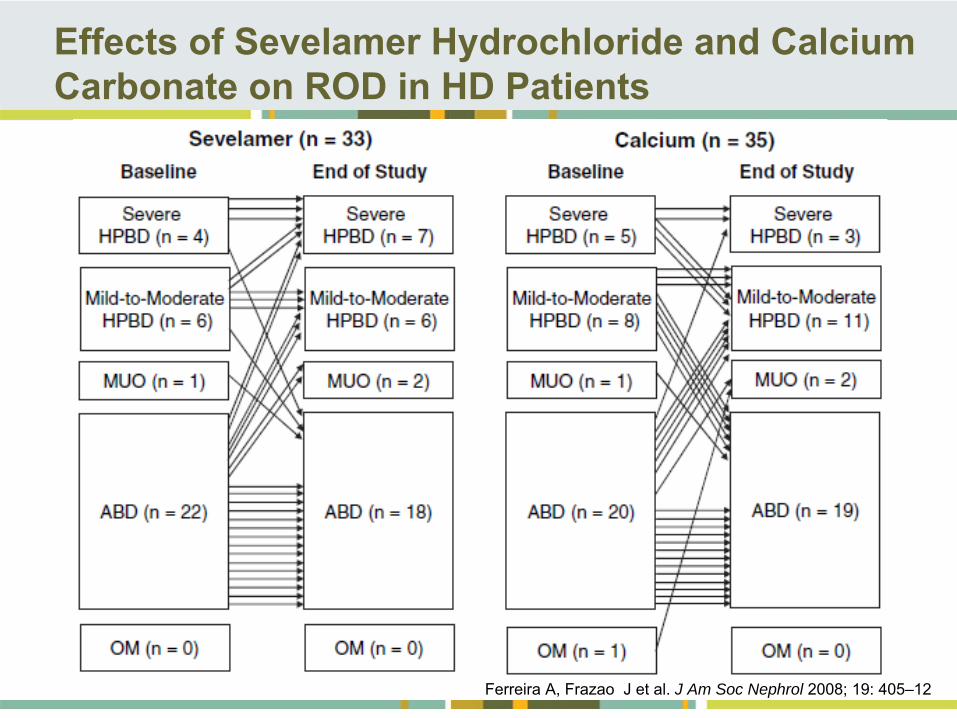
Ferreira A, Frazao J et al.
J Am Soc Nephrol 2008; 19: 405–12
Effects of Sevelamer Hydrochloride and Calcium Carbonate on ROD in HD Patients
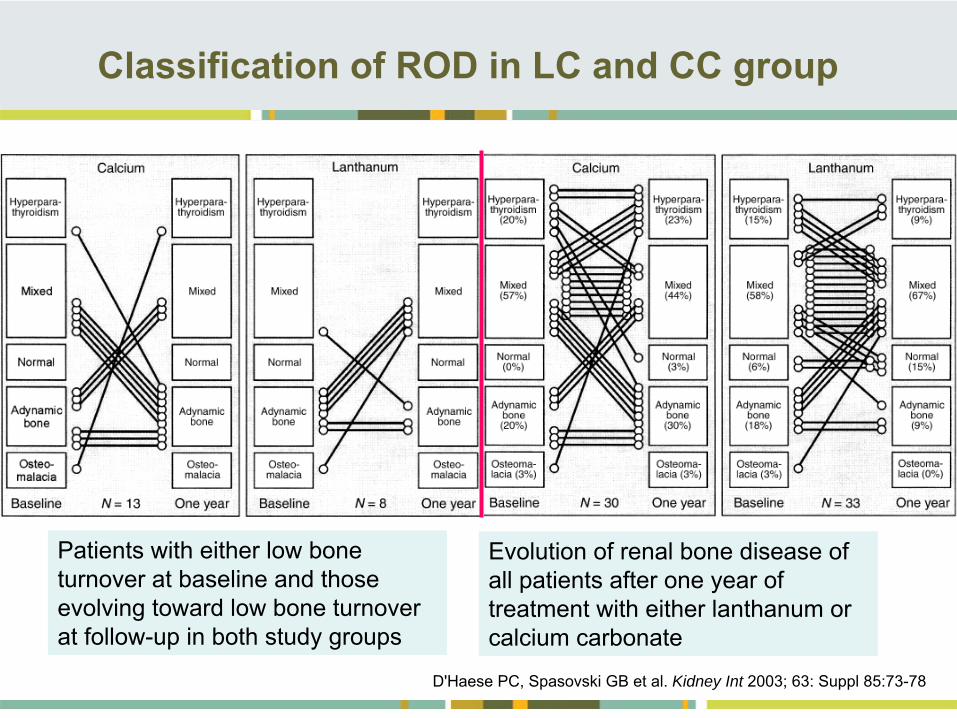
D'Haese PC, Spasovski GB et al. Kidney Int 2003; 63: Suppl 85:73-78
Classification of ROD in LC and CC group
Patients with either low bone turnover at baseline and those evolving toward low bone turnover at follow-up in both
study groups
Evolution of renal bone disease
of all patients after one year of treatment with either lanthanum or calcium carbonate
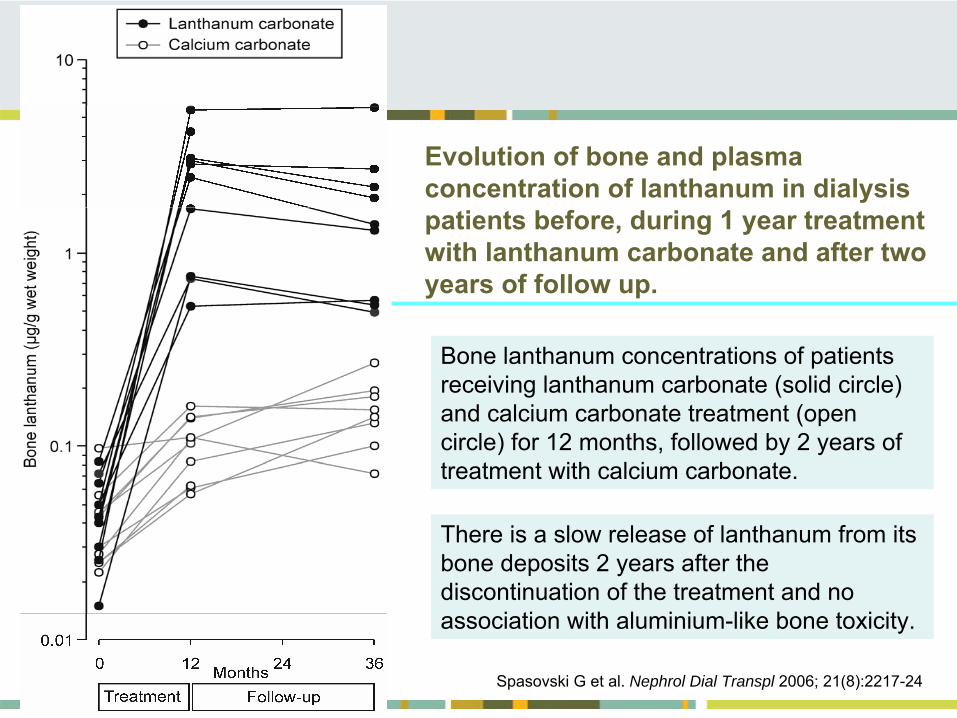
Evolution of bone and plasma concentration of lanthanum in dialysis patients before, during 1 year treatment with lanthanum carbonate and after two years of follow up.
Bone lanthanum concentrations of patients receiving lanthanum carbonate (solid circle) and calcium carbonate treatment (open circle) for 12 months, followed by 2 years of treatment with calcium carbonate.
There is a slow release of lanthanum from its bone deposits 2 years after the discontinuation of the treatment and no association with aluminium-like bone toxicity.
Spasovski G et al. Nephrol Dial Transpl 2006; 21(8):2217-24
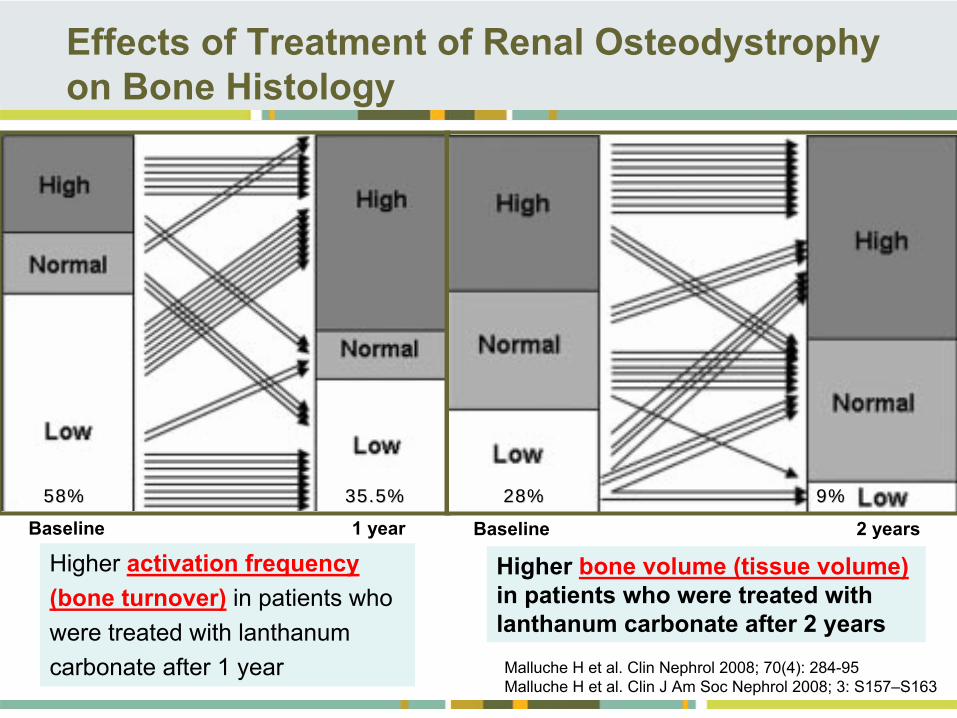
Malluche H et al.
Clin Nephrol 2008; 70(4): 284-95Malluche H et al.
Clin J Am Soc Nephrol 2008; 3: S157–S163
Effects of Treatment of Renal Osteodystrophy on Bone Histology
Baseline
2 yearsBaseline
1
year28%28% 9%9%58%58% 35.5%35.5%
Higher bone volume (tissue volume) in patients who were treated with
lanthanum carbonate after 2 years
Higher activation frequency(bone turnover)
in patients who
were treated with lanthanumcarbonate after 1 year
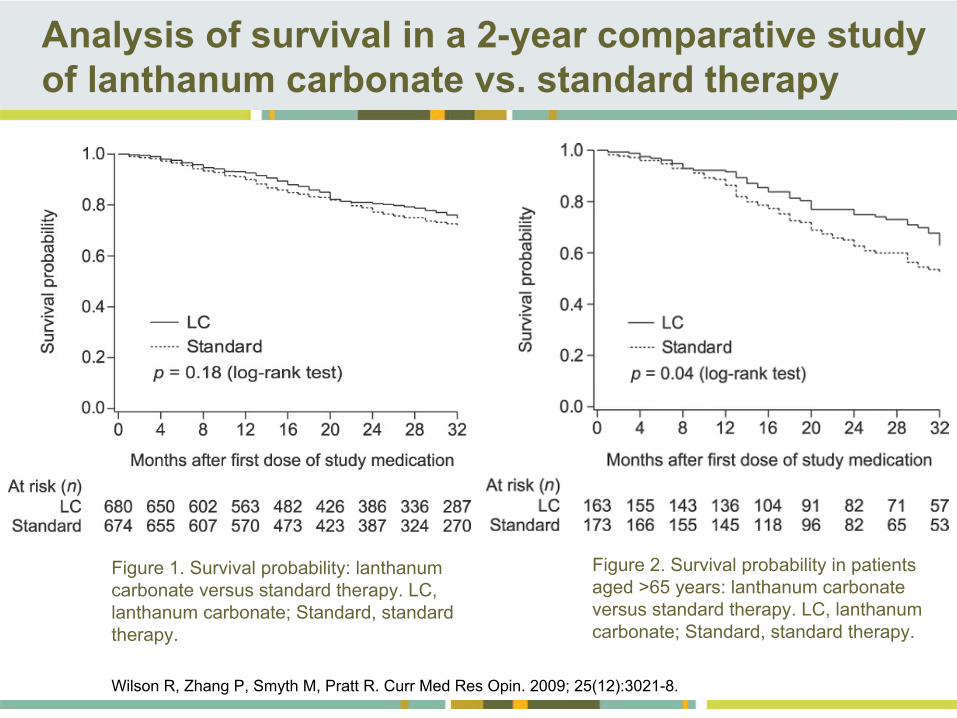
Figure 1. Survival probability: lanthanum carbonate versus standard therapy. LC, lanthanum carbonate; Standard, standard therapy.
Figure 2. Survival probability in patients aged >65 years: lanthanum carbonate versus standard therapy. LC, lanthanum carbonate; Standard, standard therapy.
Analysis of survival in a 2-year comparative study of lanthanum carbonate vs. standard therapy
Wilson R, Zhang P, Smyth M, Pratt R. Curr Med Res Opin. 2009; 25(12):3021-8.
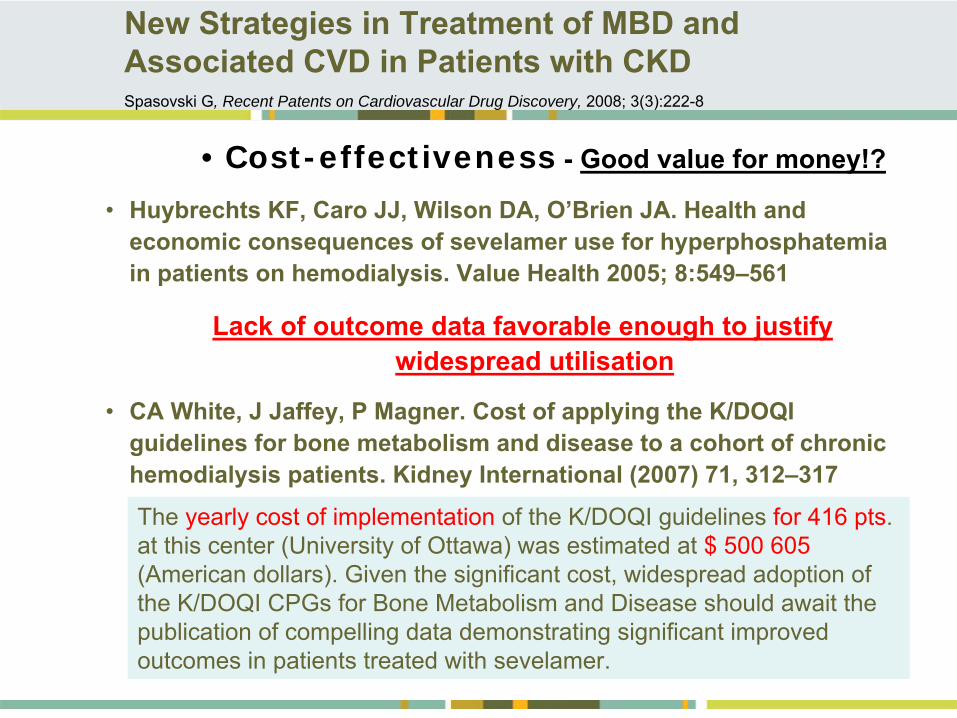
• Cost-effectiveness -
Good value for money!?
•
Huybrechts KF, Caro JJ, Wilson DA, O’Brien JA. Health and economic consequences of sevelamer use for hyperphosphatemia in patients on hemodialysis. Value Health 2005; 8:549–561
Lack of outcome data favorable enough to justify widespread utilisation
•
CA White, J Jaffey, P Magner. Cost of applying the K/DOQI guidelines for bone metabolism and disease to a cohort of chronic hemodialysis patients. Kidney International (2007) 71, 312–317
New Strategies in Treatment of MBD and Associated
CVD in Patients with CKD
Spasovski
G, Recent Patents on Cardiovascular Drug Discovery, 2008; 3(3):222-8
The yearly cost of implementation
of the K/DOQI guidelines for 416 pts. at this center (University of Ottawa) was estimated at $ 500 605
(American dollars). Given the significant cost, widespread adoption of the K/DOQI CPGs for Bone Metabolism and Disease should await the
publication of compelling data demonstrating significant improved outcomes in patients treated with sevelamer.
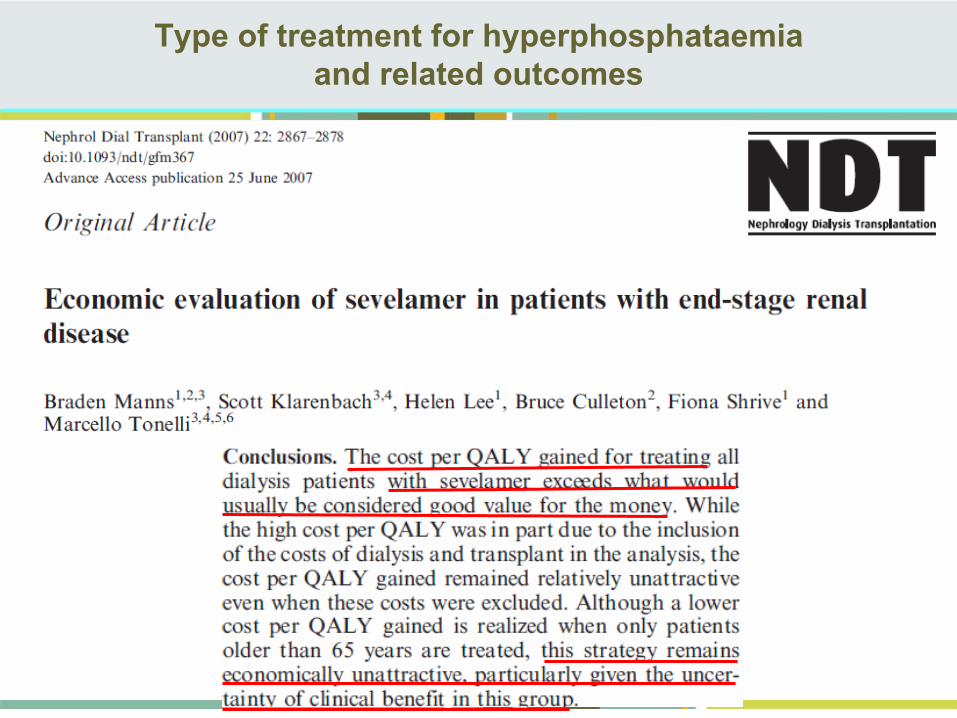
Type of treatment for hyperphosphataemia and related outcomes
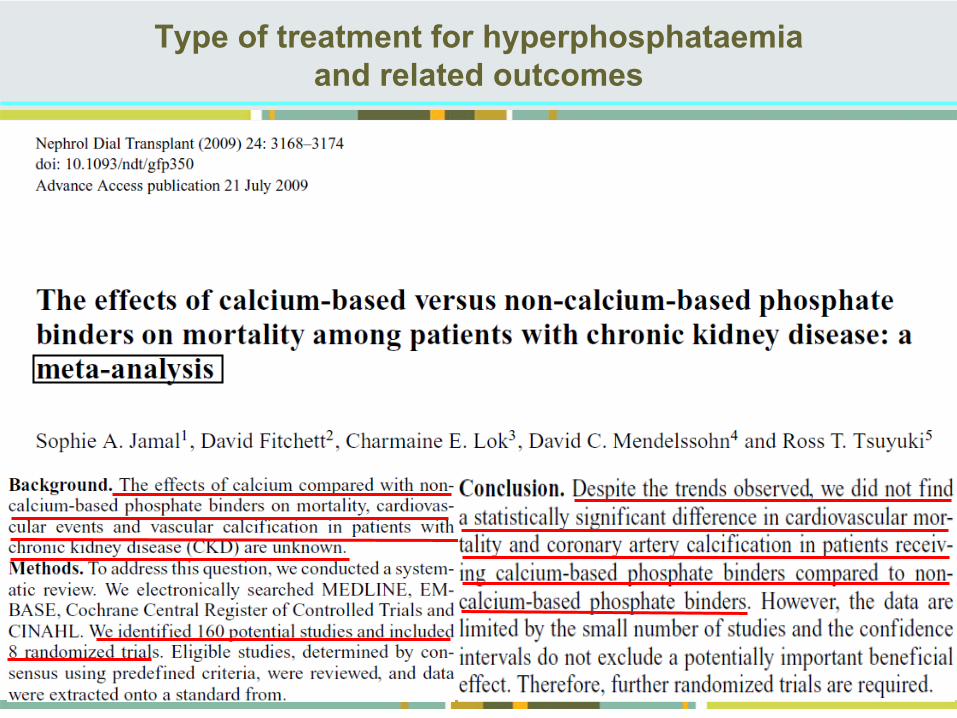
Type of treatment for hyperphosphataemia and related outcomes
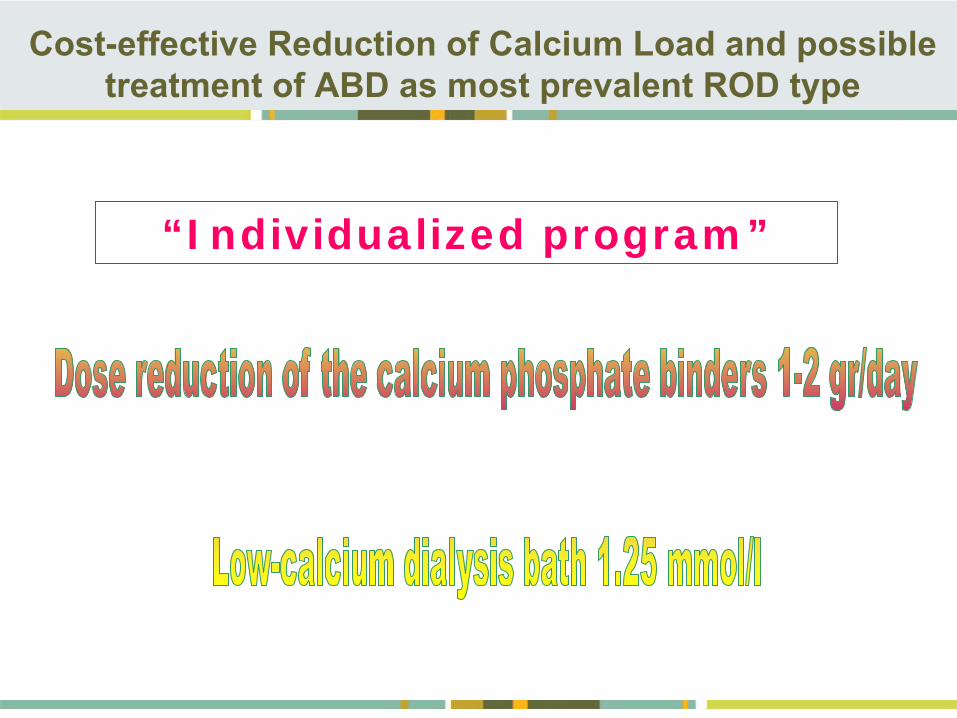
Cost-effective Reduction of Calcium Load and possible treatment of ABD as most prevalent ROD type
“Individualized program”
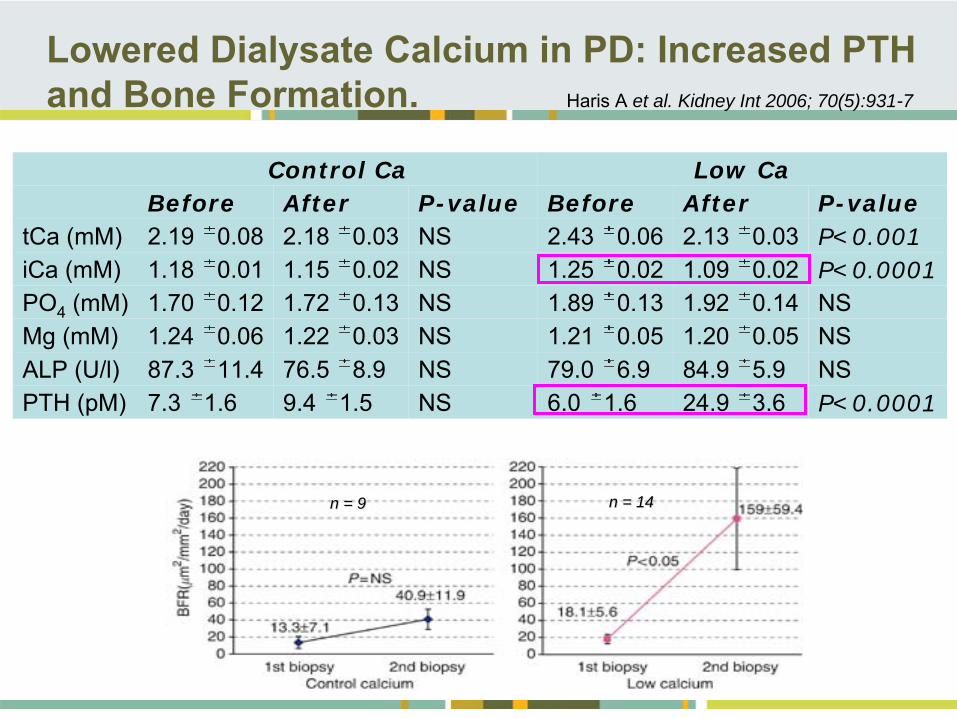
Control Ca Low Ca Before After P-value Before After P-value
tCa (mM) 2.19 0.08 2.18 0.03 NS 2.43 0.06 2.13 0.03 P<0.001iCa (mM) 1.18 0.01 1.15 0.02 NS 1.25 0.02 1.09 0.02 P<0.0001PO4
(mM) 1.70 0.12 1.72 0.13 NS 1.89 0.13 1.92 0.14 NSMg (mM) 1.24 0.06 1.22 0.03 NS 1.21 0.05 1.20 0.05 NSALP (U/l) 87.3 11.4 76.5 8.9 NS 79.0 6.9 84.9 5.9 NSPTH (pM) 7.3 1.6 9.4 1.5 NS 6.0 1.6 24.9 3.6 P<0.0001
Lowered Dialysate Calcium in PD: Increased PTH and Bone Formation. Haris A et al. Kidney Int 2006; 70(5):931-7
n = 9n = 9 n = 14n = 14
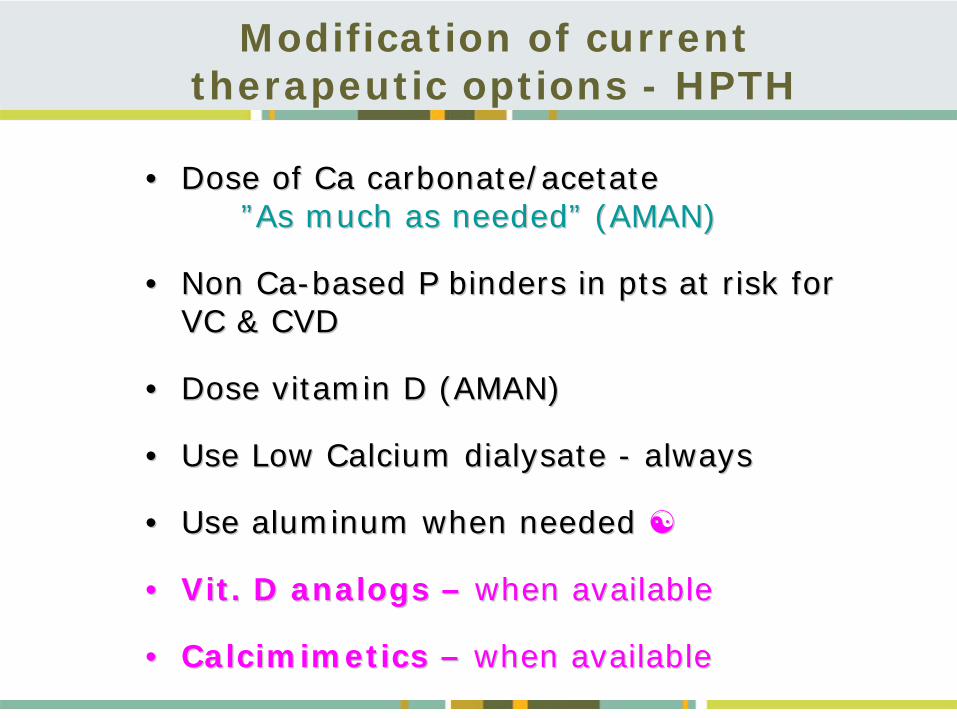
Modification of current therapeutic options - HPTH
•• Dose of Ca carbonate/acetateDose of Ca carbonate/acetate ””As much as neededAs much as needed”” (AMAN)(AMAN)
•• Non CaNon Ca--based P binders in pts at risk for based P binders in pts at risk for VC & CVDVC & CVD
•• Dose vitamin D (AMAN)Dose vitamin D (AMAN)
•• Use Low Calcium dialysate Use Low Calcium dialysate -- alwaysalways
•• Use aluminum when neededUse aluminum when needed
•• Vit. D analogs Vit. D analogs –– when available when available ��
•• CalcimimeticsCalcimimetics –– when available when available ��
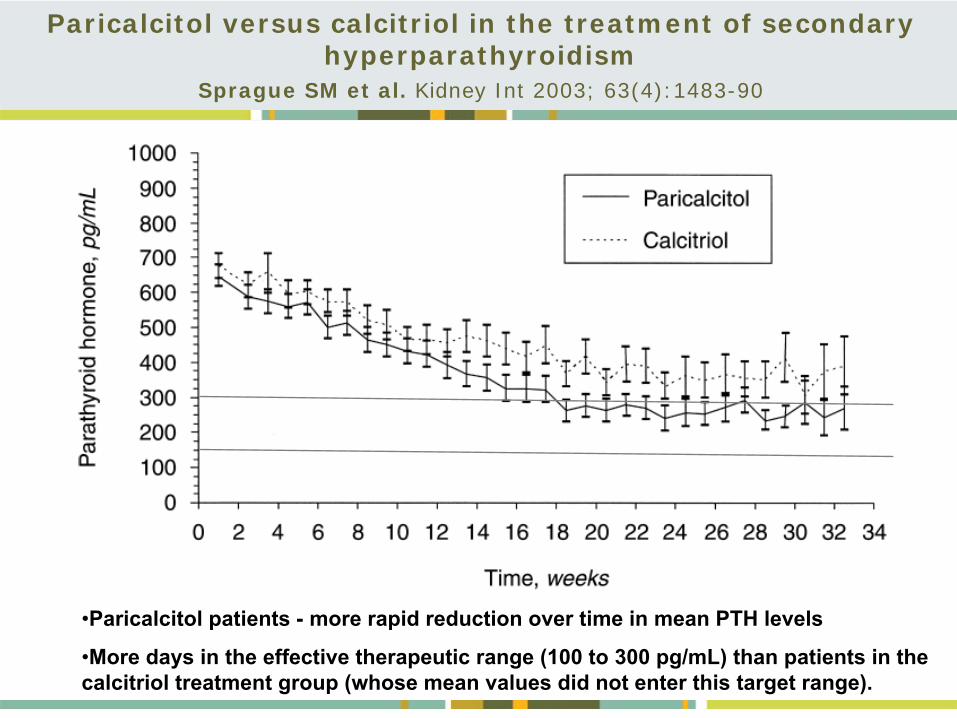
•Paricalcitol patients -
more rapid reduction over time in mean PTH levels
•More days in the effective therapeutic range (100 to 300 pg/mL) than patients in the calcitriol treatment group (whose mean values did not enter this
target range).
Paricalcitol versus calcitriol in the treatment of secondary hyperparathyroidism
Sprague SM et al. Kidney Int 2003; 63(4):1483-90
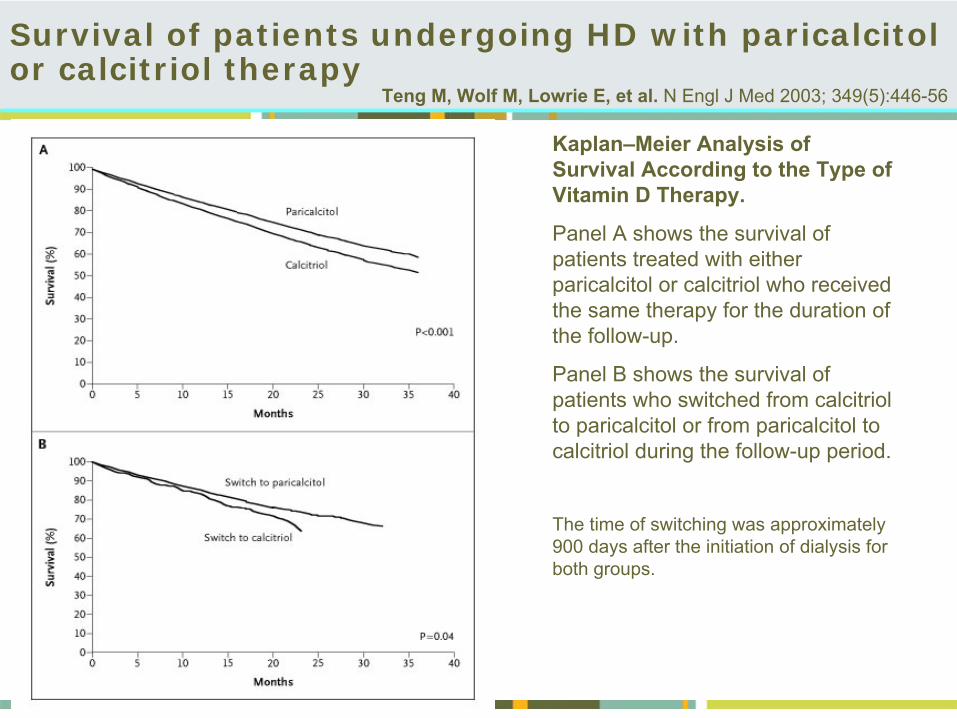
Survival of patients undergoing HD with paricalcitol or calcitriol therapy
Teng M,
Wolf M,
Lowrie E, et al. N Engl J Med 2003;
349(5):446-56
Kaplan–Meier Analysis of Survival According to the Type of Vitamin D Therapy.
Panel A shows the survival of patients treated with either paricalcitol or calcitriol who received the same therapy for the duration of the follow-up.
Panel B shows the survival of patients who switched from calcitriol to paricalcitol or from paricalcitol to calcitriol during the follow-up period.
The time of switching was approximately 900 days after the initiation of dialysis for both groups.
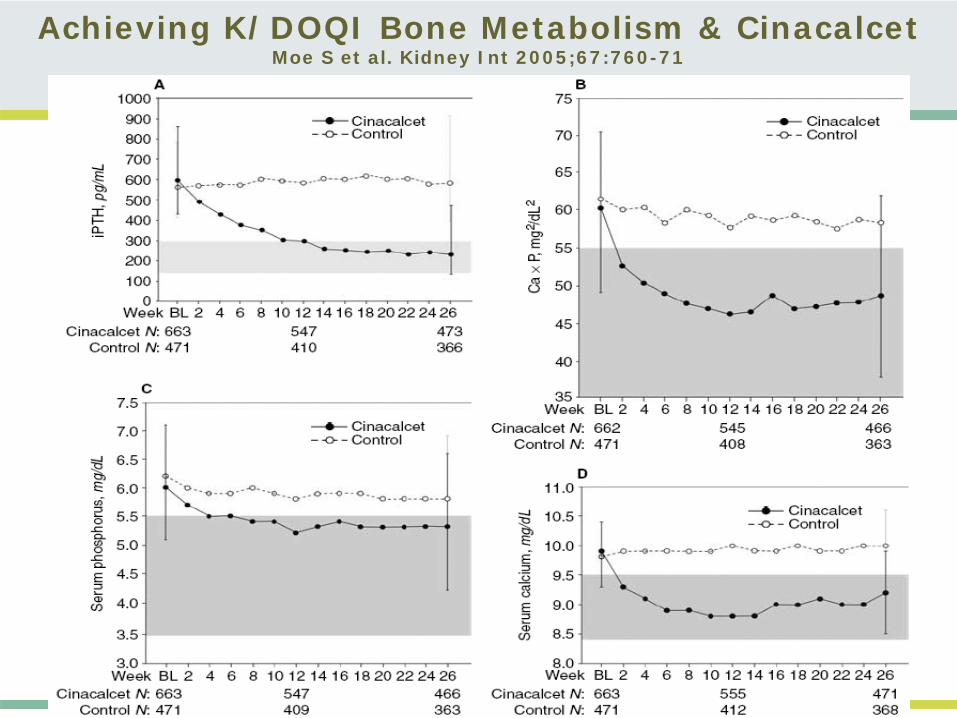
Achieving K/DOQI Bone Metabolism & CinacalcetMoe S et al. Kidney Int 2005;67:760-71
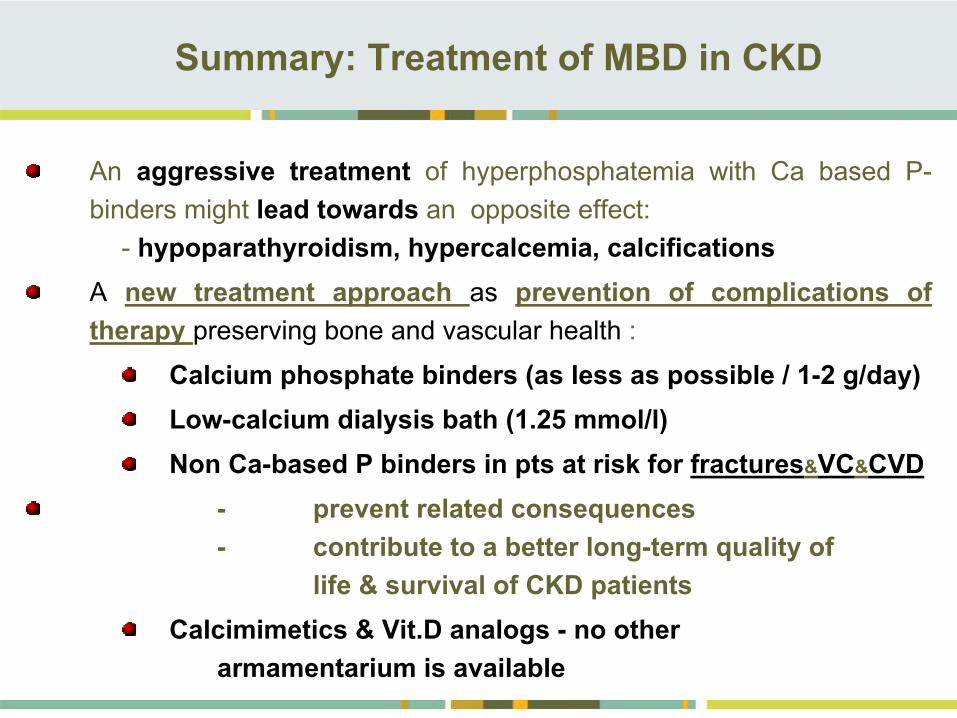
Summary: Treatment of MBD in CKD
An aggressive treatment
of hyperphosphatemia
with Ca based P- binders might lead towards
an
opposite effect:
-
hypoparathyroidism,
hypercalcemia, calcificationsA new treatment approach as prevention of complications of therapy preserving bone and vascular health :
Calcium phosphate binders (as less as possible / 1-2 g/day) Low-calcium dialysis bath (1.25 mmol/l)Non Ca-based P binders in pts at risk for fractures&VC&CVD
- prevent related consequences
- contribute to a better long-term quality of life & survival of CKD patients
Calcimimetics & Vit.D analogs -
no other armamentarium is available
Treat the Hyperphosphatemia
& Bones in order to save blood vessels & the Heart!


