Management of Multiple Sources of Risk in LivestockProduction
Melissa G.S. McKendree1,* , Glynn T. Tonsor2 and Lee L. Schulz3
1Department of Agricultural, Food, and Resource Economics, Michigan State University, East Lansing, MI, USA, 2Departmentof Agricultural Economics, Kansas State University, Manhattan, KS, USA and 3Department of Economics, Iowa StateUniversity, Ames, IA, USA*Corresponding author. Email: [email protected]
AbstractFirm operators continually manage multiple sources of risk. In an application to cattle feedlot operations,our objective is to determine if producers view output price and animal health risks separately or jointly.We conduct a survey with a choice experiment placing operators in forward looking, decision-makingscenarios, and capture information on past risk management approaches. Evidence regarding a relation-ship between animal health and output price risk mitigation is mixed and depends on the decision beingmade. Combined, these results provide new insight into how managers approach multiple risks when fac-ing resource constraints.
Firms must continually manage multiple sources of risk while operating with a resource con-straint, whether that firm is a commercial fishing operation (Smith and Wilen, 2005), a spaceshuttle tile manufacturer (Pate-Cornell, 1996), or a livestock producer. Economists recognizepotential correlations between multiple sources of risk and understand trade-offs exist betweenrisk mitigation strategies (Smith and Wilen, 2005). For example, Du et al. (2015) investigatedthe relationship between crop producers’ use of marketing contracts and crop insurance, two riskmitigation strategies. Furthermore, Smith and Wilen (2005) determined commercial fishermen’spreferences for physical and financial risks are positively correlated. Similar to fishermen and cropproducers, cattle feedlot operators face multiple sources of risk, which impact profitability.
Cattle feedlot operators buy feeder cattle (approximately 1 year of age, weighing between 600and 1,000 pounds (lbs)), feed and care for them for about 6 months, and then sell fed (or live)cattle (finish weight between 1,200 and 1,400 lbs) to a beef processor.1 Agricultural producers,including feedlot operations, face input and output price (marketing), production, human, legal,and financial risk (Crane et al., 2013). Past literature has often focused on price or yield risk inisolation. Few studies have sought to understand the relationship between multiple risks and nostudy has investigated how feedlot producers actually manage these multiple risks. Our analysisseeks to fill this gap.
Price risk is one of the largest risks faced by producers (Belasco et al., 2009; Goodwin andSchroeder, 1994). Furthermore, beef cattle producers rank cattle price variability as one of the
top potential risk factors on their operation (Hall et al., 2003). Accordingly, research has largelyfocused on the role of futures and options markets to mitigate price risk from corn price increases(input), feeder cattle price increases (input), and live cattle price decreases (output) (Hart,Babcock, and Hayes, 2001; Mark, Schroeder, and Jones, 2000; Schroeder and Hayenga, 1988;Tonsor and Schroeder, 2011). Recognizing the price risk faced by livestock producers, the2000 Agricultural Protection Act extended crop insurance to livestock. The U.S. Departmentof Agriculture (USDA) Risk Management Agency oversees two insurance programs to help live-stock producers manage price risk, the Livestock Risk Protection (LRP) and Livestock GrossMargin (LGM) programs. In 2019, both LGM and LRP were enhanced to better suit needs oflivestock producers including expanded coverage to all 50 states and increased subsidy rates(Feedstuffs, 2019).
In addition to price risk, feedlot operators face production risks that extend beyond feed con-version and average daily gain (ADG). Many factors in U.S. cattle marketing practices contributeto the potential disease risk and stress of incoming cattle including cattle commingled from dif-ferent sources, traveling long distances, and abrupt changes in diet and feed intake (Step et al.,2008). Given that feedlots recognize the impact different calf management practices can haveon feedlot performance and carcass quality, premiums exist for value-added programs whichdecrease disease and production risk such as source and age verification, preconditioning andweaning programs (Blank, Saitone, and Sexton, 2016; Zimmerman et al., 2012). Furthermore, ani-mal disease events, like bovine spongiform encephalopathy in late 2003, may be rare, but are dam-aging, if not devastating, to operations that experience drastic reductions in output or spikes inproduction costs (Schroeder et al., 2015). For this analysis, we choose to focus on one potentialhealth and disease risk mitigation strategy—procuring feeder cattle from a single known source.
When feedlot operators make placement decisions, they can procure the quantity of feedercattle desired from a single seller or assemble feeder cattle from multiple sources. When placedin feedlots, feeder cattle must adapt to new environments, establish a social hierarchy, and adjustto a new diet (Rambo, 2014). Commingling feeder cattle from multiple sources into a single pen atthe feedlot versus cattle being from a single source has been associated with higher morbidity ratesdue to increased stress and pathogen exposure, especially in studies of bovine respiratory disease(Edwards, 2010; O’Connor, Sorden, and Apley, 2005; Step et al., 2008). Furthermore, Step et al.(2008) found that calves from single source tended to have higher ADG than calves in com-mingled pens or calves purchased from auction markets. Health costs were also less for calvesfrom a single source that were weaned for 45 days prior to transport than those shipped immedi-ately after weaning or commingled from multiple sources. Abidoye and Lawrence (2006) foundthat single source cattle had superior carcass quality, health, and performance than backgroundedor commingled preconditioned cattle. Therefore, single source cattle have been shown to decreaseanimal health and production risks compared to cattle of unknown backgrounds or commingledcattle.
Belasco et al. (2009) developed an ex-ante model of price and yield risks associated with cattlefeeding, determining that both of these risks have statistically significant impacts on the condi-tional mean and variability of profits. However, no study has investigated how feedlot producersactually manage multiple risk sources. Our objective is to determine if feedlot producers manageoutput price risk and animal health risk as two separate and independent risks or if they managethem jointly. To accomplish this, we surveyed feedlot operators about their historical use of riskmanagement strategies and risk attitudes. We also included a choice experiment where respond-ents made decisions in situations intentionally designed to meet this project objective. For output(live cattle) price risk management, we focus on producers’ use of futures hedging (buying/sellingfutures contracts or buying options contracts), forward contracts, other programs (e.g., LRP insur-ance, LGM insurance), or accepting cash (spot market) price at the time of sale. For animal healthrisk we focus on a producers’ management of animal health within their operation, specificallyfeeder cattle procurement. Determining if and what kind of relationship exists between animal
76 Melissa G.S. McKendree et al.
health and output price risk mitigation can inform the development of more complete risk miti-gation strategies.
The main contribution of this research is determining whether cattle feedlot operators manageoutput price and animal health risk independently or jointly. Operations have a fixed budget.Therefore, feedlot operators could decide to implement increased animal health risk mitigationstrategies instead of hedging using futures market contracts (substitute relationship). Conversely,animal health and output price risk mitigation strategies could be complements. For example,management practices could decrease uncertainty in production and therefore operators couldbetter match their production to futures contracts, increasing futures contract usage. This couldpossibly help explain past “surprises” by analysts when producers have hedged price risk less thanscholars “expected” (Goodwin and Schroeder, 1994; Moschini and Hennessy, 2001).
1. Conceptual ModelProducers face uncertain outcomes when utilizing risk management practices. They will choose toimplement a practice if their expected utility of profits when using the practice exceeds theirexpected utility of profits without the practice. Following Moschini and Hennessy (2001), weassume feedlot operators make decisions on output price and animal health risk managementby comparing the expected utility of profit from different scenarios. Assume feedlot operator iwill make decisions to maximize their expected utility:
EUi � E Ui w0;i � πi
� �� �(1)
where EUi is the expected utility of feedlot operator i, w0;i is initial wealth, and πi is profit from thecattle feeding enterprise which is a random variable (i subscripts are hereafter omitted for conve-nience). Profit for the cattle feeding enterprise is the sum of profit per pen (b pens):
π �Xb
πb: (2)
Profit per pen of cattle is a function of input and output prices and quantities. However, whenfeedlot operators place cattle there is uncertainty about prices and quantities—making profit arandom variable. Following Moschini and Hennessy (2001), profit can be rewritten as:
π � PG�x; e� � rx � K (3)
where P is output price, G�x; e� is a stochastic production function where realized output dependson the input vector x and a random variable e, r is a vector of input prices, and K is fixed costs.This framework can be adapted to feedlot operators’ decision-making under price and animalhealth risk, holding all else equal. In online supplementary Appendix A, we consider two demon-strative scenarios, allowing one risk type to vary while holding the other fixed.
One link between mitigating output price risk and utilizing animal health production practicescould be the expectation of total pounds of finished cattle versus the actual pounds produced.Expected and actual pounds produced can vary from weather, animal disease, and management,among other factors. These production risks can result in reductions in ADG per animal or deathloss. A large variance in pounds produced per pen could alter producers’ risk mitigation strategies.For example, feedlot operators may be less likely to establish an expected selling price because theycannot properly assess the number of futures contracts needed or specifications they should agreeto in a forward contract. However, if animal health production practices decrease finishing weightvariability and death loss, then operators may make more informed output price risk managementdecisions.
Substitute, complementary, or no relationship could exist between output price risk and animalhealth risk mitigation strategies. Risk mitigation strategies are not free and feedlot operations havea limited budget. A feedlot operator could decide the feedlot should only invest in animal healthmitigation strategies instead of also managing output price risk—an example of substitution.Alternatively, operators could view output price and animal health risk mitigation strategies ascomplements. Instead there could be no relationship between feedlot operators’ decisions regard-ing price risk and animal health risk mitigation strategies. Determining this relationship is a corecomponent of our analysis. We hypothesize there is some relationship between output price riskand animal health risk mitigation strategies. However, to investigate this hypothesis, we need toanalyze individual feedlot operators’ decision-making.
2. Data CollectionPrimary data were collected from feedlot operators, see online supplementary Appendix B for thesurvey instrument. The survey was programmed for Web application using Qualtrics software(Qualtrics Provo, UT, USA). Feedlots in Colorado, Iowa, Kansas, Nebraska, and Texas were sur-veyed. These states comprise five of the eight states in the widely cited, “5-market” average pricereported by the USDA. Furthermore, these states house nearly 31% of U.S. feedlots with sales forslaughter and 76% of feedlot sales according to the 2017 Census of Agriculture (USDA-NASS,2019a). The Colorado Livestock Association, Iowa Cattlemen’s Association, Kansas LivestockAssociation, Nebraska Cattleman, and Texas Cattle Feeders Association distributed a uniformresource locator through an email list of members. To increase survey response and expand dis-tribution, Feedlot Magazine also distributed the survey web address to its subscribers.2
After answering several introductory questions on the survey, respondents were asked to par-ticipate in a choice experiment. The respondent’s past use of risk management and attitudes con-cerning risk were also obtained in the survey.
The survey was live from January 19, 2017 to February 14, 2017.3 There were 588 responses.4
However, 232 participants who did not have a feedlot enterprise and/or did not make price oranimal health risk management decisions were dismissed from the survey after the qualificationquestions. Additionally, 75 participants who qualified to continue but did not answer the choiceexperiment questions were excluded—reducing the useable sample to 281.
Table 1 reports selected survey respondent characteristics. The sample is representative of U.S.feedlot producers. Feedlot operators from Iowa comprise 50% of the sample, Nebraska 19%, Texas10%, Kansas 6%, and Colorado 5%. According to the 2017 Census of Agriculture, there were 9,309feedlot operations with sales for slaughter in these five states: 4% from Colorado, 59% from Iowa,11% from Kansas, 22% from Nebraska, and 4% from Texas (USDA-NASS, 2019a). Fifty-eightpercent of respondents are from operations with capacity over 1,000 head. With respect toDecember 1, 2017, the Census of Agriculture reports operations with 1,000 or more head of cattleon feed comprised 12% of feedlots from these five states but 86% of the cattle on feed inventory(USDA-NASS, 2019a). Thus, the operations within our sample are larger than the census average
2An operation could have received an invitation from multiple sources (i.e., their state cattlemen’s association and FeedlotMagazine). However, the “prevent ballot box stuffing” option was used in Qualtrics to prevent participants from taking thesurvey more than once.
3Feedlot Magazine sent the survey invitation on January 19 and 26, Iowa Cattlemen’s Association on January 19 and 26,Kansas Livestock Association on January 19 and 30, Nebraska Cattleman on January 23 and 30, Texas Cattle FeedersAssociation on January 24 and 30, and Colorado Livestock Association on February 8.
4The authors did not have access to the email lists of possible participants as the partner organizations sent the invitations toparticipants. Therefore, we do not know the total number of operations who received an invitation to complete the survey. Assuch, no response rate could be calculated because there was no defined sample.
but do represent the majority of feedlot inventories.5 Just over 20% of survey participants are con-sidered custom feeders owning less than 40% of cattle in their feedlot.6 According to the 2017Census of Agriculture, in these five states 7% of farms custom fed cattle shipped directly forslaughter, accounting for 42% of the sales for slaughter (USDA-NASS, 2019a).
The average respondent age is 49 years old, with a minimum and maximum age of 23 and85 years. In the 2017 Census of Agriculture, the simple average age of cattle feedlot producerswas 55 for the five surveyed states (USDA-NASS, 2019b).7 Given that our survey was administeredonline, the younger average age is expected. Nearly half of the participants have at least aBachelor’s degree. This educational attainment is similar to other studies of beef producers. InMcKendree, Tonsor and Wolf (2018), 51% of cow–calf producers surveyed had earned at leasta Bachelor’s degree.
Participants were asked questions to gauge their risk aversion following the Global Risk-Attitude Construct (GRAC) defined in Pennings and Garcia (2001). It was determined that factorvariables were not needed as only one GRAC question captures risk attitudes. Therefore, partic-ipants are considered risk averse (nearly 57%) if they somewhat agree, agree, or strongly agree withthe statement, “I usually like ‘playing it safe’ (for instance, ‘locking in a price’) instead of takingrisks for market prices for fed cattle.”
Since animal health and price risk management are of key interest, participants were askedabout their past price determination methods and past feeder cattle sourcing. Participants were
Table 1. Summary statistics
Treatment
Full sample 1 2 3 4 5 6 7
Number of observations 281 40 41 42 36 42 41 38
CO 5.34% 5.00% 7.32% 4.76% 5.56% 2.38% 4.88% 7.89%
IA 49.47% 47.50% 51.22% 40.48% 44.44% 61.90% 46.34% 55.26%
5The census definition of a farm is any place that produced and sold, or normally would have sold, $1,000 or more ofagricultural products during the census year (USDA-NASS, 2019a).
6The custom feeder determination was made by the researchers such that the majority of animals fed were not owned by thefeedlot.
7The cattle feedlots (North American Industry Classification System [NAICS] 112112) industry was used and comprisesestablishments primarily engaged in feeding cattle for fattening (OMB, 2017).
Journal of Agricultural and Applied Economics 79
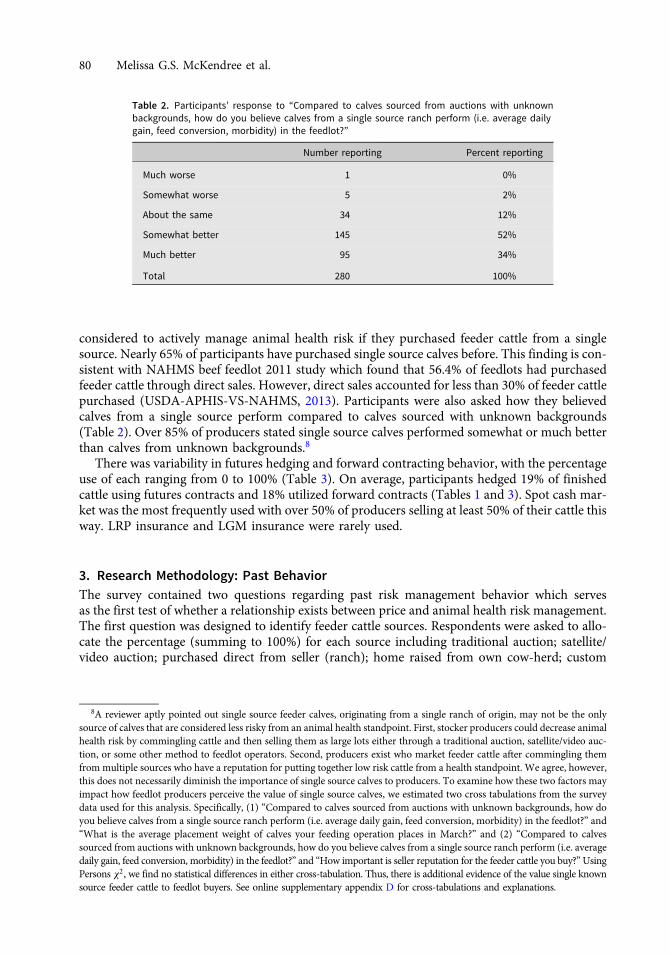
considered to actively manage animal health risk if they purchased feeder cattle from a singlesource. Nearly 65% of participants have purchased single source calves before. This finding is con-sistent with NAHMS beef feedlot 2011 study which found that 56.4% of feedlots had purchasedfeeder cattle through direct sales. However, direct sales accounted for less than 30% of feeder cattlepurchased (USDA-APHIS-VS-NAHMS, 2013). Participants were also asked how they believedcalves from a single source perform compared to calves sourced with unknown backgrounds(Table 2). Over 85% of producers stated single source calves performed somewhat or much betterthan calves from unknown backgrounds.8
There was variability in futures hedging and forward contracting behavior, with the percentageuse of each ranging from 0 to 100% (Table 3). On average, participants hedged 19% of finishedcattle using futures contracts and 18% utilized forward contracts (Tables 1 and 3). Spot cash mar-ket was the most frequently used with over 50% of producers selling at least 50% of their cattle thisway. LRP insurance and LGM insurance were rarely used.
3. Research Methodology: Past BehaviorThe survey contained two questions regarding past risk management behavior which servesas the first test of whether a relationship exists between price and animal health risk management.The first question was designed to identify feeder cattle sources. Respondents were asked to allo-cate the percentage (summing to 100%) for each source including traditional auction; satellite/video auction; purchased direct from seller (ranch); home raised from own cow-herd; custom
Table 2. Participants’ response to “Compared to calves sourced from auctions with unknownbackgrounds, how do you believe calves from a single source ranch perform (i.e. average dailygain, feed conversion, morbidity) in the feedlot?”
Number reporting Percent reporting
Much worse 1 0%
Somewhat worse 5 2%
About the same 34 12%
Somewhat better 145 52%
Much better 95 34%
Total 280 100%
8A reviewer aptly pointed out single source feeder calves, originating from a single ranch of origin, may not be the onlysource of calves that are considered less risky from an animal health standpoint. First, stocker producers could decrease animalhealth risk by commingling cattle and then selling them as large lots either through a traditional auction, satellite/video auc-tion, or some other method to feedlot operators. Second, producers exist who market feeder cattle after commingling themfrommultiple sources who have a reputation for putting together low risk cattle from a health standpoint. We agree, however,this does not necessarily diminish the importance of single source calves to producers. To examine how these two factors mayimpact how feedlot producers perceive the value of single source calves, we estimated two cross tabulations from the surveydata used for this analysis. Specifically, (1) “Compared to calves sourced from auctions with unknown backgrounds, how doyou believe calves from a single source ranch perform (i.e. average daily gain, feed conversion, morbidity) in the feedlot?” and“What is the average placement weight of calves your feeding operation places in March?” and (2) “Compared to calvessourced from auctions with unknown backgrounds, how do you believe calves from a single source ranch perform (i.e. averagedaily gain, feed conversion, morbidity) in the feedlot?” and “How important is seller reputation for the feeder cattle you buy?”UsingPersons χ2, we find no statistical differences in either cross-tabulation. Thus, there is additional evidence of the value single knownsource feeder cattle to feedlot buyers. See online supplementary appendix D for cross-tabulations and explanations.
fed, so I did not buy or own animals; and other. We choose to look at participants’ use of pur-chasing direct from seller (ranch) as the health risk mitigation strategy of interest. Participantswere considered to mitigate animal health risk if they purchased feeder cattle directly from theseller (ranch). The second question was designed to identify pricing methods for marketing fin-ished cattle. Respondents were asked to allocate the percentage (summing to 100%) for eachmethod including spot cash market; forward contract or marketing agreement; futures hedge;options hedge; LRP insurance; LGM insurance; and other. Cattle marketed using the spot priceonly were considered to not be mitigating price risk.
Tobit models were utilized to estimate the relationship between past behavior of purchasingfeeder animals direct from seller and output price risk management. The two latent variables ofinterest (indicated with a * subscript), the percent of feeder cattle purchased direct from seller(directseller�i ), and the percent of finished cattle marketed on the spot cash market (spot�i ) weremodeled as:
Table 3. Participants’ response to “In the past 12 months, what percentage of the following pricing methods did youroperation use for marketing finished cattle (should sum to 100%)”
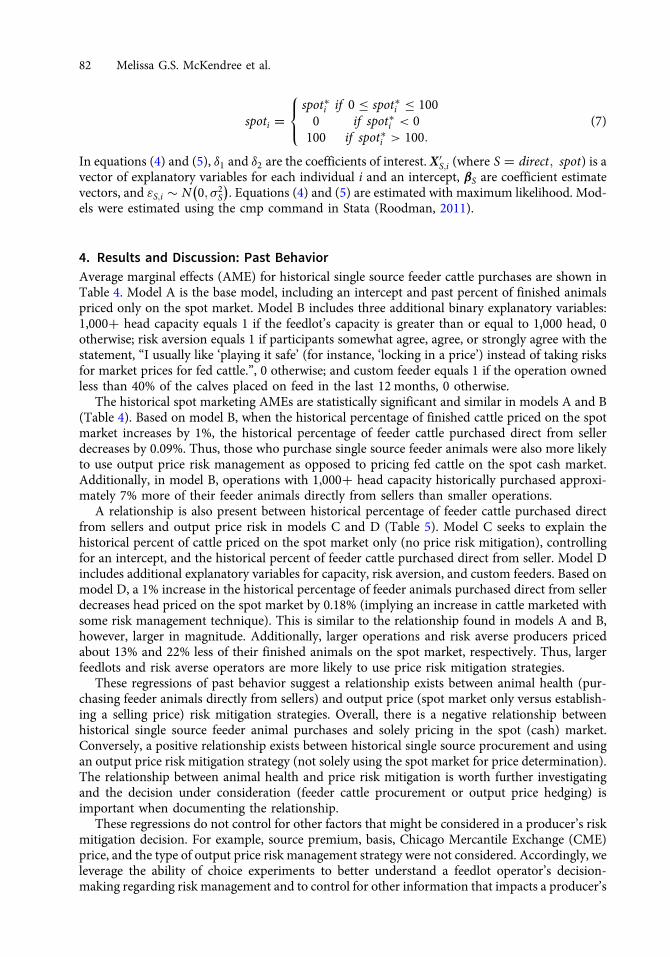
In equations (4) and (5), δ1 and δ2 are the coefficients of interest. X0S;i (where S � direct; spot) is a
vector of explanatory variables for each individual i and an intercept, βS are coefficient estimatevectors, and εS;i � N 0; σ2
S
� �. Equations (4) and (5) are estimated with maximum likelihood. Mod-
els were estimated using the cmp command in Stata (Roodman, 2011).
4. Results and Discussion: Past BehaviorAverage marginal effects (AME) for historical single source feeder cattle purchases are shown inTable 4. Model A is the base model, including an intercept and past percent of finished animalspriced only on the spot market. Model B includes three additional binary explanatory variables:1,000� head capacity equals 1 if the feedlot’s capacity is greater than or equal to 1,000 head, 0otherwise; risk aversion equals 1 if participants somewhat agree, agree, or strongly agree with thestatement, “I usually like ‘playing it safe’ (for instance, ‘locking in a price’) instead of taking risksfor market prices for fed cattle.”, 0 otherwise; and custom feeder equals 1 if the operation ownedless than 40% of the calves placed on feed in the last 12 months, 0 otherwise.
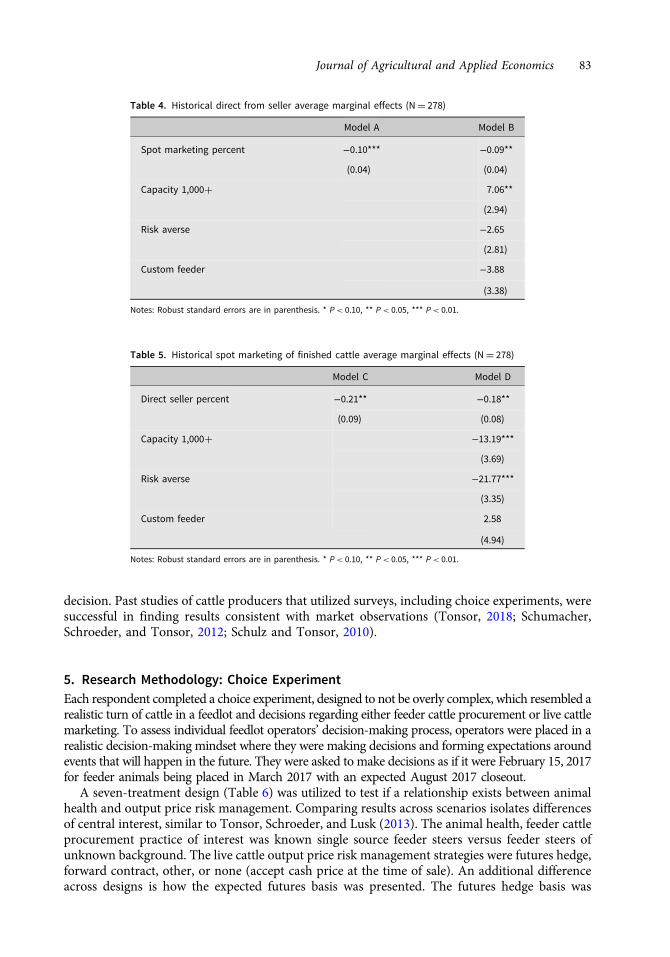
The historical spot marketing AMEs are statistically significant and similar in models A and B(Table 4). Based on model B, when the historical percentage of finished cattle priced on the spotmarket increases by 1%, the historical percentage of feeder cattle purchased direct from sellerdecreases by 0.09%. Thus, those who purchase single source feeder animals were also more likelyto use output price risk management as opposed to pricing fed cattle on the spot cash market.Additionally, in model B, operations with 1,000� head capacity historically purchased approxi-mately 7% more of their feeder animals directly from sellers than smaller operations.
A relationship is also present between historical percentage of feeder cattle purchased directfrom sellers and output price risk in models C and D (Table 5). Model C seeks to explain thehistorical percent of cattle priced on the spot market only (no price risk mitigation), controllingfor an intercept, and the historical percent of feeder cattle purchased direct from seller. Model Dincludes additional explanatory variables for capacity, risk aversion, and custom feeders. Based onmodel D, a 1% increase in the historical percentage of feeder animals purchased direct from sellerdecreases head priced on the spot market by 0.18% (implying an increase in cattle marketed withsome risk management technique). This is similar to the relationship found in models A and B,however, larger in magnitude. Additionally, larger operations and risk averse producers pricedabout 13% and 22% less of their finished animals on the spot market, respectively. Thus, largerfeedlots and risk averse operators are more likely to use price risk mitigation strategies.
These regressions of past behavior suggest a relationship exists between animal health (pur-chasing feeder animals directly from sellers) and output price (spot market only versus establish-ing a selling price) risk mitigation strategies. Overall, there is a negative relationship betweenhistorical single source feeder animal purchases and solely pricing in the spot (cash) market.Conversely, a positive relationship exists between historical single source procurement and usingan output price risk mitigation strategy (not solely using the spot market for price determination).The relationship between animal health and price risk mitigation is worth further investigatingand the decision under consideration (feeder cattle procurement or output price hedging) isimportant when documenting the relationship.
These regressions do not control for other factors that might be considered in a producer’s riskmitigation decision. For example, source premium, basis, Chicago Mercantile Exchange (CME)price, and the type of output price risk management strategy were not considered. Accordingly, weleverage the ability of choice experiments to better understand a feedlot operator’s decision-making regarding risk management and to control for other information that impacts a producer’s
82 Melissa G.S. McKendree et al.
decision. Past studies of cattle producers that utilized surveys, including choice experiments, weresuccessful in finding results consistent with market observations (Tonsor, 2018; Schumacher,Schroeder, and Tonsor, 2012; Schulz and Tonsor, 2010).
5. Research Methodology: Choice ExperimentEach respondent completed a choice experiment, designed to not be overly complex, which resembled arealistic turn of cattle in a feedlot and decisions regarding either feeder cattle procurement or live cattlemarketing. To assess individual feedlot operators’ decision-making process, operators were placed in arealistic decision-making mindset where they were making decisions and forming expectations aroundevents that will happen in the future. They were asked to make decisions as if it were February 15, 2017for feeder animals being placed in March 2017 with an expected August 2017 closeout.
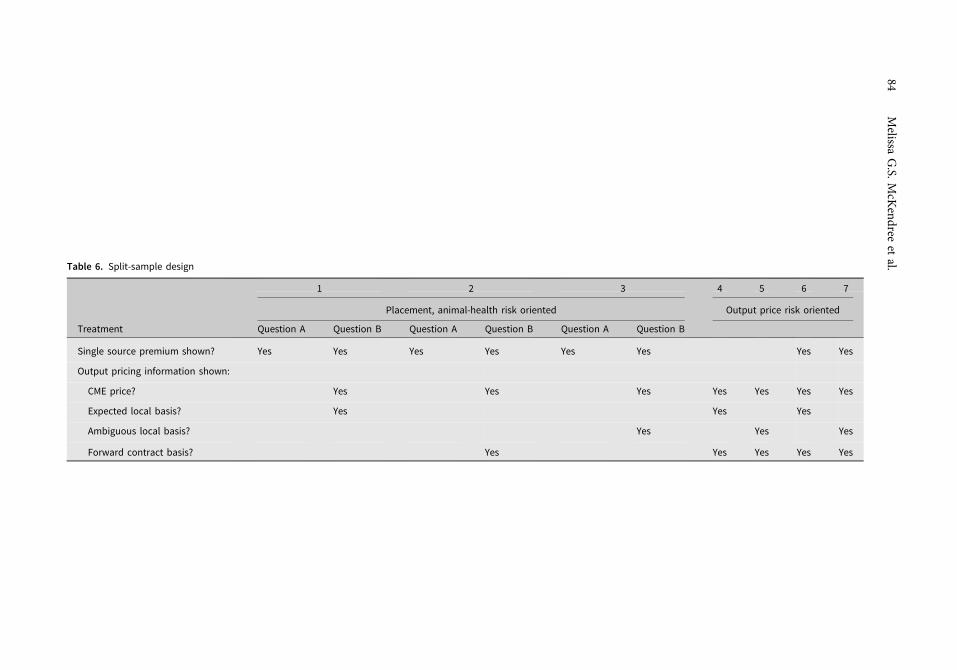
A seven-treatment design (Table 6) was utilized to test if a relationship exists between animalhealth and output price risk management. Comparing results across scenarios isolates differencesof central interest, similar to Tonsor, Schroeder, and Lusk (2013). The animal health, feeder cattleprocurement practice of interest was known single source feeder steers versus feeder steers ofunknown background. The live cattle output price risk management strategies were futures hedge,forward contract, other, or none (accept cash price at the time of sale). An additional differenceacross designs is how the expected futures basis was presented. The futures hedge basis was
Table 5. Historical spot marketing of finished cattle average marginal effects (N= 278)
Model C Model D
Direct seller percent −0.21** −0.18**
(0.09) (0.08)
Capacity 1,000� −13.19***
(3.69)
Risk averse −21.77***
(3.35)
Custom feeder 2.58
(4.94)
Notes: Robust standard errors are in parenthesis. * P< 0.10, ** P< 0.05, *** P< 0.01.
Table 4. Historical direct from seller average marginal effects (N= 278)
Model A Model B
Spot marketing percent −0.10*** −0.09**
(0.04) (0.04)
Capacity 1,000� 7.06**
(2.94)
Risk averse −2.65
(2.81)
Custom feeder −3.88
(3.38)
Notes: Robust standard errors are in parenthesis. * P< 0.10, ** P< 0.05, *** P< 0.01.
presented two ways: unambiguous (e.g., −$1.00/cwt) or ambiguous (e.g., 35% chance of being lessthan −$1.00/cwt and 65% chance of being greater than −$1.00/cwt) (Di Mauro and Maffioletti,2004). Basis ambiguity was included to understand how producers form their price expectationsand how basis uncertainty might alter risk mitigation decisions.
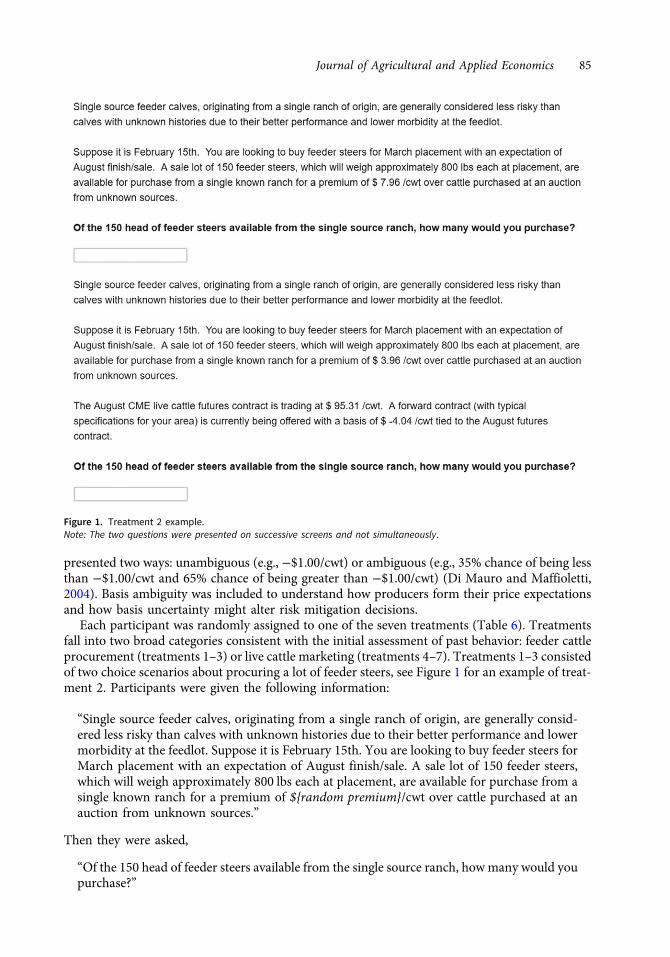
Each participant was randomly assigned to one of the seven treatments (Table 6). Treatmentsfall into two broad categories consistent with the initial assessment of past behavior: feeder cattleprocurement (treatments 1–3) or live cattle marketing (treatments 4–7). Treatments 1–3 consistedof two choice scenarios about procuring a lot of feeder steers, see Figure 1 for an example of treat-ment 2. Participants were given the following information:
“Single source feeder calves, originating from a single ranch of origin, are generally consid-ered less risky than calves with unknown histories due to their better performance and lowermorbidity at the feedlot. Suppose it is February 15th. You are looking to buy feeder steers forMarch placement with an expectation of August finish/sale. A sale lot of 150 feeder steers,which will weigh approximately 800 lbs each at placement, are available for purchase from asingle known ranch for a premium of ${random premium}/cwt over cattle purchased at anauction from unknown sources.”
Then they were asked,
“Of the 150 head of feeder steers available from the single source ranch, howmany would youpurchase?”
Figure 1. Treatment 2 example.Note: The two questions were presented on successive screens and not simultaneously.
Journal of Agricultural and Applied Economics 85
In this first question, no output pricing information is given and the exact same initial question isgiven in treatments 1–3. However, in the second question additional potential output pricinginformation is provided as an information shock. In treatments 1 and 3, participants are providedinformation needed for a futures hedge, including the August CME live cattle futures contractprice and expected local basis. In treatment 1, the futures basis is unambiguous, but is ambiguousin treatment 3. In treatment 2, information for a forward contract, including the August CME livecattle futures contract price and offered basis, is provided. By comparing responses across the twoquestions, we can test our core hypothesis as it relates to feeder cattle procurement.
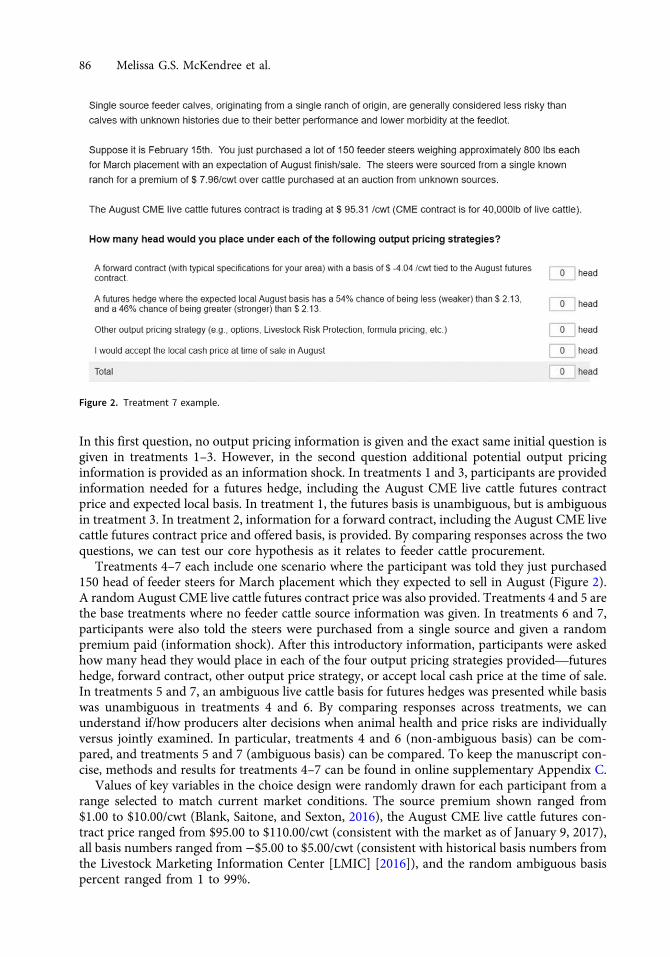
Treatments 4–7 each include one scenario where the participant was told they just purchased150 head of feeder steers for March placement which they expected to sell in August (Figure 2).A random August CME live cattle futures contract price was also provided. Treatments 4 and 5 arethe base treatments where no feeder cattle source information was given. In treatments 6 and 7,participants were also told the steers were purchased from a single source and given a randompremium paid (information shock). After this introductory information, participants were askedhow many head they would place in each of the four output pricing strategies provided—futureshedge, forward contract, other output price strategy, or accept local cash price at the time of sale.In treatments 5 and 7, an ambiguous live cattle basis for futures hedges was presented while basiswas unambiguous in treatments 4 and 6. By comparing responses across treatments, we canunderstand if/how producers alter decisions when animal health and price risks are individuallyversus jointly examined. In particular, treatments 4 and 6 (non-ambiguous basis) can be com-pared, and treatments 5 and 7 (ambiguous basis) can be compared. To keep the manuscript con-cise, methods and results for treatments 4–7 can be found in online supplementary Appendix C.
Values of key variables in the choice design were randomly drawn for each participant from arange selected to match current market conditions. The source premium shown ranged from$1.00 to $10.00/cwt (Blank, Saitone, and Sexton, 2016), the August CME live cattle futures con-tract price ranged from $95.00 to $110.00/cwt (consistent with the market as of January 9, 2017),all basis numbers ranged from −$5.00 to $5.00/cwt (consistent with historical basis numbers fromthe Livestock Marketing Information Center [LMIC] [2016]), and the random ambiguous basispercent ranged from 1 to 99%.
The choice experiments were hypothetical; however, our instructions specifically stated, “[ : : : ]. Itis important that you make your selection as if you were actually facing these choices in operation ofyour feed yard.” Cheap talk scripts, such as the one provided, have been shown to reduce hypotheti-cal bias in choice experiment research (Cummings and Taylor, 1999; Lusk, 2003; Tonsor and Shupp,2011). Furthermore, Lusk and Schroeder (2004) found that although total willingness to pay wasoverstated in hypothetical choice experiments, marginal willingness to pay was not statistically dif-ferent across hypothetical and actual payment scenarios. Thus, hypothetical bias concerns are miti-gated since our core hypotheses tests depend on net differences across treatments (Tonsor, 2011).
Econometrically, systems of Tobit models are utilized because the dependent variables (eitherfeeder cattle purchased or head placed in each output price risk strategy) are continuous but cen-sored between 0 and 150. Using these methods, marginal effects can be calculated and comparedacross designs to identify if relationships exist between animal health risk mitigation and outputprice risk mitigation.
For treatments 1–3, the two latent variables of interest (indicated with a * subscript) are the totalhead purchased when output pricing information is not shown (feederheadA�
i ) and total headpurchased when output price information is shown (feederheadB�
i ). These variables can be mod-eled as:
feederheadA�i � X0
A;iβA � εA;i (8)
feederheadB�i � X0
B;iβB � εB;i (9)
where the relationships between the latent variables and the observed variables are
feederheadAi �feederheadA�
i0150
if 0 ≤ feederheadA�i ≤ 150
if feederheadA�i < 0
if feederheadA�i > 150
8<: (10)
feederheadBi �feederheadB�
i0150
if 0 ≤ feederheadB�i ≤ 150
if feederheadB�i < 0
if feederheadB�i > 150:
8<:
In equations (8) and (9), X0k;i (where k � A; B) is a vector of information given in the question (e.g.,
source premium, CME price, basis) and explanatory variables for each individual i, βk are coefficientestimate vectors, and εk;i � N 0; σ2
k
� �. Equations (8) and (9) are modeled jointly with maximum
likelihood. The error terms εA;i and εB;i are specified following a bivariate normal distribution withzero mean, standard deviations σ2
A and σ2B, and correlation ρ. By estimating these equations jointly,
we can test if unobservable factors are impacting total head purchased in each question. If ρ is zero,then the equations can be estimated independently (Cornick, Cox, and Gould, 1994).
6. Results and Discussion: Choice ExperimentSummary statistics by treatment are shown in Table 1. Responses per treatment ranged from 36to 42.
For the following models, AMEs are reported in the article; however, model coefficient esti-mates are in online supplementary online supplementary Appendix E.
6.1. Purchasing Feeder Cattle (Treatment 1–3)
Recall, the difference between question A and question B is participants were presented additionalinformation (an information shock) on potential output price risk mitigation strategies in
question B (futures hedge information with non-ambiguous basis in treatment 1, forward con-tract in treatment 2, or futures hedge with ambiguous basis in treatment 3). Likelihood ratiotests were conducted to determine if observations from treatments 1–3 could be pooled. Thehypothesis that observations from the three treatments could be pooled was not rejectedX2 � 7:06; P value 0:99� �
. Therefore, there are no differences in responses to question Bbased on the output price risk mitigation information given or the ambiguous versus non-ambiguous basis presentation.
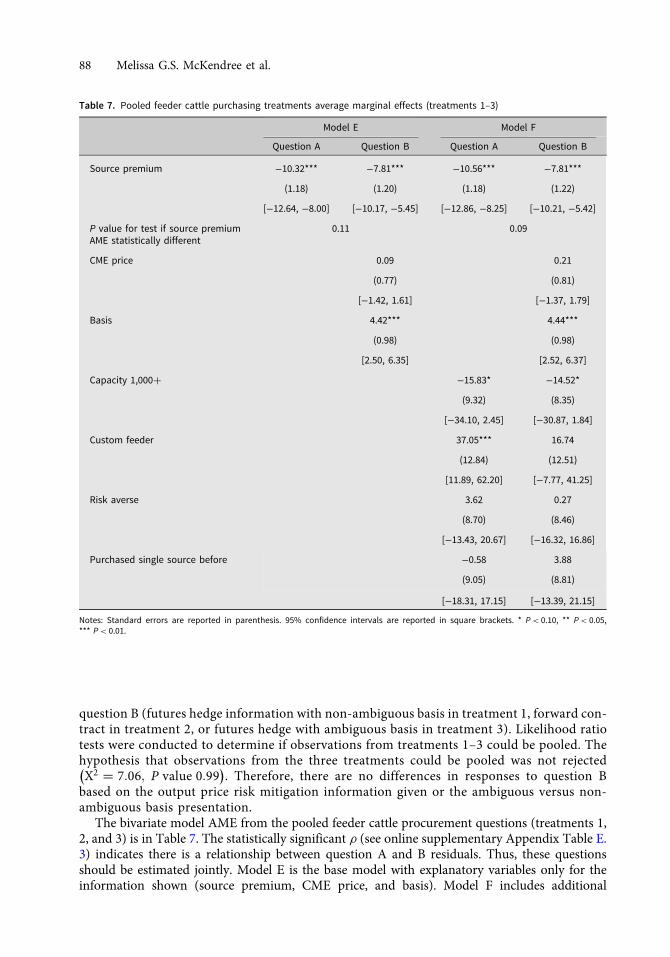
The bivariate model AME from the pooled feeder cattle procurement questions (treatments 1,2, and 3) is in Table 7. The statistically significant ρ (see online supplementary Appendix Table E.3) indicates there is a relationship between question A and B residuals. Thus, these questionsshould be estimated jointly. Model E is the base model with explanatory variables only for theinformation shown (source premium, CME price, and basis). Model F includes additional
Table 7. Pooled feeder cattle purchasing treatments average marginal effects (treatments 1–3)
explanatory variables: binary variables for operation size, custom feeder, risk aversion, and if theyhave purchased single source cattle before.
The source premium AMEs are negative, statistically significant, and similar across both mod-els E and F. Focusing on model F, a $1.00/cwt increase in the source premium decreases feedersteers purchased (from a maximum of 150) by 10.56 and 7.81 head in questions A and B, respec-tively. This indicates the willingness to purchase feeder cattle decreases as source premiumincreases. To test our hypothesis that a relationship exists between animal health and price riskmitigation strategies, we test if the source premium AMEs in questions A (no output price riskmitigation information) and B (output price risk mitigation information is given) are statisticallydifferent. The source premium marginal effects in questions A and B are statistically differentfrom each other (P value � 0:09) in model F and marginally different from each other(P value � 0:11) in model E. Thus, there is evidence that a relationship exists between animalhealth and price risk mitigation as operators were less sensitive to increases in source premiumwhenever output price risk mitigation information (CME price and basis) is given.
6.2. Discussion of Core Hypotheses in Treatments 1–3
Investigating the AMEs, there is evidence of a complementary relationship. Finding that thesource premium AME when no output pricing information is given (question A) is larger in mag-nitude (more elastic) than when output price hedging information is given (question B) supportsthis conclusion. An increase in source premium would decrease profit per head. Overall, the out-put hedging information shocks decrease the sensitivity to an increase in source premium.
In consumer choice studies, willingness to pay estimates vary depending on the number andmix of attributes shown (Pozo, Tonsor, and Schroeder, 2012; Gao and Schroeder, 2009).Therefore, we recognize that having more information presented (output price risk managementinformation) could influence coefficients and marginal effects. However, the identified relation-ship between source premium and output price risk mitigation information is rational. If outputprices are considered strong, then more feedlots will be interested in placing feeder steers andwould potentially consider paying a premium for single source steers. By purchasing single sourcesteers, producers reduce uncertainty on the animals’ performance, which in turn increases thelikelihood of actually receiving higher output prices. Conversely, if output prices are weak, thenfeedlots will place fewer cattle and potentially ignore single source cattle premiums.
6.3. Discussion of Core Hypotheses in Treatments 4–7
Results for treatments 4–7 are in online supplementary Appendix C. To test the core hypothesisthat a relationship between animal health risk and output price risk exists, the 95% confidenceintervals from the decomposed AMEs are compared across the base treatments and those withthe single source information shock.9 There is no evidence that the single source informationshock changes the AME of the output hedging information.
Multiple explanations for little evidence of a relationship between incoming cattle health riskand output pricing strategies exist. First of all, the hypothetical nature of the survey and how his-torical seasonality in profits partially align with any one-time assessment (Schulz, 2019) cannot beignored. Furthermore, livestock producers do not necessarily hedge at the time of placement butcan hedge at any time during the feeding period; this is especially true if the net price from thehedge is less than the breakeven price (Schulz, 2016). Our findings suggest that incoming cattlecharacteristics do not impact output hedging decisions (at least the source of cattle in our
9Schenker and Gentleman (2001) found that comparison of 95% confidence intervals is more conservative than standardmethods of significance testing when the null hypothesis is true and falsely rejects the null hypothesis more frequently whenthe null hypothesis is false.
experiment). Potentially, feedlot operators largely ignore incoming cattle characteristics becausethe decision is already made, likely reflecting pre-existing business relationships, and cannot bechanged. Thus, this sunk decision is not considered moving forward. Furthermore, potentiallyanimal health and price risk mitigation are handled by different managers at the feedlot.Therefore, these risks are managed independently even if they could potentially be managedjointly. This issue of risks not being considered jointly in complex systems was noted in Pate-Cornell (1996) when discussing tiles for space shuttles.
Alternatively, persistence of past behavior and existing relationships with live cattle buyers waspresent. There could be a high cost in switching output pricing or output risk management strat-egies. This could be a reason for little evidence of animal health risk mitigation informationimpacting output hedging decisions. In the U.S., there are approximately 729,000 operations withbeef cows, over 30,000 feedlots (USDA-NASS, 2019a), and 650 beef packing plants, 179 of whichharvest more than 1,000 head (USDA, 2017). Therefore, there are more options to buy feedercattle than to sell these cattle once finished. This would support our finding of a relationshipbetween incoming cattle and output pricing risk in the feeder cattle purchasing scenarios(treatments 1–3) but no relationship in the output pricing scenarios (treatments 4–7).
7. Conclusion and ImplicationsTo the best of our knowledge, this is the first study seeking to understand feedlot operators’decision-making regarding both animal health and output price risk management. Our objectivewas to determine if feedlot operators manage these two risks jointly or independently. The animalhealth practice of interest was single source steers while the output price risk management strate-gies were futures contracts, forward contracts, other, and none (accept cash price at the time ofsale). An online survey was utilized to collect primary data from feedlot operators about their useof risk management tools, producer and operation characteristics, and views on risk mitigation.A split-sample choice experiment was used, placing feedlot operators in a forward-looking mind-set to better understand their risk management decision-making. Treatments 1–3 asked operatorsfeeder steer procurement oriented questions while treatments 4–7 were output pricing orientedscenarios.
Simple Tobit models of past feeder cattle procurement and output hedging identified a negativerelationship between past purchases of feeder animals from a single source and sole use of spotmarkets in marketing (no price risk mitigation). Therefore, a positive relationship is impliedbetween animal health and output price risk mitigation. The split-sample choice experimentallowed for a deeper understanding of this relationship.
Using treatments 1–3, evidence of a complementary relationship between willingness to pay asource premium and output pricing information was found. Willingness to purchase single sourcecattle was more inelastic when output pricing information was provided. This complementaryrelationship could be one reason why producers do not hedge output price risk as much as ana-lysts expect. Potentially, if more single source cattle were available, or offered at a lower premium,producers would increase their use of output price hedging. Furthermore, since there is less uncer-tainty in single source feeder steers performance in the feedlot (e.g., finish weight, death loss, etc.),producers could more confidently match their production to futures and forward contractspecifications.
No evidence of a relationship was found between information on feeder cattle source and out-put pricing risk mitigation strategies in treatments 4–7. All of the AMEs for price risk manage-ment variables were not statistically different across treatments whether single source informationwas given or not, and many were insignificant. Potentially, these findings suggest that feedlotoperators view the feeder cattle purchase as a “sunk decision” when deciding how to manage out-put price risk. Therefore, producers only consider another risk mitigation strategy when that
90 Melissa G.S. McKendree et al.
decision is still applicable. Additionally, there was evidence of persistent behavior in output pricehedging. This could be the result of existing relationships with cattle buyers and the relativelylimited number of outlets to sell finished cattle. Potentially, this persistence could also stem fromunfamiliarity with other output pricing strategies and high switching cost. The lack of a relation-ship between single source information and output pricing strategies could also be a function ofthe mitigation strategies considered. In the live cattle marketing options, no distinction was maderegarding cattle quality. Conceivably, single source cattle might grade better at harvest and receivequality premiums (for those using grid pricing); however, this was not accounted for in ourscenarios.
Our study is the first to look at the relationship in feedlot producers’ decision-making regardinganimal health and price risk. However, there are limitations. First, a hypothetical choice experi-ment and self-reported survey data were used. However, by making comparisons across treat-ments, hypothetical bias concerns are minimized (Lusk and Schroeder, 2004; Tonsor,2011). Additionally, we recognize choice experiment findings are a function of the attributeschosen—here animal health and risk mitigation strategies (Gao and Schroeder, 2009; Pozo,Tonsor, and Schroeder, 2012). Feedlots animal health risk mitigation strategies can be complexand dynamic. To keep the survey manageable for producer participants, we chose to proxy animalhealth risk mitigation with single source cattle procurement. Furthermore, there could be otherbenefits of single source cattle, such as lower transaction costs, that are not accounted for in thisanalysis. Future research could consider more complex designs to capture producers’ trade-offs inrisk management decisions, or if available, use information on feedlots’ actual usage of differentrisk mitigation strategies.
Our findings are relevant to ongoing policy discussions regarding livestock producers’ use ofLGM and LRP programs. In 2019, increased subsidy rates and other enhancements were made tothese programs to better suit livestock producers needs with the hope of increasing participation.For example, effective July 1, 2019, the LRP subsidy rate increased from 13% for all coverage levelsto 20–35% based on selected coverage level (Feedstuffs, 2019). Additional changes to premiumsare being considered in 2020 for the 2021 marketing year (Willis, 2020). Our results suggest thatthe effectiveness of these subsidy rates at incentivizing participation will also depend on other riskmitigation strategies in place. For example, the sensitivity of participation to the subsidy ratesmight be less than expected if producers are also managing animal health risk. Therefore, it isimportant to consider other types of risk mitigation efforts that an operation may be using inaddition to price risk mitigation when designing policy instruments and estimating participation.
Acknowledgements. The authors thank the Colorado Livestock Association, Feedlot Magazine, Iowa Cattlemen’sAssociation, Kansas Livestock Association, Nebraska Cattleman, and Texas Cattle Feeders Association for their collaboration.
Financial disclosure. This work was partially supported by USDA-NIFAHatch under project 1016533, and multistate project1014091.
Conflict of interest. None.
Supplementary material. To view supplementary material for this article, please visit https://doi.org/10.1017/aae.2020.31
ReferencesAbidoye, B.O., and J.D. Lawrence. “Value of Single Source and Backgrounded Cattle as Measured by Health and Feedlot
Profitability.” Paper presented at the NCR-134 Conference in St. Louis, Missouri, April 17–18, 2006. Internet site: https://ideas.repec.org/p/ags/ncrsix/19008.html
Belasco, E., M. Taylor, B. Goodwin, and T. Schroeder. “Probabilistic Models of Yield, Price, and Revenue Risks for FedCattle Production.” Journal of Agricultural and Applied Economics, 41(2009):91–105.
Blank, S.C., T.L. Saitone, and R.J. Sexton “Calf and Yearling Prices in the Western United States: Spatial, Quality, andTemporal Factors in Satellite Video Auctions.” Journal of Agricultural and Resource Economics 41,3(2016):458–80.
Cornick, J., T.L. Cox, and B.W. Gould. “Fluid Milk Purchases: A Multivariate Tobit Analysis.” American Journal ofAgricultural Economics 76(1994):74–82.
Crane, L., G. Grantz, S. Isaacs, D. Jose, and R. Sharp. Introduction to Risk Management. Extension Risk Management Educationand Risk Management Agency report, 2013. Internet site: http://extensionrme.org/pubs/introductiontoriskmanagement.pdf(Accessed April 30, 2019).
Cummings, R.G., and L.O. Taylor “Unbiased Value Estimates for Environmental Goods: A Cheap Talk Design for theContingent Valuation Method.” American Economic Review 89,3(1999):649–65. https://doi.org/10.1257/aer.89.3.649
Di Mauro, C., and A. Maffioletti. “Attitudes to Risk and Attitudes to Uncertainty: Experimental Evidence.” AppliedEconomics 36(2004):357–72.
Du, X., J. Ifft, L. Lu, and D. Zilberman. “Marketing Contracts and Crop Insurance.” American Journal of AgriculturalEconomics 97,5(2015):1360–70.
Edwards, T.A. “Control Methods for Bovine Respiratory Disease for Feedlot Cattle.” Veterinary Clinics of North America:Food Animal Practice 26,2(2010):273–84. https://doi.org/10.1016/j.cvfa.2010.03.005
Executive Office of the President Office of Management and Budget (OMB). North American Industry ClassificationSystem. Report for the Executive Office of the President of the United States, 2017. Internet site: https://www.census.gov/eos/www/naics/2017NAICS/2017_NAICS_Manual.pdf (Accessed April 26, 2019).
Feedstuffs. USDA Enhances Livestock, Dairy Insurance Products, April 23, 2019. Internet site: https://www.feedstuffs.com/news/usda-enhances-livestock-dairy-insurance-products?NL=FP-006&Issue=FP-006_20190424_FP-006_646&sfvc4enews=42&cl=article_2_5&utm_rid=CPG02000002565167&utm_campaign=38002&utm_medium=email&elq2=4bc980016e994b7282551581cff072a3 (Accessed April 30, 2019).
Gao, Z., and T.C. Schroeder. “Effects of Label Information on Consumer Willingness-to-Pay for Food Attributes.” AmericanJournal of Agricultural Economics 91(2009):795–809.
Goodwin, B.K., and T.C. Schroeder. “Human Capital, Producer Education Programs, and the Adoption of Forward-PricingMethods.” American Journal of Agricultural Economics 76,4(1994):936–47.
Hall, D.C., T.O. Knight, K.H. Coble, A.E. Baquet, and G.F. Patrick. “Analysis of Beef Producers” Risk ManagementPerceptions and Desire for Further Risk Management Education.” Review of Agricultural Economics 25,2(2003):430–48.https://doi.org/10.1111/1467-9353.00148
Hart, C.E., B.A. Babcock, and D.J. Hayes. “Livestock Revenue Insurance.” Journal of Futures Markets 21(2001):553–80.Livestock Marketing Information Center (LMIC) [dataset]. Livestock Marketing Information Center Spreadsheets, 2016.
Internet site: https://www.lmic.info/members/spreadsheets (Accessed November 9, 2016).Lusk, J.L. “Effects of Cheap Talk on Consumer Willingness-to-Pay for Golden Rice.” American Journal of Agricultural
Economics 85,4(2003):840–56.Lusk, J.L., and T.C. Schroeder. “Are Choice Experiments Incentive Compatible? A Test with Quality Differentiated Beef
Steaks.” American Journal of Agricultural Economics, 86(2004):467–82.Mark, D.R., T.C. Schroeder, and R.D. Jones. “Identifying Economic Risk in Cattle Feeding.” Journal of Agribusiness
18(2000):331–44.McKendree, M.G.S., G.T. Tonsor, and C.A. Wolf. “AnimalWelfare Perceptions of the U.S. Public and Cow-Calf Producers.”
Journal of Agricultural and Applied Economics 50,4(2018):544–78. https://doi.org/10.1017/aae.2018.14Moschini, G., and D.A. Hennessy. “Uncertainty, Risk Aversion, and Risk Management for Agricultural Producers.”
Handbook of Agricultural Economics. B.L. Gardner and G.C. Rausser, eds. Amsterdam: Elsevier Science Publishers, 2001.O’Connor, A.M., S.D. Sorden, and M.D. Apley. “Association Between the Existence of Calves Persistently Infected with
Bovine Viral Diarrhea Virus and Commingling on Pen Morbidity in Feedlot Cattle.” American Journal of VeterinaryResearch 66,12(2005):2130–4. https://doi.org/10.2460/ajvr.2005.66.2130
Paté-Cornell, M.E. “Global Risk Management.” Journal of Risk and Uncertainty 12,2–3(1996):239–55.Pennings, J.M.E., and P. Garcia. “Measuring Producers” Risk Preferences: A Global Risk-Attitude Construct.” American
Journal of Agricultural Economics 83(2001):993–1009.Pozo, V.F., G.T. Tonsor, and T.C. Schroeder. “How Choice Experiment Design Affects Estimated Valuation of Use of
Gestation Crates.” Journal of Agricultural Economics 63(2012):639–55.Qualtrics. (n.d.). Qualtrics (Version 2017). Internet site: https://www.qualtrics.com (Accessed February 15, 2017).Rambo, N.K. “Health and Nutritional Strategies for Managing Incoming Feedlot Cattle.” Iowa State University Digital
Repository, 2014. Internet site: https://lib.dr.iastate.edu/cgi/viewcontent.cgi?article=1022&context=driftlessconference(Accessed April 6, 2016).
Roodman, D. “Fitting Fully Observed Recursive Mixed-Process Models with CMP.” Stata Journal 11(2011):159–206.Schenker, N., and J.F. Gentleman. “On Judging the Significance of Differences by Examining the Overlap between
Confidence Intervals.” The American Statistician 55(2001):182–6.Schroeder, T.C., and M.L. Hayenga. “Comparison of Selective Hedging and Options Strategies in Cattle Feedlot Risk
Management.” Journal of Futures Market 8(1988):141–56.
Schroeder, T., D. Pendell, M. Sanderson, and S. McReynolds. “Economic Impact of Alternative FMD EmergencyVaccination Strategies in the Midwestern United States.” Journal of Agricultural and Applied Economics47(2015):47–76.
Schulz, L.L. How Often Can Cattle Feeders Hedge a Profit with Futures? Iowa State University Extension and Outreach AgDecision Maker report, 2016. Internet site: https://www.extension.iastate.edu/agdm/livestock/html/b2-54.html (AccessedApril 30, 2019).
Schulz, L.L.Monthly Cattle Feeding Returns. Iowa State University Extension and Outreach Ag Decision Maker report, April2019. Internet site: https://www.extension.iastate.edu/agdm/livestock/html/b1-36.html (Accessed April 30, 2019).
Schulz, L.L., and G.T. Tonsor. “Cow- Calf Producer Preferences for Voluntary Traceability Systems.” Journal of AgriculturalEconomics 61(2010):138–62.
Schumacher, T., T.C. Schroeder, and G.T. Tonsor. “Willingness-to-Pay for Calf Health Programs and Certification Agents.”Journal of Agricultural and Applied Economics 44(2012):191–202.
Smith, M.D., and J.E. Wilen. “Heterogeneous and Correlated Risk Preferences in Commercial Fishermen: The Perfect StormDilemma.” Journal of Risk and Uncertainty 31,1(2005):53–71. https://doi.org/10.1007/s11166-005-2930-7.
Step, D.L., C.R. Krehbiel, H.A. DePra, J.J. Cranston, R.W. Fulton, J.G. Kirkpatrick, D.R. Gill, M.E. Payton, M.A.Montelongo, and A.W. Confer. “Effects of Commingling Beef Calves from Different Sources and Weaning ProtocolsDuring a Forty-Two-Day Receiving Period on Performance and Bovine Respiratory Disease.” Journal of AnimalScience 86,11(2008):3146–58.
Tonsor, G.T. “Consumer Inferences of Food Safety and Quality.” European Review of Agricultural Economics 38,2(2011):213–35. https://doi.org/10.1093/erae/jbr011
Tonsor, G.T. “Producer Decision Making under Uncertainty: Role of Past Experiences and Question Framing.” AmericanJournal of Agricultural Economics 100,4(2018):1120–35. https://doi.org/10.1093/ajae/aay034
Tonsor, G.T., and T.C. Schroeder. “Multivariate Forecasting of a Commodity Portfolio, Application to Cattle FeedingMargins and Risk.” Applied Economics 43(2011):1329–39.
Tonsor, G.T., T.C. Schroeder, and J.L. Lusk. “Consumer Valuation of Alternative Meat Origin Labels.” Journal ofAgricultural Economics 64(2013):676–92.
Tonsor, G.T., and R.S. Shupp. “Cheap Talk Scripts and Online Choice Experiments: Looking Beyond the Mean.” AmericanJournal of Agricultural Economics 93(2011):1015–31.
U.S. Department of Agriculture (USDA).United States Livestock Slaughter.Washington, DC: National Agricultural StatisticsService report, April 2017. Internet site: https://www.nass.usda.gov/Publications/Todays_Reports/reports/lstk0417.pdf(Accessed May 24, 2017).
U.S. Department of Agriculture, Animal and Plant Health Inspection Service, Veterinary Services, National AnimalHealth Monitoring System (USDA-APHIS-VS-NAHMS). Feedlot 2011 Part IV: Health and Health Management onU.S. Feedlots with a Capacity of 1,000 or More Head. Report No. 638.0913, 2013. Internet site: https://www.aphis.usda.gov/animal_health/nahms/feedlot/downloads/feedlot2011/Feed11_dr_PartIV.pdf (Accessed April 26, 2019).
U.S. Department of Agriculture, National Agricultural Statistics Service (USDA-NASS). 2017 Census of Agriculture, UnitedStates Summary and State Data. Volume 1, Geographic Area Series, Part 51, April 2019a. Internet site: https://www.nass.usda.gov/Publications/AgCensus/2017/Full_Report/Volume_1,_Chapter_1_US/usv1.pdf (Accessed April 26, 2019).
U.S. Department of Agriculture, National Agricultural Statistics Service (USDA-NASS). Selected Producers”Characteristics by North American Industry Classification System, 2019b. Internet site: https://www.nass.usda.gov/Publications/AgCensus/2017/Online_Resources/Census_Data_Query_Tool/index.php (Accessed April 26, 2019).
U.S. Government Accountability Office. Additional Data Analysis Could Enhance Monitoring of U.S. Cattle Market. Reportto Congressional Requesters No. GAO-18-296, 2018. Internet site: https://www.gao.gov/assets/700/691178.pdf (AccessedApril 26, 2019).
Willis, B. “USDA”s Livestock Risk Protection Deserves a Second Look.” Drovers. Internet site: https://www.drovers.com/article/usdas-livestock-risk-protection-deserves-second-look (Accessed August 11, 2020).
Zimmerman, L.C., T.C. Schroeder, K.C. Dhuyvetter, K.C. Olson, G.L. Stokka, J.T. Seeger, and D.M. Grotelueschen. “TheEffect of Value-Added Management on Calf Prices at Superior Livestock Auction Video Markets.” Journal of Agriculturaland Resource Economics 37,1(2012):128–43.
Cite this article: McKendree MGS, Tonsor GT, and Schulz LL (2021). Management of Multiple Sources of Risk in LivestockProduction. Journal of Agricultural and Applied Economics 53, 75–93. https://doi.org/10.1017/aae.2020.31