75
Management of projects, programs and portfolios in Russia and Eastern Europe Approaches and Lessons Learned
| Date post: | 22-Dec-2015 |
| Category: |
Documents |
| Upload: | alyson-dalton |
| View: | 219 times |
| Download: | 0 times |
Management of projects, programs and portfoliosin Russia and Eastern Europe
Approaches and Lessons Learned

Introduction
• In this presentation we will discuss proven methodologies, tools and techniques that are applied to management of projects, programs and portfolios in Russia and Eastern Europe.
• The questions during the presentation are welcomed!

Part 1
Program, Portfolio Management
System Organization

Program and Portfolio Management Requirements
To make Programs and Portfolios manageable there are certain requirements to all Program/Portfolio participants and projects that include: Common methodology shall be used for scheduling,
budgeting, reporting and analyzing project data, The same or compatible PM software shall be used, The same WBS templates shall be applied to all projects in
the program/portfolio, The same resource, cost, material dictionaries shall be used
in all schedule models and reports, The same production norms and unit costs shall be used for
contracting and estimating project performance
Program Management Office
• PMO is an organizational unit to centralize and coordinate the management of projects under its domain. This unit was created in every Program management organization.
• Main departments of PMO (by functions):– Methodology– Analysis– Correspondence and Archives– Program/Portfolio Management
PMO – Methodology Department
• Main functions of Methodology department:– Development and actualization of the Project
Management Guidelines and other Program management standards and requirements,
– Organization of Project staff training,– Consulting, coaching, auditing Program participants,– Development and actualization of the organization
knowledge base.

PMO – Analysis Department
• PMO Analysis department:– Develops and implements Program dictionaries and
Reference-books for costs, resources, materials,– Develops project WBS and other templates,– Helps project planners with creating project
computer models, project scheduling and budgeting, risk analysis, performance monitoring and reporting organization,
– Develops and applies standards for group work with the Program files and data.

PMO – Analysis Department
• PMO Analysis department:– Develops and works with the Portfolio/Program
computer model,– Regularly collects and analyzes actual data,– Manages Portfolio/Program computer models
archives,– Supplies project stakeholders with the performance
reports and other necessary information,– Maintains PMIS and data safety.

PMO – Archive Department
• PMO Communication and Archive department:– Manages communications with program stakeholders,– Manages portfolio/program archives,– Creates and maintains the library of past projects
archives.

PMO – Program Management Department• PMO Program Management department functions:
– Portfolio/Program Scheduling and Management,– Management of project priorities,– Management of Portfolio/Program Risks,– Dealing with conflicting and competing project
requirements,– Analysis of change requests and Integrated
Change Control.

PM Information System
• Most large-scale programs are managed using Spider Project software that is considered as most functional, powerful and flexible system.
• Spider Project usage is required from all programs participants. It makes data consolidation and management easier and more reliable.

PM Information System
• One of the main reasons for selecting Spider Project as the portfolio/program management tool is based on its ability to work with physical amounts (volumes) of work to be done on project activities.
• It helps to implement state and corporate norms like unit (physical) costs, unit material requirements, resource productivities (units per hour) for typical activities and assignments, etc.
• Spider Project permits to create program (corporate) templates, dictionaries, and databases (reference-books) that are necessary for proper program management.

Part 2
Program/Project Data

Data requiremen
ts• The requirements to the data that are used for the
portfolio/program planning and control may be divided into two main groups:– High level requirements based on program/portfolio
management needs,– Low level requirements that shall be applied to creating
project computer models.
• High level requirements consider data organization,• Low level requirements cover details and instructions
on creating project computer models.
• The same Project, Phase, Activity, Resource, Material, and Department coding structures are used in all projects,
• Resources that are used in all projects belong to the program (corporate) resource pool,
• Resources of the same type share the same characteristics (like cost, production rates, material consumption per work hour),
Organizing data

Organizing data
• Program management systems have specific requirements that are vital for successful implementation.
• It is necessary to be sure that:– WBS structures that are used in different projects
of the program are compatible,– Project costs have the same structure in all projects
(same cost components are used),– Cost accounts are the same in all projects,

– Activities of the same type have the same characteristics in all projects (like unit cost, material requirements per work volume unit, etc.),
– Typical resource assignments have the same characteristics in all projects (like productivity, cost and material requirements),
– Typical (repeating) processes are modeled in the same way in all projects,
– Project archives are kept and stored as required.
Organizing data
• These requirements are set on the portfolio/program level and are mandatory for all participants.
• Templates, reference-books, coding systems etc. are developed in the Program Management Office.
• Program Management office creates Databases or Reference-books that contain those parameters that shall be used for planning of all projects of the portfolio/program.
Organizing data

• Program or Organization Reference-books include at least:– Activity cost and material requirements per volume unit
for all activity types,– Resource assignment cost and material requirements per
volume unit for all assignment types,– Resource assignment productivities for all assignment
types,– Resource assignment work loads for all assignment types.
• Activities, resources and resource assignments belong to the same type if they share the same characteristics.
Program Databases (Reference-Books)

Typical Fragment Library
• Project fragments usually describe typical processes and technologies that are used more than once as small projects.
• Creating project computer models using the library of typical fragments helps to avoid inconsistencies and assures that the project model follows Program standards.
• A library of typical fragments is very important tool for the development of common culture and management standards.

Program Templates
• Portfolio/Program management has to be based on the corporate/program standards. These standards include not only estimates of the typical process, activity, resource, and assignment parameters but also project templates.
• Besides, Program Management Guideline developed in the Program Management Office describes Program management routine (when and what reports shall be presented, performance review meetings schedule, etc.) and change management processes.

• This slide shows WBS template for Arena construction projects required by Program Management Office of Olimpstroy for Sochi 2014 Program planning.
Organizing data
Cost Data
• Usually it is not enough just to define activity and resource costs. It is necessary to know project expenses and revenues, what will be spent on wages, on machinery and equipment, on taxes, etc. Sometimes it is necessary to allow for multiple currencies. So there is a need to define and assign cost components.
• Cost Structure shall be the same in all projects belonging to the Program and is defined on the Program level.
Multiple WBS
• It is also very useful to have an opportunity to get project reports that aggregate project data different ways. Usually we use at least three Work Breakdown Structures in our projects: based on project deliverables, project processes and responsibilities.
• At least one WBS is mandatory and required by Program Management Office. Others may be selected by project management teams.

• Contract Breakdown Structure is the powerful tool for management of contract relationships. The same organizations are involved in multiple projects and in different programs.
• Contract Breakdown Structures are used to get reports on the contract performance and contract cash flows.
Contract Breakdown Structure

Cost Breakdown Structure
• Cost Breakdown Structure for contract costs is defined by Program Management Office.
• Contractors can add cost components and create Cost centers for planning and tracking real expenses.
• We manage not only expenses but also financing.• Program managers control program, project and
contract cash flows.

Project Archives
• The planners store project versions and analyze the progress in project execution, comparing current project, program and portfolio schedules not only with the baselines but also with any previous versions. It enables to assess the progress in project execution for the last week, last month, last year, compared to the baseline, etc.

Portfolio/Program/Project
Scheduling
Part 3

Scheduling Tasks
• Project/Program/Portfolio scheduling without resource limitations taken into the consideration,
• Project/Program/Portfolio resource constrained scheduling (resource leveling),
• Determination of feasible activity resource constrained floats and those activities that are critical,
• Determination of the Project/Program/Portfolio cost, material and resource requirements for any time period.– Project cost and material requirements are the results of
project scheduling if activity and resource costs and material requirements were defined.

Critical Path Method
• The problem of project schedule development without allowing for resource constraints has a correct mathematical solution (Critical Path Method), which would be the same for all PM packages, provided that initial data are identical. All other problems are solved using different approaches and yielding different results.

Resource constrained scheduling • Resource constrained schedules produced by different
PM software are different. The software that calculates shortest resource constrained schedules may save a fortune to its users.
• That is why we pay most attention to resource-constrained schedule optimization.

Resource constrained scheduling• The schedule stability is no less important, especially at
the project execution phase. • That is why our project management software Spider
Project features an additional leveling option - the support of the earlier project version schedule (keeping the order of activity execution the same as in selected earlier project schedule).

Sample Project before leveling
• Traditional notion of Critical Path works only in case of unlimited resources availability.
• Let us consider a simple project consisting of five activities, presented at the next slide.
• Activities 2 and 5 are performed by the same resource.

Sample Project after leveling
• Please pay attention to activities that became critical. Now delaying each of the activities 1, 2 and 5 will delay the project finish date. We call these activities Resource Critical and their sequence comprises Resource Critical Path.
Resource Critical Path
• In many projects it is necessary to simulate financing and production, and to calculate project schedules taking into account all limitations (including availability of renewable resources, material supply and financing schedules).
• True critical path should account for all schedule constraints including resource and financial limitations.
• We call it Resource Critical Path (RCP) to distinguish it from the traditional interpretation of the critical path definition.
Resource Critical Path
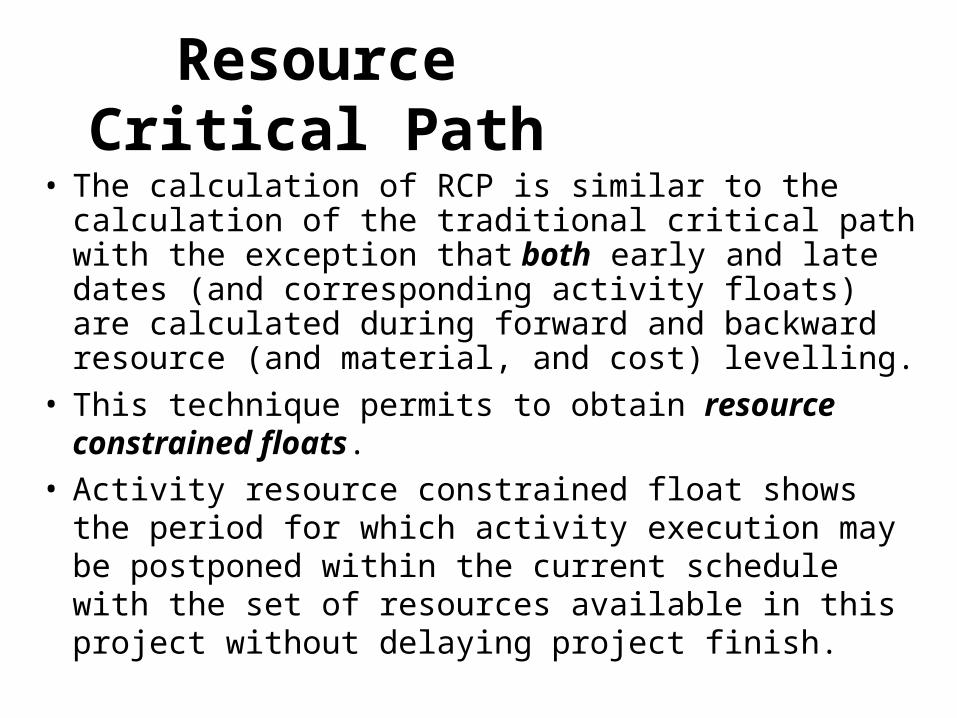
• The calculation of RCP is similar to the calculation of the traditional critical path with the exception that both early and late dates (and corresponding activity floats) are calculated during forward and backward resource (and material, and cost) levelling.
• This technique permits to obtain resource constrained floats.
• Activity resource constrained float shows the period for which activity execution may be postponed within the current schedule with the set of resources available in this project without delaying project finish.

RCP and Critical Chain
• It appears that by adding financial and supply constraints to the Critical Chain definition as well as the way of the Critical Chain calculation, we will obtain something very similar to RCP.

Success Criteria
Part 4

Project Success Criteria• If project success criteria are set as finishing project on
time and under budget then proper decision making will be complicated.
• Project managers will not be able to estimate the effect of their decisions to spend more money but to finish the project earlier.
• We suggest to set one integrated criterion of the project/program success or failure.

Project Success Criteria• Many projects can be considered as business oriented:
– construction of roads, power plants, bridges, ports, telecommunication networks, etc. will bring economic results,
– Implementation of the corporate information system will improve organization processes, etc.
• In any case the delay of project finish date usually increases project cost, and acceleration means saving some money.
• So each day of project delay means some money losses and finishing project earlier means additional profit. Estimating these profits and losses we can define the cost of the project day (maybe separate and different for acceleration and delay).

• Another option – to set the profit that should be achieved at some point in time basing on the forecast of the revenues that will be obtained after the project will deliver its results.
• Such success criteria will permit to weight time and money making managerial decisions.
• At the next slide you may see the project schedule that is calculated without allowing for project financing and supply restrictions. There are periods when project has no money and necessary materials (wall frames) to proceed.
Project Success Criteria

• If project manager will find enough money and materials then project total profit to the imposed date will be close to $219,000.
Project Success Criteria

• If to calculate project resource, financing and supply constrained schedule than it become clear that the project will loose $25,000 due to necessary delays.
Project Success Criteria

• Maybe it is reasonable to borrow money or to find some other solution?
• To be able to weight options and to select the best it is necessary to consider not only expenses.
• Proper project (program, portfolio) schedule model is the powerful tool that helps to select the best decisions.
Project Success Criteria

Risk Analysis &Success Driven
Project Management
Part 5
Why risk analysis
• Our experience of project planning shows that the probability of successful implementation of deterministic project schedules and budgets is very low. Therefore project and portfolio planning technology should always include risk simulation to produce reliable results.

Risk Simulation
• Risk simulation may be based on Monte Carlo simulation or use three scenarios approach.
• We prefer 3 scenario approach for the reasons explained further.

Risk Simulation – three scenarios approach
• A project planner obtains three estimates (optimistic, most probable and pessimistic) for all initial project data (duration, volumes, productivity, calendars, costs, etc.).
• Risk events are selected and ranked using the usual approach to risk qualitative analysis. Usually we recommend to include risk events with the probability exceeding 90% in the optimistic scenario, exceeding 50% in the most probable scenario, and all selected risks in the pessimistic scenario.

• Most probable and pessimistic project scenarios may contain additional activities and costs due to corresponding risk events and may employ additional resources and different calendars.
• As the result project planner obtains three expected finish dates, costs and material consumptions for all major milestones.
• They are used to rebuild probability curves for the dates, costs and material requirements.
Risk Simulation – three scenarios approach

Project/Program Targets
• Target dates of most infrastructure projects are usually predefined. They may be set not only for the whole program/project but also for its major phases.
• Project planning usually includes determining how to organize project/program execution to be able to meet required target dates with the reasonable reliability.

Success Probabilities
• Probabilities to meet approved project targets we call Success Probabilities. These targets may be set for all project parameters that will be controlled (profit, expenses, duration, material consumption).
• Target dates do not belong to any schedule. Usually they are between most probable and pessimistic dates.
• A set of target dates and costs (analogue of milestone schedule) is the real project baseline.
• But baseline schedule does not exist!

Buffers• We recommend to use optimistic schedule for setting
tasks for project implementers and manage project reserves.
• Using this approach we obtain not only the set of target dates but also a critical schedule – a project schedule calculated backward from target dates. The difference between current and critical dates shows current schedule contingency reserves (buffers).
Sample Critical Schedule
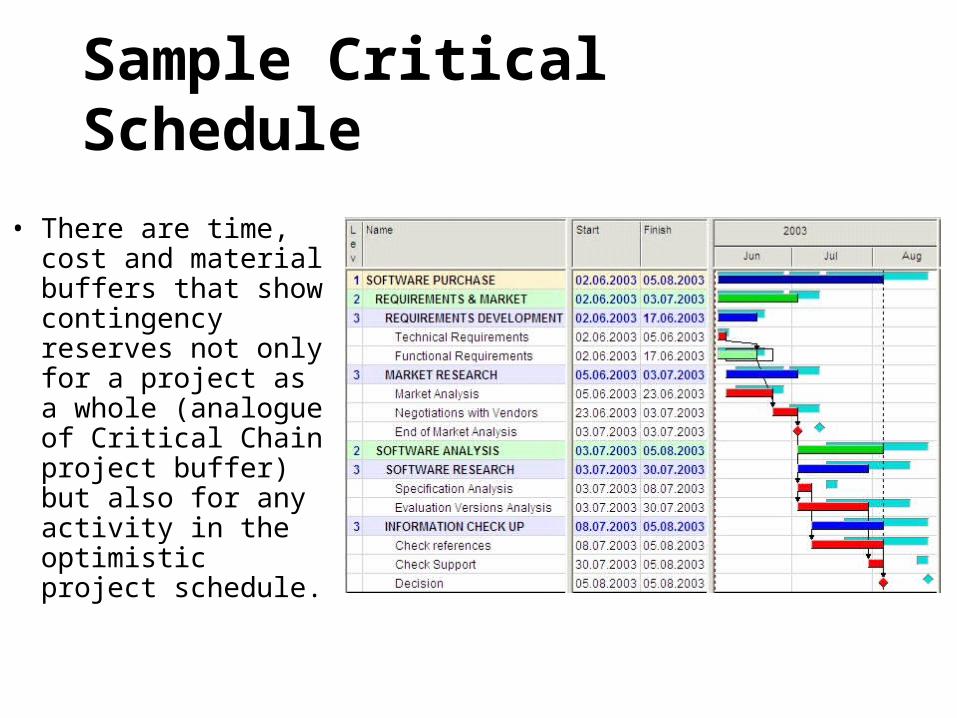
• There are time, cost and material buffers that show contingency reserves not only for a project as a whole (analogue of Critical Chain project buffer) but also for any activity in the optimistic project schedule.

Monte Carlo and 3 Scenarios
• Let’s look at the difference between accuracy and precision.
• Accuracy: Precision:

Monte Carlo and 3 Scenarios
• Monte Carlo means Accuracy but lack of Precision.• 3 Scenarios means Precision but lack of Accuracy.• The choice depends on management approach.• Our approach may be called “Management by Trends”.• We think that trends supply management with most valuable
information on project performance.• We think that trend analysis helps to discover performance
problems ASAP and to apply corrective actions if necessary.• It is the main reason why 3 scenarios approach was selected.

Monte Carlo and 3 Scenarios
• We think that the quality of initial data for project risk simulation is never good enough but Monte Carlo risk simulation creates an impression of accuracy that is actually dangerous for project managers.
• In any case we need Optimistic schedule and budget for project performance management.
• We need to understand what happens with success probability during project performance and so we need data precision.

Project/Program/Portfolio
Performance Management
Part 6

Performance Measurement
• Performance measurement routine shall be set for all projects belonging to the program.
• Portfolio/Program schedule is revised regularly. For most programs it is done weekly. To be able to reschedule the portfolio/program it is necessary that all projects belonging to the program have the same data date.
• So the portfolio/program management team requires from all project management teams to enter actual data of their projects at specified dates and time (for an example: each week on Tuesday before 12:00 the actual status on Tuesday 08:00 shall be entered).

Performance Measurement
• If different projects have different data date then program scheduling became impossible and most reports will not be reliable.
• So setting the rules for entering actual data is mandatory for program/portfolio management.
• This specifics makes client-server approach to organizing group work with the project/program models less efficient than in other application areas.

Performance Measurement
• In our programs project management teams collect reports not on the “percent complete”, but on physical quantities (volumes) that were done, time that was spent, materials and equipment that were consumed, money that were spent on project activities.
• So we don’t understand discussions on the best ways to measure activity percent complete.

Management by trends
• Project/Program/Portfolio planners keep archives to be able to get trends of project/program/portfolio parameters.
• We recommend to manage projects/programs/portfolios basing on the analysis of performance trends.
• If some project is 5 days ahead of the baseline but one week ago it was 8 days and one month ago 20 days then some corrective action is needed.
• If the project is behind the schedule but the distance become smaller then project team improves project performance and interference is not necessary.

Earned Value Analysis
• Earned Value Analysis is another method that is used for estimating program performance.
• But this method is used very carefully because: – the real situation may be distorted,– project managers are motivated to do expensive works ASAP
and cheap works ALAP.
Success Probability Trends
• We consider success probability trends as the really integrated project performance measurement tool.
• Success probabilities may change due to:– Performance results– Scope changes– Cost changes– Risk changes– Resource changes
• Thus success probability trends reflect not only project performance results but also what is going on around the project.

Success Driven Project Management
• Success probability trends may be used as the only information about project performance at the top management level because this information is sufficient for performance estimation and decision making.
• We call Management by Trends methodology Success Driven Project Management.

Project/Program/Portfolio
Performance Reports
Part 7

Performance Reports• Performance reports usually include project/portfolio
Gantt Charts, S-curves, Earned Value Graphs, Contract Cash Flows, and Time-Location (or Linear) Diagrams.
• Examples of Program Gantt Chart and Combined Road Linear Diagram are shown in the next slides.
• Linear Diagram is most useful in projects with clear metrics, like road or high rise buildings construction.

Program Gantt Chart

Linear Diagram

Conclusions
Part 8
Tips for Corporate Program Management1. There is a need for common methodology,
templates, reference-books to be able to plan and to analyze programs or portfolios.
2. There is a need for Program Management Office – organizational unit that develops corporate program management standards, collects actual information on project performance and works with the Portfolio Computer Model, creating and updating portfolio plan and analyzing portfolio performance.
Tips for Program Management3. Most norms and standards are applied to the activity
physical units (m, t, m3, piece, etc.). So it is necessary to plan activity schedule and to monitor project performance basing on physical quantities (volumes of work) measurement.
4. Portfolio and Program Computer Models includes the models of individual projects and shall be resource loaded.

Tips for Program Management5. We recommend to create a library of project fragments
that may be used for fast development of the detailed project computer models.
6. We recommend to set reliable target dates basing on risk analysis and simulation but to use optimistic project schedule for setting tasks for project participants.
7. Time and Cost contingency buffer penetrations shall be regularly re-estimated. If these buffers are consumed too fast there is a need for corrective actions.

Tips for Program Management8. We recommend to keep project archives and to
analyze trends of project parameters.9. If trends are negative corrective actions shall be
considered even if the status is good.10. Earned Value Analysis supplies management with
the useful information on project status. But it shall be used carefully and only as the supplement to other methods of project performance measurement.
Tips for Program Management11. Success Probability trends are the best integrated
indicators of project health.12. Positive trends show that project buffer penetrations
are lower than expected. Negative trends show that buffers are consumed faster than expected and corrective actions may be necessary.
13. Success probability trends depend not only on project performance but also on risks that may appear and disappear during project life cycle. That is why they may be considered as integrated indicators necessary for decision making.

Success Driven Project Management Flowchart
REFERENCE-BOOKS:
Resources
Materials
Cost Components
Cost Breakdown Structure
Resource Breakdown Structure
Calendars
Resource Productivities
Unit Costs
Material Requirements per Volume Unit
Skills
Multi-Resources
Code Structures Typical Fragnet Library
Project Schedule
Project Budget
Risk Register
Issue Register
Risk Analysis
Success and Failure Criteria
Success and Failure
Probabilities
WBS Templates
Performance Reports
Success Probability Trends
Corrective Actions
Work Authorization
-
+
Project Portfolio


