Management, regulation and environmental impacts of nitrogenfertilization in northwestern Europe under the Nitrates Directive;a benchmark study
H. J. M. van Grinsven1, H. F. M. ten Berge2, T. Dalgaard3, B. Fraters4, P. Durand5, A. Hart 6, G. Hofman7,B. H. Jacobsen8, S. T. J. Lalor9, J. P. Lesschen10, B. Osterburg11, K. G. Richards9, A.-K. Techen11, F. Vertes5,J. Webb12, and W. J. Willems1
1PBL Netherlands Environmental Assessment Agency, Department: Water, Agriculture and Food, Bilthoven, The Netherlands2Plant Research International, Wageningen University and Research Centre, The Netherlands3Aarhus University, Department of Agroecology, Foulum, Denmark4National Institute for Public Health and the Environment, Bilthoven, The Netherlands5INRA, UMR1069, Sol Agro and Hydrosysteme, 35000 Rennes, France6Environmental Agency, Olton, UK7Ghent University, Department of Soil Management, Belgium8Institute of Food and Resource Economics, University of Copenhagen, Denmark9Teagasc, Crops Environment and Land Use Programme, Johnstown Castle, Wexford, Ireland10Alterra, Wageningen University and Research Centre, The Netherlands11Institute of Rural Studies, Johann Heinrich von Thunen-Institut (vTI), Bundesforschungsinstitut fur Landliche Raume,Wald und Fischerei, Germany12AEA Energy and Environment, Didcot, UK
Received: 21 May 2012 – Published in Biogeosciences Discuss.: 22 June 2012Revised: 16 November 2012 – Accepted: 19 November 2012 – Published: 14 December 2012
Abstract. Implementation of the Nitrates Directive (NiD)and its environmental impacts were compared for mem-ber states in the northwest of the European Union (Ire-land, United Kingdom, Denmark, the Netherlands, Belgium,Northern France and Germany). The main sources of datawere national reports for the third reporting period for theNiD (2004–2007) and results of the MITERRA-EUROPEmodel. Implementation of the NiD in the considered memberstates is fairly comparable regarding restrictions for whereand when to apply fertilizer and manure, but very differentregarding application limits for N fertilization. Issues of con-cern and improvement of the implementation of the NiD areaccounting for the fertilizer value of nitrogen in manure, andrelating application limits for total nitrogen (N) to potentialcrop yield and N removal. The most significant environmen-tal effect of the implementation of the NiD since 1995 isa major contribution to the decrease of the soil N balance
(N surplus), particularly in Belgium, Denmark, Ireland, theNetherlands and the United Kingdom. This decrease is ac-companied by a modest decrease of nitrate concentrationssince 2000 in fresh surface waters in most countries. This de-crease is less prominent for groundwater in view of delayedresponse of nitrate in deep aquifers. In spite of improvedfertilization practices, the southeast of the Netherlands, theFlemish Region and Brittany remain to be regions of ma-jor concern in view of a combination of a high nitrogen sur-plus, high leaching fractions to groundwater and tenaciousexceedance of the water quality standards. On average thegross N balance in 2008 for the seven member states in EU-ROSTAT and in national reports was about 20 kg N ha−1 yr−1
lower than by MITERRA. The major cause is higher esti-mates of N removal in national reports which can amountto more than 50 kg N ha−1 yr−1. Differences between proce-dures in member states to assess nitrogen balances and water
Published by Copernicus Publications on behalf of the European Geosciences Union.
5144 H. J. M. van Grinsven et al.: Benchmarking the Nitrates Directive in northwestern Europe
quality and a lack of cross-boundary policy evaluations arehandicaps when benchmarking the effectiveness of the NiD.This provides a challenge for the European Commission andits member states, as the NiD remains an important piece oflegislation for protecting drinking water quality in regionswith many private or small public production facilities andcontrolling aquatic eutrophication from agricultural sources.
1 Introduction
The main aim of the Nitrates Directive (1991: Directive91/676/EEC; hereafter referred to as NiD) is to reduce wa-ter pollution caused or induced by nitrate and phosphorusfrom agricultural sources. The NiD is the most importantpiece of European (EU) regulation for reducing environmen-tal impacts of fertilizer and manure and for increasing nitro-gen use efficiency. The gross nitrogen balance, or nitrogensurplus, (Schroder et al., 2004; Vries et al., 2011) is an im-portant indicator to evaluate the environmental impacts of theNitrates Directive, particularly for the water compartment.This makes the NiD an important supporting instrument forother EU directives i.e. the Drinking Water Framework Di-rective (98/83/EC), the Water Frame Directive (2000/60/EC)and the Marine Strategy Framework Directive (2008/56/EC).The NiD legally restricts annual farm application of manureto 170 kg ha−1 of nitrogen, or in case of derogation to inputsup to 250 kg ha−1 (Oenema, 2004). The tenacious problem ofregional nitrogen (and phosphorus) surpluses can be resolvedby manure transport to other regions and by manure process-ing. In the case of the Netherlands and the Flemish region,part of the (processed) manure is exported to other countries.
Agricultural practices in general, and more specifically ap-plication rates and management of chemical fertilizers andanimal manures, vary greatly between and within EU mem-ber states. This makes it interesting to compare nitrogen man-agement and regulation between countries and relate this tothe observed states and trends of nitrate concentrations ingroundwater and surface water. Since the introduction of theNiD in 1991, EU member states have implemented severalaction programs and have delivered several monitoring re-ports. The EU Commission obliges member states to reporton the results of these action programs. It also charged syn-thesizing studies on these national reports but these reportsare not publicly available. However, the EU Commission didpublish summaries of the national data and reports in 2007and 2011. In addition, Fraters et al. (2011) evaluated the ef-fectiveness of environmental monitoring programs for theNiD. However, overall insight into the effectiveness of theNiD in the EU is still limited and rarely published in peer-reviewed journals. Together with the submission of the nextset of national monitoring reports for the NiD, this papercould increase this insight and help to improve implemen-tation of the NiD across the EU.
The combination of environmental directives and theCommon Agricultural Policy should provide food securityand a healthy natural environment in Europe while maintain-ing a level playing field for the agricultural entrepreneurs (DeClercq et al., 2001). This is particularly true for agriculture innorthwestern EU member states as they compete to providefood to consumers in the so-called “London-Berlin-Paris tri-angle”.
The purpose of this paper is to compare, evaluate andbenchmark the implementation of the Nitrates Directive inthe northwestern member states of the EU. The objectiveis to relate differences in implementation to differences instructure, intensity and practices of the agricultural sectorand to sensitivity of soil water systems to nitrate pollution.Key issues of the NiD addressed in the benchmark are appli-cation rates of N in manure, the balance between applied Nand crop requirements and water quality in relation to the ni-trate target of 50 mg NO−3 L−1. The comparison is restrictedto Denmark, Germany, the Netherlands, Belgium, the UnitedKingdom, Ireland and the northern part of France. Crop andfodder production potential per hectare on comparable soilsin these countries are similar. Note however, that within theUnited Kingdom there are four separate governments and inBelgium two, which implement the Nitrates Directive in dif-fering ways. Moreover, all these countries have regions withhigh livestock densities, causing feed requirements to exceedregional feed production, and manure production to exceedregional crop demands.
2 Materials and methods
2.1 Data sources
This analysis combines various existing studies on imple-mentation of the Nitrates Directive (van Dijk and Berge,2009; ten Berge and Dijk, 2009), gross nitrogen balancesfrom Eurostat (2012), monitored nitrate concentrations ingroundwater and surface water in synthesizing reports (Eu-ropean Commission, 2007, 2011; Fraters et al., 2011) andvarious national reports on implementation and evaluation ofthe Nitrates Directive for the last reporting period (Anony-mous, 2008a, b, c, d; Desimpelaere et al., 2008; Zwart etal., 2008). A complication when comparing water qualitydata among EU member states (and sometimes within a sin-gle member state) to evaluate the NiD are the large differ-ences in monitoring procedures, e.g. with regard to samplingdensity (Table 1), monitoring frequency and groundwatersampling depth (Fraters et al., 2011; European Commission,2011), and data and procedures for calculation of nitrogenbalances (Panten et al., 2009). In 2007 the total number ofsampling sites for groundwater was 31 000 and for surfacewater 27 000.
In this study, calculation of the gross nitrogen balance (GNB)was based on the OECD method (OECD, 2007). In addi-tion the soil N balance (SNB) is used which sometimes isconfused with the soil surface N balance (SSNB). The GNBrepresents the total potential loading of nitrogen from pri-mary agricultural production to the environment, but exclud-ing N emissions from fossil fuel combustion for energy re-quirements for e.g. fertilizer manufacturing, housing, trans-port and soil and crop management and correcting for exportand processing of manure. SNB or soil N surplus representsthe total potential loading from nitrogen use on agriculturalsoil, while SSNB represents the total net nitrogen loading tothe soil and water compartment.
Other inputs include N deposition and biological N fixation(BNF), where N deposition is the result of NH3 and NOxemissions from both agricultural and other sources, mainlytransportation and energy generation. Choosing one of thebalance indicators for monitoring and evaluation of NiD ef-fects is determined mainly by data availability. Data require-ments for GNB are lowest, but GNB does not correct for en-vironmental measures reducing ammonia emission followingfrom other EU directives like the National Emission Ceilings(NEC) directive (2001/81/EC) and the Integrated PollutionPrevention (IPPC) directive (96/61/EC). However, differentcalculation procedures, particularly for determining manureinput and nitrogen removal by crops, and also inclusion orexclusion of N-losses during housing and storage (differencebetween gross and net soil balance) and of smaller inputitems, may need to be taken into account when comparingnational or regional nitrogen balances.
For this reason the use of a model for determining the ni-trogen balance is an additional valuable tool to evaluate the
effectiveness of the NiD. Model approaches are inherentlymore consistent regarding calculation schemes, but withoutsound ground validation, have a risk of not accounting forregional differences in response of crop removal and waterquality to nitrogen fertilization. For example, in the UK amodel approach is used to estimate nitrogen loading as partof the NiD assessments. Loadings are calculated using theNEAP-N model (Lord and Anthony, 2000) along with an ur-ban estimation model (Lerner, 2000). Leip et al. (2008) cou-pled the economic model CAPRI and the mechanistic bio-chemical model DNDC for evaluation of the effects of agri-environmental policies on the European environment, for ex-ample on groundwater pollution with nitrate. Here we use themodel MITERRA-EUROPE to apply a consistent methodol-ogy to all countries.
2.3 MITERRA-EUROPE
The model MITERRA-EUROPE (referred to as MITERRAhereafter) was used to quantify the nitrogen balances and ni-trate leaching from agriculture on both EU-27 level, coun-try level, and regional level. By applying a uniform calcula-tion scheme as in MITERRA we could scrutinize results inthe national reports and benchmark nitrogen surpluses andnitrate concentration at the more appropriate sub-nationallevel. MITERRA consists of an input module with activitydata and emission factors, a set of measures to mitigate am-monia and greenhouse gas emission and nitrate leaching, acalculation module, and an output module (Velthof et al.,2009; Lesschen et al., 2011). The database of MITERRA ison national and regional level (NUTS2, according Nomen-clature of Territorial Units for Statistics in the EU) and in-cludes data of N inputs, N outputs, livestock numbers, landuse, crop types, soil type, and emission factors for NH3, N2O,and NOx, and leaching factors for NO3.
For this paper we used an updated version of MITERRAas described in Velthof et al. (2011). Crop areas were de-rived from EUROSTAT at NUTS2 level and crop yields fromFAOSTAT at national level as the EUROSTAT data was in-complete. Grassland yields and N contents of grassland wereestimated using the methodology of Velthof et al. (2009), be-cause grassland yields are not available from statistics. Thenumber of livestock in each year was derived from EURO-STAT. Data on annual N fertilizer consumption were col-lected from FAOSTAT. The N excretion of all livestock cat-egories except dairy cows were obtained from the GAINSmodel (Klimont and Brink, 2004). A method was developedto estimate the N excretion from dairy cows on regional levelbased on milk yields, grassland yields, and N inputs (Velthofet al., 2011).
The total manure N production was calculated at theNUTS2 level from the number of animals and the N ex-cretion per animal and then corrected for gaseous N lossesfrom buildings and storage. A method was developed to dis-tribute the manure over crops taking account of the maximum
5146 H. J. M. van Grinsven et al.: Benchmarking the Nitrates Directive in northwestern Europe
Table 2.Precipitation surplus and fraction of nitrogen surplus leaching to groundwater, the fraction leaching to surface waters and the runofffraction of N in applied fertilizer, grazing and manure, used in the MITERRA model.
Precipitation Fraction leaching Fraction leaching Fraction insurplus to groundwater to surface water surface runoff
annual manure application of 170 kg N ha−1 or higher incase of a derogation. Nitrogen fertilizer was distributed overcrops relative to their nitrogen demand, taking account of theamount of applied manure and grazing manure and their re-spective fertilizer equivalence (Velthof et al., 2009). Furthernitrogen inputs include biological N fixation, which is es-timated as a function of land use and crop type (legumes)and nitrogen deposition that is derived at NUTS2 level fromEMEP (EMEP, 2010).
Nitrogen leaching in MITERRA is calculated by multi-plying the soil N surplus by a region specific leaching frac-tion, which is based on soil texture, land use, precipitationsurplus, soil organic carbon content, temperature and root-ing depth (Table 2). Surface runoff fractions are calculatedbased on slope, land use, precipitation surplus, soil textureand soil depth (Velthof et al., 2009). These parameters are de-rived from more detailed spatial data sources, and weightedaverage values for agricultural land are used at the NUTS-2 level. The nitrate concentration in leaching water is cal-culated by dividing the amount of nitrogen leaching fromagriculture by the total water flux, which is calculated asthe precipitation surplus, derived from the EuroPearl model(Tiktak et al., 2006), minus surface runoff. The MITERRAmodel has been used in several EU studies and outcomeshave been compared with other model results and national re-ported values. De Vries et al. (2011) compared several mod-els, including MITERRA, on nitrogen budgets, and showedthat MITERRA outcomes are in line with other model re-sults. The distribution of calculated mean NO3 concentra-tions in NUTS 2 regions of EU-15 according to MITERRAagreed very well with the distribution of the means of mea-sured NO3 concentrations in the EU-15, according to mea-sured data from 2000–2003 (Velthof et al., 2009).
3 Results
3.1 Characteristics of agriculture and nutrient use innorthwestern EU
Mean annual temperatures range between 8 and 12◦C, withminimum daily temperatures in January around 0◦C andmaximum daily temperatures around 20◦C in July. Meanannual precipitation ranges from values exceeding 1000 mmper year in western coastal regions to 500 mm per year incentral France, and eastern UK and Germany (Tiktak etal., 2006). The combination of favorable climatic condi-tions, good agricultural practices and high inputs of fertil-izer and manure allow high yields of cereals, potato, sugarbeet, forage grass and maize and of milk, that generally ex-ceed average values for the EU27 (Table 3). Yield differencesper hectare in northwestern EU member states are largestfor milk and ruminant meat because of large differences inshares of grazing beef and dairy cattle, areas of marginalgrassland, grass in arable rotations (e.g. Denmark) and graz-ing intensity. Ireland, the UK and France hold large areas ofless productive grassland on wet, peaty or mountain soils. Allcountries considered are net importers of substantial amountsof fodder and feed stuff, in the range of 200–400 kg per live-stock unit (LSU; reference unit for livestock species basedon feed requirement) in the period between 2000 and 2007(FAOSTAT), with the exception of France (120 kg LSU−1).These differences explain a minor part of differences in milkand ruminant meat yield per hectare.
Mean national livestock densities in the considered mem-ber states range between 0.9 LSU per hectare in northernFrance, which is near to the average in the EU27, to 3.4 LSUper hectare in the Netherlands (Table 4; using LSU defini-tion according to Eurostat). The share of dairy cows (onedairy cow represents one Livestock Unit; LSU) ranges from10 % in Denmark to 22 % in Ireland. Regional livestock den-sities can be much higher, with 8.9 LSU ha−1 in the south-eastern part of the Netherlands, 6.0 LSU ha−1 in FlemishRegion-Belgium and 3.7 LSU ha−1 in Brittany-France, and
H. J. M. van Grinsven et al.: Benchmarking the Nitrates Directive in northwestern Europe 5147
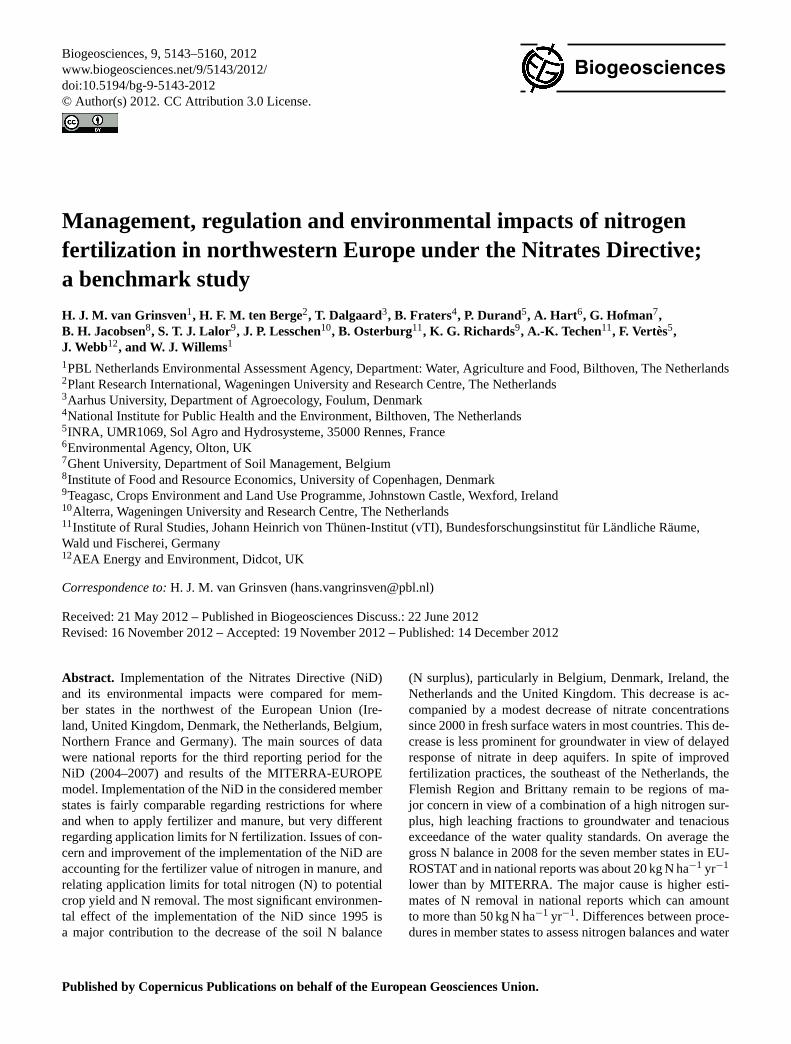
Table 3.Mean annual yields in northwestern member states of the EU for cereals, forage maize, potato and sugar beet (Sources: FAOSTATmean crop data are for the period 2000–2007; EFMA (2008), mean data for 2006–2009), and the sum of ruminant meat+0.1× total milkproduction as a proxy for ruminant productivity per hectare of permanent grassland (Sources: production from FAOSTAT, data 2008, andgrassland areas from Eurostat (2011), data 2007).
Wheat Forage maize Potato Sugar beetMeat+ 0.1× Milk All cereals Potato Sugar beetton ha−1 ton ha−1 ton ha−1 ton ha−1 ton ha−1 grass land ton ha−1 ton ha−1 ton ha−1
a In the EUROSTAT definition one LSU corresponds to the feed requirement of one adult dairy cowproducing 3000 kg of milk annually.b All departments above the line “Nantes-Dijon”.
are always associated with the presence of a large pig and/orpoultry sector. Farm sizes per holding in the northwesternmember states are much higher than the EU27 average.
Nitrogen from manures constitutes a substantial propor-tion of total nitrogen fertilization, ranging between 40 % inGermany and Northern France, to 60–65 % in Belgium, Ire-land and the Netherlands. In the Netherlands and the FlemishRegion the net nitrogen excretion (after subtracting ammoniaemission from housing and storage) exceeds the applicationlimit of 170 kg ha−1 set by the NiD, by 40 and 12 kg ha−11
respectively, based on MITERRA results. These two coun-tries require a combination of derogation, on the one hand,and export and processing of manure on the other hand, to beable to comply with the NiD at a national level. The sum ofnitrogen excretion plus fertilizer use per hectare of utilized
1Unless indicated otherwise the unit kg ha−1 refers to annualfluxes.
agricultural area (UAA) in the period 2005–2008 ranges be-tween 138 kg ha−1 in France to 377 kg ha−1 in the Nether-lands (Table 5) and exceeds mean values for EU12 (old mem-ber states) and EU27.
3.2 Application standards for nitrogen from manureand fertilizer
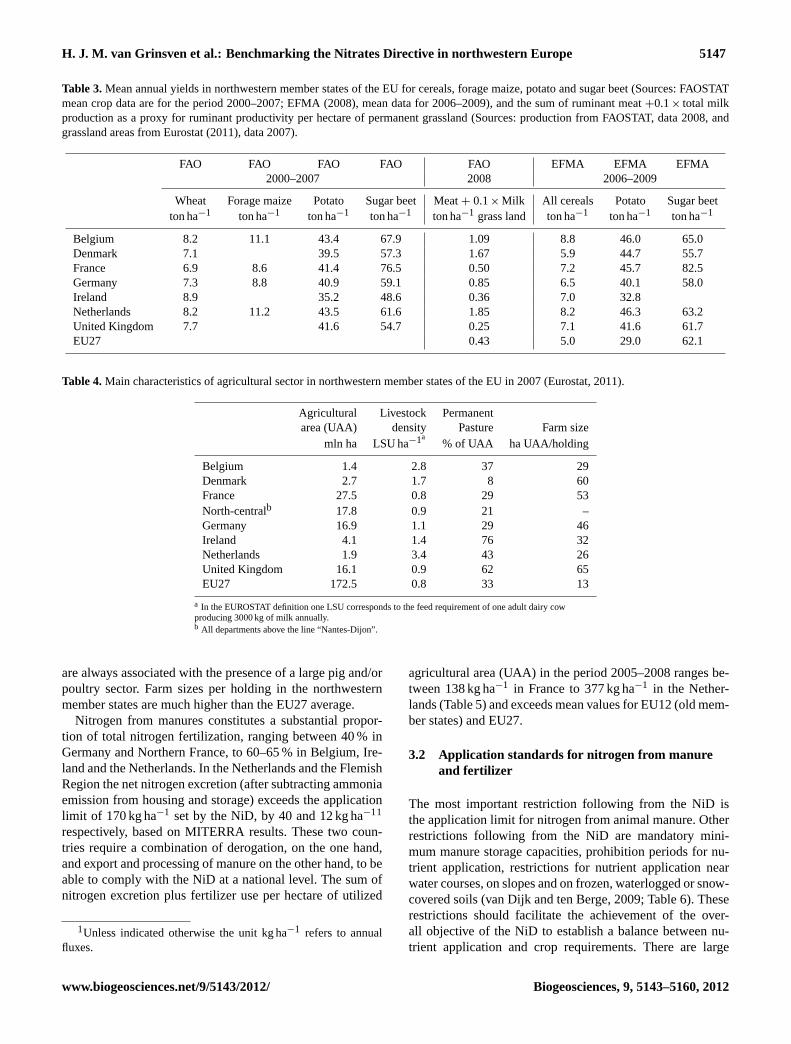
The most important restriction following from the NiD isthe application limit for nitrogen from animal manure. Otherrestrictions following from the NiD are mandatory mini-mum manure storage capacities, prohibition periods for nu-trient application, restrictions for nutrient application nearwater courses, on slopes and on frozen, waterlogged or snow-covered soils (van Dijk and ten Berge, 2009; Table 6). Theserestrictions should facilitate the achievement of the over-all objective of the NiD to establish a balance between nu-trient application and crop requirements. There are large
∗ EU15: member states between 1 January 1995 and 30 April 2004.
Table 6.Restrictions for application of fertilizer and manure in national implementations of the Nitrates Directive (Adapted from Dijk andBerge, 2009).
Closed periods for manure/fertilizers3 yes yes yes4 yes yes yes yesLow emission application yes yes yesNo manure application on frozen, snow covered and waterlogged land yes yes yes4 yes yes yes yesUnfertilised zones along surface water5 yes6 yes yes4 yes yes yes yes7
Post-harvest measures
Catch crops yes yes4 yesNo tillage in autumn yes yes8
Other Policy Measures
Max limit for livestock yes
Maximum limits on N and P use
Manure yes yes yes yes yes yes yesTotal N (manure+ fertilizers) yes yes yes4 yes yes yesMaximum N and P surpluses yesMaximum soil mineral N in autumn yes yes9 yes1
DK = Denmark, BFL= Belgium Flemish Region, FR= France, GE= Germany, UK= United Kingdom, NL= The Netherlands, IRL= Ireland1 Implementation varies between states (Lander) of Germany, e.g. maximum soil mineral N autumn only in Baden Wurtemberg.2 For NL in case farm has derogation. For BFL from 2013, on fields exceeding the threshold value of maximum soil mineral N in autumn.3 For liquid manures generally between September/October and February.4 In some departments within the NVZ’s. E.g. catch crops in western regions (Brittany and Normandy); Anonymous (2008a).5 With large variation in width and length of unfertilized zones.6 Increased from 2 m to 10 m from 2012 onwards.7 No fertilizer within 2 meters of surface water.8 Ploughing between July and November if green cover emergence of planted crop within 6 weeks of ploughing.9 In small highly sensitive areas (e.g. coastal areas with green tides).
1 Also a derogation for some arable crops.2Situation in 2007 (Anonymous, 2008b).
discrepancies between countries regarding the way these re-strictions are translated into national law and applied in prac-tice. Large discrepancies exist for methods of estimation of Nemissions by livestock (including volatilization coefficientsfor ammonia), definitions of periods when and areas wheremanure application is restricted, procedures for enforcementof regulations can be very different and hamper a strict com-parison of environmental impacts of the NiD between coun-tries.
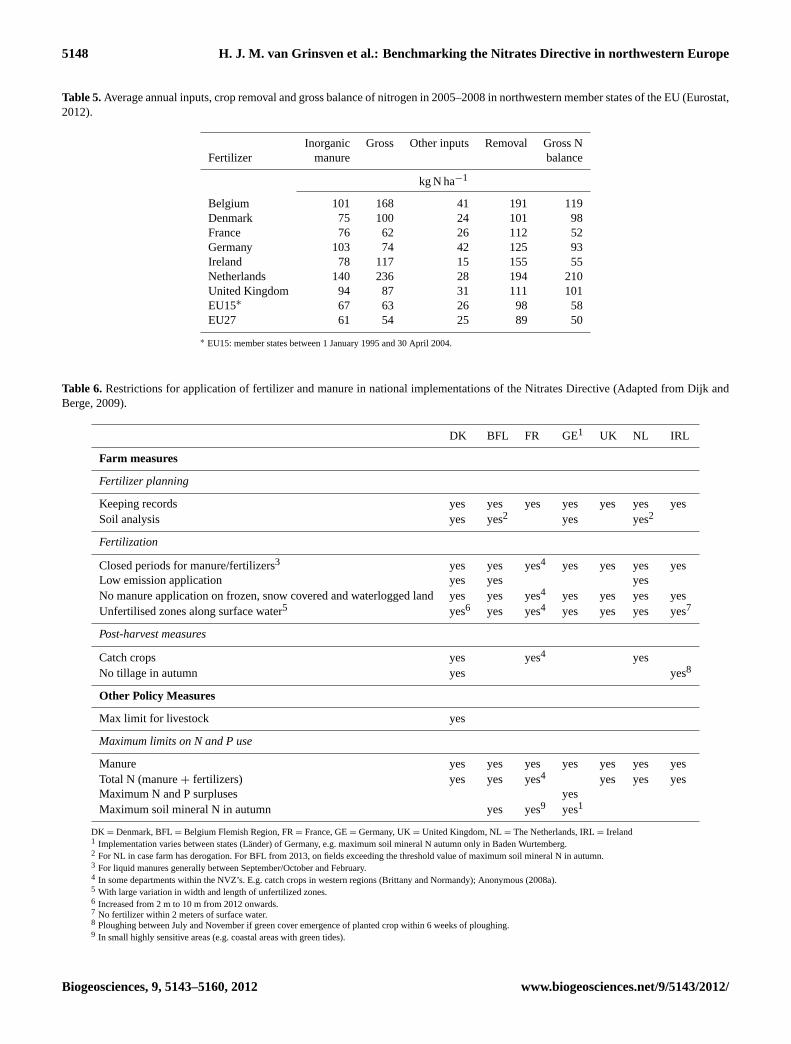
With the exception of France, all member states have ne-gotiated with the EU Commission an extension of the appli-cation limit in the NiD of 170 kg N ha−1 for manure from ru-minants (a so-called derogation; Table 7). These derogationsare based on proof that this extension will not increase therisk for exceeding the critical nitrate limit of 50 mg NO−
3 L−1
in groundwater and surface water. Derogations are granted atfarm level (except in the Flemish Region) and mostly applyto farms with at least 70–80 % of farm land in use for grass-land (or roughage in Denmark). The Flemish Region has aderogation at field level and includes some arable crops. Forgrassland and forage maize followed by one cut of grass orcut rye the application limit is 250 kg N ha−1 as cattle manureor treated pig manure and 200 kg N ha−1 for beet and win-ter wheat followed by a catch crop (Table 7). Denmark hasimplemented a maximum application limit for arable landof 140 kg ha−1 of nitrogen from pig manure and on organicfarms (Kronvang et al., 2008), which is beyond the require-ments of the NiD. The Netherlands has the largest derogationboth regarding the extension of the application limit itself,and regarding the area where this extension applies.
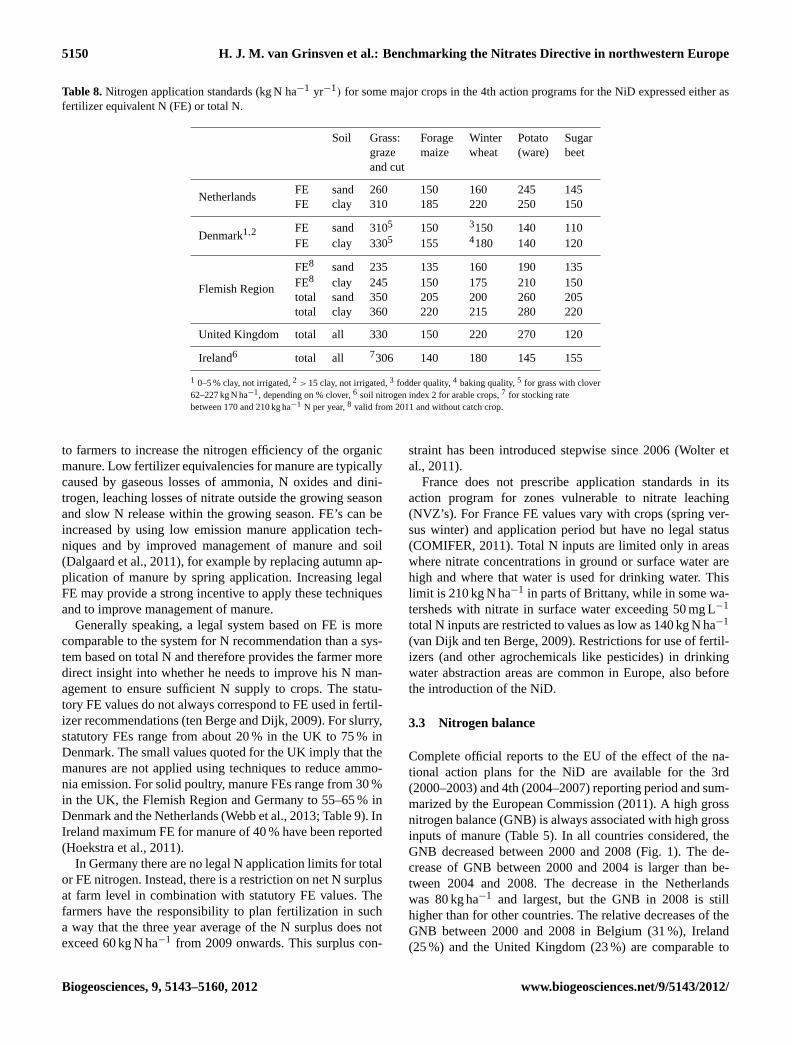
Only the NiD action programs of the Netherlands, Den-mark and the Flemish Region have introduced crop andsoil type-dependent applications standards for total N in-puts, from manures and mineral fertilizers (van Dijk andten Berge, 2009). Application standards in the Netherlandsand Denmark apply to fertilizer equivalent (FE) N (Table 8).In Denmark, Ireland, the Netherlands and the UK for some
crops, standards are differentiated with actual yield level andtarget. For cereals different standards may apply to baking,malting and fodder qualities, for potato to cultivars for useas ware, french fry, starch and seed. In the Flemish Regionfarmers can choose between a fixed total nitrogen amount orFE N values for organic fertilizers per crop. This new systemwith some new limits has been introduced in 2011 (Anony-mous, 2011). In Denmark, Ireland and the UK applicationstandards also depend on the soil N status and cropping his-tory.
Differences between total FE N application standards forthe Flemish Region, the Netherlands and Denmark can bequite considerable. While standards for forage maize andwinter wheat on sandy soils are quite comparable, differencesbetween standards for other crops and clay soils are higher,amounting to 110 kg N ha−1 for ware potato on clay betweenthe Netherlands and Denmark (Table 8). As a whole, the stan-dards are the highest in the Netherlands for most crops men-tioned in Table 8. For grassland without clover, standards arehighest in Denmark, however, grass with clover is predomi-nant in Denmark, and has lower standards. Standards for win-ter wheat and, to a lesser extent, for forage maize in Denmarkand the Flemish Region are comparable. On the other hand,the standards for potato and sugar beet are lower for Den-mark compared to the Flemish Region while this is the re-verse for grassland. One would expect application standardsin Denmark to be lower than in the Flemish Region in viewof a lower yield potential (Table 3) and taking into accountthat in Denmark the fertilization limits are set at 90 % of theeconomic optimum N-fertilization.
The consequence for Denmark, the Flemish Region, andthe Netherlands of having a legal system of application stan-dards based on total FE nitrogen is the introduction of fixedstatutory values for the fertilizer equivalency of manures.Also the UK and Ireland have statutory values for the FEof manure in their NiD action programs. When statutory FEvalues are lower than actual values they provide an incentive
5150 H. J. M. van Grinsven et al.: Benchmarking the Nitrates Directive in northwestern Europe
Table 8.Nitrogen application standards (kg N ha−1 yr−1) for some major crops in the 4th action programs for the NiD expressed either asfertilizer equivalent N (FE) or total N.
1 0–5 % clay, not irrigated,2 > 15 clay, not irrigated,3 fodder quality,4 baking quality,5 for grass with clover62–227 kg N ha−1, depending on % clover,6 soil nitrogen index 2 for arable crops,7 for stocking ratebetween 170 and 210 kg ha−1 N per year,8 valid from 2011 and without catch crop.
to farmers to increase the nitrogen efficiency of the organicmanure. Low fertilizer equivalencies for manure are typicallycaused by gaseous losses of ammonia, N oxides and dini-trogen, leaching losses of nitrate outside the growing seasonand slow N release within the growing season. FE’s can beincreased by using low emission manure application tech-niques and by improved management of manure and soil(Dalgaard et al., 2011), for example by replacing autumn ap-plication of manure by spring application. Increasing legalFE may provide a strong incentive to apply these techniquesand to improve management of manure.
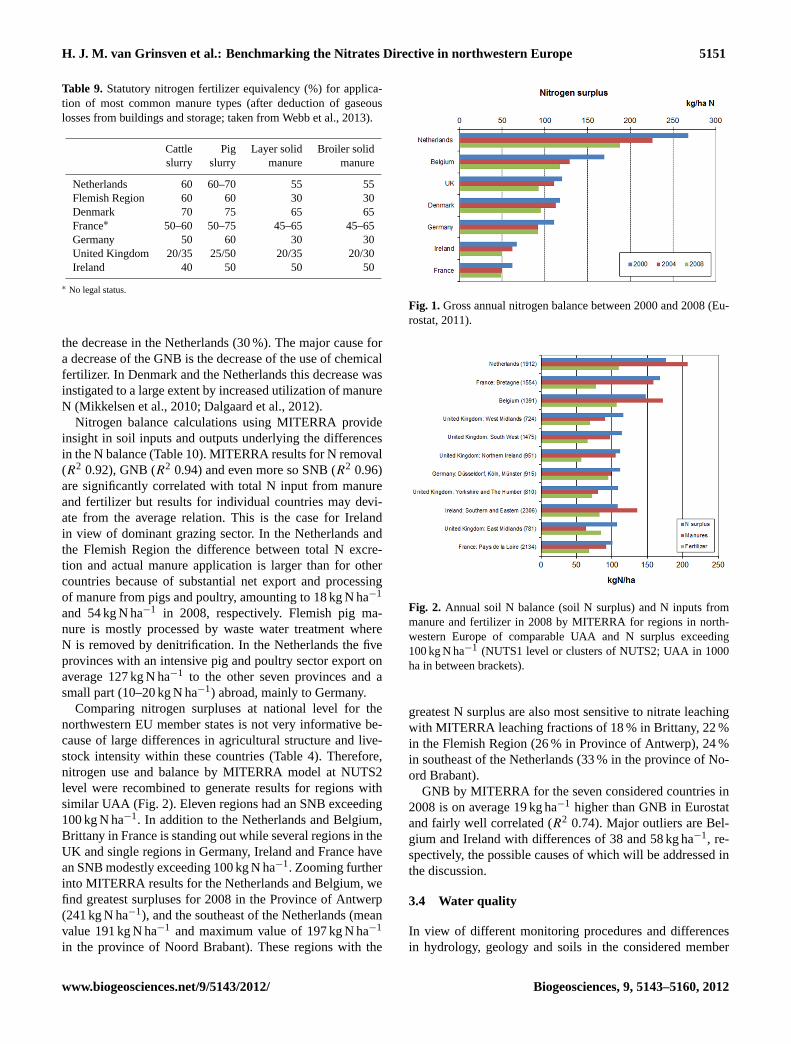
Generally speaking, a legal system based on FE is morecomparable to the system for N recommendation than a sys-tem based on total N and therefore provides the farmer moredirect insight into whether he needs to improve his N man-agement to ensure sufficient N supply to crops. The statu-tory FE values do not always correspond to FE used in fertil-izer recommendations (ten Berge and Dijk, 2009). For slurry,statutory FEs range from about 20 % in the UK to 75 % inDenmark. The small values quoted for the UK imply that themanures are not applied using techniques to reduce ammo-nia emission. For solid poultry, manure FEs range from 30 %in the UK, the Flemish Region and Germany to 55–65 % inDenmark and the Netherlands (Webb et al., 2013; Table 9). InIreland maximum FE for manure of 40 % have been reported(Hoekstra et al., 2011).
In Germany there are no legal N application limits for totalor FE nitrogen. Instead, there is a restriction on net N surplusat farm level in combination with statutory FE values. Thefarmers have the responsibility to plan fertilization in sucha way that the three year average of the N surplus does notexceed 60 kg N ha−1 from 2009 onwards. This surplus con-
straint has been introduced stepwise since 2006 (Wolter etal., 2011).
France does not prescribe application standards in itsaction program for zones vulnerable to nitrate leaching(NVZ’s). For France FE values vary with crops (spring ver-sus winter) and application period but have no legal status(COMIFER, 2011). Total N inputs are limited only in areaswhere nitrate concentrations in ground or surface water arehigh and where that water is used for drinking water. Thislimit is 210 kg N ha−1 in parts of Brittany, while in some wa-tersheds with nitrate in surface water exceeding 50 mg L−1
total N inputs are restricted to values as low as 140 kg N ha−1
(van Dijk and ten Berge, 2009). Restrictions for use of fertil-izers (and other agrochemicals like pesticides) in drinkingwater abstraction areas are common in Europe, also beforethe introduction of the NiD.
3.3 Nitrogen balance
Complete official reports to the EU of the effect of the na-tional action plans for the NiD are available for the 3rd(2000–2003) and 4th (2004–2007) reporting period and sum-marized by the European Commission (2011). A high grossnitrogen balance (GNB) is always associated with high grossinputs of manure (Table 5). In all countries considered, theGNB decreased between 2000 and 2008 (Fig. 1). The de-crease of GNB between 2000 and 2004 is larger than be-tween 2004 and 2008. The decrease in the Netherlandswas 80 kg ha−1 and largest, but the GNB in 2008 is stillhigher than for other countries. The relative decreases of theGNB between 2000 and 2008 in Belgium (31 %), Ireland(25 %) and the United Kingdom (23 %) are comparable to
H. J. M. van Grinsven et al.: Benchmarking the Nitrates Directive in northwestern Europe 5151
Table 9. Statutory nitrogen fertilizer equivalency (%) for applica-tion of most common manure types (after deduction of gaseouslosses from buildings and storage; taken from Webb et al., 2013).
the decrease in the Netherlands (30 %). The major cause fora decrease of the GNB is the decrease of the use of chemicalfertilizer. In Denmark and the Netherlands this decrease wasinstigated to a large extent by increased utilization of manureN (Mikkelsen et al., 2010; Dalgaard et al., 2012).
Nitrogen balance calculations using MITERRA provideinsight in soil inputs and outputs underlying the differencesin the N balance (Table 10). MITERRA results for N removal(R2 0.92), GNB (R2 0.94) and even more so SNB (R2 0.96)are significantly correlated with total N input from manureand fertilizer but results for individual countries may devi-ate from the average relation. This is the case for Irelandin view of dominant grazing sector. In the Netherlands andthe Flemish Region the difference between total N excre-tion and actual manure application is larger than for othercountries because of substantial net export and processingof manure from pigs and poultry, amounting to 18 kg N ha−1
and 54 kg N ha−1 in 2008, respectively. Flemish pig ma-nure is mostly processed by waste water treatment whereN is removed by denitrification. In the Netherlands the fiveprovinces with an intensive pig and poultry sector export onaverage 127 kg N ha−1 to the other seven provinces and asmall part (10–20 kg N ha−1) abroad, mainly to Germany.
Comparing nitrogen surpluses at national level for thenorthwestern EU member states is not very informative be-cause of large differences in agricultural structure and live-stock intensity within these countries (Table 4). Therefore,nitrogen use and balance by MITERRA model at NUTS2level were recombined to generate results for regions withsimilar UAA (Fig. 2). Eleven regions had an SNB exceeding100 kg N ha−1. In addition to the Netherlands and Belgium,Brittany in France is standing out while several regions in theUK and single regions in Germany, Ireland and France havean SNB modestly exceeding 100 kg N ha−1. Zooming furtherinto MITERRA results for the Netherlands and Belgium, wefind greatest surpluses for 2008 in the Province of Antwerp(241 kg N ha−1), and the southeast of the Netherlands (meanvalue 191 kg N ha−1 and maximum value of 197 kg N ha−1
in the province of Noord Brabant). These regions with the
40
Figures 1 2 3
4
Figure 1. Gross annual nitrogen balance between 2000 and 2008 (Eurostat, 2011). 5 6 Fig. 1. Gross annual nitrogen balance between 2000 and 2008 (Eu-rostat, 2011).
41
1
Figure 2. Annual soil N balance (soil N surplus) and N inputs from manure and fertilizer in 2
2008 by MITERRA for regions in northwestern Europe of comparable UAA and N surplus 3
exceeding 100 kgN/ha (NUTS1 level or clusters of NUTS2; UAA in 1000 ha in between 4
brackets). 5
6
Fig. 2. Annual soil N balance (soil N surplus) and N inputs frommanure and fertilizer in 2008 by MITERRA for regions in north-western Europe of comparable UAA and N surplus exceeding100 kg N ha−1 (NUTS1 level or clusters of NUTS2; UAA in 1000ha in between brackets).
greatest N surplus are also most sensitive to nitrate leachingwith MITERRA leaching fractions of 18 % in Brittany, 22 %in the Flemish Region (26 % in Province of Antwerp), 24 %in southeast of the Netherlands (33 % in the province of No-ord Brabant).
GNB by MITERRA for the seven considered countries in2008 is on average 19 kg ha−1 higher than GNB in Eurostatand fairly well correlated (R2 0.74). Major outliers are Bel-gium and Ireland with differences of 38 and 58 kg ha−1, re-spectively, the possible causes of which will be addressed inthe discussion.
3.4 Water quality
In view of different monitoring procedures and differencesin hydrology, geology and soils in the considered member
Figure 3. Percentage of groundwater samples in monitoring programs for the Nitrates 2
Directive exceeding 25 mg NO3/l for the 2nd and 3rd reporting period (European Commission, 3
2011). 4
* for Germany only data for the agriculture monitoring network 5
** for the reporting period 2000-2003 United Kingdom reported only stations within England. 6
*** for the reporting period 2000-2003 Denmark provided aggregated results 7
8
Fig. 3. Percentage of groundwater samples in monitoring programsfor the Nitrates Directive exceeding 25 mg NO3 L−1 for the 2ndand 3rd reporting period (European Commission, 2011). * For Ger-many only data for the agriculture monitoring network ** For thereporting period 2000–2003 United Kingdom reported only stationswithin England. *** For the reporting period 2000–2003 Denmarkprovided aggregated results.
states, reports to the EU Commission of nitrate concentra-tions in groundwater exceeding a policy target (in this casethe nitrate limit for drinking water) do not provide direct in-sight in the effectiveness of NiD action programs or in theimpact of differences of nitrogen balances. This is perhapsmost strikingly illustrated in the Netherlands where mean ni-trate concentrations in groundwater are low (Fig. 3) whilethe GNB is highest (Figs. 1 and 2). In part differences inthe nitrate response between reporting periods and betweencountries are artifacts of different monitoring procedures anddata selections. For example the apparent increase of ni-trate concentrations in Denmark and the Netherlands be-tween 2000–2003 and 2004–2007 in the EU dataset (Euro-pean Commission, 2011) is an artifact of inclusion of obser-vations in the uppermost groundwater in the 2004–2007 EUdataset. But differences in the nitrate response between coun-
tries mainly have hydrogeochemical causes like the pres-ence of relatively deep soils, high groundwater tables andhigh organic matter contents (in part as peaty soils) pro-moting denitrification. Some areas in the UK have deep un-saturated extents through which the travel time for nitratemay be several decades (Wang et al., 2012). Analysis of lagtimes required for improvements of groundwater nitrate lev-els in Ireland showed that the achievement of good waterquality status for some water bodies may be too optimisticbut improvements are predicted within subsequent 6- and12-yr cycles (Fenton et al., 2011). Analyzing a 50 yr timeseries of SNB and nitrate concentration in groundwater inDenmark, Hansen et al. (2011) found that nitrate concentra-tions have been decreasing since 1980. They found that thefrequency of downward nitrate trends in groundwater sam-ples clearly increased with lower recharge age, providingproof that younger groundwater responds fastest to decreas-ing trends of SNB. Hansen et al. (2012) further found that ni-trate concentration decreased significantly more in areas witha high livestock density. Reported nitrate concentrations inGermany are higher than in the other northwestern EU mem-ber states because sampling is restricted to agricultural soilsand focused on polluted regions. Changes in monitoring pro-cedures and densities do not allow solid conclusions on ni-trate trends between the 3rd and 2nd reporting period basedon the total dataset of groundwater observations. However,the overall picture appears to be that nitrate concentrationsdid not change between 2000 and 2007. In shallow ground-water, which responds most directly to NiD action programs,60 % of all samples in the EU27 were below 25 mg NO3 L−1,and 20 % above the NiD target of 50 mg NO3 L−1 (EuropeanCommission, 2011). More insight into trends may be ob-tained by selecting data for shallow phreatic groundwater di-rectly from official national NiD reports for the Netherlands(Zwart et al., 2008), the Flemish Region (Desimpelaere etal., 2008), Walloon region, Ireland, Germany and Denmark
H. J. M. van Grinsven et al.: Benchmarking the Nitrates Directive in northwestern Europe 5153
43
1
Figure 4. Percentage of shallow phreatic groundwater samples in monitoring programs for the 2
Nitrates Directive for the 3rd reporting period (2004-2007) exceeding 25 or 50 mgNO3/l. 3
4
Fig. 4.Percentage of shallow phreatic groundwater samples in mon-itoring programs for the Nitrates Directive for the 3rd reporting pe-riod (2004–2007) exceeding 25 or 50 mg NO3 L−1.
(Anonymous, 2008b, c, d, e), (Fig. 4). Here differences ofnitrate concentration between countries appear to be more inaccordance with differences of the nitrogen balance (Fig. 1).
In countries with a long running monitoring networkfor nitrate in the upper, sometimes shallow, groundwa-ter in sandy phreatic aquifers (Fig. 5) a slow to moder-ate decrease of nitrate concentration can be observed. Themean decrease of the nitrate concentration in the moni-toring period is largest in the Netherlands (6 mg NO3 L−1
per year), followed by Denmark (2 mg NO3 L−1 per year),Germany (0.6 mg NO3 L−1 per year), Flemish Region(0.7 mg NO3 L−1 per year) and finally the Walloon regionwith a small increase (0.3 mg NO3 L−1 per year). Thesetrends do not only reflect the effect of the measures fromimplementation of the NiD, but also on changes in agricul-tural practices and effects of implementation of other poli-cies, e.g., measures for reducing ammonia emission. Trendsfurther depend on sampling depth and travel time of infiltrat-ing water which differ spatially within countries and betweencountries.
Observed nitrate exceedance in the period 2004–2007(Fig. 4) and nitrate concentrations between 2005 and 2010(Fig. 5), both in upper levels of phreatic groundwater, agreefairly well with modeled nitrate concentrations in leachingwater in 2008 using MITERRA (Figs. 6 and 7). Some level ofdisagreement is to be expected considering that nitrate con-centrations in leaching water will tend to be higher than ingroundwater, and that monitoring data are not always repre-sentative for nitrate concentration in total UAA. In Germany,observed concentrations are higher than MITERRA resultsin view of the intended focus of the monitoring program onareas with high nitrate concentrations (Anonymous, 2008d).
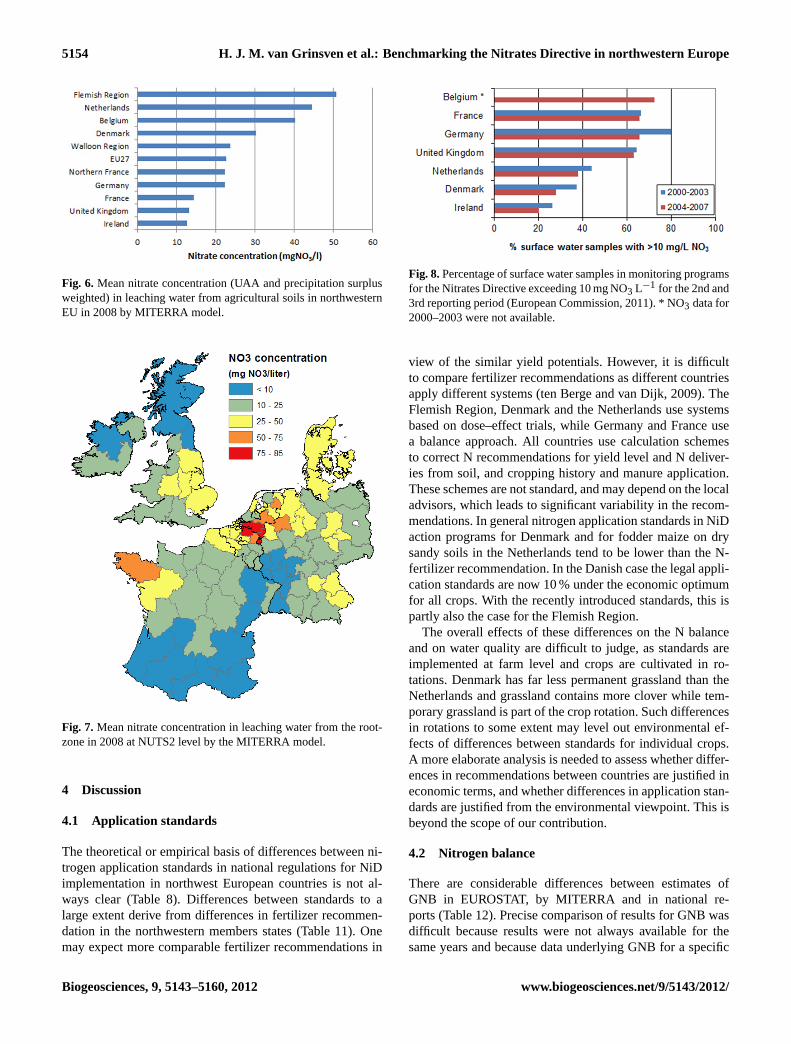
MITERRA results for NUTS2 regions with mean areaweighted nitrate concentrations exceeding 50 mg NO3 L−1
are found only in the Netherlands, the Flemish Region, thewestern part of Germany and in Brittany (Fig. 7). SNB val-ues exceeding 100 kg N ha−1 in regions in the UK and Ire-land (Fig. 2) do not lead to exceedance of the nitrate target
44
1
Figure 5. Trend of nitrate concentrations in upper levels of phreatic groundwater in sandy 2
soils, catchments or aquifers in monitoring programs for the Nitrates Directive (Data taken 3
from Fraters et al. 2011). 4
5
Fig. 5. Trend of nitrate concentrations in upper levels of phreaticgroundwater in sandy soils, catchments or aquifers in monitoringprograms for the Nitrates Directive (Data taken from Fraters et al.,2011).
of the NiD as a result of relatively low nitrate leaching frac-tions in these regions. However, the risk of exceedance ofecological limits for nitrate or nitrogen in surface water willbe higher in regions with high SNB.
The EU Water Framework Directive gives room to mem-ber states to define and differentiate national standards forgood ecological status or potential. A nitrate limit concentra-tion of 10 mg NO3 L−1 (2 mg N L−1) was used as a proxyfor the nitrate limit in fresh waters (Cardoso et al., 2001).Surface waters with mean nitrate concentration greater than10 mg NO3 L−1 ranged from 20 % in Ireland to 60 % in Ger-many (Fig. 8). Between 2000 and 2007 the percentage of sur-face water samples exceeding 10 mg NO3 L−1 shows a smalldecrease, when looking to the total population of fresh sur-face water samples reported to the EU Commission (Fig. 8).Differences between countries do not seem to have a clearrelation with observed exceedance in groundwater. Again, inpart these differences reflect different response mechanismsand response times and nitrate attenuation during transportfrom groundwater to surface water (Fenton et al., 2009).However, differences in response time will be less than fordeeper groundwater bodies. In particular, response of sur-face water nitrate to restrictions on how and when to ap-ply manure and fertilizer (Table 6) should be faster, due tothe shorter transport pathways compared to deeper aquifers,while full response to restrictions on application levels maytake decades.
5154 H. J. M. van Grinsven et al.: Benchmarking the Nitrates Directive in northwestern Europe
45
1
Figure 6. Mean nitrate concentration (UAA and precipitation surplus weighted) in leaching 2
water from agricultural soils in northwestern EU in 2008 by MITERRA model. 3
4
Fig. 6. Mean nitrate concentration (UAA and precipitation surplusweighted) in leaching water from agricultural soils in northwesternEU in 2008 by MITERRA model.
46
1 Figure 7. Mean nitrate concentration in leaching water from the root-zone in 2008 at NUTS2 2 level by the MITERRA model. 3 4 Fig. 7. Mean nitrate concentration in leaching water from the root-zone in 2008 at NUTS2 level by the MITERRA model.
4 Discussion
4.1 Application standards
The theoretical or empirical basis of differences between ni-trogen application standards in national regulations for NiDimplementation in northwest European countries is not al-ways clear (Table 8). Differences between standards to alarge extent derive from differences in fertilizer recommen-dation in the northwestern members states (Table 11). Onemay expect more comparable fertilizer recommendations in
47
1
Figure 8. Percentage of surface water samples in monitoring programs for the Nitrates 2
Directive exceeding 10 mgNO3/l for the 2nd and 3rd reporting period (European Commission, 3
2011). 4
*NO3 data for 2000-2003 were not available 5
6
Fig. 8.Percentage of surface water samples in monitoring programsfor the Nitrates Directive exceeding 10 mg NO3 L−1 for the 2nd and3rd reporting period (European Commission, 2011). * NO3 data for2000–2003 were not available.
view of the similar yield potentials. However, it is difficultto compare fertilizer recommendations as different countriesapply different systems (ten Berge and van Dijk, 2009). TheFlemish Region, Denmark and the Netherlands use systemsbased on dose–effect trials, while Germany and France usea balance approach. All countries use calculation schemesto correct N recommendations for yield level and N deliver-ies from soil, and cropping history and manure application.These schemes are not standard, and may depend on the localadvisors, which leads to significant variability in the recom-mendations. In general nitrogen application standards in NiDaction programs for Denmark and for fodder maize on drysandy soils in the Netherlands tend to be lower than the N-fertilizer recommendation. In the Danish case the legal appli-cation standards are now 10 % under the economic optimumfor all crops. With the recently introduced standards, this ispartly also the case for the Flemish Region.
The overall effects of these differences on the N balanceand on water quality are difficult to judge, as standards areimplemented at farm level and crops are cultivated in ro-tations. Denmark has far less permanent grassland than theNetherlands and grassland contains more clover while tem-porary grassland is part of the crop rotation. Such differencesin rotations to some extent may level out environmental ef-fects of differences between standards for individual crops.A more elaborate analysis is needed to assess whether differ-ences in recommendations between countries are justified ineconomic terms, and whether differences in application stan-dards are justified from the environmental viewpoint. This isbeyond the scope of our contribution.
4.2 Nitrogen balance
There are considerable differences between estimates ofGNB in EUROSTAT, by MITERRA and in national re-ports (Table 12). Precise comparison of results for GNB wasdifficult because results were not always available for thesame years and because data underlying GNB for a specific
H. J. M. van Grinsven et al.: Benchmarking the Nitrates Directive in northwestern Europe 5155
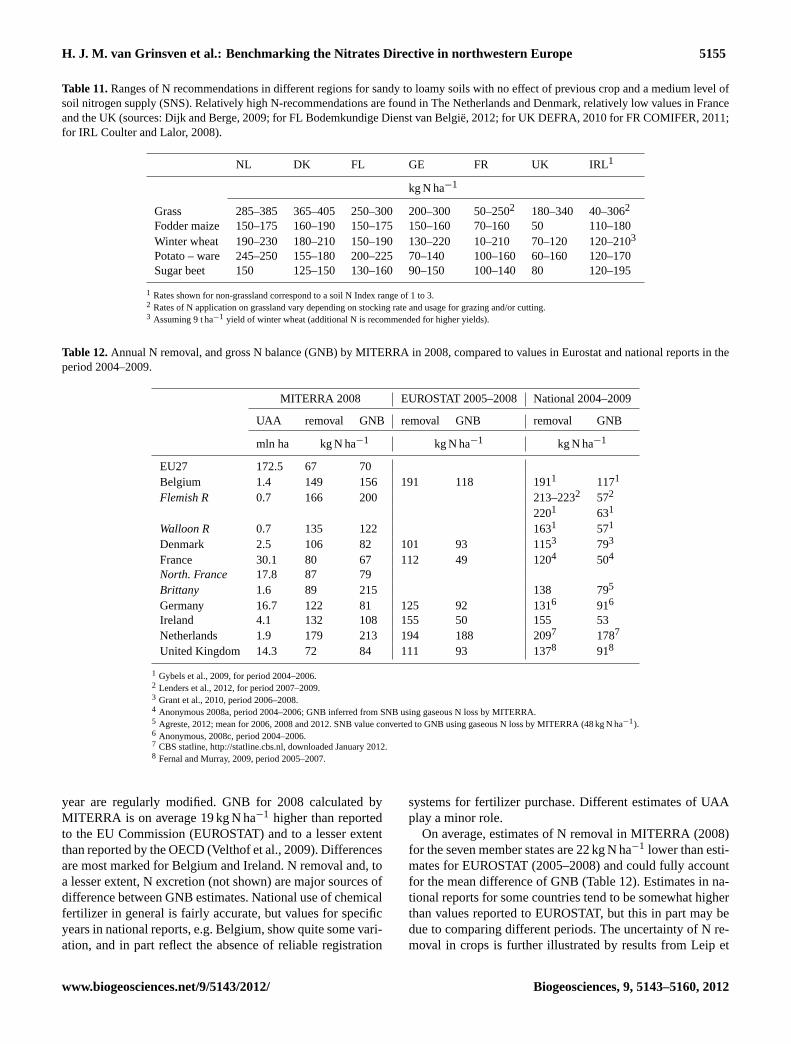
Table 11.Ranges of N recommendations in different regions for sandy to loamy soils with no effect of previous crop and a medium level ofsoil nitrogen supply (SNS). Relatively high N-recommendations are found in The Netherlands and Denmark, relatively low values in Franceand the UK (sources: Dijk and Berge, 2009; for FL Bodemkundige Dienst van Belgie, 2012; for UK DEFRA, 2010 for FR COMIFER, 2011;for IRL Coulter and Lalor, 2008).
1 Rates shown for non-grassland correspond to a soil N Index range of 1 to 3.2 Rates of N application on grassland vary depending on stocking rate and usage for grazing and/or cutting.3 Assuming 9 t ha−1 yield of winter wheat (additional N is recommended for higher yields).
Table 12.Annual N removal, and gross N balance (GNB) by MITERRA in 2008, compared to values in Eurostat and national reports in theperiod 2004–2009.
MITERRA 2008 EUROSTAT 2005–2008 National 2004–2009
1 Gybels et al., 2009, for period 2004–2006.2 Lenders et al., 2012, for period 2007–2009.3 Grant et al., 2010, period 2006–2008.4 Anonymous 2008a, period 2004–2006; GNB inferred from SNB using gaseous N loss by MITERRA.5 Agreste, 2012; mean for 2006, 2008 and 2012. SNB value converted to GNB using gaseous N loss by MITERRA (48 kg N ha−1).6 Anonymous, 2008c, period 2004–2006.7 CBS statline,http://statline.cbs.nl, downloaded January 2012.8 Fernal and Murray, 2009, period 2005–2007.
year are regularly modified. GNB for 2008 calculated byMITERRA is on average 19 kg N ha−1 higher than reportedto the EU Commission (EUROSTAT) and to a lesser extentthan reported by the OECD (Velthof et al., 2009). Differencesare most marked for Belgium and Ireland. N removal and, toa lesser extent, N excretion (not shown) are major sources ofdifference between GNB estimates. National use of chemicalfertilizer in general is fairly accurate, but values for specificyears in national reports, e.g. Belgium, show quite some vari-ation, and in part reflect the absence of reliable registration
systems for fertilizer purchase. Different estimates of UAAplay a minor role.
On average, estimates of N removal in MITERRA (2008)for the seven member states are 22 kg N ha−1 lower than esti-mates for EUROSTAT (2005–2008) and could fully accountfor the mean difference of GNB (Table 12). Estimates in na-tional reports for some countries tend to be somewhat higherthan values reported to EUROSTAT, but this in part may bedue to comparing different periods. The uncertainty of N re-moval in crops is further illustrated by results from Leip et
5156 H. J. M. van Grinsven et al.: Benchmarking the Nitrates Directive in northwestern Europe
al. (2008), that were on average nearly 28 kg N ha−1 higherthan in EUROSTAT, using a more deterministic Europeanmodel approach. N removal from grassland for fodder likelyis the major source of difference in estimates of total N re-moval (Velthof et al., 2009). MITERRA excretion (2008) onaverage is 7 kg N ha−1 higher than in EUROSTAT (2005–2008).
For the Flemish Region Lenders et al. (2012) estimate Nremoval at about 320 kg N ha−1 based on grassland yields of10.5 ton ha−1 for permanent grassland and 11.5 ton ha−1 fortemporary grassland, and an N content of 3 %. MITERRAestimates N removal from permanent grassland at about220 kg N ha−1. Differences are caused by lower estimates ofeffective dry matter yield for mixed system of grazing andcutting, and of lower N contents. Estimates of mean N re-moval from grassland in the Netherlands, with practices andN intensity comparable to that in the Flemish Region, arearound 260 kg N ha−1. So overestimation of N removal fromgrassland (36 % of UAA) could explain a major part of thedifference between GNB estimates by MITERRA and na-tional reports.
GNB in 2008 by MITERRA for Brittany in France is morethan twice the regional estimate for 2006–2010 (Agreste,2012). Again this can be largely (> 50 %) explained by amuch higher regional estimate of N removal, and to lesserextent by lower estimates of manure input (about 20 %) andchemical fertilizer (about 10 %). Regional data would sug-gest an overall nitrogen use efficiency (N removal over totalN input from fertilizer and manures) of 80 %, which doesnot seem realistic. Nitrogen use efficiency in Brittany byMITERRA is about 40 %, as compared to 60 % for EU27.
For Ireland, total N removal in MITERRA in 2008 is23 kg N ha−1 lower than the average N removal between2005 and 2008 in EUROSTAT and national reports. In Ire-land 3.9 mln ha of UAA (95 %) is grassland. Mean N removalon grassland is estimated for EUROSTAT at 155 kg N ha−1,while MITERRA calculates about 130 kg N ha−1. Part of thisdifference may be due to different assumptions on reductionof yields and N removal for grazing as compared to cutting,and to different assumptions on shares of intensively andextensively managed grassland. Differences in N removalper hectare between intensive and extensive grassland canamount to a factor of two (Velthof et al., 2009). Another ma-jor source of discrepancy for Ireland between MITERRA re-sults and national reporting is a higher gross input of N inmanure. In Ireland almost 90 % of N production in manure isfrom cattle. Irish national reports use an N excretion value of85 kg N per dairy cow (Anonymous, 2010), while MITERRAuses a value of 105 kg N per dairy cow (Velthof et al., 2011;Annex 1). The high value is based on a more dynamic ap-proach accounting for regional differences in milk yields,grassland yields, and N inputs, while the low value is mainlya function of milk yield. Estimates of N removal for fodderand N excretion are related, as fodder is the major N inputand manure N is the major output. For Ireland, N removal in
EUROSTAT (and national reports) is more than 30 % higherthan N excretion. Even when taking into account N removalin milk and meat and N imports of feed concentrates, thelarge difference between N removal and N excretion may bean indication that either N removal is overestimated or N ex-cretion is underestimated. On the other hand, excretion esti-mates by MITERRA do not seem to match with a relativelymodest average milk yield in Ireland around 5000 kg per cowper year.
Germany is the only country that has established tar-gets for the surplus of N (90 kg ha−1 for 2006–2008) andphosphate (20 kg ha−1 in a six-year average); and managedto achieve these targets in 2008. The stricter targets of60 kg N ha−1 as a three-year average from 2009–2011 on-wards may also be achieved, but some intensive livestockfarms and other farms with higher N surplus still have to in-crease their N efficiency. Infringements of these restrictionsare not directly subject to fines, but will lead to administrativeprocedures with increasing obligations for farmers to adapt tothe maximum surplus levels.
Recent national census data indicate that since 2008 theuse of chemical fertilizer in Denmark, Germany and theNetherlands is still decreasing, and along with that, prob-ably also the soil surplus of nitrogen. The decrease of thepurchase of chemical N fertilizer coincides with the increasein fertilizer prices since 2008 (Fig. 9). This price increaseis not compensated by an increase of prices of agriculturalcommodities. Between 1990 and 2011 the price of nitrogenfertilizer in Europe has increased twice as fast as the price ofwheat, but since 2007 both prices have become very volatile.In view of the high fertilizer prices farmers may tend to re-duce or postpone fertilizer purchases. The latter hypothesis issupported by a decrease of purchase of chemical N fertilizerin Germany in 2009 and 2010. In Denmark and the Nether-lands the purchase of N fertilizer was hardly affected, whichcan be explained by the presence of legal N application stan-dards that are below the economic optimum. So changes ofnitrogen use and surpluses since 2008 in part can be price ef-fects which interfere with effects of the NiD. This price effectis more apparent for the use of inorganic phosphate fertilizerwhich increased since 2009 in all three countries.
4.3 Implications for the NiD
Monitoring and evaluation of the implementation and effectsof NiD is crucial for its success. At a national level it is arequirement to maintain support from farmers and their localadvisors, as the main actors involved, and for national gov-ernments to optimize policies. The main activities for moni-toring and evaluation are registrations of farm resources andactivities (fertilizer, livestock, UAA), monitoring of waterquality and using calculation procedures and models to as-sess environmental loads and relate this to farm measures andwater quality. These evaluation activities take place at the na-tional level, with varying levels of detail and sophistication,
H. J. M. van Grinsven et al.: Benchmarking the Nitrates Directive in northwestern Europe 5157
and in a more harmonized and generalized manner at the Eu-ropean level. For the latter, the European Commission usesinstitutes like the European Environment Agency (EEA) andthe Joint Research Centers (JRC) and has initiated variousservice contracts, to improve datasets of agricultural activ-ities, and develop and apply models to relate activities toN emissions and water quality (RAINS, GAINS, CAPRI,MITERRA). In spite of recent progress it is difficult to judgeto what extent national implementation and evaluation of theNiD benefits from joint activities and what are major caveatsin data and knowledge about the effects and effectiveness ofthe NiD.
A typical conclusion from national evaluations is that theNiD has made a major contribution to reduction of the N sur-plus. Evaluation of the Danish Aquatic Plan II concluded thatbetween 1998 and 2004 the reduction of N application stan-dards contributed 13 mln kg (32 %) to the total reduction ofthe soil N surplus (SSNB) of 80 mln kg, while increasing le-gal FE for N in manure contributed 10 mln kg (26 %) and re-duced N in feeding 4 mln kg (10 %) (Mikkelsen et al., 2010).Evaluation of the Dutch second action program concludedthat between 1998 and 2004 the Mineral Accounting System(MINAS) led to an overall reduction of the net SSNB by 78mln kg N (van Grinsven et al., 2005). Here the combinationof reducing N-loss standards, and more efficient N manage-ment by better insight from keeping mineral accounts at farmlevel, contributed about 100 mln kg (67 %), while reduced Nin feeding contributed 14 mln kg (19 %) and reducing live-stock and increasing manure export 11 mln kg (14 %). In theNetherlands the dairy sector contributed most to reduction ofthe use of chemical fertilizer, and this reduction was both alearning effect of applying mineral accountancy at farm leveland of enforcement of N-loss standards.
In spite of various efforts at the European level to stream-line procedures for monitoring and evaluation of the NiD,implementation and insight into the effectiveness still varyconsiderably. A first logical step is to further harmonize pro-cedures for monitoring water quality and for assessing the ni-trogen balance, while recognizing country specific monitor-ing needs to, for example, show the effectiveness of specificmeasures in an Action Program (Fraters et al., 2011). An-other major source of difference among member states is howmanure N is taken into account in recommendations as wellas in the regulation of allowable N input. Nitrogen emissionsfrom agricultural sources, particularly manures, are a majorsource of environmental pollution and welfare loss (Sutton etal., 2011). A logical next step for improving harmonizationand effectiveness of the NiD is to demand stricter account-ing of nitrogen in manures, e.g. by imposing a compulsorytime path for increasing nitrogen fertilizer equivalencies fordifferent types of manures in application limits (Csatho andRadimszky, 2009). However, such steps require knowledgesharing, e.g. in defining codes of Good Agricultural Practiceand adopting techniques to improve nitrogen efficiency inmanures. Without that, a too fast and too strict regulation of
48
1
Figure 9. Trends since 1990 of prices of nitrogen fertilizer and of wheat in the EU, and trends 2
of total use of inorganic nitrogen fertilizer in agriculture in Germany (http://www.bmelv-3
statistik.de; N fertilizer use in 1990 was 130 kgN/ha), Denmark (http://www.statbank.dk/; N 4
fertilizer use in 1990 was 150 kgN/ha) and The Netherlands (http://statline.cbs.nl/StatWeb/; 5
N fertilizer use in 1990 was 220 kgN/ha) (downloaded October 31, 2012). 6
Note: The MacSharry reform in 1992 and later reforms reduced the price support for cereals 7
and therefore also the price of wheat. 8
Fig. 9. Trends since 1990 of prices of nitrogen fertilizer and ofwheat in the EU, and trends of total use of inorganic nitrogen fer-tilizer in agriculture in Germany (http://www.bmelv-statistik.de; Nfertilizer use in 1990 was 130 kg N ha−1), Denmark (http://www.statbank.dk/; N fertilizer use in 1990 was 150 kg N ha−1) and theNetherlands (http://statline.cbs.nl/StatWeb/; N fertilizer use in 1990was 220 kg N ha−1) (downloaded 31 October 2012). Note: the Mac-Sharry reform in 1992 and later reforms reduced the price supportfor cereals and therefore also the price of wheat.
nitrogen in manures may decrease the willingness of arablefarmers to accept manure from livestock farmers, because offear of insufficient N supply. In the future, increasing pricesof nitrogen fertilizer may provide an additional economic in-centive to reduce the use of chemical fertilizer and to increasethe efficiency of manures.
The NiD and the national implementation of restrictionson where, when and how much nitrogen in fertilizer and ma-nure can be applied to agricultural land, will remain a ma-jor instrument to reduce nitrogen pollution in waters. How-ever, we should also recognize that agricultural sources ofnitrate are only part of the nitrogen burden. In 2005, diffuseagricultural sources in the EU on average contributed 55 %to the N load to surface waters, the remainder coming fromcommunal, industrial and natural sources. The agriculturalshares for northwest European countries tend to be higher,ranging from 50 to 60 % in the UK, Germany, France andBelgium to 70–85 % in the Netherlands, Denmark and Ire-land (inferred from Bouraoui et al., 2011). So even when allthe measures under NiD have taken hold, it is unlikely thatnitrate concentrations in surface water, and to a lesser extentin groundwater, will return to pre-industrial levels (Howdenet al., 2011). For the immediate future the importance of theNiD for protecting drinking water may be best seen in thoseareas with private or small public drinking water facilities,using groundwater from shallow aquifers, as is the case inDenmark (van Grinsven et al., 2010). In order to protect theircoastal waters, member states in deltas or estuaries of largecross boundary rivers, like the Netherlands and Romania, de-pend on the NiD, particularly when national implementationof the Water Framework Directive is limited to reducing non-agricultural sources of N. A problem when implementing the
5158 H. J. M. van Grinsven et al.: Benchmarking the Nitrates Directive in northwestern Europe
NiD for this purpose is that the limit value of 50 mg L−1 doesnot apply to fresh waters and coastal waters (Nimmo Smithet al., 2007). Nonetheless, the NiD requires member states toprotect such bodies at risk of eutrophication. The lack of asingle standard along with the range of influences that bearon eutrophication can cause some confusion. For control ofcoastal eutrophication, e.g. in Brittany, a limit value around5–10 mg NO3 L−1 would be more appropriate.
5 Conclusions
The most significant effect of the implementation of the NiDsince 1995 in the northwest of the EU is a major contributionto the decrease of the nitrogen soil N balance and by that ofthe gross N load to the aquatic environment. This effect ofthe NiD has not yet manifested in a convincing decrease ofnitrate concentrations in EU monitoring in groundwater andfresh surface waters since 2000. However, before 2000, intro-duction of Good Agricultural Practices for fertilization hasdecreased median and extreme nitrate concentration in manysurface water systems in e.g. the Netherlands, Denmark andthe Flemish Region. Only countries that operate long runningmonitoring programs in shallow groundwater in agriculturalareas, viz. Denmark and the Netherlands, can detect a con-vincing decrease of nitrate concentrations.
Without good opportunities to evaluate the effectivenessof NiD, it is difficult for the EU community to improve theNiD and implementation in member states may lose mo-mentum. This benchmark study indicates that differences incalculation and data procedures between member states innorthwestern EU for determining the nitrogen balances aresuch that comparison of effects of NiD on the N balancebetween countries is not yet possible. In particular the cal-culations methods for N excretion and N removal vary con-siderably among countries. Regarding compliance with ap-plication limit for N in manure also the definition of farmarea differs between countries ranging from total farm area tothe area where manure actually is applied. Harmonization ofthe rationale of national fertilizer recommendation systems isimportant for deriving N application standards that can leadto balanced fertilization, as required by the NiD, and even-tually to create a transparent policy debate about balancingeconomic and environmental goals across the EU. Improvedguidelines and procedures for monitoring water quality andregistration of fertilizer use also would improve the evalua-bility of the NiD. Better selections of, and access to the col-lective monitoring results in EU synthesis reports and datafacilities can help to improve the efficiency of our monitor-ing effort to evaluate the NiD.
Implementation of the NiD in member states in the north-west of the EU is fairly comparable regarding restrictions forapplication of fertilizer and manure, but can be quite differ-ent regarding application standards for total N fertilization.Nitrogen application standards in national implementations
of the NiD are closely linked to national nitrogen fertilizerrecommendations. However, differences in national systemsfor nitrogen recommendations are substantial and resultingrecommendations for specific combination of crops and soilsand do not bear a clear relationship with differences in yieldper hectare.
At some point in the future, when the first and relativelyeasy environmental improvements by the present implemen-tations of NiD are achieved, the NiD may need adjustmentto become more effective, notably through more specificregulation of nitrogen in manure and through differentiationof targets with respect to water quality. This will alsohelp to achieve the targets set in the Water Frame WorkDirective. However, there is an immediate need to improveour data procedures to allow evaluation and benchmarkingof adequacy and effectiveness of NiD implementation.
Edited by: S. Reis
References
Agreste: Bilan azote et phosphore – Resultats 2010, Ministerede l’agriculture, Direction Regionale de l’agroalimentaire etde la foret de Bretagne, Service de Statistique Agricole(Agreste), available at:http://draf.bretagne.agriculture.gouv.fr/IMG/pdf/44-45azotephosphorecle4b161d.pdf, 2012.
Anonymous: Bilan de la mise en oevre de la Directive Nitratesen France (2004–2007), Ministere de l’Ecologie, de l’Energie,du Developpement Durable et de l’Amenagement du Territoire,2008a.
Anonymous: Directive Nitrates (91/676), Rapport vise a l’articele10, Partie I, Bilan et evolution de la qualite des eaux et des pra-tiques agricoles en Region Wallonne, Ministere de la RegionWallonne, Direction Generale des Ressources Naturelles en del’Environnement, 2008b.
Anonymous: Bericht gemaß Artikel 10 der Richtlinie 91/676/EWGdes Rates vom 12 Dezember 1991 zum Schutz der Gewasservor Verunreinigungen durch Nitrat aus landwirtschaftlichenQuellen, Mitteilung der Regierung der Bundesrepublik Deutsch-land, 2008d.
Anonymous: Status and trends of aquatic environment and agricul-tural practice, Danish monitoring and action programmes in ac-cordance with the Nitrates Directive (1991/676/EEC), Prelimi-nary Summary Report to the European Commission, Danish En-vironmental Protection Agency, 2008e.
H. J. M. van Grinsven et al.: Benchmarking the Nitrates Directive in northwestern Europe 5159
Centre, Institute for Environment and Sustainability, Ispra, Italy,2011.
Cardoso, A. C., Duchemin, J., Magoarou, P., and Premazzi, G.: Cri-teria for the identification of freshwaters subject to eutrophica-tion: their use for the implementation of the Nitrates and UrbanWaste Water treatment Directives, EUR Report 19810 EN, Euro-pean Commission Joint Research Centre, Luxembourg, 2001.
COMIFER: Calcul de la fertilisation azotee: guide methodologiquepour l’etablissement des prescriptions locales, cultures annuelleset prairies Edn. 2011, available at:http://www.comifer.asso.fr/images/stories/pdf/brochureazotemajmars%202012.pdf, 2011.
Coulter, B. S. and Lalor, S. (Eds.): Major and micro nutrient advicefor productive agricultural crops, 3rd Ed., Teagasc, JohnstownCastle, Wexford, 2008.
Csatho, P. and Radimszky, L.: Two Worlds within EU27: SharpContrasts in Organic and Mineral Nitrogen-Phosphorus Use,Nitrogen-Phosphorus Balances, and Soil Phosphorus Status:Widening and Deepening Gap between Western and Central Eu-rope, Comm. Soil Sci. Plant Anal. 40, 999–1019, 2009.
Dalgaard, T., Olesen, J. E., Petersen, S. O., Petersen, B. M.,Jørgensen, U., Kristensen, T., Hutchings, N. J., Gyldenkærne, S.,and Hermansen, J. E.: Developments in greenhouse gas emis-sions and net energy use in Danish agriculture – How to achievesubstantial CO2 reductions?, Environ. Pollut., 159, 3193–3203,2011.
Dalgaard, T., Bienkowski, J. F., Bleeker, A., Drouet, J. L., Durand,P., Dragosits, U., Frumau, A., Hutchings, N. J., Kedziora, A.,Magliulo, V., Olesen, J. E., Theobald, M. R., Maury, O., Akkal,N., and Cellier, P.: Farm nitrogen balances in six European agri-cultural landscapes – a method for farming system assessment,emission hotspot identification, and mitigation measure evalua-tion, Biogeosciences Discuss., 9, 8859–8904,doi:10.5194/bgd-9-8859-2012, 2012.
De Clercq, P., Gertsis, A. C., Hofman G., Jarvis, S. C., Neeteson,J. J., and Sinabell, F. (Eds.): Nutrient Management Legislation inEuropean Countries, Wageningen Press, The Netherlands, 2001.
de Vries, W., Leip, A., Reinds, G. J., Kros, J., Lesschen, J. P., andBouwman, A. F.: Comparison of land nitrogen budgets for Euro-pean agriculture by various modeling approaches, Environ. Pol-lut., 159, 3254–3268, 2011.
DEFRA: Fertiliser Manual (RB209), 8th Edition, United Kingdom,2010.
Desimpelaere, K., Lesage, E., Eppinge, r R., and Van Hoof,K.: Vierjaarlijks verslag in het kader van de Nitraatrichtlijn(91/676/EEG) voor het Vlaams Gewest, Vlaamse Land-maatschappij en Vlaams Milieumaatschappij, 2008.
EFMA: Forecast of food, farming and fertilizer use in the EuropeanUnion 2008–2018. European Fertilizer Manufacturers Associa-tion (now Fertilizers Europe), Volume 1, Executive summary andregional data, 2008.
EMEP: EMEP Measurement Database. The Co-operative Pro-gramme for the Monitoring and Evaluation of the Long-RangeTransmission of Air Pollutants in Europe,http://www.emep.int/,2010.
European Commission: Report from the commission to the Counciland the European Parliament on implementation of the CouncilDirective 91/676/EEC concerning the protection of water againstpollution caused by nitrates from agricultural sources for the pe-riod 2000–2003 SEC(2007)339/COM/2007/0120 final, Brussels,
2007.European Commission: Report from the commission to the Council
and the European Parliament on implementation of the CouncilDirective 91/676/EEC concerning the protection of water againstpollution caused by nitrates from agricultural sources for the pe-riod 2004-2007 SEC(2010)118, COM(2007)47 final/2, Brussels,2011.
Eurostat, Pocketbook: Food from farm to fork, 2011.Eurostat, Nitrogen balance in agriculture (data September 2011),
Fenton, O., Richards, K. G., Kirwan, L., Khalil, M. I., and Healy, M.G.: Factors affecting nitrate distribution in shallow groundwaterunder a beef farm in South Eastern Ireland, J. Environ. Manage.,90, 3135–3146, 2009.
Fenton, O., Schulte, R. P. O., Jordan, P., Lalor, S. T. J., and Richards,K. G.: Lag time: a methodology for the estimation of verticaland horizontal travel & flushing timescales to nitrate thresholdconcentrations in Irish aquifers, Environ. Sci. Policy, 14, 419–431, 2011.
Fernal, D. and Murray, A.: UK TAPAS Action Soil Nutrient Bal-ances Final Report, DEFRA, 2009.
Fraters, D., Kovar, K., Grant, R., Thorling, L., and Reijs, J. W.: De-velopments in monitoring the effectiveness of the EU NitratesDirective Action Programmes, Bilthoven National Institute ofPublic Health and Environment, 2011.
Grant, R., Blicher-Mathiesen, G., Jensen, P.G., Hansen, B., andThorling, L.: Catchment monitoring 2009 – NOVANA, NationalEnvironmental Research Institute (NERI) & Geological Surveyfor Denmark and Greenland (GEUS), NERI report nr. 802, 2010.
Gybels, K., Wustenberghs, H., Claeys, D. Verhaegen, E., Lauwers,L., and Kestemont, B.: Nutrient Balance for Nitrogen, EurostatGrant Agreement 67101.2006.001-2007.093, Working paper no22, Statistics Belgium, 2009.
Hansen, B., Thorling, L., Dalgaard, T., and Erlandsen, M.: Trendreversal of nitrate in Danish groundwater, a reflection of agricul-tural practices and nitrogen surpluses since 1950, Environ. Sci.Technol., 45, 228–234, 2011.
Hansen, B., Dalgaard, T., Thorling, L., Sørensen, B., and Erland-sen, M.: Regional analysis of groundwater nitrate concentrationsand trends in Denmark in regard to agricultural influence, Bio-geosciences, 9, 3277–3286,doi:10.5194/bg-9-3277-2012, 2012.
Hoekstra, N. J., Lalor, S., Richards, K. G., O’Hea, N., Dungait, J.,Schulte, R. P. O., and Schmidt, O.: The fate of slurry N fractionsin herbage and soil during two growing seasons following appli-cation, Plant Soil, 342, 83–96, 2011.
Howden, N. J. K., Burt, T. P. Worrall, F., Whelan, M. J., andBieroza, M.: Nitrate concentrations and fluxes in the riverThames over 140 years (1868–2008): are increases irreversible?,Hydrol. Process., 24, 2657–2662, 2010.
Klimont, Z. and Brink, C.: Modelling of Emissions of Air Pollu-tants and Greenhouse Gases from Agricultural Sources in Eu-rope, IIASA IR 04-048, Laxenburg, Austria, 2004.
Kronvang, B., Andersen, H. E., Børgesen, C., Dalgaard, T., Larsen,S. E., Bøgestrand, J., and Blicher-Mathiasen, G.: Effects of pol-icy measures implemented in Denmark on nitrogen pollutionof the aquatic environment, Environ. Sci. Policy, 11, 144–152,2008.
5160 H. J. M. van Grinsven et al.: Benchmarking the Nitrates Directive in northwestern Europe
Leip, A., Marchi, G., Koeble, R., Kempen, M., Britz, W., andLi, C.: Linking an economic model for European agriculturewith a mechanistic model to estimate nitrogen and carbonlosses from arable soils in Europe, Biogeosciences, 5, 73–94,doi:10.5194/bg-5-73-2008, 2008.
Lenders S., D’hooghe J., and Overloop S.: Bodembalans van deVlaamse landbouw, cijfers voor 2007–2009, Departement Land-bouw en Visserij and Vlaamse Milieumaatschappij, Brussel,2012.
Lerner, D.: Guidelines for estimating urban loads of nitrogen togroundwater, Defra project report NT 1845, 2000.
Lesschen, J. P., Witzke, H. P., Berg, M. van den, Westhoek, H., andOenema, O.: Greenhouse gas emission profiles of the Europeanlivestock sectors, Anim. Feed Sci.Tech., 166–167, 16–28, 2011.
Lord, E. and Anthony, S.: MAGPIE: a modelling framework forevaluating nitrate losses at national and catchment scales, SoilUse Manage., 16, 167–174, 2000.
Mikkelsen, S. A., Iversen, T. M., Jacobsen, B. H., and Kjoer, S.S.: Reducing nutrient losses from intensive livestock operations,in: Livestock in a changing landscape, experiences and regionalperspectives, edited by: Gerber, P., Mooney, H. A., Dijkman, J.,Tarawal, S., and De Haan, C., Island Press, Washington, 140–153, 2010.
Nimmo Smith, R. J., Glegg, G. A., Parkinson, R., and Richards,J. P.: Evaluating the Implementation of the Nitrates Directive inDenmark and England using an Actor-Orientated Approach, Eur.Env., 17, 124–144, 2007.
OECD: OECD and EUROSTAT Gross nitrogen balances handbook,2007.
Oenema, O.: Governmental policies and measures regulating nitro-gen and phosphorus from animal manure in European agricul-ture, J Anim. Sci., 82, 196–206, 2004.
Panten, K., Rogasik, J., Godlinski, F., Funder, U., Greef, J.-M., andSchnug, E.: Gross soil surface nutrient balances: The OECD ap-proach implemented under German conditions, Agr. Forest. Res.,1, 19–28, 2009.
Schroder, J. J., Scholefield, D., Cabral, F., and Hofman, G.: Theeffects of nutrient losses from agriculture on ground and surfacewater quality: the position of science in developing indicators forregulation, Environ. Sci. Policy, 7, 15–23, 2004.
Sutton, M. A., Oenema, O., Erisman, J. W., Leip, A., Grinsven, H.van, and Winiwarter, W.: Too much of a good thing, Nature, 472,159–161, 2011.
ten Berge, H. and van Dijk, W.: Management of nitrogen in-puts on farm within the EU regulatory framework, Interna-tional Fertilizer Society – Publication Proceedings Proceed-ing 654, available at:http://www.fertiliser-society.org/Content/Publications.asp, 2009.
Tiktak, A., Boesten, J. J. T. I., van der Linden, A. M. A., andVanclooster, M.: Mapping groundwater vulnerability to pesticideleaching with a process-based metamodel of EuroPEARL, J. En-viron. Qual., 35, 1213–1226, 2006.
van Dijk, W. and ten Berge, H.: Agricultural nitrogen use in selectedEU countries: a comparison of N recommendation, and restric-tion in response to the EU Nitrates Directive, Wageningen PlantResearch International B.V., 2009.
van Grinsven, H., Eerdt, M., van, Willems, J., Hubeek, F., andMulleneers, E.: Evaluation of the Dutch manure and fertilizerpolicy, 1998–2002, in: Evaluating Agri-Environmental Policies:Design, Practice and Results, 398-410, ISBN 92-6401010-6,OECD, 2005.
van Grinsven, H., Rabl, A., and de Kok, T. M.: Estimation of in-cidence and social cost of colon cancer due to nitrate in drink-ing water in the EU: a tentative cost-benefit assessment cost–benefit assessment, Environ. Health, 9,doi:10.1186/1476-069X-9-58, 2010.
Velthof, G. L., Oudendag, D., Witzke, H. P., Asman, W. A. H.,Klimont, Z., and Oenema, O.: Integrated assessment of nitrogenlosses from agriculture in EU-27 using MITERRA, J. Environ.Qual., 38, 402–417, 2009.
Velthof, G. L., Lesschen, J. P., Webb, J., Pietrzak, S., Mi-atkowski, Z., Kros, J., Pinto, M., and Oenema, O.: Theimpact of the Nitrates Directive on gaseous N emis-sions Effects of measures in nitrates action programme ongaseous N emissions, Contract ENV.B.1/ETU/2010/0009http://ec.europa.eu/environment/water/water-nitrates/pdf/Final report impactNitratesDirective def.pdf, 2012.
Wang, L.,Stuart, M. E., Bloomfield, J. P., Butcher, A. S., Gooddy, D.C., McKenzie, A., Lewis, M. A., and Williams, A. T.: Predictionof the arrival of peak nitrate concentrations at the water table atthe regional scale in Great Britain, Hydrol. Process., 26, 226–239, 2012.
Webb, J., Sørensen, P., Velthof, G., Amon, B., Pinto, M., Rodhe, L.,Salomon, E., Hutchings, N., Burczyk, P., Menzi, H., and Reid, J.L.: Assessment of the variation of manure N efficiency through-out Europe and an appraisal of means to increase manure N effi-ciency, Adv. Agron., accepted, 2013.
Wolter, R., Osterburg, B., and Tetzlaff, B.: Developments in moni-toring the effectiveness of the EU Nitrates Directive Action Pro-grammes: Approach by Germany, in: Developments in monitor-ing the effectiveness of the EU Nitrates Directive Action Pro-grammes, edited by: Fraters, B., Kovar, K., Grant, R., Thorling,L., and Reijs, J. W., Bilthoven, National Institute of Public Healthand Environment, 211–256, 2011.
Zwart, M. H., Hooijboer, A. E. J., Fraters, B., Kotte, M., Duin, R.N. M., Daatselaar, C. H. G., Olsthoorn, C. S. M., and Bosma, J.N.: Agricultural practice and water quality in The Netherlands inthe 1992–2006 period, National Institute for Public Health andthe Environment, Bilthoven, 2008.