25
Management Reporting 2015 Let’s Get Started… M 1
| Date post: | 25-Dec-2015 |
| Category: |
Documents |
| Upload: | barnaby-shaw |
| View: | 217 times |
| Download: | 1 times |

1
Management Reporting 2015Let’s Get Started…
M
2
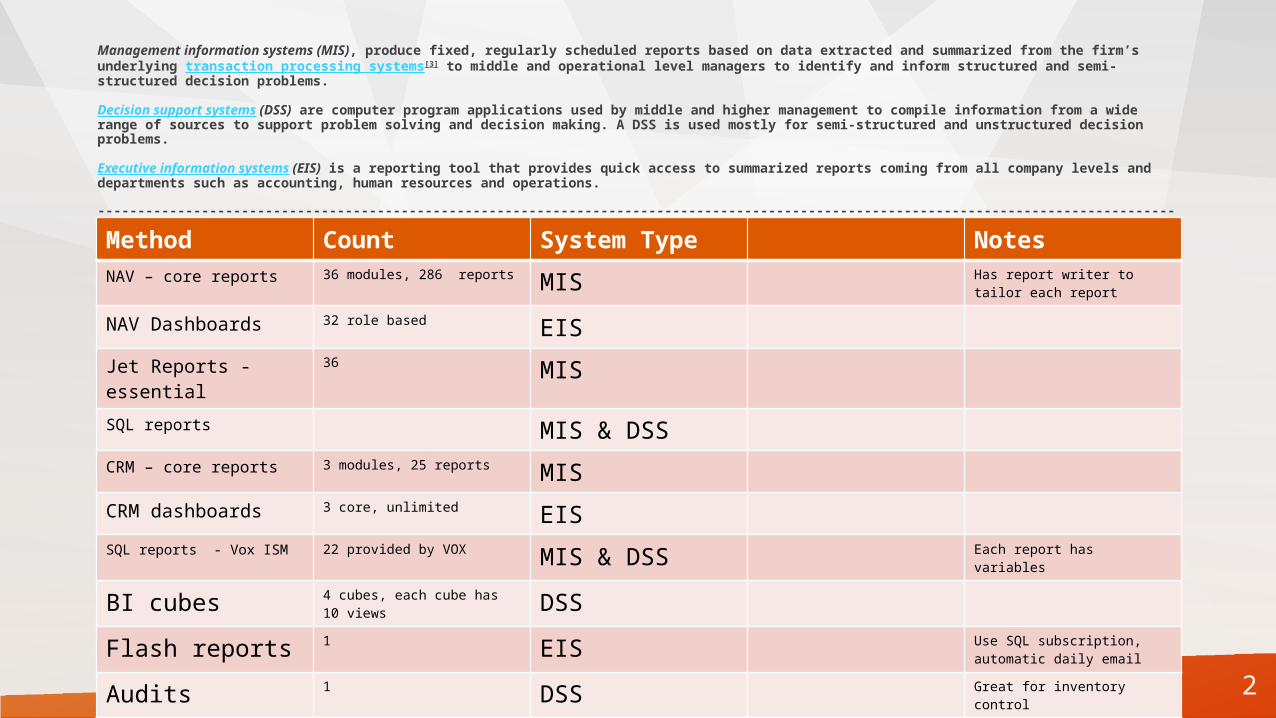
Management information systems (MIS), produce fixed, regularly scheduled reports based on data extracted and summarized from the firm’s underlying transaction processing systems[3] to middle and operational level managers to identify and inform structured and semi-structured decision problems.
Decision support systems (DSS) are computer program applications used by middle and higher management to compile information from a wide range of sources to support problem solving and decision making. A DSS is used mostly for semi-structured and unstructured decision problems.
Executive information systems (EIS) is a reporting tool that provides quick access to summarized reports coming from all company levels and departments such as accounting, human resources and operations.
----------------------------------------------------------------------------------------------------------------------------------------------------------------------------------------------
Hierarchy of reporting – methods of delivery (reports, dashboards & KPI’s, BI Excel cubes) = 446 options – we need to pick a top 10 to get started!Method Count System Type NotesNAV – core reports 36 modules, 286 reports MIS Has report writer to tailor
each report
NAV Dashboards 32 role based EISJet Reports - essential
36 MIS
SQL reports MIS & DSSCRM – core reports 3 modules, 25 reports MISCRM dashboards 3 core, unlimited EISSQL reports - Vox ISM 22 provided by VOX MIS & DSS Each report has variables
BI cubes 4 cubes, each cube has 10 views DSS
Flash reports 1 EIS Use SQL subscription, automatic daily email
Audits 1 DSS Great for inventory control
3
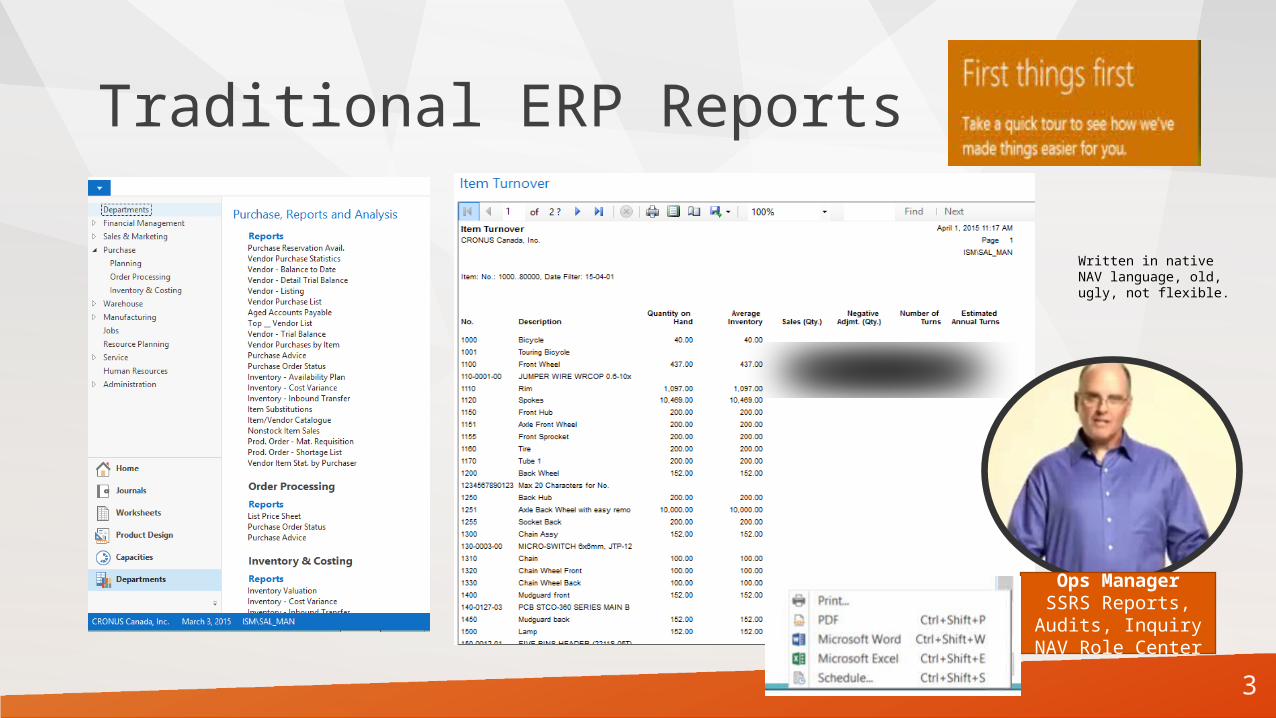
Traditional ERP Reports
Ops ManagerSSRS Reports, Audits, Inquiry
NAV Role Center
Written in native NAV language, old, ugly, not flexible.
4
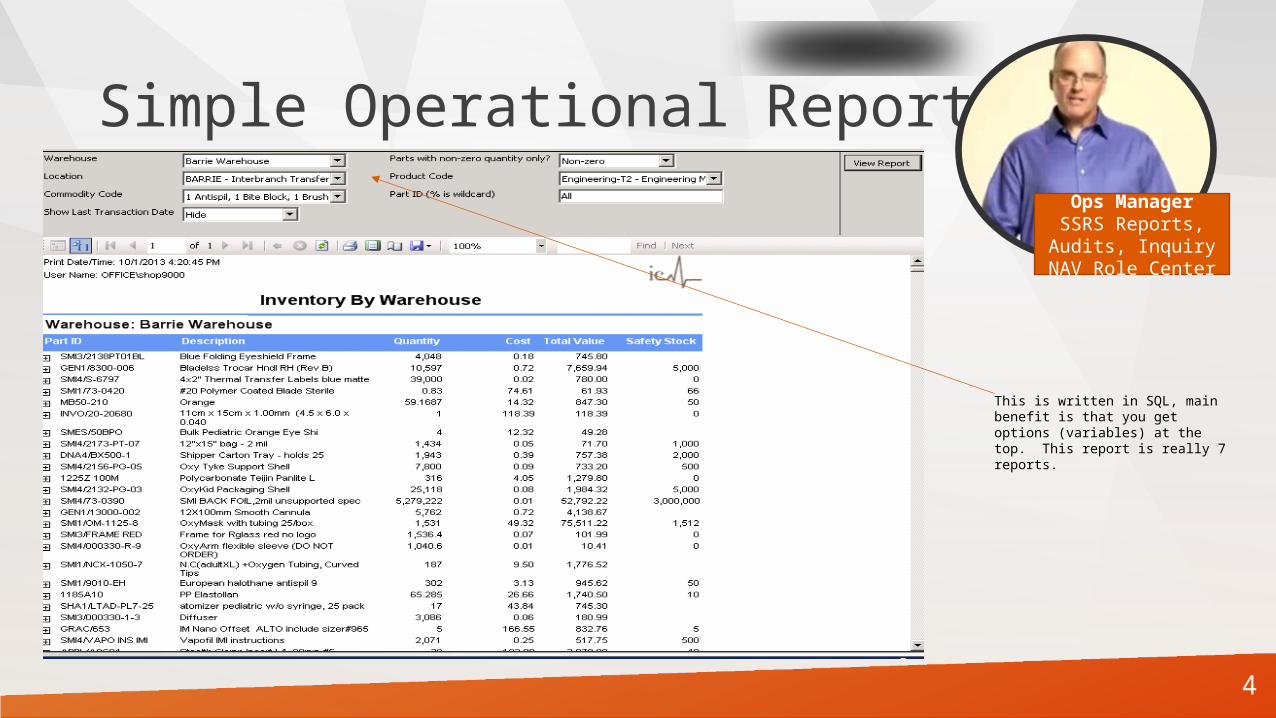
Simple Operational ReportOps ManagerSSRS Reports, Audits, Inquiry
NAV Role Center
This is written in SQL, main benefit is that you get options (variables) at the top. This report is really 7 reports.
5
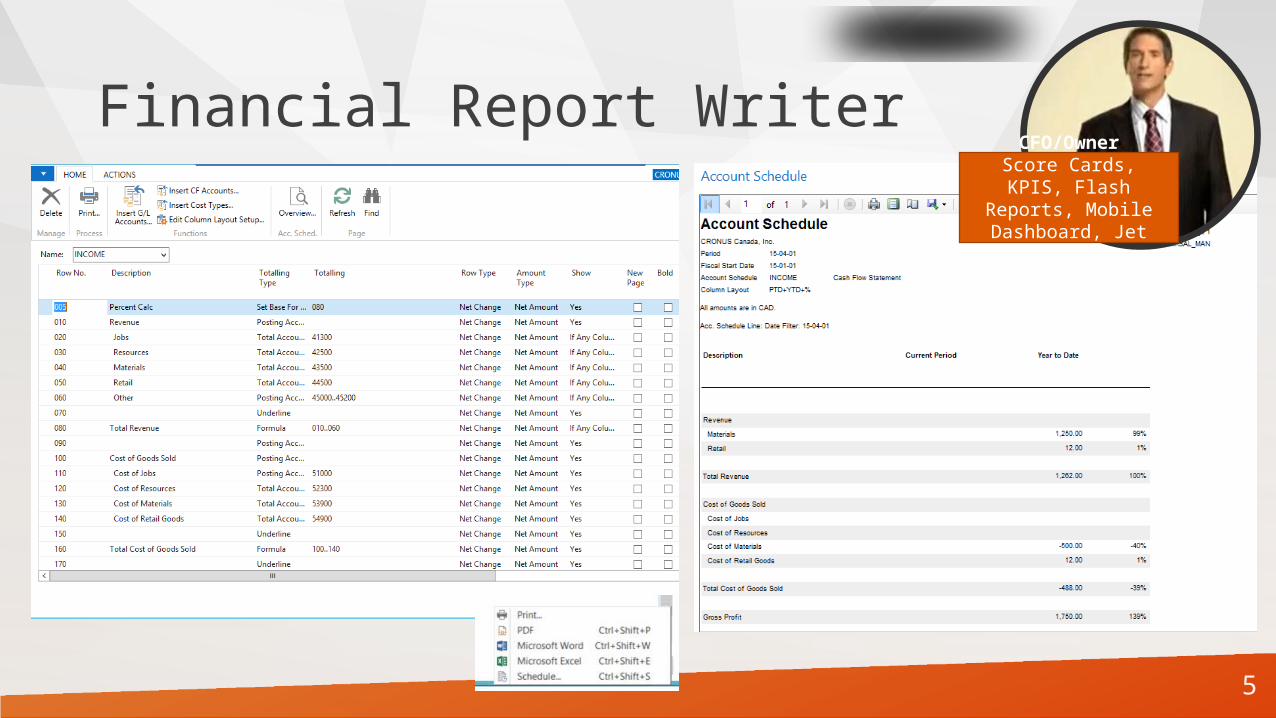
Financial Report WriterCFO/Owner
Score Cards, KPIS, Flash Reports, Mobile
Dashboard, Jet Reports
6
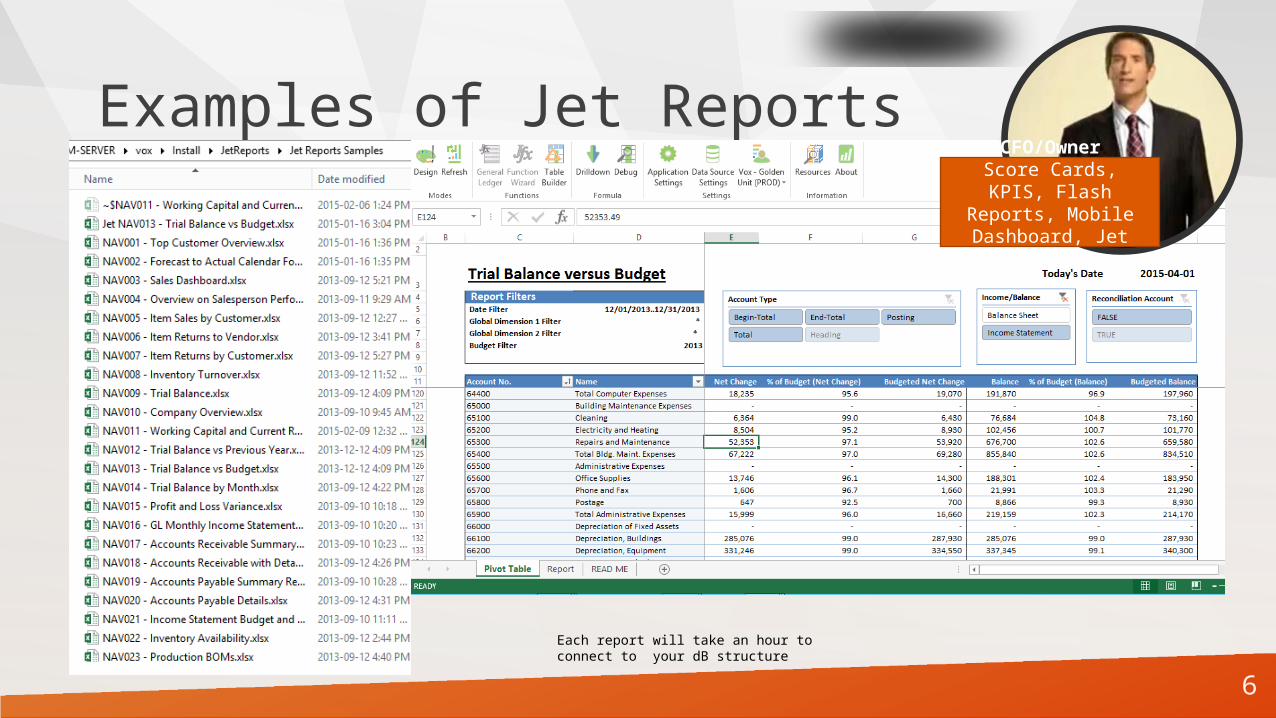
Examples of Jet ReportsCFO/Owner
Score Cards, KPIS, Flash Reports, Mobile
Dashboard, Jet Reports
Each report will take an hour to connect to your dB structure
7
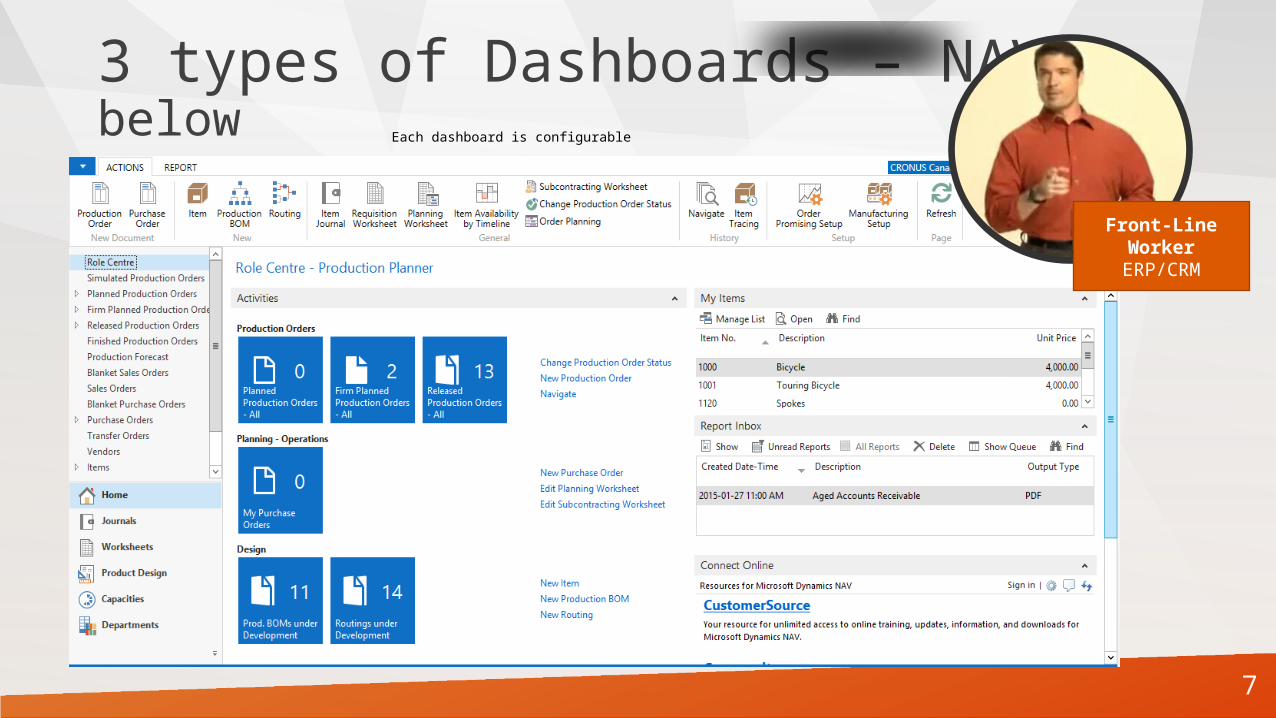
3 types of Dashboards – NAV below
Front-Line WorkerERP/CRM
Each dashboard is configurable
8

9
10
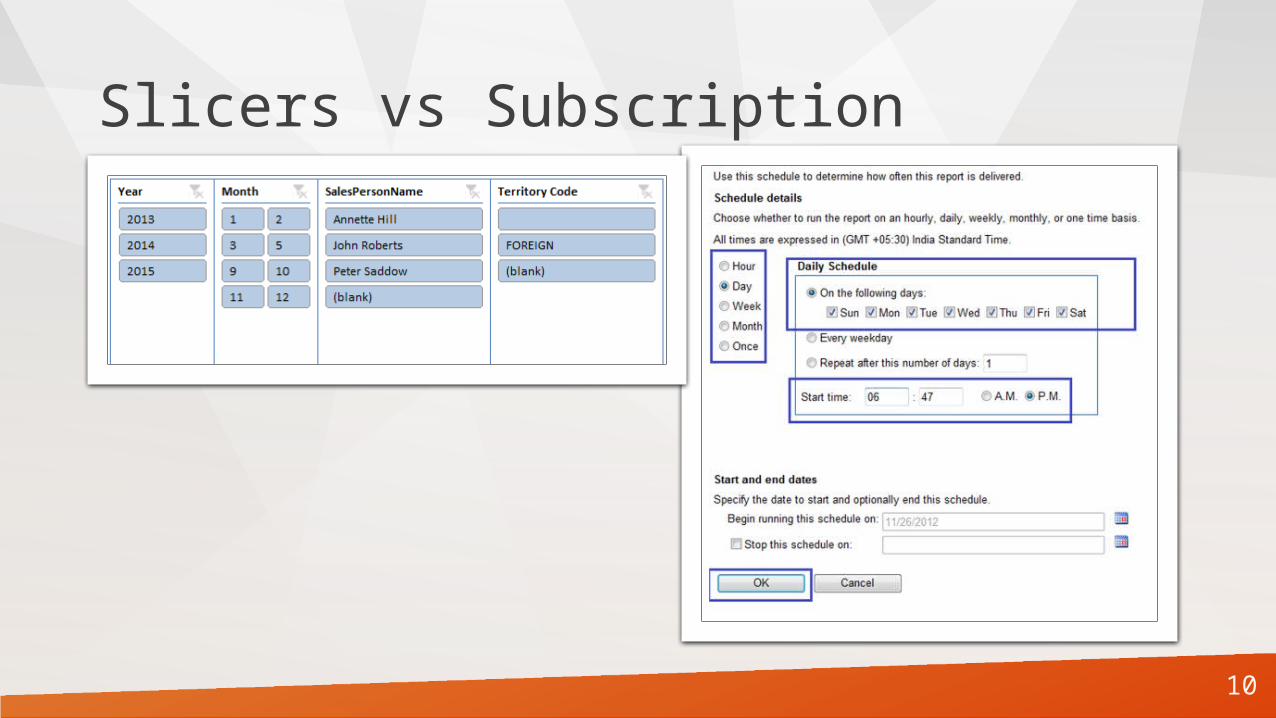
Slicers vs Subscription
11
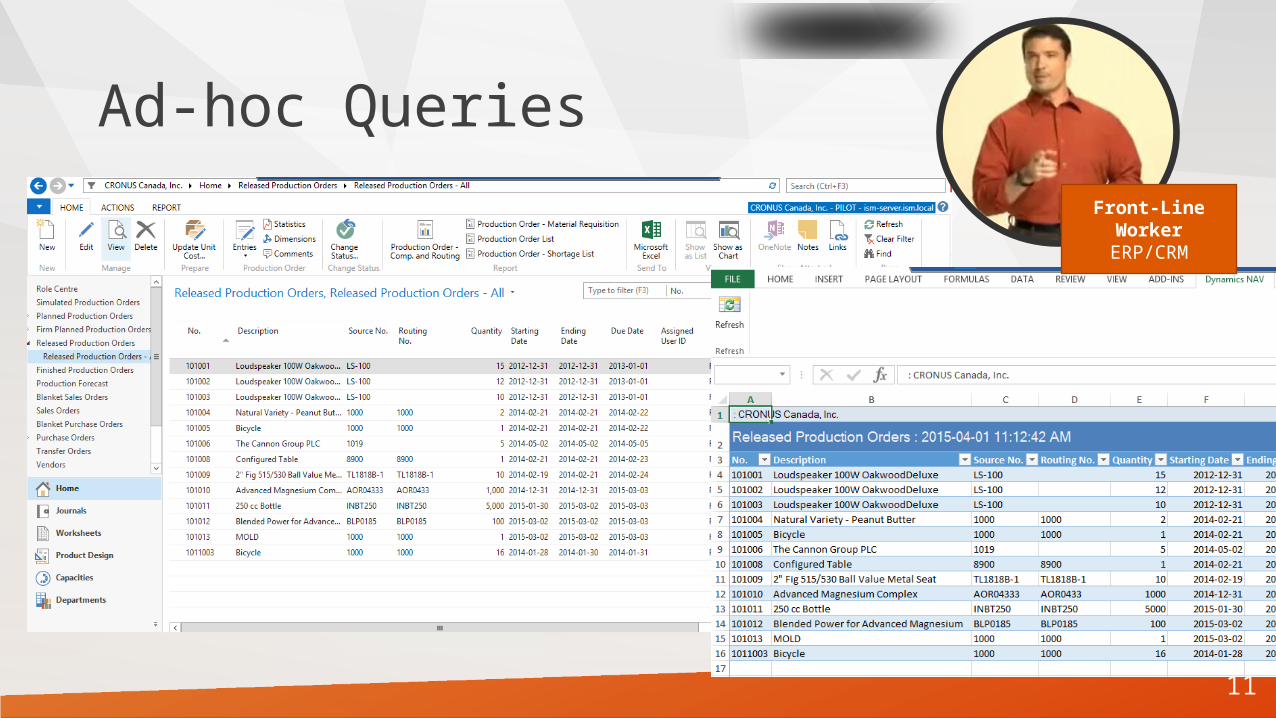
Ad-hoc Queries
Front-Line WorkerERP/CRM
12
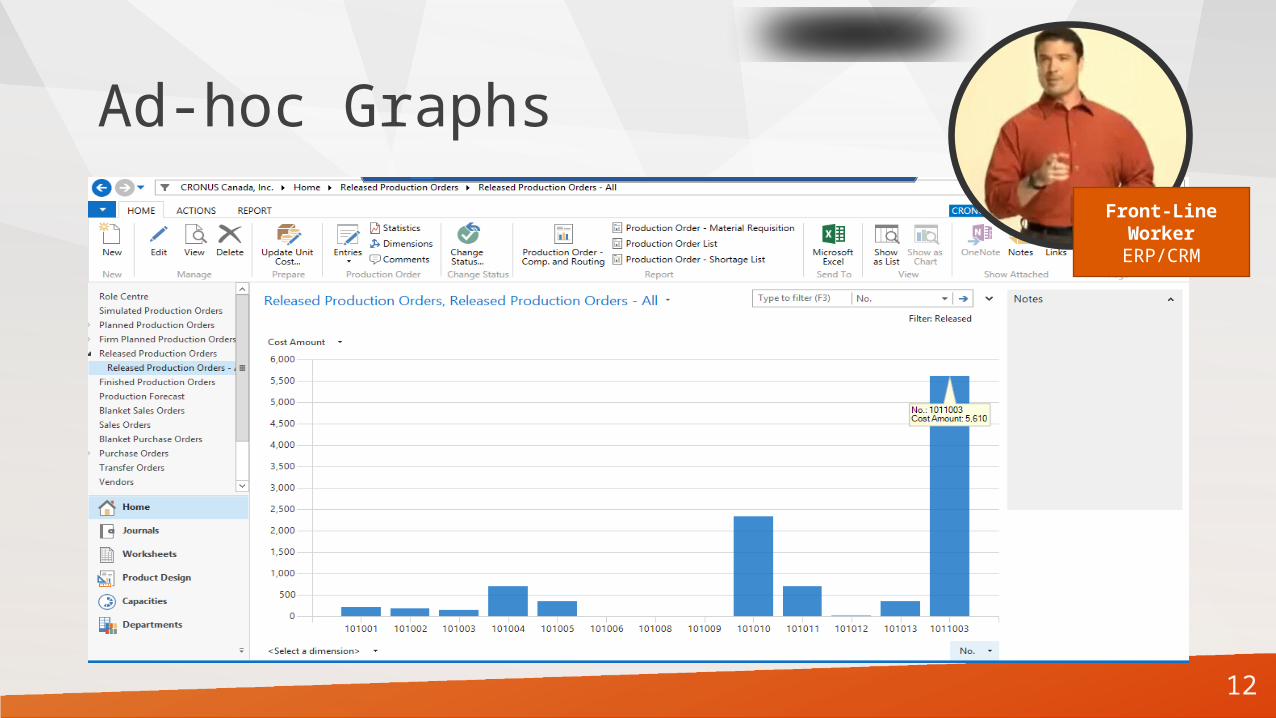
Ad-hoc Graphs
Front-Line WorkerERP/CRM
13
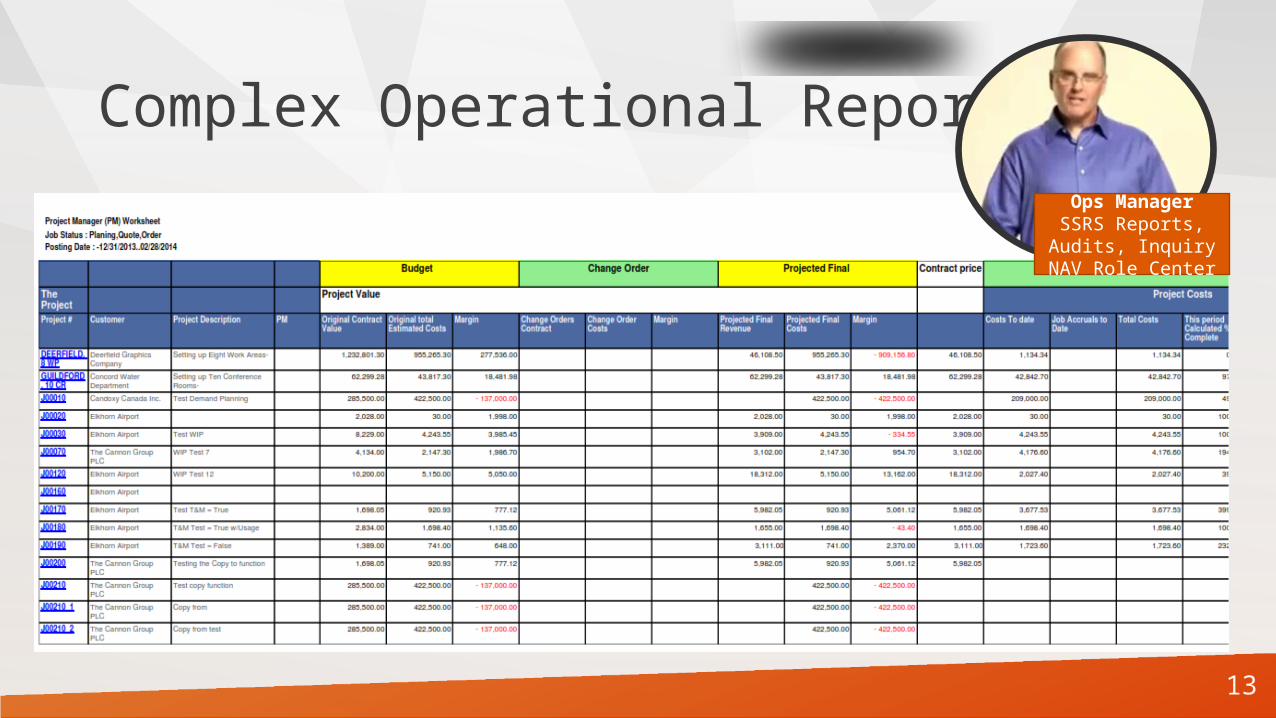
Complex Operational ReportOps ManagerSSRS Reports, Audits, Inquiry
NAV Role Center

14
Example of AuditOps ManagerSSRS Reports, Audits, Inquiry
NAV Role Center
15
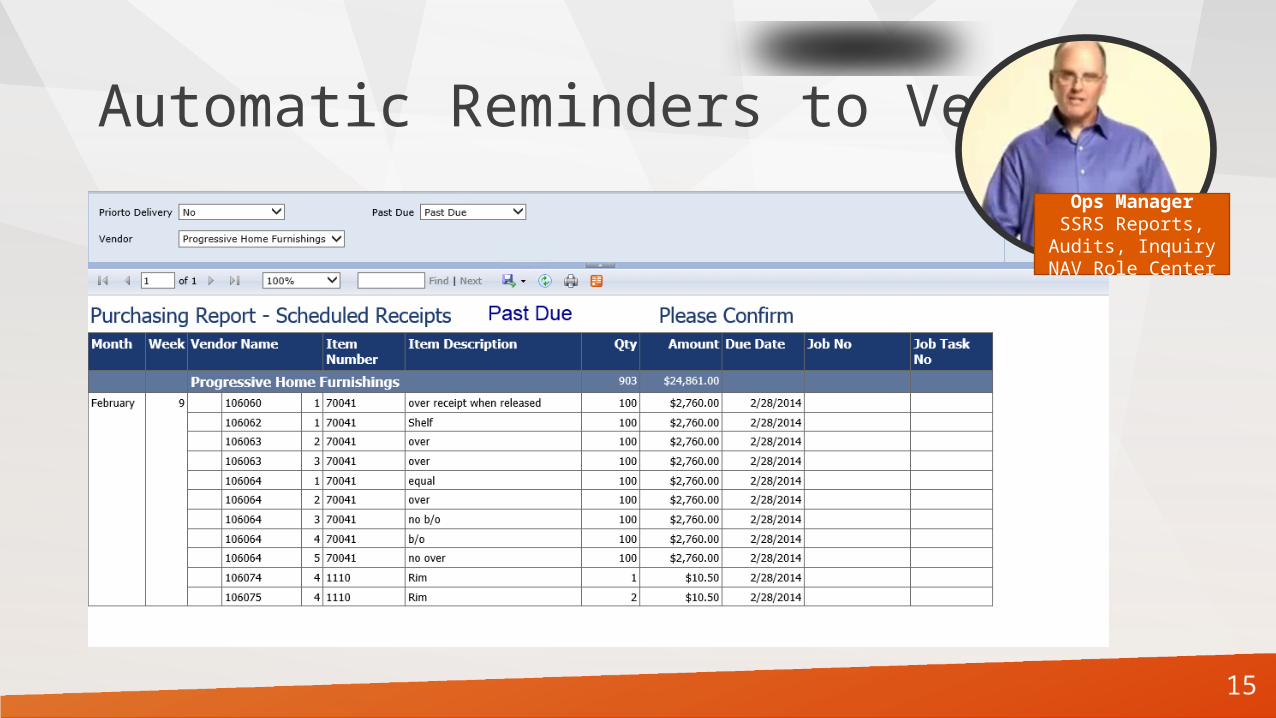
Automatic Reminders to VendorsOps ManagerSSRS Reports, Audits, Inquiry
NAV Role Center
16
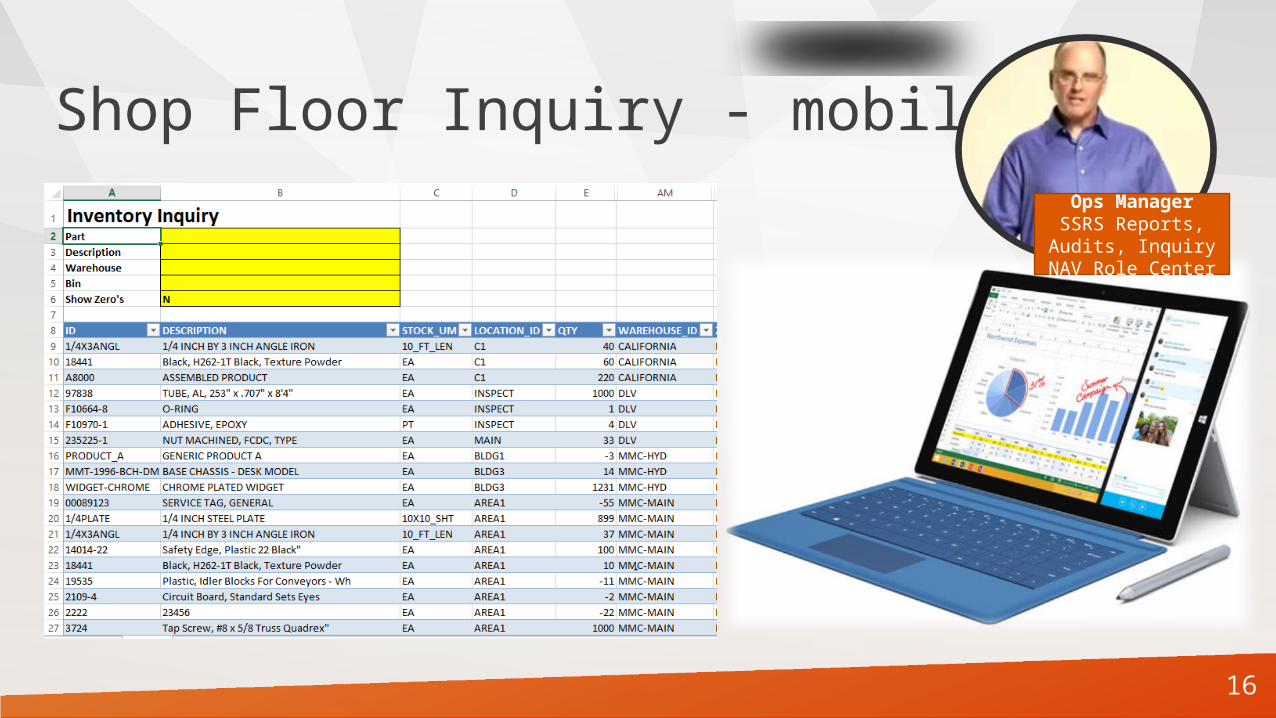
Shop Floor Inquiry - mobileOps ManagerSSRS Reports, Audits, Inquiry
NAV Role Center
17
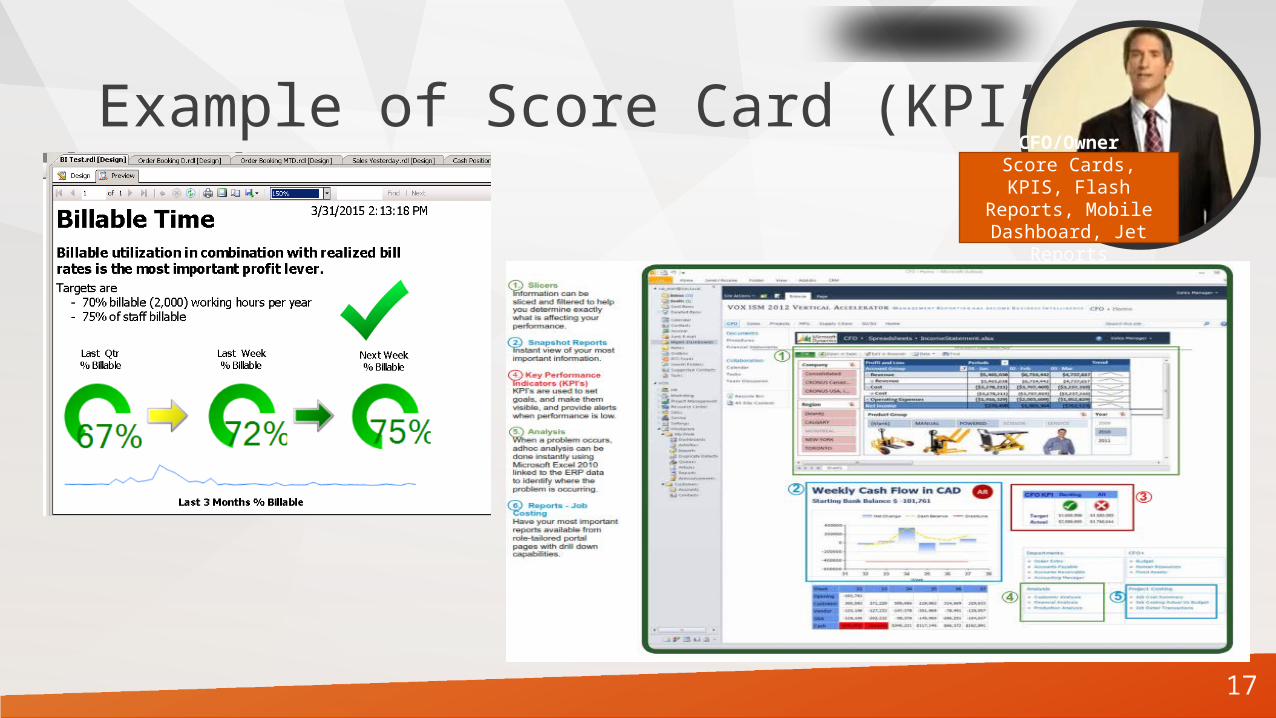
Example of Score Card (KPI’s)CFO/Owner
Score Cards, KPIS, Flash Reports, Mobile
Dashboard, Jet Reports
18
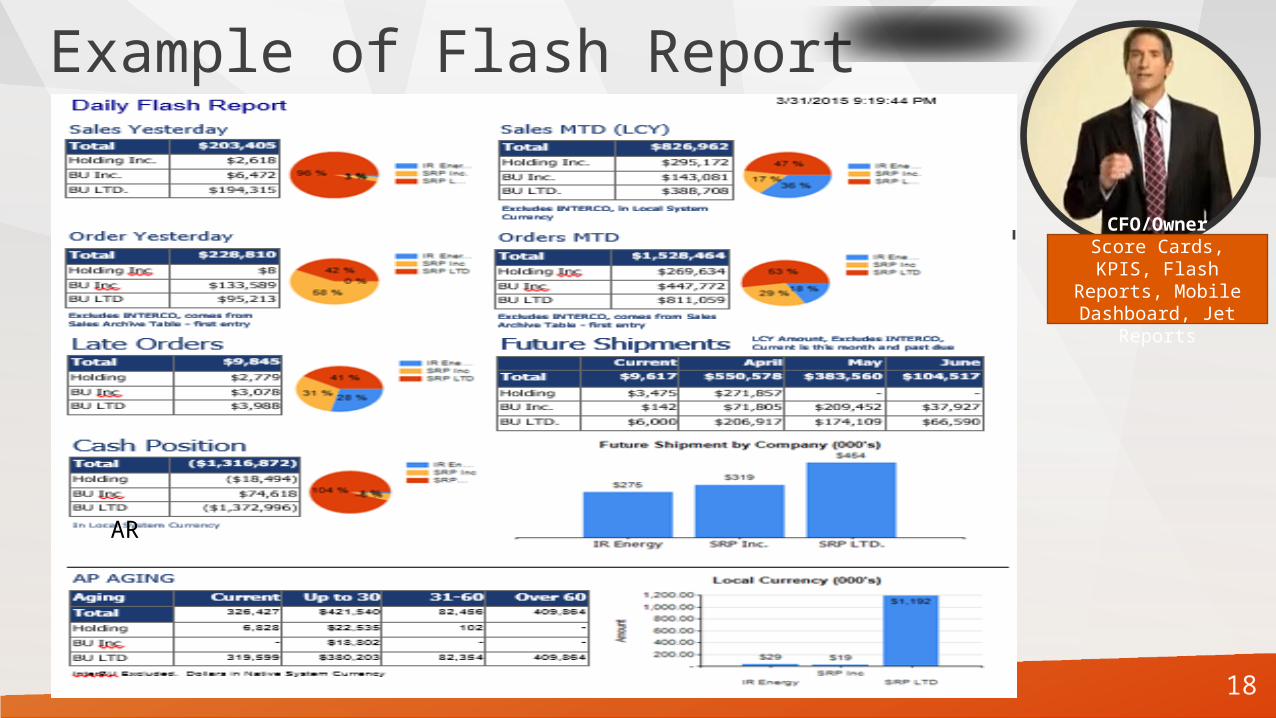
Example of Flash Report
CFO/OwnerScore Cards, KPIS,
Flash Reports, Mobile Dashboard, Jet
Reports
AR
19
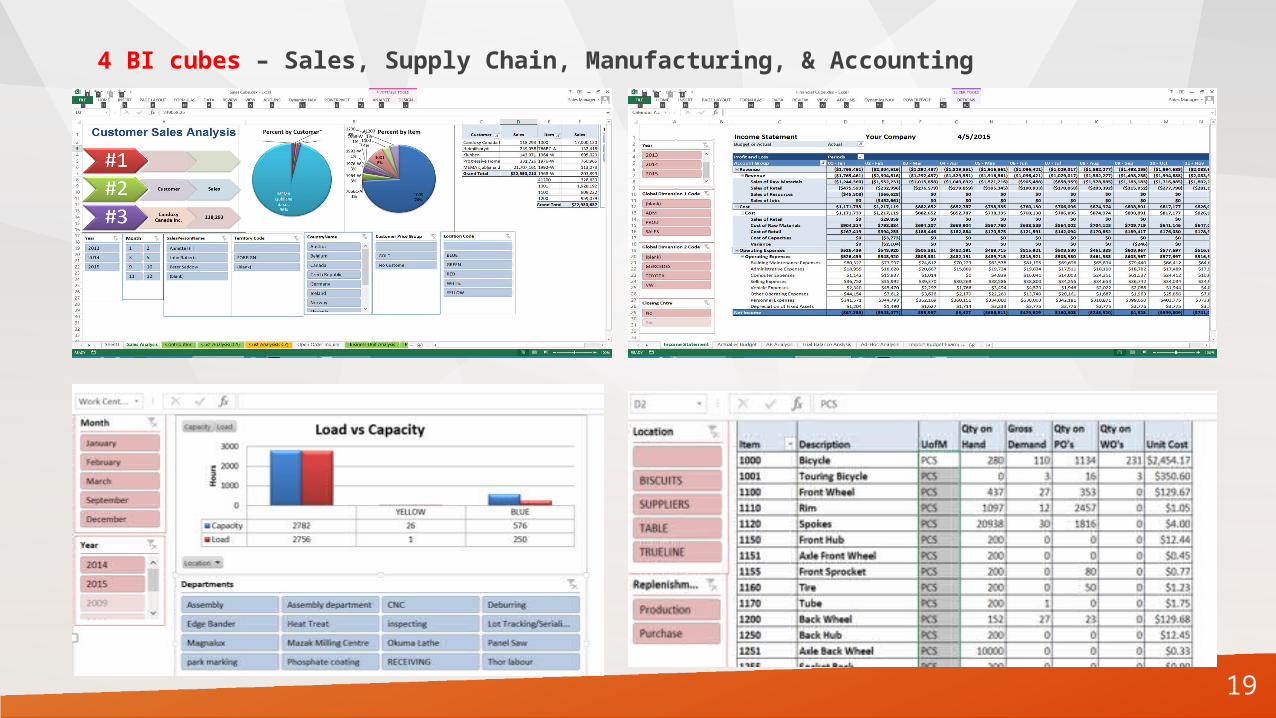
4 BI cubes – Sales, Supply Chain, Manufacturing, & Accounting
20
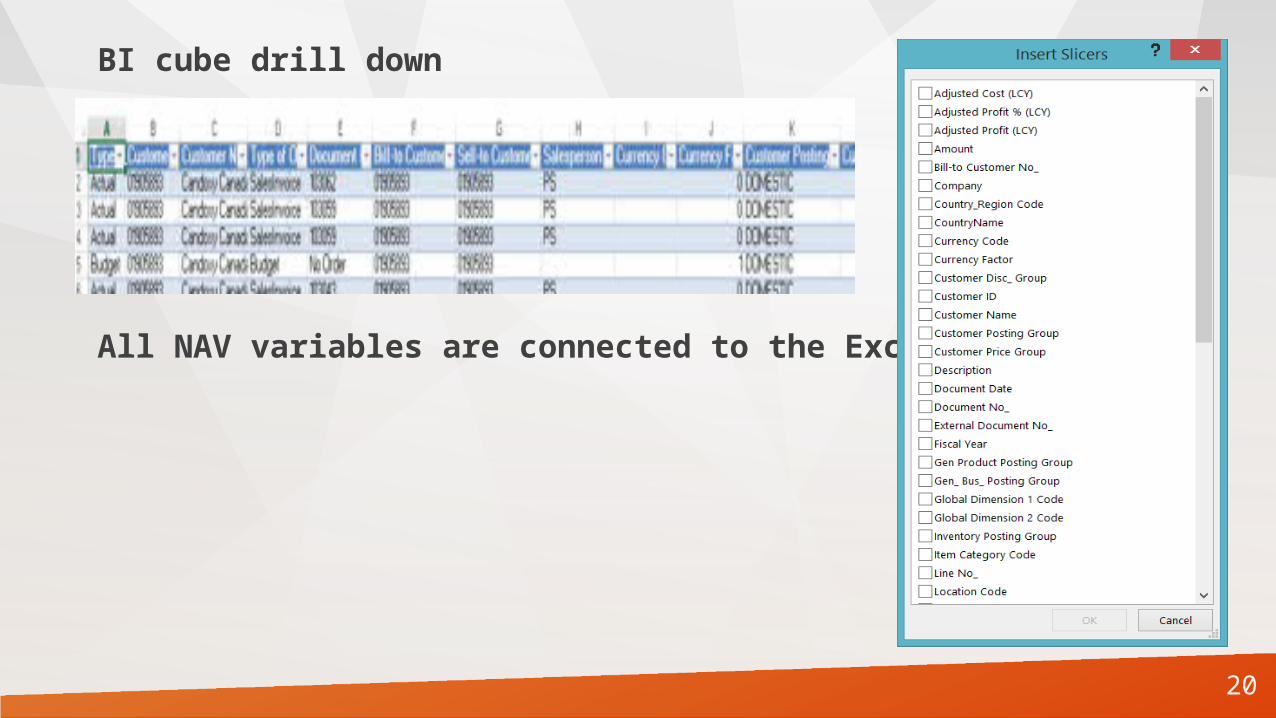
BI cube drill down
All NAV variables are connected to the Excel cube
21
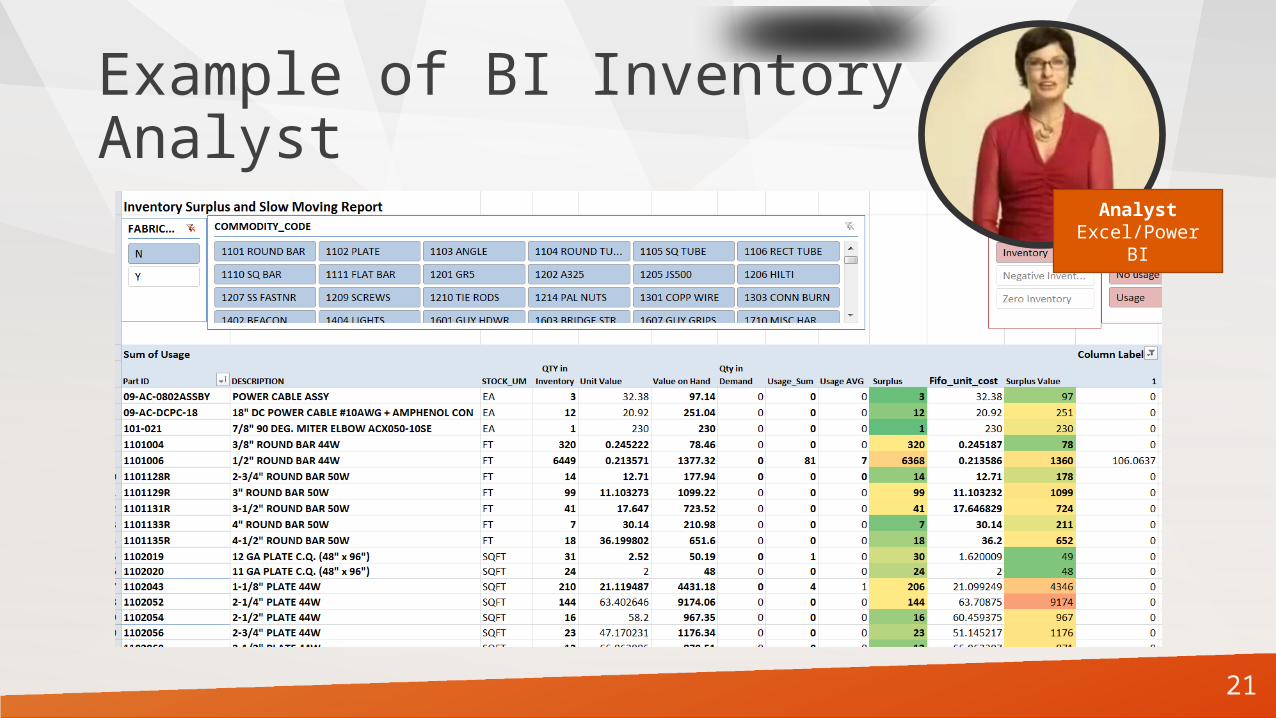
Example of BI Inventory Analyst
Analyst Excel/Power BI
22
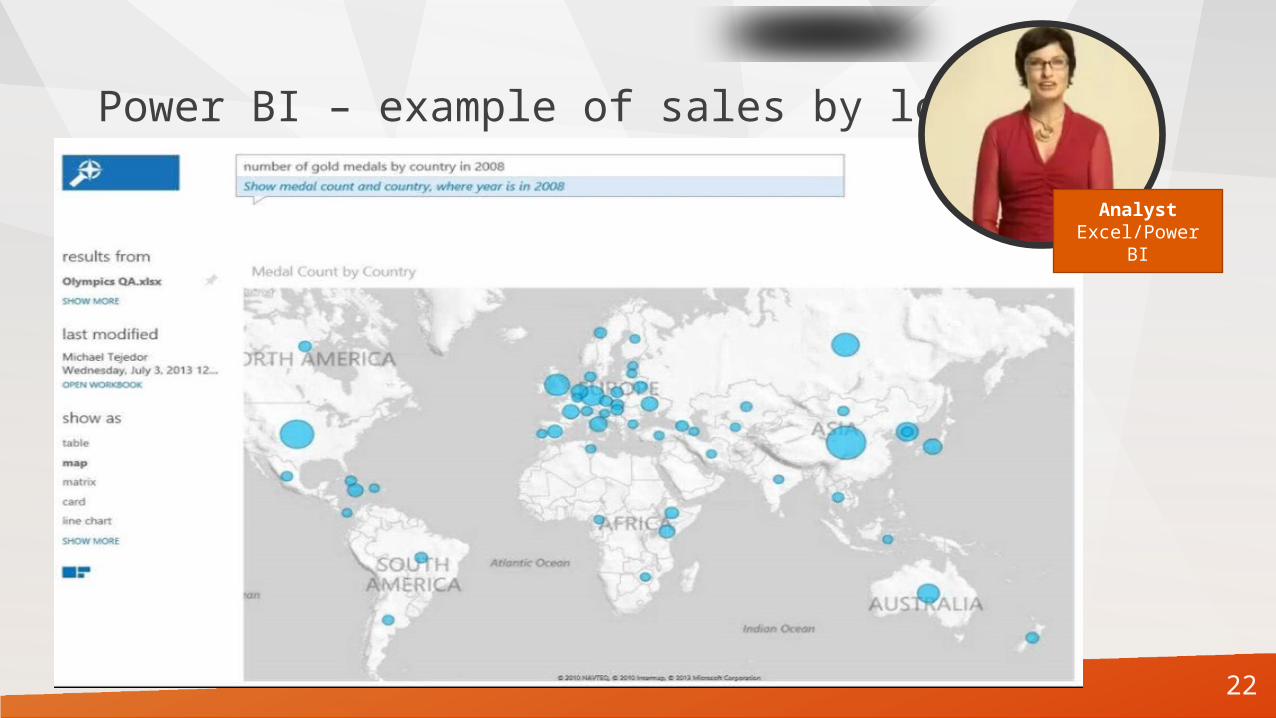
Power BI – example of sales by location
Analyst Excel/Power BI
23
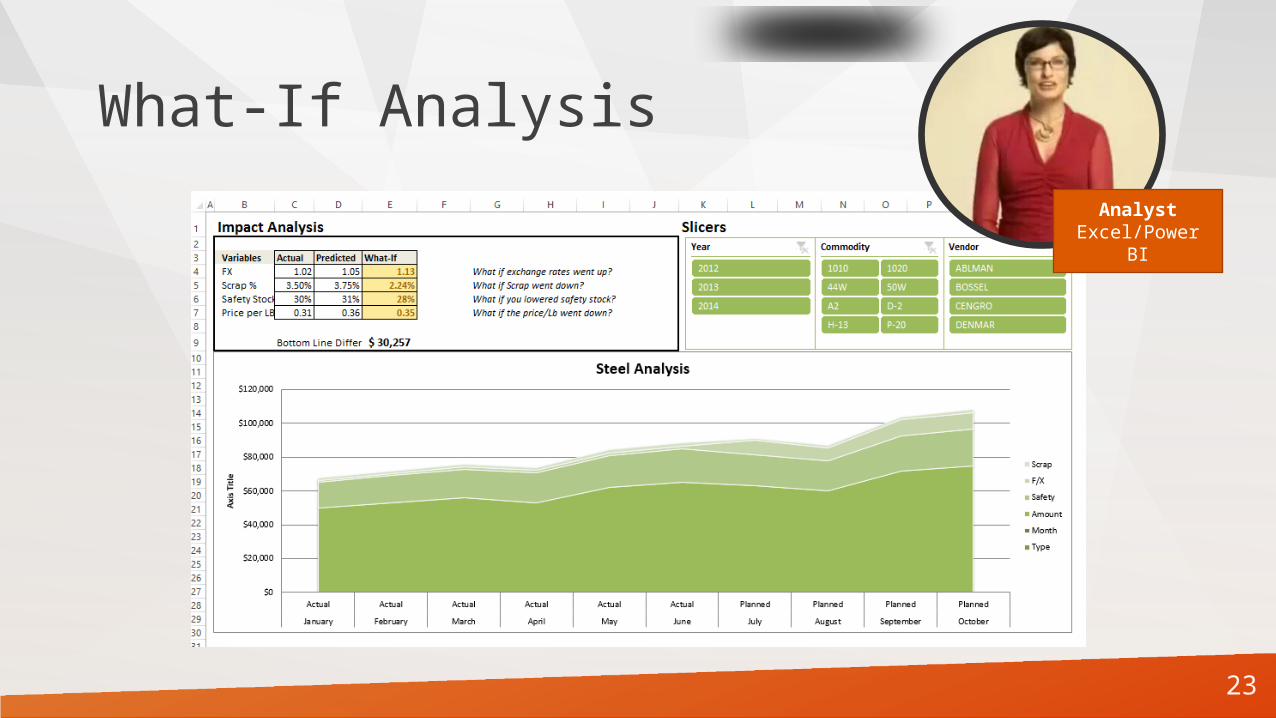
What-If Analysis
Analyst Excel/Power BI
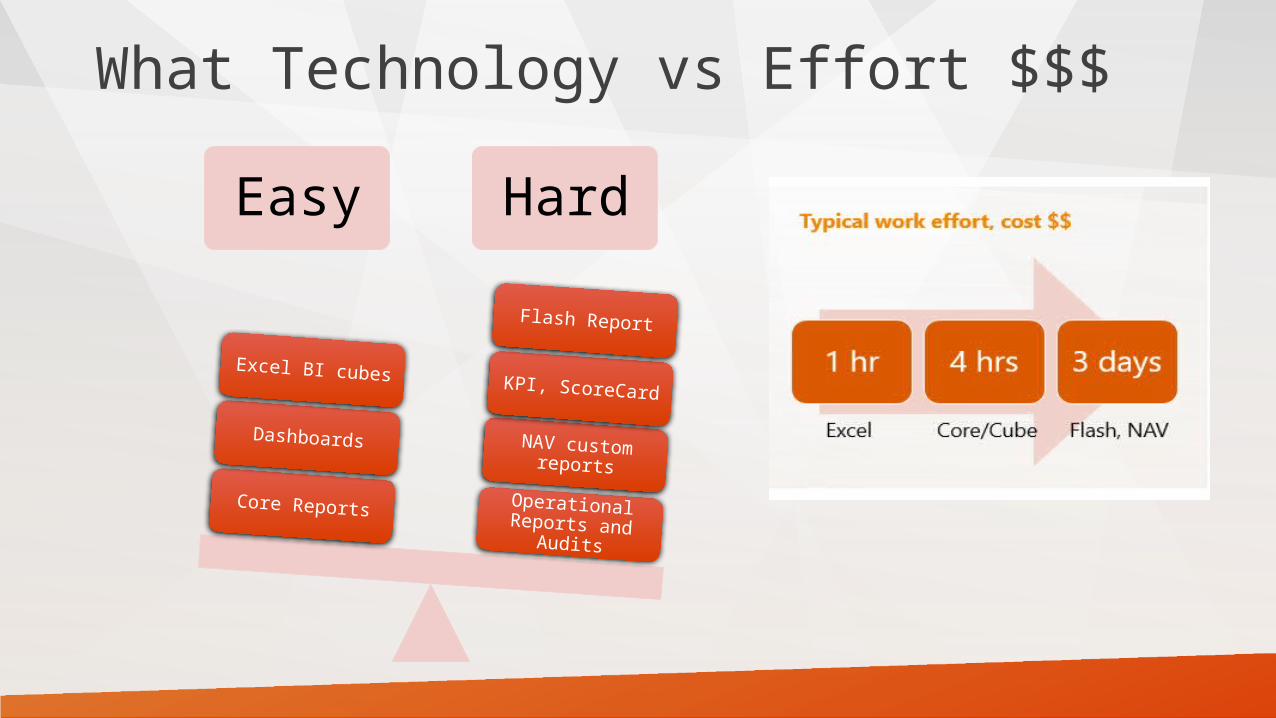
What Technology vs Effort $$$
Easy Hard
Operational Reports and
Audits
NAV custom reports
KPI, ScoreCard
Flash Report
Core Reports
Dashboards
Excel BI cubes
Typical work effort, cost $$

25
“Best Practice Recommendations” – what I did, Jim’s top 10 to get started, effort =
Reports Method Note/report name
Income Jet Reports 4 Optionsa) 80’s style Jet reportb) GL Income Statementc) Profit and Loss Varianced) Company Overview
Balance Sheet Jet Reports e) In company Overview
Cash NAV module
Aged Receivables SSRS SSRS + CRM AR Dashboard
Sales from CRM CRM Dashboard Jim’s Sales Dashboard
Operations NAV Dashboard Small Business Role Center
BI cube Sales BI Cube
Flash report SSRS Report


