117
| Date post: | 28-Jul-2016 |
| Category: |
Documents |
| Upload: | c-madhavaiah |
| View: | 36 times |
| Download: | 1 times |

Management Trends Vol. 10, No. 1-2 June-Dece - 2013
CONTENTS
MANAGEMENT TRENDSAn International Bi-Annual Referred Journal of Department of
Business ManagementVol. 10, No. 1-2 June-December - 2013
MANAGEMENT TRENDS
Management Dynamics and Bhagwad Gita 1Nageshwar Rao & Ram Pravesh Rai
A Study of Impact of Strategic CSR as an Integral Tool ForExpanding Rural Markets Through : A Case Study of Hindustan Uniliver Ltd. 19Jayrajsinh D. Jadeja & Kedar Shukla
IFRS and Related Implications 27Daksha Pratapsinh Chauhan
Exploring the Role of Lean Accounting : A Step Ahead from Traditional Costing 34Vineeta Arora & G. Soral
Disclosure Pattern of Valuation Principles of Raw MaterialInventory in Indian manufacturing Industry (Special reference to AS-2) 44Shurveer S. Bhanawat & Abhay Jaroli
Influence of Effectiveness of Leadership on Satisfaction ofLeadership in Public and Private Insurance Sectors 56Dasari Pandurangarao, Gella Sireesha & Devarapalli Rajasekhar
Impact of Brand Association on Soft Drinks Purchase Decision onIndian Consumers 69Syed Irfan Shafi & C. Madhavaiah
Relationship Between Working Capital Management and Profitability :A Case Study 79Shailesh N. Ransariya
Role of Panchayati Raj Institutions in the Rural Development Programme 88Brijendra Pradhan & Amit Singh Rathore
Impact of FII on Indian Stock Market 96Himani Gupta
Last Day of the Trading Period Effect on Volatility in Pricesof Stocks of Bombay Stock Exchange Limited 104Venkataramanaih. M
Employee Engagement - A Key to Organizational Success 111Viralkumar Shilu
Management Trends Vol. 10, No. 1-2 June-Dece - 2013
Bhagavad-Gita was written thousands of years ago. It enlightens us on all thefacets of management dynamics leading us towards a harmonious and blissful state ofaffairs in place of the conflict, tensions, poor productivity, and absence of motivation andso on, common in most of Indian enterprises today. In Gita, the process of the ascent ofman from a state of utter dejection, sorrow and total breakdown and hopelessnessto a state of perfect understanding, clarity, renewed strength and triumph is revealed.What makes the Gita a practical psychology of transformation is that it offers us the toolsto connect with our deepest intangible essence, and we must learn to participate in thebattle of life with right knowledge. "Freed from attachment, fear and anger, absorbed inme and taking refuge in me, purified by the penance of knowledge, many have attainedunion with My Being." (Gita 4:10). Effective management is not limited in its applicationonly to business or industrial enterprises but to all organisations where the aim is to reacha given goal through a manager with the help of available physical and human resource.The manager's role can be briefly summed up as:
l Developing vision and enabling & enacting to realise such vision
l Establishing the institutional excellence and building an innovative organisation
Management Dynamics and Bhagwad Gita 1
Management Dynamics and Bhagwad Gita
Nageshwar Rao*
Ram Pravesh Rai**
* Pro-Vice Chancellor, IGNOU, New Delhi** Assistant Professor, School of Journalism Mass Communication and New Media, Central
University of Himachal Pradesh, Dharamshala-, H.P.
Abtract : Bhagavad-Gita was written thousands of yearsago. It enlightens us on all the facets of managementdynamics leading us towards a harmonious and blissful stateof affairs in place of the conflict, tensions, poor productivity,and absence of motivation and so on, common in most ofIndian enterprises today. In Gita, the process of the ascentof man from a state of utter dejection, sorrow and totalbreakdown and hopelessness to a state of perfectunderstanding, clarity, renewed strength and triumph isrevealed. This paper aims to analyse Bhagwat Gita in contextof various facets of management dynamics. More specifically,the paper analyses the issues relating to visionary approach,innovation, mind power, self-management, value orientedwork culture, motivation, leadership etc.
Keywords: Management Dynamics, Bhagwad Gita, India

Management Trends Vol. 10, No. 1-2 June-Dece - 2013
l Developing human resources
l Team building and teamwork
l Delegation, motivation and communicationl Cultivating the art of leadership
l Reviewing performance and taking corrective steps
This paper aims to analyse Bhagwat Gita in context of various facets of managementdynamics. More specifically, the paper analyses the issues relating to visionaryapproach, innovation, mind power, self-management, value oriented work culture,motivation, leadership etc.
Visionary Approach
Vision is a tremendously powerful force in any walk of life, but in business it isessential. A vision is a target towards which leaders aim their energy and resources. Theconstant presence of the vision keeps a leader moving despite various forces ofresistance: fear of failure; emotional hardships, such as negative responses fromsuperiors, peers, or employees; or 'real' hardships, such as practical difficulties orproblems in the industry. Equally important, a vision, when shared by employees, cankeep an entire company moving forward in the face of difficulties, enabling and inspiringleaders and employees alike. Moving toward the same goal, individuals work together ratherthan as disconnected people brought together because of having been hired coincidentallyby the same organization. The Gita gives a 'vision of total life' which is deeper and broaderthan the western concept of vision. Here, Lord Krishna counsels Arjuna on developing abroader 'vision of life' for attaining success and happiness. "The quality of our actions andreactions depend upon our 'vision of life' as envisaged in the Gita. A narrow vision is divisive,a broad vision is expansive, and the supreme vision is all inclusive.
'The Vision of Life' is extensively explained by Lord in Gita. As explained inchapter 18th, the three temperaments (gunas)- Satva, Rajas and Tamas fluctuate and mixin different proportions in our bosom to create differences among individuals in term ofknowledge, karma or works, buddhi or understanding, dhriti or fortitude, and happiness.Now a days ,the vision about Happiness is gaining vital role both for employees andmanagement. Lord enlightens Arjuna with the three types of happiness (good, passionateand dull i.e. sattvic, rajasic and tamasic) in verses. The 'sattvic happiness' is arisingout of the inner self- control and consequent self- perfections which, though painful andarduous in the beginning, is enduring in the long run, in contrast with the fleeting joysprovided by sense tickling. To discuss the different job perspective for the same job andhow the perspective affects the assignment, we may look at a small story. Three stone-cutters were engaged in erecting a temple. The contractor asked them what they weredoing. The response of the three workers to this innocent-looking question is illuminating:
'I am a poor man. I have to maintain my family. I am making a living here,' said thefirst stone-cutter with a dejected face.
2 Nageshwar Rao & Ram Pravesh Rai

Management Trends Vol. 10, No. 1-2 June-Dece - 2013
'Well, I work because I want to show that I am the best stone-cutter in the country,'said the second one with a sense of pride.
'Oh, I want to build the most beautiful temple in the country,' said the third onewith a visionary gleam.
Their jobs were identical but their perspectives were different. What Gita tells usis to develop the visionary perspective in the work we do.The innovation
Today, organizations are witnessing an unsurpassed change in an increasinglyglobal, dynamic and competitive marketplace. Their aim is similar to one another that areachieving sustainable competitive advantage and long-term success over competitors.But the road to reach out there is severe and more than easy to say. In order to be competitivein this dynamic business environment, organizations have to be agile, embrace creativityand innovative. These latter two, creativity and innovation, are the "motto" for everybusiness enterprise today. These are the new management mantras that, as Peter Druckerindicated are critical to growth in a competitive environment without which companiesstall and die. This is the reality of today's relentless business environment. And this realityleads us to most elusive asset of any company, namely the Human Capital.
It is just simply because an organization's creativity and innovation level totallydepend on the potential of their people. This brings an implication for HR professionalsto set their agenda and to design systems for attracting, developing, retaining talentand engaging them towards getting the most of their human capital potential. Itseems that the only way is to nurture organizational learning, teamwork and collectiveintelligence by stimulating free-flow of ideas along with a disciplined and methodicalapproach to continuous improvement. Knowledge and experience are tacit when they arehoused in the minds of the employees. Once the knowledge is written down in some formit is explicit. Structural capital is the ability to convert tacit knowledge into explicitknowledge so that the organization is able to retain knowledge.
Managing the knowledge and talent of human resource in favour of organisation isa great path towards innovation. This concept deals with maximizing the available collectiveknowledge and relevant level of talents in an organization. Thus the emphasis should be onacquiring talents by means of attracting and selecting candidates wisely and retaining themtoo. Managing the talents towards innovation followings may be the common steps:
Planning of talent needs
Selecting the best talents
Boosting up productivity
Motivating themTraining for updating skills and knowledge
Measures to retain them
Developing culture to enjoy talent mobility across the organization etc
Management Dynamics and Bhagwad Gita 3

Management Trends Vol. 10, No. 1-2 June-Dece - 2013
Now it is very clear that this the game of mind power therefore first of all it becomesimportant to understand that the human brain and the mind are not the same things. Boththe mind and mind power are purely a non-physical consciousness (spiritual) that is onlycapable of thought, while the brain is the physical tool that the mind uses to carry out aportion of its intended purpose. The studies have shown that the average person utilizesonly about 10% of their brains capability so, what about the other 90%? The spiritualprinciples say that this 90% can be tamed by Dhyan Yoga and Ananda that is widelydiscussed in Gita. Thus the power of the human mind is unlimited in its potential for anykind of innovation.
It is difficult to derive such kind of formula that defines how innovation takesplace. But on the basis of critical observation the innovation process can be derived as:
EXHIBIT: 1 STEPS IN INNOVATION PROCESS
According to Gita, happiness or enjoying the job is the key factor to create groundfor innovation. By this way it is possible to achieve a life of purpose without much struggleand stress if the perceptions of joy can be developed. By implementing some simpleprinciples, and following proven, time tested strategies to enhance mind function anddevelopment, one finds that one can literally "attract" and "allow" success to flow in.Many scientific studies and experiments have been done on the subject of human mindpower and proved that the ability of mind power to reverse and heal illness and diseasethat the medical community had previously labelled as irreversible has been developedby Spiritual faith and Dhyan Yoga. Would our Creator have provided us with mind powerthat he had no intention for us to use? That is a valid question. It is a simple formula like
4 Nageshwar Rao & Ram Pravesh Rai

Management Trends Vol. 10, No. 1-2 June-Dece - 2013
any other extremely simple things that our Creator has provided us with. Man has convertedthis extremely simple concept into extremely complex because their believes are coveredwith Maya, and so these simple things have become out of reach of the average person,there are proven and simple means of developing the human mind to consciously andconsistently achieve by following the simple rules that our creator has told us to do. Thelessons given by Lord Krishna in the Bhagavad-Gita are the way to achieve self-realizationand to realize the ultimate truth. These are very basic Universal principles (SpiritualLaws) that support and have proven that the average human does have the ability tocreate unlimited mind power. Becoming aware of, and developing the understanding of,exactly how these basic principles operate, are the first steps toward realizing our owntrue potential to do so. Thus, on the basis of principles propounded in Gita the followingformula can be illustrated to develop one's innovative capability:
Knowledge+ Thought+ Vision +Will power+ Happiness + Action = InnovativeCapability
The Mind Power
Wise selection and optimal utilization of resources is the important lesson ofmanagement science. An instance to justify this statement may be seen when just beforethe Mahabharata War, Duryodhana chosen Sri Krishna's large army for his help whileArjuna selected Sri Krishna's wisdom for his support. This episode gives us a clue forbeing an effective manager ? the former chose numbers, the latter, wisdom or mindpower. In the contemporary management scenario, mind power is strategic to managers.It assumed that managers should be strong and mentally fearless, hence, many of themanagement training programme focuses on this. An untrained mind is very weak andunstable, as a result even a small obstacle coming in its way may make it lose initiative.Sri Krishna also mentioned that for one who has conquered the mind, the mind is thebest of friends, but for one who has failed to control their mind, the mind will be thegreatest enemy. In the chariot of the body, the five horses represent the five senses(tongue, eyes, ears, nose and skin). The reins, the driving instrument, symbolize themind, the driver is the intelligence, and the passenger is the self. Managers should usetheir will power and Dhyan to control the mind (the driving instrument), they shouldnot let the mind to be controlled by the senses. Sri Krishna described that from anger,complete delusion arises, and from delusion bewilderment of memory. When memoryis bewildered, intelligence will be lost and when intelligence is lost one falls down(B.G. 2.63).The psychology or sound mental health of human resource is a peculiarfactor of any organisation as well as any human activity. An expert describes soundmental health as that state of mind which can maintain a calm, positive poise or regainit when unsettled in the midst of all the external vagaries of work life and social existence.Now it becomes very important not only for managers but for all of us to develop ourmind power and tackle its impediments to sustain it. The Gita tells us that how theimpediments can be tackled, which can be illustrated as follows:
Management Dynamics and Bhagwad Gita 5

Management Trends Vol. 10, No. 1-2 June-Dece - 2013
EXHIBIT: 2 Monitoring and Controlling the Impediments to Mind Power throughGita's Way
The speed, greed, ambition and competition are the driving forces of today's rat-race environment. This lead to the erosion of one's ethico-moral fibre which supersedesthe value system as a means in the entrepreneurial path like tax evasion, undercutting,spreading canards against the competitors, entrepreneurial spying, instigating industrialstrife in the business rivals' establishments etc. Although these practices are taken asnormal business hazards for achieving progress, they always end up as a pursuit of mirage- the more the needs the more the disappointments.
Gita tells us how to get rid of this universal phenomenon by prescribing thefollowing mantras:
l Cultivate sound philosophy of life
l Identify with inner core of self-sufficiency
l Get out of the habitual mindset towards the pairs of opposites
l Strive for excellence through work is worship.
l Build up an internal integrated reference point to face contrary impulses and emotions
l Pursue ethico-moral rectitude
Cultivating this understanding by a manager would lead him to emancipation fromfalsifying ego-conscious state of confusion and distortion, to a state of pure and free mindi.e. universal, supreme consciousness wherefrom he can prove his effectiveness indischarging whatever duties that have fallen to his domain.
6 Nageshwar Rao & Ram Pravesh Rai
Impediments tomind power
Bhakti Yoga
Peace
Detachment
Satisfaction
Karma Yoga
l Frustrationand anger
l Envy
l Anguishness
l Greed
l Egotism

Management Trends Vol. 10, No. 1-2 June-Dece - 2013
Bhagawan's advice is relevant here:
"tasmaatsarveshukaaleshumamanusmarahyuddha cha"
'Therefore under all circumstances remember me and then fight' (Fight meansperform your duties)
Self-Management
A manager always thinks to play all the roles very effectively but faces someimpediments to be effective in his job. Here, Bhagwat Gita proclaims that 'you should tryto manage yourself'. It means managing the self is very critical. Unless the Managerreaches a level of excellence and effectiveness that sets him apart from the others whomhe is managing, he will be merely a face in the crowd and not an achiever. The despondentposition of Arjuna in the first chapter of the Gita is a typical human situation which maycome in the life of all. Sri Krishna by sheer power of his inspiring words raised the levelof Arjuna's mind from the state of inertia to the state of righteous action, from the state offaithlessness to the state of faith and self-confidence. These are the powerful words ofcourage, of strength, of self-confidence, of faith in one's own infinite resource, of theglory in the life of active people.
When Arjuna got over his despondency and stood ready to fight, Sri Krishna gavehim the gospel for using his spirit of intense action not for his own benefit, not for satisfyinghis own greed and desire, but for using his action for the good of many, with faith in theultimate victory of ethics over unethical actions and truth over untruth. Arjuna respondsby emphatically declaring that all his delusions were removed and that he is ready to dowhat is expected of him in the then situation. Sri Krishna's advice with regard to temporaryfailures in actions is 'No doer of good ever ends in misery'. Every action should produceresults: good action produces good results and evil begets nothing but evil. The Gitafurther explains the theory of "detachment" from the result which enables to analyse thesituation more objectively and accurately and stresses on importance of self-managementor personal management first before managing the others i.e. human resource management(HRM). Self-management includes all aspects of management of oneself such as managinglife, time, stress, anger, fear and self-control etc. In explaining the position of a self-realized person, the Gita stressed the aspects such as controlling the mind, determination,giving up sense gratification, being free from attachment and hatred, body and mindcontrol, power of speech, free from false ego, false pride and anger as essential part ofself-management
Value Oriented Work Culture
Work culture means vigorous and arduous effort in pursuit of a given or chosentask. When Sri Krishna rebukes Arjuna in the strongest words for his unmanliness andimbecility in recoiling from his righteous duty it is nothing but a clarion call for thehighest work culture. Poor work culture is the result of tamoguna overtaking one's mindset.Sri Krishna stinging rebuke is to bring out the temporarily dormant rajoguna in Arjuna.
Management Dynamics and Bhagwad Gita 7

Management Trends Vol. 10, No. 1-2 June-Dece - 2013
The Gita elaborated two types of Work Ethic viz. divine work culture and demonic workculture. Daivi work culture - means fearlessness, purity, self-control, sacrifice,straightforwardness, self-denial, calmness, absence of fault-finding, absence of greed,gentleness, modesty, absence of envy and pride. Asuri work culture - means egoism, delusion,desire-centric, improper performance, work which is not oriented towards service. It is tobe noted that mere work ethic is not enough in as much as a hardened criminal has also avery good work culture. What is needed is a work ethic conditioned by ethics in work.
Often people comment that the central message in Bhagwat Gita is about the notionof karma yoga. It will be very useful to understand how this issue is laid out in the Gita.First of all Lord Krishna establishes a paradigm that there is nothing called "the state ofinaction". He clearly says in chapter 3 that there is nothing likes akarma (no action orinaction). Why did he say that? Because only then we will focus on the issue of how to dowork correctly. It is natural then for us to ask how to do work. He says enjoy completedegree of freedom and total joy while engaging in work. That is the idea. While we are inthe thick of work can we enjoy? Gita emphatically replies in the affirmative. Krishna goesto the extent of saying that with such a perspective to work, we may realize that evenwhen we do a lot of work, we do not feel like indeed engaging in any.
Management is all about doing work, doing it efficiently and ensuring that resultsfollow. Viewed from this perspective, Gita offers counter-intuitive ideas on these issues.The axioms of work have been proposed in Gita is also relevant in modern managementstyle. There are four aspects to this, which is brought out in this famous shloka in Gita:
H$_©Ê`odm{YH$mañVo _m \$cofw H$XmMZ & "Karmanye Vadhikaraste Ma Phaleshu Kadachana,
_m H$_©\$choVw^y©: _m Vo g“moñËdH$_©{U && Ma Karma Phala Hetur Bhurmatey SangostvaAkarmani"
When one is told that he/she has to do the work, he/she does not ask for results orbother about what causes these results, the normal tendency in some cases is to say, "wellin that case, I am not interested in doing the work". The last component takes away thatpossibility. Since in Gita, the notion of non-work or inaction is not a feasible alternative,the last component makes sense. The most difficult part is the second and the thirdcomponent. How can someone do the work and yet not have the right for results? Thisrequires some more articulation and understanding of the idea.
We are told that we need to work for results. Why is then Lord Krishna advocatingthe antithesis of this? In order to get this clear, let us trace some side effects of working forresults. Many of us with some work experience will be able to relate to these side effects:
l Result orientation can make one wary of failures, we may refuse to undertake greatactivities. It is much in news that student ended his life because he did not clear theexam.
l We have a tendency to excessively focus on ends instead of means. This is what mostworking in Multi-National Companies are busy doing. Modern day managers spendsignificant time to manager "performance reports" rather than "performance" itself.
8 Nageshwar Rao & Ram Pravesh Rai

Management Trends Vol. 10, No. 1-2 June-Dece - 2013
l In order to be good in managing the performance report, "process orientation" mustgive way for "result orientation"
l What are results at the end of the day? They are issues of the future about which wespend our time in the present. Therefore, we may tend to escape the dynamics of"present" and go after "future"
The apparent confusion that we have in understanding this shloka is that when wesay you have no right to the results, it merely suggests that take off your pre-occupationwith results and have a process orientation. We have the right to work only but never to itsfruits. Let not the fruits of action are your motive. Nor let our attachment be to inaction.The first half of this verse is a simple factual statement, which each one of us experiencesin the day to day life. One cannot have an absolute authority over the final outcome of anyaction. There is always a possibility of discrepancy between expected result and actualresult. Thus 'Karmanyevadhikaraste' becomes a scientific statement. There is no wonderthat strategic planning methods like 'SWOT Analysis' acknowledge the same scientificfact. SWOT analysis is a strategicplanning method used to evaluate the Strengths,Weaknesses, Opportunities, and Threats involved in a project or in a business venture.Strengths/ Weaknesses are intrinsic characteristics of the business. Opportunities/ Threatsare impacts of external elements.) Lord Krishna propels Arjuna to perform his duties,while staying selflessness to success or failure; not thinking of the fruit of action - once inthe field of activity and relinquishing attachment. He who gives up all desires and movesfree from attachment, egoism and thirst for enjoyment, attains peace which is the mostessential thing in life. When the work perspective developed in our thought with antecedentmind set passes through the pipe line of the karma principle the consequences would bedifferent, this can be illustrated as:
EXHIBIT: 3 Value Oriented Work Culture
Management Dynamics and Bhagwad Gita 9
Ethical values
Cultural Values
Human values
Organisational values
Professional effectiveness
Ethical behaviour
Institutional commitments
Job satisfaction
Inculcation of Karma
o No Expectation of results
o Emphasis on working
o Moral duty o Selfless action

Management Trends Vol. 10, No. 1-2 June-Dece - 2013
This should not be seen as antithesis to Management by Objectives (MBO) andManagement By Results. It tells us that we should build a work culture wherein valuesoccupy an important place. The inculcation of ethical values,cultural values,organisationalvalues and human values in Karma will give effective results.
Motivation
Dedication for work means to 'work for the sake of work'. The Gita tells us not tomortgage the present commitment to an uncertain future. If we are not able to measure upto this height, then surly the fault lies with us and not with the teaching. It has beenpresumed for long that satisfying lower needs of a worker like adequate food, clothingand shelter, recognition, appreciation, status, personality development etc are the keyfactors in the motivational theory of Maslow. It is the common experience that the spiritof grievances from the clerk to the Director is identical and only their scales andcomposition vary. It should have been that once the lower-order needs are more thansatisfied, the Director should have no problem in optimising his contribution to theorganisation. But more often than not, it does not happen like that; the eagle soars highbut keeps its eyes firmly fixed on the dead animal below. On the contrary a lowly paidschool teacher, a self-employed artisan, ordinary artistes demonstrate higher levels ofself- realization despite poor satisfaction of their lower- order needs.
This situation is explained by the theory of Self-transcendence or Self-realisationpropounded in the Gita. Self-transcendence is overcoming insuperable obstacles in one'spath. It involves renouncing egoism, putting others before oneself, team work, dignity,sharing, co-operation, harmony, trust, sacrificing lower needs for higher goals, seeingothers in you and yourself in others etc. The portrait of a self-realising person is that he isa man who aims at his own position and underrates everything else. On the other hand theSelf-transcenders are the visionaries and innovators. Their resolute efforts enable them toachieve the apparently impossible. They overcome all barriers to reach their goal. TheGita further advises to perform action with loving attention to the divine which impliesredirection of the empirical self away from itsegocentric needs, desires, and passions forcreating suitable conditions to perform actions in pursuit of excellence. It is found that allwork irrespective of its nature have to be directed towards a single purpose that is themanifestation of essential divinity in man/woman by working for the good of all beings -lokasangraha. . The same motivation is given by Sri Krishna in the Third Chapter of Gitawhen He says that 'He who shares the wealth generated only after serving the people,through work done as a sacrifice for them, is freed from all the sins. On the contrary thosewho earn wealth only for themselves, eat sins that lead to frustration and failure.'
It is in this light that the counsel 'yoga karmasukausalam' should be understood.Kausalam means skill or method or technique of work which is an indispensable componentof work ethic. Yoga is defined in the Gita itself as 'samatvam yoga uchyate' meaningunchanging equipoise of mind. Tilak tells us that performing actions with the specialdevice of an equable mind is Yoga. By making the equable mind as the bed-rock of allactions Gita evolved the goal of unification of work ethic with ethics in work, for without
10 Nageshwar Rao & Ram Pravesh Rai

Management Trends Vol. 10, No. 1-2 June-Dece - 2013
ethical process no mind can attain equipoise. The principle of reducing our attachment topersonal gains from the work done or controlling the aversion to personal losses enunciatedin Ch.2 Verse 47 of the Gita is the foolproof prescription for attaining equanimity. Thecommon apprehension about this principle that it will lead to lack of incentive for effortand work, striking at the very root of work ethic, is not valid because the advice is to bejudged as relevant to man's overriding quest for true mental happiness. Thus while thecommon place theories on motivation lead us to bondage, the Gita theory takes us tofreedom and real happiness. Is it not what the total quality management (TQM) philosophyis also arguing about? Further, it may be asked, why do we want to take the fixation fromresults and instead concentrate on the work itself? The simple answer to it is that by doingdo it lets you literally "get lost in work". When one gets lost into work, the traditionalbarriers of efficiency and motivation are broken and the individual treads into extraordinaryperformance born out of inspiration. Perhaps, that is how a Nobel Laureate or a greatscientist or a visionary leader would have spent several years of his/her time.
We often say when we do very interesting things in life, "I never knew how timepassed" That is a good indication of our ability to practice Karma Yoga. This is neither anunknown or impossible idea to mankind. Every day we all practice this when we havedeep sleep. We rise from the deep sleep and remark that we had a sound sleep. By thatwhat it means is no matter what sound others made in the vicinity I continued to sleep.Therefore it is hardly surprising that we can draw such alternative ideas and thoughtsfrom Gita. However, in order to benefit from this immensely, in the domain of management,we need to step out of the world of rationality and tread into unknown areas. Perhaps anearest reference to this idea in modern day is "out of the box" thinking or thinking"without" the box. This in itself is a paradigm shift in perception that we need to make inour own mind.
One of the biggest problems that we are facing in our daily life, professional workand personal life is that we don't seem to enjoy what we are doing. There was no wordlike boredom in the dictionary about 400 years - 600 years ago. Today the children say "Iam bored". Young professionals want to adopt the western model of "weekend getaway".We need weekend getaways if work is perceived as drudgery and an avoidable aspect ofour life. Such a perspective can never get the best from work place that modern businessmanagement is worried about. What is this boredom? Why does it happen? Because wedon't enjoy what we are doing, we get bored. The basic tenet of Gita is antithesis to thisidea that work could be drudgery. First understand there is nothing like state of no work.We cannot run away from work as there is nothing called "no work".
Further, if we always calculate the date of promotion or the rate of commissionbefore putting in our efforts, then such work is not detached. It is not "generating excellencefor its own sake" but working only for the extrinsic reward that may (or may not) result.Working only with an eye to the anticipated benefits, means that the quality of performanceof the current job or duty suffers - through mental agitation of anxiety for the future. Infact, the way the world works means that events do not always respond positively to our
Management Dynamics and Bhagwad Gita 11

Management Trends Vol. 10, No. 1-2 June-Dece - 2013
calculations and hence expected fruits may not always be forthcoming. It is also criticisedthat not seeking the business result of work and actions makes one unaccountable. In fact,the Bhagavad-Gita is full of advice on the theory of cause and effect, making the doerresponsible for the consequences of his deeds. While advising detachment from the avariceof selfish gains in discharging one's accepted duty, the Gita does not absolve anybody ofthe consequences arising from discharge of his or her responsibilities. Attachment toperishable gives birth to fear, anger, greed, desire, feeling of "mine" and many othernegative qualities. Renounce attachment by regarding objects for others and for servingothers. Depend only on wisdom (not body, nor intellect), and the dependency on theworld will end. Renouncing attachment is the penance of knowledge, which leads to HisBeing - Truth, Consciousness and Bliss. (B.G.4.10) Thus the best means of effectiveperformance management is the work itself. Attaining this state of mind (called "nishkamakarma ") is the right attitude to work because it prevents the ego, the mind, from dissipationof attention through speculation on future gains or losses.
There have been many studies examining staff motivation and here are few examplesof what commonly employees feel about their motivational needs or factors:
" The working environment - poor or inadequate equipment or work facilities
" Working Conditions - too hot, too cold, no breaks, long hours ,rest etc.
v Social Interaction - isolation, socialisation discouraged etc
v Job Security - redundancies, feeling not part of company etc
v Skill or intellectual use -inability or discouragement to use intellectual or skill
v Promotional prospects and job title - lack of promotion, others promoted but notthem
v Responsibility - not allowed to work off own initiative
v Recognition and appreciation - lack of praise or recognition for achievement
v Trust and respect - treated as a machine
v Participation in decision making - not allowed to get involved with company
v A sense of belonging - Salary - pays poor for job they are doing
v Management issues - conflicts with management, etc
This situation is explained by the theory of self-transcendence propounded in theGita. Self-transcendence involves renouncing egoism, putting others before oneself,emphasizing team work, dignity, co-operation, harmony and trust - and, indeed potentiallysacrificing lower needs for higher goals. "There are signals from inside; there are voicesthat yell out. This is a path, one of the ways that we try to teach self-actualization and thediscovery of self. The discovery of identity comes via the impulse voices, via the abilityto listen to your own guts, and to their reactions and to what is going on inside of you." .
12 Nageshwar Rao & Ram Pravesh Rai
Management Trends Vol. 10, No. 1-2 June-Dece - 2013
The great teachings of "Gita" come into play, these philosophies teach you all about, howyou should do your duty, how you should lead your life etc. These "Gita" teachings weregiven by "Lord Sri Krishna" to his disciple "Arjuna" on the battle field of Kurukshetra inHaryana state of India in ancient times. "Arjuna" was involved in a war against his enemies(some of them his own relatives too) but he refused to do his duty of fighting a righteousbattle as he got infatuated & started thinking of his enemies as his own near & dear ones.He told his master "Lord Sri Krishna" that he is going away from the war & do not wantto fight on the battle field. Arjuna's mentalhealth became weak & he got deeply depressed.To overcome his disciple Arjuna's depression & to motivate him to fight a righteous war,"Lord Sri Krishna" gave the great teachings of "Gita" to his disciple "Arjuna". Afterlistening to all these great teachings, Arjuna's mental health became well & he becamemotivated & energetic to fight the war.
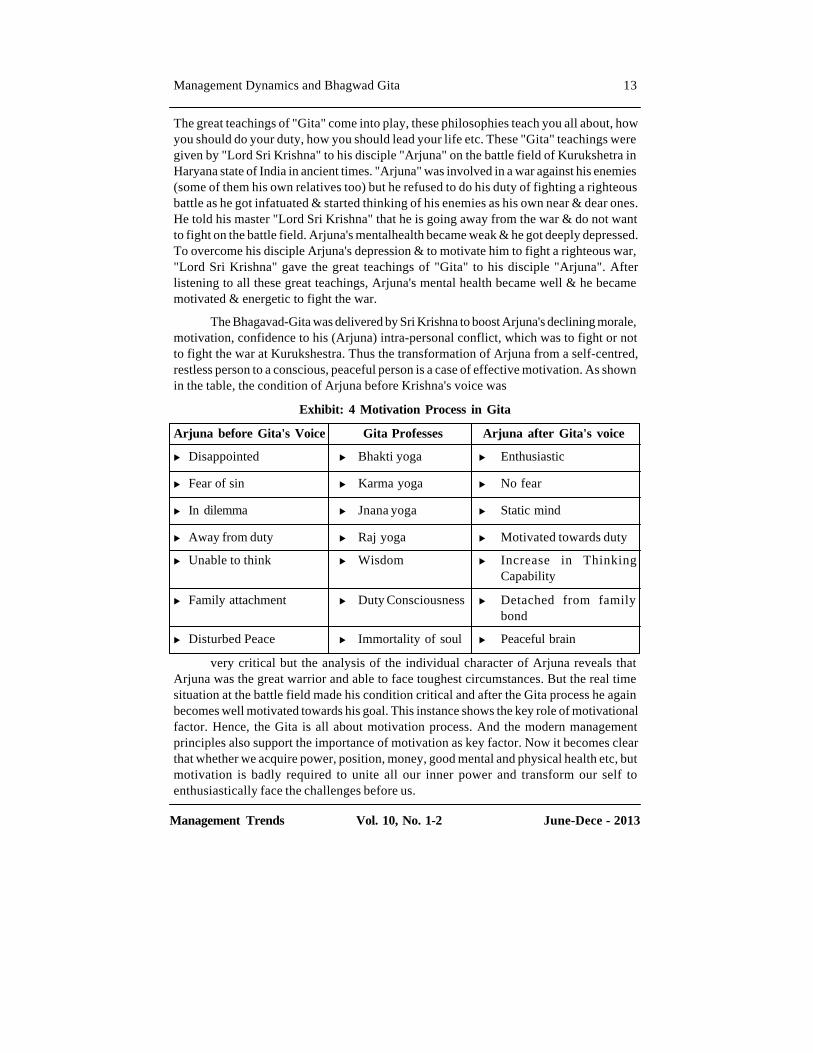
The Bhagavad-Gita was delivered by Sri Krishna to boost Arjuna's declining morale,motivation, confidence to his (Arjuna) intra-personal conflict, which was to fight or notto fight the war at Kurukshestra. Thus the transformation of Arjuna from a self-centred,restless person to a conscious, peaceful person is a case of effective motivation. As shownin the table, the condition of Arjuna before Krishna's voice was
Exhibit: 4 Motivation Process in Gita
Arjuna before Gita's Voice Gita Professes Arjuna after Gita's voice
u Disappointed u Bhakti yoga u Enthusiastic
u Fear of sin u Karma yoga u No fear
u In dilemma u Jnana yoga u Static mind
u Away from duty u Raj yoga u Motivated towards duty
u Unable to think u Wisdom u Increase in ThinkingCapability
u Family attachment u Duty Consciousness u Detached from familybond
u Disturbed Peace u Immortality of soul u Peaceful brain
very critical but the analysis of the individual character of Arjuna reveals thatArjuna was the great warrior and able to face toughest circumstances. But the real timesituation at the battle field made his condition critical and after the Gita process he againbecomes well motivated towards his goal. This instance shows the key role of motivationalfactor. Hence, the Gita is all about motivation process. And the modern managementprinciples also support the importance of motivation as key factor. Now it becomes clearthat whether we acquire power, position, money, good mental and physical health etc, butmotivation is badly required to unite all our inner power and transform our self toenthusiastically face the challenges before us.
Management Dynamics and Bhagwad Gita 13

Management Trends Vol. 10, No. 1-2 June-Dece - 2013
Leadership
The wisdom of the Bhagavad Gita contains many leadership lessons that are similarto contemporary leadership theories and practices. Many contemporary leadership topicssuch as emotional intelligence, situational leadership, character and integrity were alreadydiscussed in the Bhagavad Gita thousands of years ago. These topics were discussed in aphilosophical context, as management science as we know today did not exist then. It isalso intriguing to find other management concepts embedded in the Gita. Thousands ofyears before Frederick W. Taylor defined work and worker, and Peter F. Drucker definedknowledge and knowledge worker, the topics of work and knowledge were already in theBhagavad Gita.. He suggests that the Gita provides advice on mission and core values,the development of new capabilities, the importance of developing business connectionsand communication, and the duty of managers to maintain a purpose-centric perspective."Whatever the excellent and best ones do, the commoners follow," says Sri Krishna in theGita. The visionary leader must be a missionary, extremely practical, intensively dynamicand capable of translating dreams into reality. This dynamism and strength of a true leaderflows from an inspired andspontaneous motivation to help others. "I am the strength ofthose who are devoid of personal desire and attachment. O Arjuna, I am the legitimatedesire in those, who are not opposed to righteousness," says Sri Krishna in the 10thChapter of the Gita.
After hearing 575 verses from Sri Krishna in the Bhagavad-Gita, Arjuna wasmotivated, energized and acted according to Sri Krishna's instruction. This is transformationleadership.It explained - "He (Arjuna) stood steady on the ground with bow and arrow inhand. He lifted his arms ready to fight the war". Sri Krishna demonstrated transformationalleadership qualities in developing and guiding Arjuna to victory in the war. The Gitarepresents the struggles encountered by all humans in everyday activities, including thestruggles of leadership. The Bhagavad Gita provides guidance to modern day leadersregarding important leadership qualities and vision of life which facilitates healthyorganizational behaviour and success.
Management needs those who practise what they preach. This is the leadershipquality prescribed in the Gita. The visionary leader must also be a missionary, extremelypractical, intensively dynamic and capable of translating dreams into reality. This dynamismand strength of a true leader flows from an inspired and spontaneous motivation to helpothers. "I am the strength of those who are devoid of personal desire and attachment. OArjuna, I am the legitimate desire in those, who are not opposed to righteousness" saysSri Krishna . Organizations whose leaders lack vision are doomed to work under theburden of mere tradition. They cannot prosper and grow as they are reduced to keepingthings the way they have always been. For leaders, a vision is not just a dream; it is areality that has yet to come into existence. Vision is palpable to leaders; their confidencein and dedication to vision are so strong they can devote long hours over many years tobring it into being. In this way, a vision acts as a force within, compelling a leader toaction. It gives purpose to a leader. Sensing purpose and commitment creates the power
14 Nageshwar Rao & Ram Pravesh Rai

Management Trends Vol. 10, No. 1-2 June-Dece - 2013
of vision and inspire the leaders to respond and work. Warren Bennis, having spent manyyears working with leaders, concluded "while leaders come in every size, shape, anddisposition--short, tall, neat, sloppy, young, old, male, and female---every leader I talkedwith shared at least one characteristic: a concern with a guiding purpose, an overarchingvision. They were more than goal-directed" (Bennis, 1990). Peter Kreeft says that "to bea leader you have to lead people to a goal worth having-something that's really good andreally there" (Stewart, 1991). That essential "something" is the vision.
The relationship between leadership and the concept of yoga as propounded inGita is established below:
EXHIBIT: 5 LEADERSHIP AND GITA
Management Dynamics and Bhagwad Gita 15
An effective leader is one who judiciously blends knowledge, skills and values.The three types of yoga as propounded by Gita confers the same.This gives the leader notonly the mind power,right attitudeand innovative vision but also it promotes and strengthenshis ability to blend task orientation and people orientation(Managerial Grid)
The results of inner discipline and contemplation bring about tranquillity (prasad)in intellect, and from this tranquillity of the intellect gurgles out the 'happiness', which iscalled 'sattvic happiness'. The 'rajasic happiness' arises only when the sense organs aredirectly in contact with the sense- objects. In the beginning it is quite nectarine and alluring,but it creates in the enjoyer a sense of exhaustion and dissipation in the long run. Thistemporary happiness provided by the sense- objects is termed as the 'rajasic happiness'.In 'tamasic happiness', the permanent ever existing goal of life recedes to the backgroundon account of the non- apprehension of reality (nidra) and this results in simplesensegratifications at the flesh level. These kinds of pursuits incapacitate the intellect tothink out correctly the problems (alasya) that face it and to arrive at a right judgement.When theof the higher in us (pramada). Such a 'happiness', which deludes the soul, bothat the beginning and the end is termed as 'tamasic happiness'.
Values
Skills
Knowledge
ETHICS (Bhakti yoga)
WISDOM (Jnana yoga)
ACTION (Karma
LEADERSHI P

Management Trends Vol. 10, No. 1-2 June-Dece - 2013
Conclusion:
The Bhagavad-Gita was delivered by Sri Krishna to boost Arjuna's declining morale,motivation, confidence to his (Arjuna) intra-personal conflict, which was to fight or not tofight the war at Kurukshestra Sri Krishna gave not only spiritual enlightenment to Arjuna (and to all of us) but also the art of self management, conflict management, stress &, angermanagement, transformational leadership, motivation, goal setting and many others aspectsof management which can be used as a guide to increase our managerial effectiveness.Unlike the western approach to managerial effectiveness, which focuses in exploring theexternal world of matter and energy, the Bhagavad-Gita recommends a managerialeffectiveness approach, which focuses on exploring the inner world of the self.
References:
o Robins, S.P. and Sanghi, S.: 2008, Organizational Behaviour (New Delhi: PearsonsEducation).
o Senge, P.M.: 1990, The Fifth Discipline (New York: Doubleday/Currency).
o Sharma, A. and Talwar, B.: 2004, 'Business excellence enshrined in Vedic (Hindu)philosophy', Singapore
o Management Review, 26(1), 1-19.
o Nutt, P.C. and Backoff, R.W.: 1997, 'Crafting Vision', Journal of Management Inquiry,Dec Issue, 309-14.
o Stewart, T. A.: 1991, "Why Nobody Can Lead America", Fortune, January 14, pp.44-45.
o Snyder, N.H. and Graves, M.: 1994, 'Leadership and vision - importance of goalsand objectives in leadership', Business Horizons
o Geus A. (1997), Till' Livillg Company, Harvard Business School Press
o Ashok, H. and M. Thimmappa. (2006). A Hindu worldview of adult learning in theworkplace.
o Advances in Developing Human Resources, 8(3), 329-336.
o Engardio, P. and J. McGregor. (2006). Karma capitalism. Business Week, October30.
o Greenleaf, R. (2002). Servant leadership: A journey into the nature of legitimatepower. Mahwah, NJ: Paulist Press.
o Harvey, A. (2007). Bhagavad Gita: Annotated and explained. In K. BurroughsBhagavad Gita. Woodstock, VT: Skylight Paths Publishing.
o Hee, C. (2007). A holistic approach to business management: Perspectives from theBhagavad gita. Singapore Management Review, 29(1), 73-84.
16 Nageshwar Rao & Ram Pravesh Rai

Management Trends Vol. 10, No. 1-2 June-Dece - 2013
o Sharma, A. and B. Talwar. Business excellence enshrined in Vedic (Hindu)philosophy. Singapore Management Review, 26(1), 1-19.
o Bhattacharya, K.: 1995, 'Vedanta as Philosophy of Spiritual Life', in K. Sivaraman(ed.), Hindu Spirituality: Vedas Through Vedanta (Motilal Banarsidass, NewDelhi).
o Biberman, J. and M. Whitty: 1997, 'A Post Modern Spiritual Future for Work',Journal of Organizational Change Management 10(2), 130-138.
o Kalra, S. K.: 1997, 'Human Potential Management: Time to Move from Conceptof Human Resource Management', Journal of European Industrial Training 21(5),176-180.
o Kinjerski, V. M. and B. J. Skrypnek: 2004, 'De?ning Spirit at Work: FindingCommon Ground', Journal of Organizational Change Management 17(1), 26-42.
o Mirvis, P. H.: 1997, '''Soul Work'' in Organizations', Organization Science 8(2),193-206.
o Pandey, A. and R. K. Gupta: 2008, 'Spirituality in Management: A Review ofTraditional and Contemporary Thoughts', Global Business Review 8(1), 65-83.
o Woodman, R. W., J. E. Sawyer and R. W. Grif?n: 1993, 'Toward a Theory ofOrganizational Creativity', Academy of Management Review 18(2), 293-322.
o Md Mahbubur Rahim, Mohammad Quaddus and Mohini Singh (2011). GlobalBusiness: Concepts, Methodologies, Tools and Applications (pp. 1548-1561).
o Russon, C. & Russon, K. (2010). How the I Ching or Book of Changes can informwestern notions of theory of change. Journal of Multidisciplinary Evaluation,6(13), 193-199.
o Office of Internal Oversight Services. (2008). Review of results-basedmanagement at the United Nations. A/63/268. New York, NY: UN GeneralAssembly
o Bhagavad--?Gita:History's First Manual on Results--?Based Management CraigRusson International Labour Organization, Journal of Multi DisciplinaryEvaluation Volume 9,Issue 20, 2013
o Balodhi JP, Keshavan MS. Bhagavad Gita and Psychotherapy. Asian J Psychiatry.2011;4:300-2
o Jeste DV, Vahia IV. Comparison of the conceptualization of wisdom in ancientIndian literature with modern views: Focus on Bhagavad Gita. Psychiatry.2008;71:197-209
o Rao AV. The mind in Indian philosophy. Indian J Psychiatry. 2002;44:315-25
o Barlett A. and David,P.: 2000, 'Can Ethical Behaviour really exist in Business?',J ournal of Business Ethics, 23,199-209
Management Dynamics and Bhagwad Gita 17
Management Trends Vol. 10, No. 1-2 June-Dece - 2013
Websites:
o www.sathyasai.org,
o www.en.wikipedia.org
o www.gitapress.org,
o www.vedanta.og,
o www.guruvayur.com
o www.bbt.org
o www.freeworldacademy.com
o www.bhagavad-gita.org
o www.bhagavad-gita.us.
o www.managementparadise.com
18 Nageshwar Rao & Ram Pravesh Rai

Management Trends Vol. 10, No. 1-2 June-Dece - 2013
A Study of Impact of Strategic CSR as an Integral ToolFor Expanding Rural Markets ThroughA Case Study Of Hindustan Uniliver Ltd.
A Study of Impact of Strategic CSR as an Integral Tool For Expanding Rural Markets Through 19
Jayrajsinh D. Jadeja*
Kedar Shukla**
* Dean of Faculty of Management Studies at The M.S.University of Bardoa - VadodaraEmail : [email protected]
** Associate Professor of Marketing Management at GIDC Rofel Business School - VapiEmail : [email protected]
Abstract : Evolving from remaining just charitable orphilanthropic activity, of earlier days Corporate SocialResponsibility (CSR) has been a leading and emergingstrategic management concept of the modern days'management. There are sizable numbers of research papers,which lead to conclude that business organizations involvingin discharging their Social Responsibility and dutiestowards the society, not only helps to the society but it equallybenefits to the their own business organization directly andindirectly in achieving their business units goals. StrategicApproach of CSR advocates the discharge of the CSR in away, which helps the society and increase the "organizations'value" by benefiting in it's operations. During the last decaderesearchers' have attempted to measure the impact of theCSR activities on the various functions of the organizationlike Marketing, Finance , Human Resource, Production etc.Management literature review of the research papers revealsthat in India 'Rural Development' is one of the prime areaof concern for the business having great growth potential ,and many organizations choose the 'Rural Development' astheir area of discharging their CSR. Does a CSR investmentmake any sizable contribution in expanding market also inthe rural area for the organization or the industry? In thepresent research paper researchers' have attempted toanswer this question with the help of secondary data of theorganizations which has invested their CSR funds in to therural development.
Key Words : Corporate Social Responsibility ; RuralMarketing , Brand Image, Ethics

Management Trends Vol. 10, No. 1-2 June-Dece - 2013
(I) Introduction
India's historic freedom struggle was characterized to a great extent by concernfor the problems like mass poverty, protection for farmers, artisans, inflation, the need forindustrialization and reconstruction of entire socio-economic life. During the period ofpost independence the image of Indian business leaders was under the criticism for notbeing sensitive towards the society. The perception of the society for them was of beingcapitalist and adopter of the many unfair practices for increasing profits. On one handthe business was and have been resting on the hoarding black marketing, adulteration,profiteering, unethical practices etc, on the other hand social responsibility concept wasalso emerging during that phase out of all the darkness. Business leaders like Shri. ArvindMafatlal had remarked that "Businessmen and industrialist should discharge their socialresponsibilities on a scale and on such diverse lines that they would go beyond therequirements of various law of the country, it is indeed important that the business growsthe majority of the human being settled at the villages of India, and benefits of the businessmust reach to them."
A group of the business leaders started believing that "The tarnished image of theprivate business can be improved and brightened only if it discharges social responsibilitieshonestly and as a matter of fact a moral duties."
Mid-seventy onwards Social responsibility of business has remained centralbusiness concept among the businessmen, researchers and academicians. With evolutionof business in India, India has turned to one of the fastest growing economy and so as, therole of CSR has also evolved and now it has not remained just a charitable activity of thebusiness but it has turned to the one of the most discussed and debated strategic businessmanagement concept."
In the present research paper , we have tried to understand the impact of strategicCSR on the business organizations' performance , which we have studied through thecase studies of the companies Proctor and Gamble and Hindustan Unilever Ltd.
(II) Research Methodology
For the study of Strategic CSR and it's impact secondary data analysis methodologyhas been used with the descriptive research analysis, Secondary data related to study hasbeen obtained from Hindustan Uniliver Ltd. and the same has been reproduced as a casestudy. It has been attempted to study the scope of strategic CSR and impact measurementthrough the secondary data analysis and descriptive research. Since the same has beenpresented as the case study no hypothesis has been formed.
(III) Review of Literature
(A) Corporate Social Responsibility as Strategic Management Concept.
The understanding of the Corporate Social Responsibility has been evolved withthe time and has widely understood as,
20 Jayrajsinh D. Jadeja & Kedar Shukla
Management Trends Vol. 10, No. 1-2 June-Dece - 2013
Milton Friedman (Friedman, 1970). "There is one and only one social responsibilityof business - to use its resources and engage in activities designed to increase its profitsso long as it stays within the rules of the game, which is to say, engages in open and freecompetition without deception or fraud"
Peter Drucker (1984) , legend of Modern Management , remarked in his paper'The new meaning of corporate social responsibility (1984, California ManagementReview) "Social responsibility is the term used to assert or assign - leadership responsibilityof the businessman with respect to the "culture" of the community. - Responsibility forsocial impacts is a management's responsibility not because it is a social responsibilitybut because it is a Business responsibility."
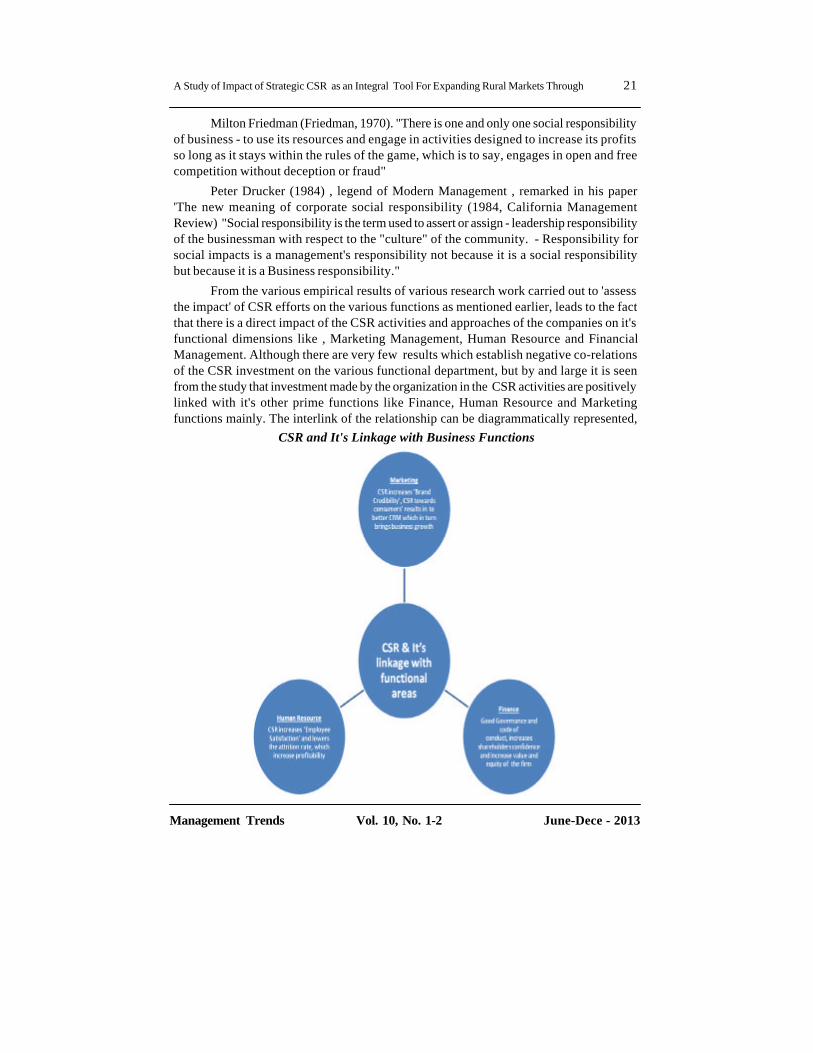
From the various empirical results of various research work carried out to 'assessthe impact' of CSR efforts on the various functions as mentioned earlier, leads to the factthat there is a direct impact of the CSR activities and approaches of the companies on it'sfunctional dimensions like , Marketing Management, Human Resource and FinancialManagement. Although there are very few results which establish negative co-relationsof the CSR investment on the various functional department, but by and large it is seenfrom the study that investment made by the organization in the CSR activities are positivelylinked with it's other prime functions like Finance, Human Resource and Marketingfunctions mainly. The interlink of the relationship can be diagrammatically represented,
CSR and It's Linkage with Business Functions
A Study of Impact of Strategic CSR as an Integral Tool For Expanding Rural Markets Through 21

Management Trends Vol. 10, No. 1-2 June-Dece - 2013
(IV) CSR as Marketing Tool and It's Support in Expansion of Rural Market.
Host of research has been carried out to check the impact of CSR on MarketingFunction , to an extent the CSR efforts of the organization often faced the criticism of justand 'investment for marketing' or 'business investments.' Sighting some of them as,
Holt (1995) , Glazer and Konrad(1996)
Holt founds that consumers product choice sends the social signals regarding theirpersonality attributes, similarly Glazer and Konrad examine the role of social signals inthe realm of charitable behavior. Their model implies that purchasing CSR- Associatedproducts , is a specific method of making charitable donations - should also serve as asocial signal.
Varandarajan and Menon (1998)
They categorize CRM among CSR initiatives that "Do Better by Doing Good." Inother words, CRM not only increases the company's revenues but also contributes tosocietal welfare. They defined CRM as: 'The process of formulating and implementingmarketing activities that are characterized by an offer from the firm to contribute a specifiedamount to a designated cause when customers engage in revenue-providing exchangesthat satisfy organizational and individual objectives.'
Quattrone and Tversky (1984)
On attempt to study on , what specific motivations that drive the decision to purchasea CSR - associated product , they have found out that people often engage in behaviors inorder to signal to themselves that they possess a particular desire trait , even when thereare no social incentives.
Sen and Bhattacharya (2001)
Most companies than ever engage in CSR activities , however the Research by theSen. and Bhattacharya , shows that communicating about CSR activities does notnecessarily results in positive business effect always for the companies. Furthermore, itshows that the companies that are criticized the most in the area of CSR are also the onesthat are the criticized the most. However it is also found in their research that, productswith a CSR-association are extremely popular among the consumers.
However from the presented literature review it is leading to a clear conclusionthat CSR investments and approaches have a direct impact on the 'Marketing Functions'mainly to sump up we can say that,
l CSR investments build the strong and ethical Brand Value of the organizations.
l Specifically in India, though the base of Rural Market is wide enough the contributionin the business in low from the same, therefore many FMCG and Consumer durablecompanies uses corporate social responsibility concept in creating brand awarenessand expanding rural markets.
22 Jayrajsinh D. Jadeja & Kedar Shukla

Management Trends Vol. 10, No. 1-2 June-Dece - 2013
l Consumers are often willing to buy the 'socially responsible products' or 'environmentalfriendly products.'
l Organizations have started diverting or minimizing advertisement expenditure tosocially responsible causes, there are results which favors that the same helps in buildingbrands and results in to higher profitability.
It's undoubted fact that the 'Corporate Social Responsibility' approaches of theorganization as well as , Socially responsible behavior of the 'Corporate' indeed has helpedthe 'brands' in reaching to the rural markets and expanding rural market which has almostsixty percentage of Indian population. As a result of that, not only Corporate SocialResponsibility has not only helped the society but it has also helped the business. Selectexamples of CSR supporting marketing and rural market expansion have been presentedhere in brief.
(IV) CSR of Hindustan Unilever Ltd. And It's Market Impact.
(a) A Case Study of Project Shakti' By Hindustan Uniliver Ltd.
HLL in the year 2001 estimated the rural consumer base for their products as 100million users by, 2005. With a mission of reaching them through the CSR by approachingminimum 100000 villages by the end of the year 2005, through the CSR "Project Shakti "
CSR Project Shakti for HLL as a strategic tool to reach rural consumers
A. PROJECT SHAKTI - Vision : Changing Lives in Rural India ; Mission: Reaching100000 villeges of India to reach 100 million consumers.
Project Shakti is HLL's rural initiative, which targeted small villages with populationof less than
2000 people or less. It seeked to empower underprivileged rural women byproviding income generating opportunities. Project Shakti launched with an aim toimprove the standard of living of the rural community, by providing health and hygieneeducation.
In general, underprivileged rural Indian women were target, who were needing asustainable source of income. Project Shakti has been a pioneering effort in creatinglivelihoods for rural women, organized in Self-Help Groups (SHGs), and improving livingstandards in rural India. Project Shakti has been providing critically needed additionalincome to these women and their families, by equipping and training them to become anextended arm of the company's operation.
Started in 2001, Project Shakti had been extended to more than 30000 villages in196 districts in 11 States during the year 2004, - Andhra Pradesh, Karnataka, Gujarat,Madhya Pradesh, Tamil Nadu, Chattisgarh, Uttar Pradesh, Orissa, Punjab, Rajasthan andMaharashtra. The respective state governments and several NGOs are actively involvedin the initiative.
A Study of Impact of Strategic CSR as an Integral Tool For Expanding Rural Markets Through 23

Management Trends Vol. 10, No. 1-2 June-Dece - 2013
Project Shakti already had over 10,000 women entrepreneurs in its fold by theyear 2004. A typical Shakti entrepreneur earns a sustainable income of about Rs.1,000per month, which is double their average household income. Project Shakti is thus creatingopportunities for rural women to live in improved conditions and with dignity, whileimproving the overall standard of living in their families. In addition, it involves healthand hygiene programmes, which help to improve the standard of living of the ruralcommunity.
The project's ambit already covers about 15 million rural population. Plans arealso being drawn up to bring in partners involved in agriculture, health, insurance andeducation to catalyze overall rural development. Unilever has allied itself with the StateBank of India on a microfinance drive in Maharashtra and Karanataka. The pilot phasehas seen 12 of the Shakti Ammas who sell Unilever's goods act as providers of basicbanking services, and 1,000 accounts have been established thus far.
According to the company, 20% of households from the test regions have signedup, and nearly 80% of participants are women, generally seeking an "accessible" way toenter the category. "The objective is to bring about financial inclusion in rural areas,"Hemant Bakshi, HUL's executive director, sales and customer development. The ultimateintention is to roll out this offering across India in the next 12 months, utilizing some ofthe 43,000 existing Shakti Ammas.
(b) LIFEBUOY SWASTHYA CHETANA -- Health & Hygiene Education
Lifebuoy 'Swasthya Chetana' is the single largest rural health and hygieneeducational programme ever undertaken in India. Its objective was to reach rural consumersfor the lifebuoy soap by educating people about basic hygienic habits. It has beendeveloped around the insight that people mistakenly believe "visible clean is safe clean".The programme established the existence of "invisible germs" and the associated risk ofinfection. In India this is important, because diarrhoea, caused by invisible germs, is thesecond largest cause of death among children below the age of 5.
The campaign has been divided into various phases. In the initial phase, a HealthDevelopment Facilitator (HDF) and an assistant initiates contact and interacts with studentsand influencers of the community, like village community representatives, medicalpractitioners, school teachers etc. A number of tools like a pictorial story in a flip chartformat, a "Glo-germ demonstration", and a quiz with attractive prizes to reinforce themessage are used. The "Glo-Germ demonstration" is a unique tool to make unseen germsvisible and emphasize the need to adopt hygienic practices. The first interaction withstudents is then replicated with the rest of the community.
Started in 2002, the programme covered about 15000 villages in 8 states in it'sfirst phase like -- Uttar Pradesh, Bihar, Jharkhand, West Bengal, Orissa, Madhya Pradesh,Chattisgarh and Maharashtra; and touched about 70 million people, imparting hygieneeducation to over 25 million children.
24 Jayrajsinh D. Jadeja & Kedar Shukla

Management Trends Vol. 10, No. 1-2 June-Dece - 2013
Post floods in Mumbai in 2005 , Hindustan Unilever Ltd took up a CSR task ofdistributing 1.5 Lakhs lifebuoy sops , through UNICEF. It is observed that the good willand brand image earned by the company through this very small investment and socialinitiative was way ahead of 20 sec prime time television advertisement , with a frequencynothing less that 15 times. Product Promotion benefits were derived was surplus.
(c) FAIR & LOVELY FOUNDATION -- Economic Empowerment of Women
The Fair & Lovely Foundation is HLL's initiative which aims at economicempowerment of women across India. It aims to achieve this through providing information,resources, inputs and support in the areas of education, career and enterprise. It specificallytargets women from low income groups in rural as well as urban India. Fair & Lovely, asa brand, stands on the economic empowerment platform and the Foundation is an extensionof this promise. The Foundation has renowned Indian women, from various walks of life,as its advisors. Among them are educationists, NGO activists, physicians. The Foundationis implementing its activities in association with state governments.
In India, low-income families, albeit unwillingly, tend to discriminate against girlchildren, in providing opportunities for education and enterprise, because of resourceconstraints. The support
provided by Fair & Lovely Foundation has been helping girl children availopportunities of higher education and acquire skills in appropriate professions. The seriesof projects that have been drawn up to achieve the vision of empowering women includethe areas of Career guidance , vocational professional trainings and education scholarship.
Launched in 2003, Fair & Lovely Foundation impacted the lives of about 5000women by 2005. And project also created brand awareness of fair and lovely and brandhas been now well recognized and accepted brand in the segment of the cosmetic products.
(IV) Conclusion.
Hindustan Unilever Ltd. Has effectively integrated corporate social responsibilitywith it's marketing function and strategic planning of CSR investment not only helped thesociety in the development but also supported company in reducing it's brand buildingcost through the advertisements and helped in reaching out millions of consumers'specifically in the rural area. Projects like 'Fair and Lovely Foundation' touched to the'emotional esteem' of the rural women and not only helped them in achieving their aspirationof growth but also supported the company in creating it's powerful brand awareness andimpact in the consumers' mind. Fair and Lovely cosmetic products are one of the mostrecognized and sold brand in their product category. It is also important to note here thatthe company has a thoughtful market and consumer analysis of the rural Indian marketand that has been linked to the strategic corporate social responsibility planning, whichproduced effective results as per the companies vision and not only that the, it has pushedcompetitors to copy the strategic move of integrating corporate social responsibility totheir marketing plans.
A Study of Impact of Strategic CSR as an Integral Tool For Expanding Rural Markets Through 25

Management Trends Vol. 10, No. 1-2 June-Dece - 2013
References :
1. Carroll, Archie B. (1991) The Pyramid of Corporate Social Responsibility: Towardthe Moral Management of Organizational Stakeholders, Business Horizons, July-August 1991
2. Drucker, P. F. (1984) 'The new meaning of corporate social responsibility', CaliforniaManagement Review, 26: 2, 53-63.
3. Holt, Douglas B. (1995), "How Consumers Consume: A Typology of ConsumptionPractices," Journal of Consumer Research, 22 (June), 1-16.
4. Varadarajan, R. P., and A. Menon (1988), "Cause-Related Marketing: A Coalignmentof Marketing Strategy and Corporate Philanthropy", Journal of Marketing, 52 (3),58-74.
5. Quattrone, G, A. and Amos T. (1984), "Casual Versus Diagnostic Contingencies:On Self-Deception and on the Voter's Illusion." Journal of Personality and SocialPsychology 46 (February), 237-248.
6. Sen, S., and C. B. Bhattacharya (2001), "Does Doing Good Always Lead to DoingBetter? Consumer Reactions to Corporate Social Responsibility", Journal ofMarketing Research. 38, 225- 243.
7. Website : http://www.hul.co.in/sustainable-living/
26 Jayrajsinh D. Jadeja & Kedar Shukla

Management Trends Vol. 10, No. 1-2 June-Dece - 2013
Abstract : International Financial ReportingStandards (IFRS) are designed as a common global languagefor business affairs so that company accounts areunderstandable and comparable across internationalboundaries. They are a consequence of growing internationalshareholding and trade and are particularly important forcompanies that have dealings in several countries.They areprogressively replacing the many different national accountingstandards. The rules to be followed by accountants to maintainbooks of account which is comparable, understandable,reliable and relevant as per the users internal or external.IFRS began as an attempt to harmonies accounting acrossthe European Union but the value of harmonization quicklymade the concept attractive around the world.
On April 1, 2001, the new IASB took over from theIASC the responsibility for setting International AccountingStandards. During its first meeting the new Board adoptedexisting IAS and Standing Interpretations Committeestandards (SICs). The IASB has continued to developstandards calling the new standards International FinancialReporting Standards (IFRS).
IFRS are used in many parts of the world, includingthe European Union, India, Hong Kong, Australia, Malaysia,Pakistan, and GCC countries, Russia, South Africa, Singaporeand Turkey. As of August 2008, more than 113 countriesaround the world, including all of Europe, currently requireor permit IFRS reporting and 85 require IFRS reporting forall domestic, listed companies, according to the U.S. Securitiesand Exchange Commission.In this paper an attempt have beenmade to review the opinion of practicing charteredaccountants regarding IFRS and related implications. Thepaper recommend the need for developing a sufficientenvironment by the national level body to resolve ambiguityin the adoption and implementation process.Keywords : IFRS, Implications, India
Daksha PratapsinhChauhan*
IFRS and Related Implications
Professor, Head &Dean, Department of Commerce and Business Administration, SaurashtraUniversity, Rajkot - 360005 (India) Email: [email protected]
IFRS and Related Implications 27

Management Trends Vol. 10, No. 1-2 June-Dece - 2013
I. Introduction
Accounting as a "language of business" communicate the financial results andhealth of an enterprise to various interested parties by means of periodical financialstatement like balance sheet, profit and loss account etc. like any other language accountingshould have its grammar and sets of rules of accounting standards. The main aim ofaccounting standard is to provide the standardized the diverse accounting policy so,comparability can be possible with high quality of transparency in accounting practices.
Financial statements prepared in different countries with different rules andregulation. So single set of globally accepted set of accounting standards were demandedfor comparison, analysis and interpretation globally.
The international accounting standard board is working in single set of high quality,understandable, enforceable and globly accepted IFRS. In order to achieve these objectivesthe IASB is coordinating the various stakeholders views on this area.
In this backdrop the ministry of corporate affairs (MCA) GOI set up a high-poweredcore group under the chairmanship of secretary (MCA) to study the impact of IFRSs andto understand the preparedness of the Indian companies for converging with IFRSs. Theroad map towers IFRS convergence for corporate from april1, 2011 has been finalized bythe ministry of corporate affairs in January, 2010.
Convergence also entails maintaining consistency with legal and regulatoryrequirements prevalent in the country. Towards this end, amendments need t be made toexisting laws and regulations, notably the companies act, 1956 provisions and schedulesthat detail the requirements of financial statements need to be harmonized with IFRSrequirements and converged Indian accounting standards need to be notified under section211 (3c) of the said Act. Additionally there are also issues relating to taxation under anIFRS converged environment.
There is also a need to improve awareness in general and build technical competencefor the accounting and auditing profession on IFRS. The ICAI has already included acomparative study of Indian accounting standards with international standards in itssyllabus for CA final advances accountancy and is alsooffering courses and seminars forits members to update them in the field. The RBI too has been holding periodical seminarsand workshops to educate its staff on IFRS provisions.
II. Review of Literature
A number of studies related to the objectives of this research have been publishedin recent years, which shall be considered as follows:
A research paper published by Shailesh.Gandhi, IIM- Ahmadabad, on GAPS inGAAP; issues in non-profit accounting and reporting in India (2005 March). This paperrecommends the need for developing a uniform accounting and reporting system for allNPO. In addition to this need for amendment in various act was recommended. In one of
28 Daksha Pratapsinh Chauhan

Management Trends Vol. 10, No. 1-2 June-Dece - 2013
the speech given by Dr. K.C. Chakrabarty, Deputy governor of RBI at the national seminaron IFRS in Mumbai 11 Feb 2011 has given his view on importance of accounting standard,development of IFRS, lesson from the financial crisis and challenges for the implementationwere discussed. Tokar (2005) focuses on the impact of convergence on auditing firmsand concludes that achieving true convergence of accounting standards is a costly andtime-consuming objective, and will require a huge investment of money and a significantchange in the training of accounting student in near future.Jermakowicz and Gornik-Tomaszewski (2006) argue that the complexity of IFRS, coupled with the lack of guidanceand of a uniform interpretation, can hinder the transition to IFRS. In addition, Jermakowiczand Gornik-Tomaszewski (2006) provide evidence which indicates that many companieswould have not adopted IFRS if it were not mandatory. Ilse Maria Beuren, Nelson Hein,Roberto Carlos Klann (2008) analyzed the impact of differences between the InternationalFinancial Reporting Standards (IFRS) and Generally Accepted Accounting Principles inthe United States (US GAAP) in the economic-financial indicators of Englishcompanies.According to Karamanis and Papadakis (2008) Greek accountants and auditorsbelieve that the introduction of IFRS will improve the quality of the financial statementsprepared by Greek firms. In particular, they believe that the implementation of IFRSimproves the understandability, relevance, reliability and comparability of financialstatements. On the other hand, the respondents in the survey expressed some concernsregarding the difficulties they face when they implement IFRS.Susana Callao, CristinaFerrer, Jose I.Jarne, Jose A. Lainez (2009) discovered the quantitative impact ofInternational Financial Reporting Standards (IFRS) on financial reporting of Europeancountries and evaluates if this impact is connected with the traditional accounting systemin which each country is classified, either the Anglo-Saxon or the continental-Europeanaccounting system.Robyn Pilcher, Graeme Dean (2009) determined the impact financialreporting obligations and, in particular, the International Financial Reporting Standards(IFRS) have on local government management decision making, In turn, this will lead toobservations and conclusions regarding the research question: "Dose reporting under theIFRS regime add value to the management of local government?"Alfred Wagenhofer(2009) analyzed the challenges that arise from political influences and from the pressureto sustain a successful path in the development of standards. It considers two strategiesfor future growth which the International Accounting Standard Board (IASB) follows:the work on fundamental issues and diversification to private entities.Rudy A. Jacob,Christan N. Madu (2009) examined the academic literature on the quality of InternationalFinancial Reporting Standards (IFRS), formerly International Accounting Standards (IAS),which are poised to be the universal accounting language to be adopted by all companiesregardless of their place of domicile.John Goodwin, Kamran Ahemed (2010) examinedthe impact of Australian equivalents to international financial reporting standards (A-IFRS) on the accounts of small-, medium- and larger sized firms.Dennis W. Taylor (2010)compared the costs to financial statement prepares of making the transition to InternationalFinancial Reporting Standards (IFRS) relative to the benefits to financial statement usersfrom receiving "higher quality" IFRS-based information (measured as incremental value-
IFRS and Related Implications 29

Management Trends Vol. 10, No. 1-2 June-Dece - 2013
relevance for listed companies in the UK, Hong Kong and Singapore). These countrieshad different approaches to harmonization leading up to IFRS adoption.Graeme Wines,RonDagwell, Carolyn Windsor (2011) crirically examined the change in accounting treatmentfor goodwill pursuant to International Financial Reporting Standards (IFRS) by referenceto the Australian reporting regime.
This study fills the gap in the literature by focusing on the IFRS and relatedimplications. the literature review found that the study is related to IFRS, and developmentin India etc. but here the researcher made an attempt to review the perceptions of charteredaccountant regarding applicability of IFRS in India.
III. Objectives of the Study
The brooder objective of the study is to know the practical implication of IFRSand to know the perceptions of Chartered Accountants.
IV. Research Methodology
This study is based on primary data. For this a structure questionnaire was developby the researcher on each standard of IFRS and to know their opinion for the relatedimplications. Here with the 5 point scaling technique data were collected, classified, andtabulated as per need of the study. At this stage researcher has taken 50 randomly selectedchartered accountants of the Rajkot city. Other information of IFRS implication is collectedfrom the secondary data also.
Following hypotheses were developed….
i) H0:- There is no significance difference between the perceptions of CharteredAccountant of Rajkot regarding in the impacts of IFRS.
ii) H1:- There is significance difference between the perceptions of Chartered Accountantof Rajkot regarding in the impacts of IFRS.
Further it was testedwith ANOVA (one-way analysis).
V. Findings of the study
1. The study is based on the 50 sampled respondents consisting of 38(76%) male and12(24%) female.The respondents who are unmarried were more than marriedrespondents in Rajkot city i.e. 68% respondents were unmarried whereas 32%respondents were married.All the respondents were falling under the age group of21-30 years and all respondents having professional experience of 1-10 years, andvery less people were shows their readiness to disclose their profession fees due toprofessional ethics which is issued by ICAI and due to their personal behavior.
2. Most of the respondents have sufficient knowledge about IFRS and have a basicknowledge about the differentiate requirements under GAAP and IFRS. And mostof the respondents believe that IFRS would reduce complexities, encourage outsiderinvestor and helps for transparency in accounting treatment.
30 Daksha Pratapsinh Chauhan

Management Trends Vol. 10, No. 1-2 June-Dece - 2013
Most of the respondents have general awareness of IFRS and their implication effectssuch that IFRS would lead to create global scale due to IFRS and it is totally basedon principle based approach. Respondents believe that before implementing IFRSinternational as well as national body should create for providing sufficientenvironment to the concern party.
3. Most of the respondents have knowledge about the specific awareness of the IFRS:
4. As per IFRS-1 it could be said that accounting policies adopted for the first timeshould follow throughout the period and entity should report comparable financialstatement of GAAP as well as with IFRS. Only few respondents have disagreed forthe same.
5. As per IFRS-2 it could be find that most of the respondents believe that the entityshould report the entire share based transaction in the financial statements and alsorequired and disclosed to report the entire share based option granted in the financialstatement. Only few respondents have disagreed for the same.
6. As per IFRS-3 it could be find that most of the respondents believe that businesscombination should be applied with the business combination method and shouldnot be applied to joint venture and holding transaction. Only few respondents havedisagreed for the same.
7. As per IFRS-4 it could be find that most of the respondents believe that insurer neednot change its accounting policies for insurance contract and also required anddisclosed to report the sensitivity risk associated with the insurance contract. Onlyfew respondents have disagreed for the same.
8. As per IFRS-5 it could be find that most of the respondents believe that the entityshould not report the temporary transaction related with non-current assets held forsale and noncurrent assets should be repot at carrying amount in the financialstatement. Only few respondents have disagreed for the same.
9. As per IFRS-6 it could be find that most of the respondents believe that the explorationand evaluation of mineral assets should be measured at cost and most of therespondents believe that such an asset subject to impairments in the financialstatement. Only few respondents have disagreed for the same.
10. As per IFRS-7 it could be find that most of the respondents believe that buy orsale of non financial items should be disclose separately and required to accountall the income and expenses in the financial statement, entity should report theall type of risk in the financial statements. Only few respondents have disagreedfor the same.
11. As per IFRS-8 it could be find that most of the respondents believe that the operatingsegment should apply to the companies whose share or debt are traded in the publicmarket and such segment aspects should not cover post employment benefits and
IFRS and Related Implications 31

Management Trends Vol. 10, No. 1-2 June-Dece - 2013
entity should report the reportable segment assets to the total entities assets separatelyin the financial statements and. Only few respondents have disagreed for the same.
12. As per IFRS-9 it could be find that most of the respondents believe that this IFRSwill cover all the hedge as well as derivative transaction in the financial statementand also cover hybrid contracts also in the financial statements as a disclosure as afinancial instrument . Only few respondents have disagreed for the same.
13. As per IFRS-10 it could be find that most of the respondents believe that the entityshould report consolidation of structured consolidation financial statementstransaction in the financial statements and also required and assets managerresponsible for all consolidation of financial transaction. Only few respondents havedisagreed for the same.
14. As per IFRS-11 it could be find that most of the respondents believe that the entityjoint arrangement only focused on the right and obligation of the arrangement and itmay also major impact on the real estate industries. Mutual funds and all the venturecapital companies units trust and other related organization at fair value method.Only few respondents have disagreed for the same.
15. As per IFRS-12 it could be find that most of the respondents believe that the entityshould disclose the interest in their financial statement and report with other financialstatement interested parties. Only few respondents have disagreed for the same.
16. As per IFRS-13 it could be find that most of the respondents believe that the entityshould set out a single IFRS as a framework for measuring at fair value but it is notrequired for plan assets. Only few respondents have disagreed for the same.
VI. Suggestions
1. Implementing IFRS would rather require change in format of account, change indifferent accounting policies and more extensive disclosure requirements.Therefore all parties concerned with Financial Reporting also need to share theresponsibility of international harmonization and convergence. India should goalong and face the challenge, study the likely risks and accordingly get preparedfor IFRS.
2. Majority of the respondents do not believe that IFRS and IASB can complete theconvergence on time. Thus Institute of Chartered Accountants of India should makean effort to train and upgrade the profession in IFRS.
3. Majority of the respondents believes that there would be a unified platform and thattoo transparent in the global scale. A continuous research is in fact needed to harmoniesand converges with the international standards and this in fact can be achieved onlythrough mutual international understandings.
4. For successful implementation of IFRS in India, the regulator should immediatelyannounce its intention to covert to IFRS and make appropriate regulatory amendments.
32 Daksha Pratapsinh Chauhan

Management Trends Vol. 10, No. 1-2 June-Dece - 2013
VII. Conclusion
Training, education and skill development is one of the corner stone's of thesuccessful implementation of IFRS. All the stakeholder need to develop understandingfor IFRS provisions. Institute can play a significant role for thought development processto meet the challenges and non accounting issues among practicing chartered accountantsand students of this field.
References:
1. Barry J. Epstein and Eva K. Jermakowicz , "Interpretation and Application of IFRSfor Indian Companies", Wiley India.
2. C.R.Kothari, "Research Methodology", New Age International (P) LimitedPublishers.
3. D.S.Ravat , "Indian Accounting Standards" & IFRS", Snow White Publications.
4. Deloitte Touché Tohmatsu "The Framework for the Preparation and Presentation ofFinancial Statements"
5. Dolphy D/'Souza , "Indian Accounting Standards &Gaap" (Interpretation, IssuesAnd Practical Application) Volume - I & II , Snow White Publications Pvt. Ltd.
6. Dr. A.L. Saini, "IFRS for India", Snow White Publications Pvt. Ltd.
7. Dr.S.N. Maheshwari, "A Text Book of Accounting and financial Control", SultanChand & Sons.
8. Dr.T.P. Ghose, Fundamentals of Accounting, Sultan Chand &sons.
9. Kamal Garg, "Accounting Standards & IFRS", Bharat Law House Pvt.Ltd.
10. P.C. Tulsian, "Accountancy for CA Final Course", Tata McGraw Hill.
11. Smith N.J. (2012), Constant Item Purchasing Power Accounting per IFRS, Ch. 1.22.2Three Concepts of Capital Maintenance
12. T.P. Ghose, CA SrinavasanAnand, "Guide to Indian Accounting Standards ConvergedWith IFRS", Taxman Allied Services Pvt.Ltd.
Journals and Reports:
1. Reports of Institute of Chartered Accountant of India (ICAI)
2. Reports of International Accounting Standard Board
3. Journal of Accounting Research
4. Business India
5. Journal of Accounting and Public Policy6. Journal of Accounting & Economics
7. Bombay Chartered Accountant Journal
8. News Letter of ICAI
IFRS and Related Implications 33

Management Trends Vol. 10, No. 1-2 June-Dece - 2013
Exploring the Role of Lean Accounting : A Step Aheadfrom Traditional Costing
Vineeta Arora*
G. Soral**
* Lecturer, S.D. Govt. College, Beawar, Rajasthan [email protected]
** Dept. of Accountancy & Statistics, Mohanlal Sukhadia University, Udaipur, Rajasthan,[email protected]
Abstract: In today's global market, a dynamic change isrequired in strategic and manufacturing practices becausethe current traditional costing system is almost obsolete withrespect to indirect cost absorption. The development of alean accounting system may have resolved the problemsfaced by most firms due to their traditional costing systems.Lean accounting, in the simplified form, is a systematicapproach to eliminate waste (overproduction, waiting,transportation, inventory, over processing) throughcontinuous improvement. Lean is a principle based operatingsystem which can be expressed by customer value, valuestream (sequence of activities from receiving order to deliverit to customer), flow and pull with minimum interruption,pursuit of perfection and empowered people. Finally lean isevery day, every time by everyone in any type of companywhere the business has been managed by value streams withaccountability for growing profitability and continuousimprovement.
Lean accounting does not require the traditionalmanagement accounting methods like standard costing,activity based costing, variance reporting, cost plus pricing,complex traditional control system and untimely, confusingfinancial reports. These are replaced by performancemeasurement chart, value stream costing, box score, plainlanguage financial statement, SOFP, value based pricingetc. The current state of traditional accounting system, whereprofit is earned by full utilization of resources, is havinglarge inventory, long lead time, and poor delivery, expandling orders, overhead absorption, complex and confusingaccounting system. But lean system earned profit throughmaximize flow on pull from customers and eliminate waste.The result is superior customer value, good quality, good
34 Vineeta Arora & G. Soral

Management Trends Vol. 10, No. 1-2 June-Dece - 2013
delivery, shorter lead time, organizational productivity andfrequent reporting of process measurement. These qualitiesmake lean accounting different from traditional accounting.This study has been explored the role of lean accountingwith its principle, practices and tools as well as a case studyhas been conducted by comparing the facts of leanaccounting and standard costing.
Key words: Lean Accounting, Traditional Accounting,Standard costing.
Today's worldwide open competition in market has raised expectation of moreheterogeneous product choices to be offered to them at high quality level, low prices andreasonable delivery times. That is why companies now seeking the movement whichprovide best customer focus and would be able to sustain a good competitive position,requires the cooperation of both the company's operating and accounting systems (Kennedyand Widener, 2008). Over the past two or three decades there managers are now foundthemselves as warriors of accounting battle which is bubbling up around the world thathas broad implication for how to run a business. The battle begins when a manager startsto think that which accounting method is best. Because there are lots of costing techniquesand methods available like cost plus pricing, standard costing, activity based costing etc.,which claim to provide accurate cost of product and by using this cost, company couldfight the battle of incredible throat cutting competition.
Traditional costing method use apportionment and absorption of overhead on someappropriate basis. Standard costing was developed to suit the needs of mass manufacturing.(Manjunath H. S. and Andrew Bargerstock, 2011). After great complexity of Activitybased Costing as lots of activities are there, accountants are looking for a new costmanagement technique which is suitable and not very much complex. Lean accountingmay be the solution of this problem. Lean accounting viewed as a systematic approach toidentify and eliminate the waste (non-value adding activities) through continuousimprovement that focus on perfection (quality) in the pursuit of manufacturing excellence(S S Mahapatra and S R Mohanty, 2007). Hennery Ford's philosophy of mass productionis no more fascinating managers because it results in various kinds of wastes in an industrialenterprise (Imai M, 2002). Lean accounting is a production strategy for organizationaleffectiveness focusing on waste reduction and improving productivity through Value StreamCosting, Box Score reporting, Plain English Income Statement, Plan Do Check Act(PDCA), 5S etc.
Lean Accounting being a new and emerging concept of accounting, this paperseek with major concept of lean accounting and concentrates that how lean accounting isbetter decision making technique. This is done through conducting a case study of aworld leading company where standard costing technique is applicable for determiningthe cost of product.
Exploring the Role of Lean Accounting : A Step Ahead from Traditional Costing 35

Management Trends Vol. 10, No. 1-2 June-Dece - 2013
Objectives:
The purpose of the present study is to contribute an understanding towards theemerging dimension of accounting i.e. lean accounting. For this purpose, this paper hasbeen divided into three parts:
(1) To focus on the conceptual review of Lean Accounting and its major aspects.
(2) To review the literature available on Lean Accounting to identify the current state.
(3) To analyze a case study based on lean principle for the problem facing in traditionalstandard costing.
Research Methodology:
This research is derived from a specific challenge facing by the companies thatwhat kind of costing and accounting approach is required to support the accurate productcosting. In order to address the issue, an extensive literature survey has been done tounderstand that what is lean accounting and what are its tools, principles and practices.Also this literature survey identified the problem created by the continued use of traditionalcosting and accounting methods.
To capture the last objective of the study, a case study is conducted of a worldleading company of US where standard costing is using as its decision making technique.The name of the Company is kept anonymous as per agreement with its management tokeep it confidential. Consequently, the studied company is referred to as Anonymous Inc.It is a leading manufacturer and exporter company of US. The required data have beencollected through convenient sources like e-mails, e-resources available and annual reportsof the company.
(I)-CONCEPTUAL REVIEW
Lean is getting the right thing, to the right place, at the right time, in the rightquantity to achieve the right work flow while minimizing waste, being flexible with greatercustomer satisfaction. Lean accounting is a support to the business by controlling thewaste, loss and defects. (Ross Maynard, 2009).
In simple words Lean Accounting:
u Will provide accurate, timely and understandable information to motivate and increasedcustomer value, growth, profitability and cash flow.
u It uses lean tools to eliminate waste from the accounting processes while maintainingthorough financial control.
u It is fully comply with generally accepted accounting principles (GAAP), externalreporting regulations, and internal reporting requirements.
In short, Lean Accounting is a Japanese approach that focuses all activities that donot add value to the production process such as holding of stock, repairing faulty product
36 Vineeta Arora & G. Soral

Management Trends Vol. 10, No. 1-2 June-Dece - 2013
and unnecessary movement of people and product around the plan with Continuousimprovement by the shortest, fastest route possible is the ultimate goal of lean accounting(D. Muthamizh Vendan Murugavel, 2011).
Principles of Lean Accounting:
The five steps process for guiding the implementation of lean techniques is shownin figure 1. These principles are easy to remember but not always easy to achieve.
1. Specify value from the standpoint of the end customer by product family.
2. Identify all the steps in the value stream for each product family, eliminating wheneverpossible those steps that do not create value.
3. Make the value-creating steps occur in tight sequence so the product will flow smoothlytoward the customer.
4. As flow is introduced, let customers pull value from the next upstream activity.
5. As value is specified, value streams are identified, wasted steps are removed, andflow and pull are introduced, begin the process again and continue it until a state ofperfection is reached in which perfect value is created with no waste.
Lean principle if followed and lean program if implemented properly will add tothe profit and profitability of an organization through all-round improvement in the wholecycle from manufacturing to product delivery with less inventories, less wastage, lessspace utilized, less cost on the one hand and better quality and greater customer satisfactionon the another hand.
Figure 1:
Principles ofleanaccounting
Exploring the Role of Lean Accounting : A Step Ahead from Traditional Costing 37
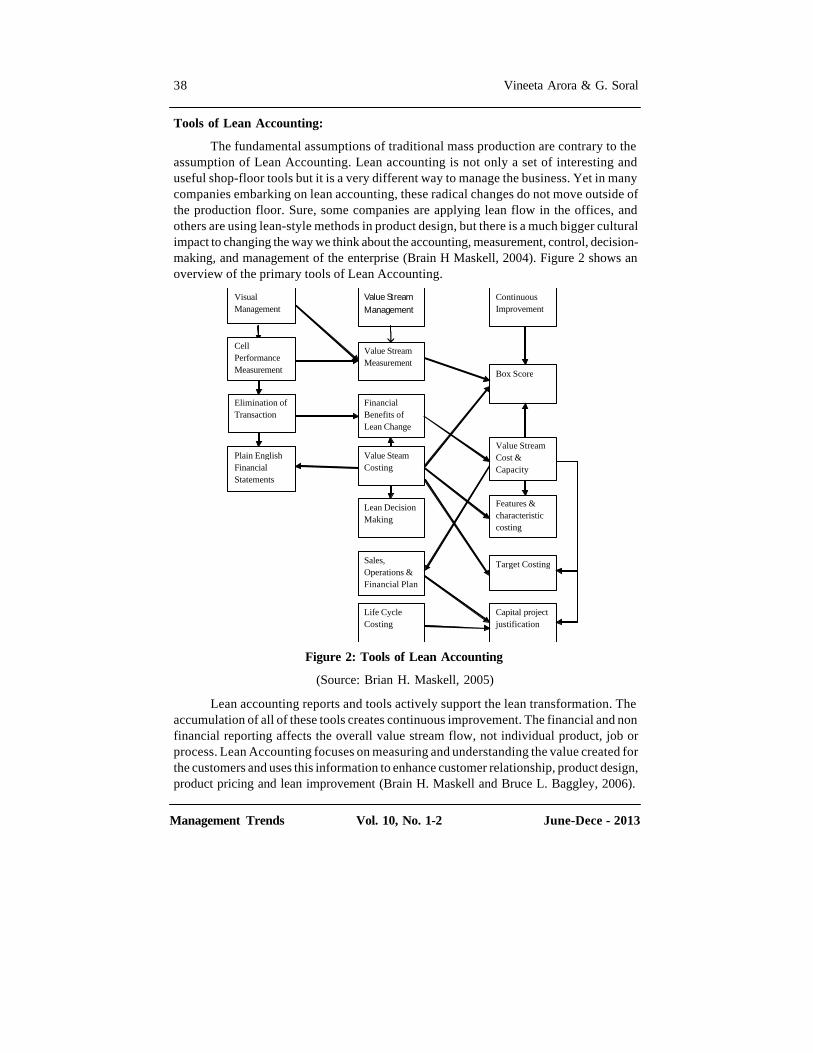
Management Trends Vol. 10, No. 1-2 June-Dece - 2013
Tools of Lean Accounting:
The fundamental assumptions of traditional mass production are contrary to theassumption of Lean Accounting. Lean accounting is not only a set of interesting anduseful shop-floor tools but it is a very different way to manage the business. Yet in manycompanies embarking on lean accounting, these radical changes do not move outside ofthe production floor. Sure, some companies are applying lean flow in the offices, andothers are using lean-style methods in product design, but there is a much bigger culturalimpact to changing the way we think about the accounting, measurement, control, decision-making, and management of the enterprise (Brain H Maskell, 2004). Figure 2 shows anoverview of the primary tools of Lean Accounting.
Figure 2: Tools of Lean Accounting
(Source: Brian H. Maskell, 2005)
Lean accounting reports and tools actively support the lean transformation. Theaccumulation of all of these tools creates continuous improvement. The financial and nonfinancial reporting affects the overall value stream flow, not individual product, job orprocess. Lean Accounting focuses on measuring and understanding the value created forthe customers and uses this information to enhance customer relationship, product design,product pricing and lean improvement (Brain H. Maskell and Bruce L. Baggley, 2006).
Visual Management
Cell Performance Measurement
Elimination of Transaction
Plain English Financial Statements
Sales, Operations & Financial Plan
Lean Decision Making
Value Steam Costing
Financial Benefits of Lean Change
Value Stream Measurement
Value Stream Management
Life Cycle Costing
Continuous Improvement
Box Score
Value Stream Cost & Capacity
Features & characteristic costing
Target Costing
Capital project justification
i
38 Vineeta Arora & G. Soral

Management Trends Vol. 10, No. 1-2 June-Dece - 2013
( II )- REVIEW OF LITERATURE
A brief review of work already done on the subject reveals the following findings:
D. Muthamizh Vendan Murugavel (2011) comparing Traditional Manufacturingto Lean Manufacturing and concluded if the lean production is carried out through efficientplanning and effective management, the manufacturers would surely achieve competitiveadvantage of this global market.
Manjunath H.S. Rao and Andrew Bargerstock (2011) exploring the role of standardcosting in lean manufacturing enterprises. The author indicates a three stage path to leantransformation that should be accompanied by corresponding changes in accounting.Ideally in stage second of lean transformation, the company must move away fromtraditional standard costing accounting and variance analysis.
A. Lakshminarasimha and Vivek Krishna K. (2010) provide an introduction tolean concepts and discuss the impact of target costing on lean. Suggestions and pointersfor further study are indicated, which would go a long way in practical sustainedimplementation of lean practices. A research is has also been conducted to study thepractices of "Lean and Target Costing" in India and they found that to gain competitiveadvantage in the global market place is only through lean and target costing combined.
Dan Woods (2009) examines the implications of lean philosophy with standardcost accounting and got the core difference i.e. Lean Accounting attempts to find measuresthat predict success and standard cost accounting measures results after the fact.
P.K. Chakraborty (2008) highlights different aspects of lean thinking as a way tosuccess. He concluded that lean implementation aims at getting the right things, to theright place, at the right time, in the right quantity to achieve the right work flow whileminimizing waste being flexible with greater customer satisfaction focusing on morecash flow, more profit and profitability and delivery of better value added products andservices.
Brian H. Maskell and Frances A. Kennedy (2007) explain why do we need leanaccounting and how does it works. They said that since those companies choosing leanprinciples as their basic business model will want to do everything they can do succeed.This article offers six reasons why accounting methods need to be change before companiescan fully realize the benefit of their lean transformation.
S S Mahapatra and S R Mohanty (2006) revel in their article that lean accountingis a strategy for organizational effectiveness focusing on waste reduction andimproving productivity through application of various tools. This article find out thereasons for sparse adoption of the concept of lean in Indian manufacturingorganizations through a cross-sectional survey study which highlights knowledge andlead to its adoption, benefits derived thereon and application of lean tools lookinginto operating environments.
Exploring the Role of Lean Accounting : A Step Ahead from Traditional Costing 39

Management Trends Vol. 10, No. 1-2 June-Dece - 2013
Brian H. Maskell (2005) reveals in his article "What is Lean Accounting?" thatthere are several tools included in Lean Accounting and they each work together to createa framework for the control & management of a lean enterprise. In his article he tried togive the answer of the question "What will Lean Accounting do for us?" by using simpleexamples with the help of Lean Accounting tools.
Mike Rother and John Shook (1998) introduced Toyota's concept of material andinformation flow diagrams, in the book "Learning to See", which now called value-streammaps. This is a simple, direct and accurate way to create financial reports with very fewtransactions.
Womack and Jones (1996) in the book "Lean Thinking", provide a simpledescription of lean principles-value, value stream, flow, pull, and perfection-along withstories of companies beyond Toyota that are applying them successfully in North America,Europe, and Japan. The final section presents an action plan for any company to followtoward a lean transformation.
Susan lilly and Nick Katho (1995) compared lean accounting with volume basedtraditional accounting and specify how can we solve any problem using the Plan, Do,Check and Act process. Lean accounting focusing on more cash flow, more profit andprofitability and delivery of better value added products and services.
After this background in view, we can say that with launching of the concept oflean accounting during the mid 1990's, most of the organizations, irrespective of theircapability and understanding of the concept, wanted to jump on the bandwagon in anattempt to trim the excess out of their organization and improve their bottom line. Now itbecome a magical costing and decision making technique with no indirect cost, which aregoing to improved and adopted by the society of world. Finally there is a broadimplementation framework for application of lean accounting
(III)- CASE STUDY
The transparency of lean accounting is helpful in demonstrating the benefits oflean manufacturing initiatives and optimizing day-to-day business operations. Becausestandard cost accounting rewards overproduction, using standard methods to try todemonstrate the value of lean processes that eliminate production waste would be futile.Lean accounting, on the other hand, reveals savings and costs that might otherwise bemisinterpreted or hidden - the true cost of labor and machinery, for example a studyreported several years ago in the Harvard Business Review concluded that 50% of executivedecisions are made on intuition. Surely that is cause for alarm. Is business decision-making necessarily that much of an art? Are executives not well trained in the use ofdecision-making tools? Or is it that executives sense that their information and data isskewed for some reason, and so go on gut feel in order to arrive at a comfortable decision?To show how lean accounting rather than standard costing can lead to better decisions, acase study undertook of Anonymous Inc.
40 Vineeta Arora & G. Soral

Management Trends Vol. 10, No. 1-2 June-Dece - 2013
Manufacturing Anonymous inc. had purchased a large new plant. Its existingproduct base would use only 10% of the capacity of the new machine, so the sales forcewas asked to approach new customers to capture business that would utilize this plant.After diligent efforts, the sales people returned to the corporate office with several newopportunities that would be manufactured using the new plant. However, they were soontold the orders would not be accepted because the gross margin percentage for the ordersbased on standard cost accounting was only 16% - less than its target margin of 25%. Sothe controller decided to reject the orders.
After the controller had made the 'thumbs down' decision, the sales force decideto insight lean picture to uncover what impact these orders would really have. A statementarranged like this is called a 'plain English' or 'lean' financial statement. Table 1 to Table4 is showing summary of the statements.
Table 1: Traditional decision factors
Table 2: Lean Profit Statement for existing business
Table 3: Analysis of new order
Quoted price $30/unit
Standard cost $25/unit
Gross margin $5/unit
Gross margin % 16.67%
Current gross margin % 23%
Direct cost ($)
Shared cost ($) Total cost ($)
Sales
100,000 -- 100,000
Material
20,000 -- 80,000
Direct costs
18,000 -- 18,000
Shared cost
-- 39,000 39,000
Total 62,000
(39,000) 23,000
Incremental impact of new 10,000 units
Revenue 300,000
Material 60,000
Variable margin 240,000
Direct cost 40,000
Profit 200,000
Gross margin % 67%
Exploring the Role of Lean Accounting : A Step Ahead from Traditional Costing 41

Management Trends Vol. 10, No. 1-2 June-Dece - 2013
Table 4: Lean Profit Statement showing old and combined business
New total withLean profit statement of ex isting business 10,000 additional
units ($)s
Direct ($) Shared ($) Total ($)
Sales 100,000 -- 100,000 400,000
Material 20,000 -- 20,000 80,000
Variable margin 80,000 -- 80,000 320,000
Direct cost 18000 -- 18,000 58,000
Shared cost -- 39,000 39,000 39,000
Gross margin 62,000 (39,000) 23,000 223,000
Gross margin % 57.5%
Anonymous incorporated's controller had been used to seeing lean financialanalysis, he almost certainly would have approved the new orders. The advantages inprofit and margin would have been obvious, and the need to apply intuition would havebeen minimized - at least, relative to financial impact. So, finally new order has beenaccepted.
Conclusion:
While traditional statements may account for a fixed-dollar amount of overheadfor every dollar of inventory spent, lean accounting looks at these costs as variable,assessing the true costs of labor and overhead on a case-by-case basis. Statements shouldalso align with value-stream maps, visual representations of the end-to-end productionprocess which can give owners and executives a clear picture of their companies' financialsituations. Even though lean accounting can't replace traditional accounting practices,it can go further in helping owners and executives make accurate, informed businessdecisions. It's also a necessity for manufacturers who want to see the true financialeffects of their lean manufacturing initiatives. Lean accounting may not be right forevery organization, but manufacturers that are committed to and invested in leanmanufacturing practices should consider supporting them with simplified, leanaccounting processes.
References :
u Baggaley, B. and B. Maskell. (2003). Value stream management for lean companies,Part I. Journal of Cost Management (March/April): 23-27.
42 Vineeta Arora & G. Soral

Management Trends Vol. 10, No. 1-2 June-Dece - 2013
u Fullerton and Kennedy. (2009). Lean manufacturing: costing the value stream.Industrial Management & Data Systems. Vol. 113, issue 5
u Kennedy and Brewer. (2006). The Lean Enterprise and Traditional Accounting-Isthe honeymoon over? Journal of Corporate Accounting & Finance. Vol. 17
u Kennedy and Widener. (2008). Functional lean: A new approach for optimizing internalservice function value. Journal of Cost Management (July/August): 5-14.
u Maskell, B. H. and B. L. Baggaley. (2006). Lean accounting: What's it all about?Target Magazine 22(1): 35-43.
u Mahapatra, S S and Mohanty, S R. (2007). Lean manufacturing in continuous processindustry: An empirical study. Journal of Scientific and Industrial research, Vol.66.
u Manjunath H. S.; Bargerstock, Andrew (2011). Exploring the role of standard costingin lean manufacturing. Management Accounting Quarterly, Vol. 13.
u Ross Maynard, (2009). What is Lean Accounting. Chartered Institute of ManagementAccountants.
u Schiemann, W. and J. Brewton. (2009). Functional lean: A new approach for optimizinginternal service function value. Cost Management (July/August): 5-14.
u Staats, B. R. and D. M. Upton. (2011). Lean knowledge work: The "Toyota" principlescan also be effective in operations involving judgment and expertise. Harvard BusinessReview (October) : 100-110.
u Tracey, D. L. and J. E. Knight. 2008. Lean operations management: Identifying andbridging the gap between theory and practice. The Journal of American Academy ofBusiness 12(2): 8-14.
u Womack, J. P. and D. T. Jones. (1994). From lean production to the lean enterprise.Harvard Business Review (March-April): 93-103.
Exploring the Role of Lean Accounting : A Step Ahead from Traditional Costing 43
Management Trends Vol. 10, No. 1-2 June-Dece - 2013
Disclosure Pattern of Valuation Principles of RawMaterial Inventory in Indian manufacturing Industry
(Special reference to AS-2)
Abstract : The quality of corporate disclosure influences toa great extent the quality of investment decisions made byinvestors. Here, the accounting policies for the disclosurepattern of valuation principle of raw material are examinedin this paper. The consistency has been observed in all thesample units of different sectors regarding disclosure ofvaluation principle of raw material either at cost/NRV (M1)or lower of cost or NRV (M2) throughout the study periodexcept in case of Alok industry and Ranbaxy. We pointedout that a serious gap exists between theory and practice inmany sectors of Indian manufacturing industry. On theobservation of annual reports of consumer goods andautomobile sectors, it has been identified that very poordisclosure has been made. On an average only two thirdsample units (67.92%) have been disclosed either M1 orM2 valuation principles of raw material during entire studyperiod but it is mandatory to disclose the valuation principleof raw material as per AS-2. It means one third (32.08%) ofthe sample units did not think it prudent to disclose it tostakeholders during study period and did not follow the AS-2. On an average 35 sample units (out of fifty three) followedthe critical operative part of the Accounting standard-2(Revised) is that "inventories should be valued at the lowerof (a) Cost and (b) net realizable value". At 5% level ofsignificance our null hypothesis that all ten sectors ofmanufacturing industry having the same disclosure patternregarding valuation principle of raw material is rejected onthe basis of chi-square test.
Key words: Disclosure, Valuation principles, AccountingStandard-2, Raw material, Realizable Value
* Associate Professor, Department of Accountancy & Statistics, University College of Commerce& Management Studies, M. L. S. University, Udaipur, Rajasthan
** Lecturer, Department of Accountancy & Statistics, B.N.P.G. College, Udaipur
Shurveer S. Bhanawat*Abhay Jaroli**
44 Shurveer S.Bhanawat & Abhay Jaroli

Management Trends Vol. 10, No. 1-2 June-Dece - 2013
Introduction
The quality of corporate disclosure influences to a great extent the quality ofinvestment decisions made by investors. The survey conducted by different institutionsand researchers reveals that the material cost alone contributed about 60-65% of eithersales valve or total cost of the product6. On a save of rupee one ultimately increased theprofitability of the firm. Hence the raw material becomes a significant factor for theinvestors to take the decisions, Therefore a proper disclosure of valuation principle isneed of the hour. Singhvi and Desai developed a list of 34 items of information whichthey felt should be disclosed in annual reports for the purpose of measuring the quality ofdisclosure. Copeland and Frederick studied the extent to which changes in common stockoutstanding were disclosed in annual reports. Carpenter, Francia and strawser surveyedfour user groups in order to determine their perceptions of the importance of, andinformation deficiencies for, several problem areas in accounting. Strephen constructedof 38 items or types of financial and non financial information which might appear in anannual report. After examining the literature it is observed that research work which hasbeen done on the disclosure of items in general in annual report but no specific researchwork has been done except Manaswee K Samal regarding whether Indian manufacturingindustry disclose the all aspect of raw material in annual report which has been suggestedin AS-2 entitled "Valuation of Inventory." Samal studied confined with analysis ofdisclosure of different segments of inventory without formulating and testing the hypothesisafter considering only twenty two sample units. The present study is concentrated withsector-wise disclosure of principal of raw material only of fifty three companies of tensectors along with testing of the hypothesis. The critical operative part of the Accountingstandard-2 (Revised) is that "inventories should be valued at the lower of (a) Cost and (b)net realizable value". This standard requires an enterprise should disclose the accountingpolicies adopted in measuring or valuing inventories including the cost formula used andthe total carrying amount of inventories and its classification appropriate to the enterprise.Common classifications of inventories are raw materials and components, work in progress,finished goods, stores and spares and loose tools. Here an attempt has been made toexamine whether such disclosure is followed by sample units or not in relation to rawmaterial only. We are trying to point out the gap exists between theory and practice inmany sectors of Indian manufacturing industry.
Review of Literature
Peter Harris (2011) examines critically the many disadvantages of LIFO.Ultimately, the author theorizes that these negatives may collectively explain theobserved research findings of the inverse relationship between LIFO adoption and firmvalue/stock price. The elimination of LIFO which seems imminent may result in a win-win situation for all; as the negative and added costs of LIFO may well exceed its taxadvantage, resulting in greater cash flow for the firm, while allowing for thestandardization of worldwide accounting standards and raising additional tax revenuefor the US government.
Disclosure Pattern of Valuation Principles of Raw Material Inventory in Indian manufacturing Industry 45

Management Trends Vol. 10, No. 1-2 June-Dece - 2013
Bhanawat S. Shurveer (2010) explained in his article that the main factor whichcontributes to the cost of production is the cost of material. The results also reveal that onan average raw material cost as percentage of gross sales is 46.46% for Indianmanufacturing industry. In oil industry it was found 80.78%. Hence, it can be concludedthat raw material cost is a major part of cost structure and it should be properly valuedand disclosed in the annual report.
Bajpayee H.S., Srivastava, Anubha (2010) analyze the compliance of accountingstandards practices in India by various companies. So far as mandatory accountingstandards are concerned all the companies are complying with those all but in case ofoptional accounting standards there are some, which are disclosing full informationregarding their compliance with the accounting standards, and on the other hand there aresome companies which are clarifying the true picture. As a conclusion it could be saidthat that there must be uniformity in financial statement of companies in order to makeinter -firm and intra- firm comparison easy.
Samal K Manaswee (2005) states in his article that Inventory valuation plays asignificant role in reporting operating results, as well as the state of affairs of a businessentity. Empirical literature suggests that inventory valuation is one of the devices oftenresorted to smooth out a firm's operating results.. The findings suggest that the disclosureof accounting policies regarding inventory valuation in listed Indian companies is moreof a form than of substance, and there is ample scope for improvement in fixing thevaluation norms.
Tim Baldenius examines that the LIFO (last- in-first-out) inventory flow rule isshown to be preferable to the FIFO (first-in- first-out) rule for the purpose of aligningincentives. His analysis also finds support for the lower-of-cost-or-market inventoryvaluation rule in situations where the manager receives new information after the initialcontracting stage.
Ole-Kristian Hope (2003) investigates that there is relation between the accuracyof analysts' earnings forecasts and the level of annual report disclose, and between forecastaccuracy and the degree of enforcement of accounting standards. He documents thatfirm-level disclosures are positively related to forecast accuracy, suggesting that suchdisclosures provide useful information to analysts. He took sample from twenty twocountries.
Objective Sample Design
To examine the disclosure pattern of valuation principle of raw material inventoryin different sectors of Indian manufacturing industry with special reference to AccountingStandard-2
Hypothesis
There is no significance difference among the different sectors of Indianmanufacturing industry as regard to disclosure pattern of valuation principle of raw material
46 Shurveer S.Bhanawat & Abhay Jaroli

Management Trends Vol. 10, No. 1-2 June-Dece - 2013
inventory according to Accounting Standard-2 entitled "Valuation of Inventory" issuedby ICAI, New Delhi.
Sample Collection and Source of Data:
A sample of fifty three companies engaged in various manufacturing activities hasbeen selected for the purpose of present study. Sample has been chosen according tostratified random sampling technique. For this purpose 10 strata has been identified in theIndian manufacturing industry. Thereafter sample units have been selected on the randombasis in each strata. The selection of sample is not without reasons. It is partly to keep thestudy within manageable limits and resources. The required information on disclosure forsample units is collected from annual reports and websites of respective sample units.The number of companies varied (7.57% to 13.20%) among the industry groups. Table1provides Industry-wise strata of the sample units.
Table 1: Industry-Wise Classification of the Sample Units
S.N. Industry No. of Sample Units Percentage
1 Textile 05 11.32
2 Pharmaceutical 06 9.43
3 Cement 06 11.32
4 Automobile 05 7.57
5 Sugar 04 9.43
6 Consumer Goods & Durables 07 9.43
7 Electrical Equipments 05 13.20
8. Iron & Steel 06 7.57
9. Paper 05 11.32
10 Fertilizers and chemicals 04 9.43
Total 53 100
Techniques:
Statistical techniques like mean, standard deviation, coefficient of variation andchi-square test are used in the present research paper.
Period
A period of five years from 2007-2008 to 2011-2012 has been taken into accountfor the purpose of analyzing the disclosure pattern of valuation pattern of raw materialinventory in different sectors of manufacturing industry in India.
Disclosure Pattern of Valuation Principles of Raw Material Inventory in Indian manufacturing Industry 47
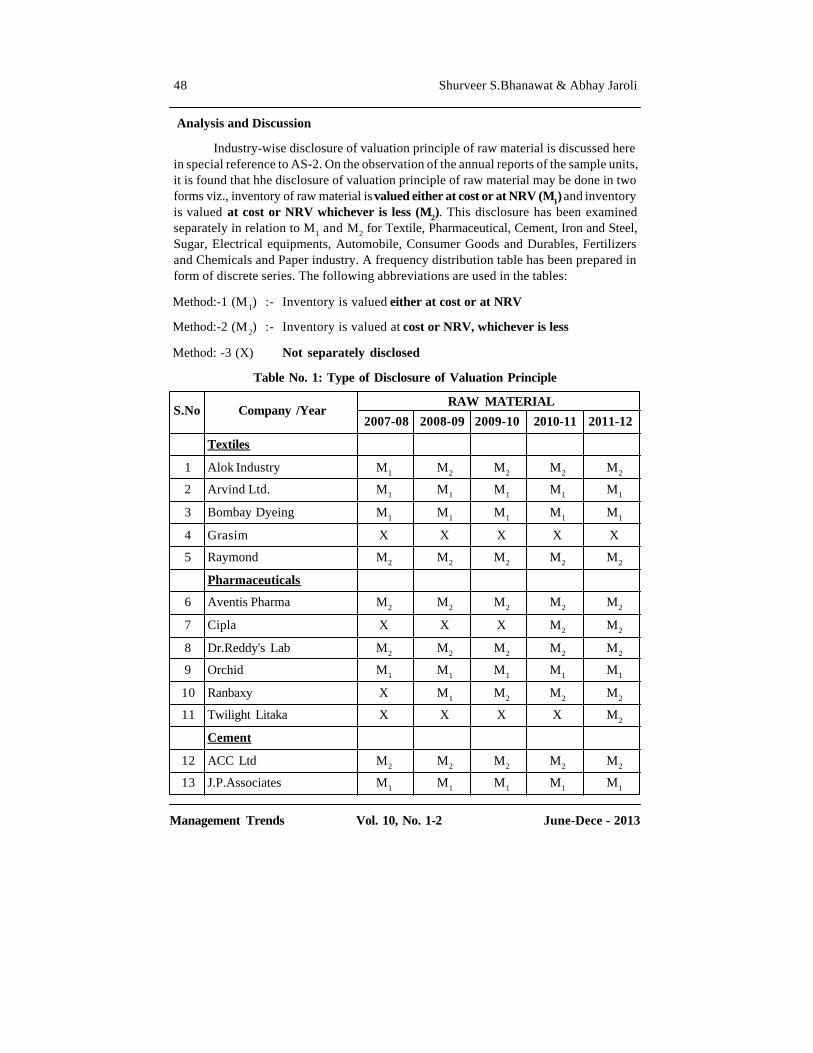
Management Trends Vol. 10, No. 1-2 June-Dece - 2013
Analysis and Discussion
Industry-wise disclosure of valuation principle of raw material is discussed herein special reference to AS-2. On the observation of the annual reports of the sample units,it is found that hhe disclosure of valuation principle of raw material may be done in twoforms viz., inventory of raw material is valued either at cost or at NRV (M1) and inventoryis valued at cost or NRV whichever is less (M2). This disclosure has been examinedseparately in relation to M1 and M2 for Textile, Pharmaceutical, Cement, Iron and Steel,Sugar, Electrical equipments, Automobile, Consumer Goods and Durables, Fertilizersand Chemicals and Paper industry. A frequency distribution table has been prepared inform of discrete series. The following abbreviations are used in the tables:
Method:-1 (M1) :- Inventory is valued either at cost or at NRV
Method:-2 (M2) :- Inventory is valued at cost or NRV, whichever is less
Method: -3 (X) Not separately disclosed
Table No. 1: Type of Disclosure of Valuation Principle
RAW MATERIALS.No Company /Year
2007-08 2008-09 2009-10 2010-11 2011-12
Textiles
1 Alok Industry M1 M2 M2 M2 M2
2 Arvind Ltd. M1 M1 M1 M1 M1
3 Bombay Dyeing M1 M1 M1 M1 M1
4 Grasim X X X X X
5 Raymond M2 M2 M2 M2 M2
Pharmaceuticals
6 Aventis Pharma M2 M2 M2 M2 M2
7 Cipla X X X M2 M2
8 Dr.Reddy's Lab M2 M2 M2 M2 M2
9 Orchid M1 M1 M1 M1 M1
10 Ranbaxy X M1 M2 M2 M2
11 Twilight Litaka X X X X M2
Cement
12 ACC Ltd M2 M2 M2 M2 M2
13 J.P.Associates M1 M1 M1 M1 M1
48 Shurveer S.Bhanawat & Abhay Jaroli

Management Trends Vol. 10, No. 1-2 June-Dece - 2013
14 India Cement M1 M1 M1 M1 M1
15 J.K.Cement X X X X X
16 Shree Cement M1 M1 M1 M1 M1
17 Ultratech X X X X X
Automobiles
18 Bajaj Auto M2 M2 M2 M2 M2
19 Hero Honda M2 M2 M2 M2 M2
20 Mahindra & Mahindra X X X X X
21 Maruti X X X X X
22 TVS X X X X X
Sugar
23 Bajaj Hindustan M2 M2 M2 M2 M2
24 Balrampur Chinni X X X X X
25 Renuka Sugar M2 M2 M2 M2 M2
26 Triveni Engg. & Inds. M2 M2 M2 M2 M2
Consumer Goods &Durables
27 BPL X X X X X
28 Colgate M2 M2 M2 M2 M2
29 Emami X X X X X
30 HUL X X X X X
31 ITC X X X X X
32 Videocon Inds. X X X X X
33 MIRC Elec. M1 M1 M1 M1 M1
Heavy Electrical equipments
34 BHEL M2 M2 M2 M2 M2
35 Siemens M2 M2 M2 M2 M2
36 ABB M2 M2 M2 M2 M2
37 Crompton Greaves M1 M1 M1 M1 M1
38 Thermax M2 M2 M2 M2 M2
Disclosure Pattern of Valuation Principles of Raw Material Inventory in Indian manufacturing Industry 49
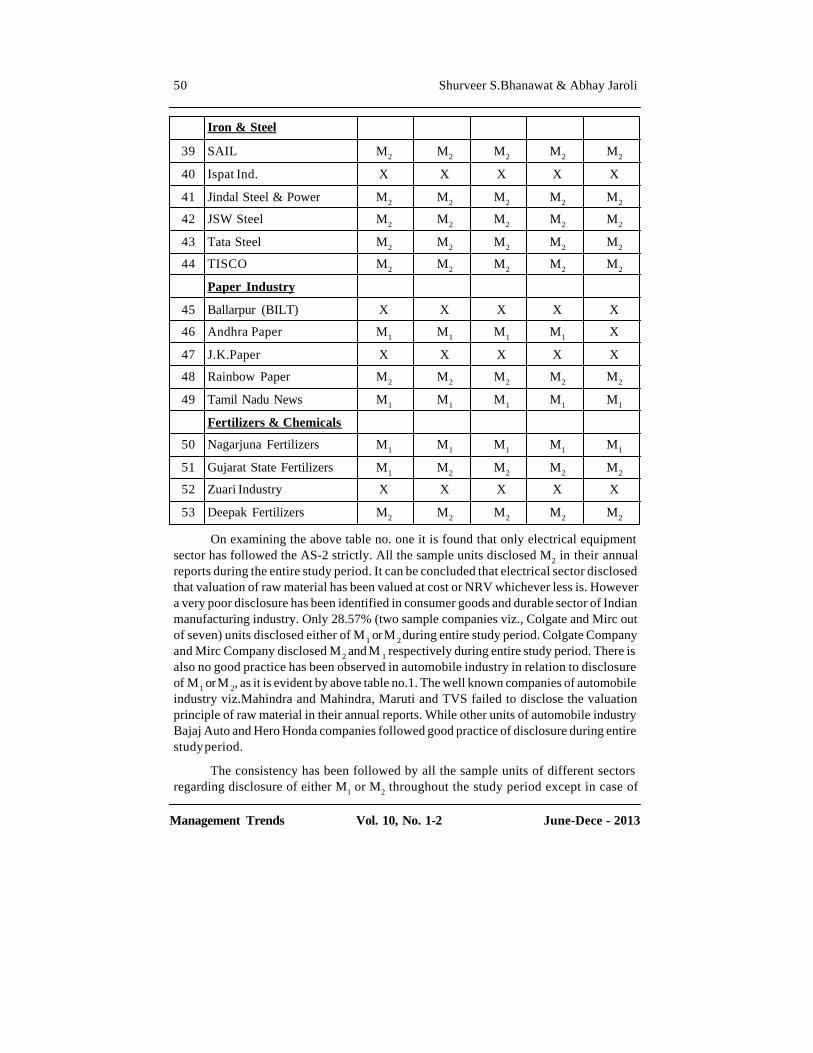
Management Trends Vol. 10, No. 1-2 June-Dece - 2013
Iron & Steel
39 SAIL M2 M2 M2 M2 M2
40 Ispat Ind. X X X X X
41 Jindal Steel & Power M2 M2 M2 M2 M2
42 JSW Steel M2 M2 M2 M2 M2
43 Tata Steel M2 M2 M2 M2 M2
44 TISCO M2 M2 M2 M2 M2
Paper Industry
45 Ballarpur (BILT) X X X X X
46 Andhra Paper M1 M1 M1 M1 X
47 J.K.Paper X X X X X
48 Rainbow Paper M2 M2 M2 M2 M2
49 Tamil Nadu News M1 M1 M1 M1 M1
Fertilizers & Chemicals
50 Nagarjuna Fertilizers M1 M1 M1 M1 M1
51 Gujarat State Fertilizers M1 M2 M2 M2 M2
52 Zuari Industry X X X X X
53 Deepak Fertilizers M2 M2 M2 M2 M2
On examining the above table no. one it is found that only electrical equipmentsector has followed the AS-2 strictly. All the sample units disclosed M2 in their annualreports during the entire study period. It can be concluded that electrical sector disclosedthat valuation of raw material has been valued at cost or NRV whichever less is. Howevera very poor disclosure has been identified in consumer goods and durable sector of Indianmanufacturing industry. Only 28.57% (two sample companies viz., Colgate and Mirc outof seven) units disclosed either of M 1 or M 2 during entire study period. Colgate Companyand Mirc Company disclosed M2 and M 1 respectively during entire study period. There isalso no good practice has been observed in automobile industry in relation to disclosureof M1 or M 2, as it is evident by above table no.1. The well known companies of automobileindustry viz.Mahindra and Mahindra, Maruti and TVS failed to disclose the valuationprinciple of raw material in their annual reports. While other units of automobile industryBajaj Auto and Hero Honda companies followed good practice of disclosure during entirestudy period.
The consistency has been followed by all the sample units of different sectorsregarding disclosure of either M1 or M2 throughout the study period except in case of
50 Shurveer S.Bhanawat & Abhay Jaroli

Management Trends Vol. 10, No. 1-2 June-Dece - 2013
Alok industry and Ranbaxy. These companies are shifted once from M 1 to M2 and thereafterconsistency has been maintained. In accordance with AS-1 disclosure must include changesif any, but here no disclosure is made in the annual report of Alok industry and Ranbaxyfor switching from M1 to M2 in 2009-10. Cipla and Twilight Litaka had started to discloseM2 from 2010-11 and 2011-12 respectively. It can be concluded that Indian manufacturingindustry also followed the consistency which is the basic fundamental accountingassumption given in AS-1. Sixteen companies out of fifty three sample units never disclosedM1 or M2 during entire study period i.e. 2007-08 to 2011-12. These sample units aresilent regarding disclosure of valuation principle of raw material. Out of fifty three sampleunits eleven units disclosed M1 method i.e. raw material is valued either at Cost or NRVand thirty nine (50.9%) units disclosed m2 method and three units disclosed mix methodof either m1 & m2. It clearly indicates that maximum sample units followed the criticaloperative part of the Accounting standard-2 (Revised) is that "inventories should be valuedat the lower of (a) Cost and (b) net realizable value".
Table No. 2: Disclosing sample units for different years in respect of aluationprinciples of Raw Material
The above table of year wise classification of M1 and M2 shows that the highestdegree (67.92% of sample size) of disclosure has been found in the year 2010-11 &2011-12 regarding valuation principal of raw material separately. On an average twothird sample units (67.92%) have been disclosed either m1 or m2 valuation principles ofraw material during entire study period. It means one third (32.08%) of the sample unitsdid not think it prudent to disclose it to stakeholders during study period. On examine theabove table it is noticed that on an average 23.01% (12.2 out of 53) sample units aredisclosing the M 1 and 43.77% of the sample units disclosed M2 and again it is not knownexactly whether inventory of raw material has been valued either at cost or NRV.
In order to check out the variation between disclosure practice of M1 and M2methods coefficient of variation (C.V) has been calculated. There is more inconsistency
Year 2007-08 2008-09 2009-10 2010-11 2011-12 %
Type of
Disclosers No. % No. % No. % No. % No. % Mean c.v.
M1
Disclosures 13 24.53 13 24.53 12 22.64 12 22.64 11 20.75 12.2 6.8578
M2
Disclosures 21 39.62 22 41.51 23 43.40 24 45.28 25 47.17 23.20 7.71058
Total 34 64.15 35 66.04 35 66.04 36 67.92 36 67.92 35.4 3.22083
Non
Disclosure 19 35.85 18 33.96 18 33.96 17 32.08 17 32.08 17.6 6.4782
Total 53 100 53 100 53 100 53 100 53 100
Disclosure Pattern of Valuation Principles of Raw Material Inventory in Indian manufacturing Industry 51

Management Trends Vol. 10, No. 1-2 June-Dece - 2013
has been observed in case of M2 as compared to M1 during entire study period as it isevident by having higher C.V (7.71058%) of M2. IN other words, there is uniformity ofdisclosure pattern of raw material in M1 during five years of period as compare to M2.
Intra Sector Comparison
Table No. 3: Disclosure Sample Units
Year 2007-08 2008-09 2009-10 2010-11 2011-12
Industrial No. % No. % No. % No. % No. % Mean C.V.Sector
Textiles 4 80 4 80 4 80 4 80 4 80 80 0
Pharmaceuticals 3 50 4 67 4 67 5 83 6 100 73 0.25
Cement 4 67 4 67 4 67 4 67 4 67 67 0
Automobiles 2 40 2 40 2 40 2 40 2 40 40 0
Sugar 3 75 3 75 3 75 3 75 3 75 75 0
Fertilizers & ch. 3 75 3 75 3 75 3 75 3 75 75 0
Consumer 2 29 2 29 2 29 2 29 2 29 29 0
Heavy Electrical 5 100 5 100 5 100 5 100 5 100 100 0
Iron & Steel 5 83 5 83 5 83 5 83 5 83 83 0
Paper Industry 3 60 3 60 3 60 3 60 2 40 56 0.15
Total 34 58.49 35 62.26 35 62.26 36 62.26 36 64.15 61.88 0.03
Average 65.9 67.6 67.6 69.2 68.9
C.V. 21.450 20.711 20.711 21.27 24.94
Table 3 indicates number of companies who disclosed the principle of valuationof raw material inventory in different sector as per the requirement of AS-2. Heavy electricalequipments sector is only sector in which all sample units disclosed principle of valuationof raw material in their annual reports consistently during entire period as it is evident byC.V i.e. zero. The lowest disclosure has been reported by Consumer goods & durables,on an average only 29% sample units feel disclosure of principal of raw material isnecessary in the interest of various stakeholders. Only three sectors viz., Automobile,Consumer goods and Paper sectors did not maintain the industrial average of disclosingunits i.e. 61.884% as regard to disclosure practice in Indian manufacturing industry. Onlytwo sectors viz., Pharmaceutical and Paper industry reported C.V. 0.2575 and 0.15971respectively. It indicates that there is less uniformity in disclosure pattern in these sectorsas compared to other sectors of the manufacturing industry. On an average in all over theyears almost two third units of sample units are disclosed principal of valuation of raw
52 Shurveer S.Bhanawat & Abhay Jaroli
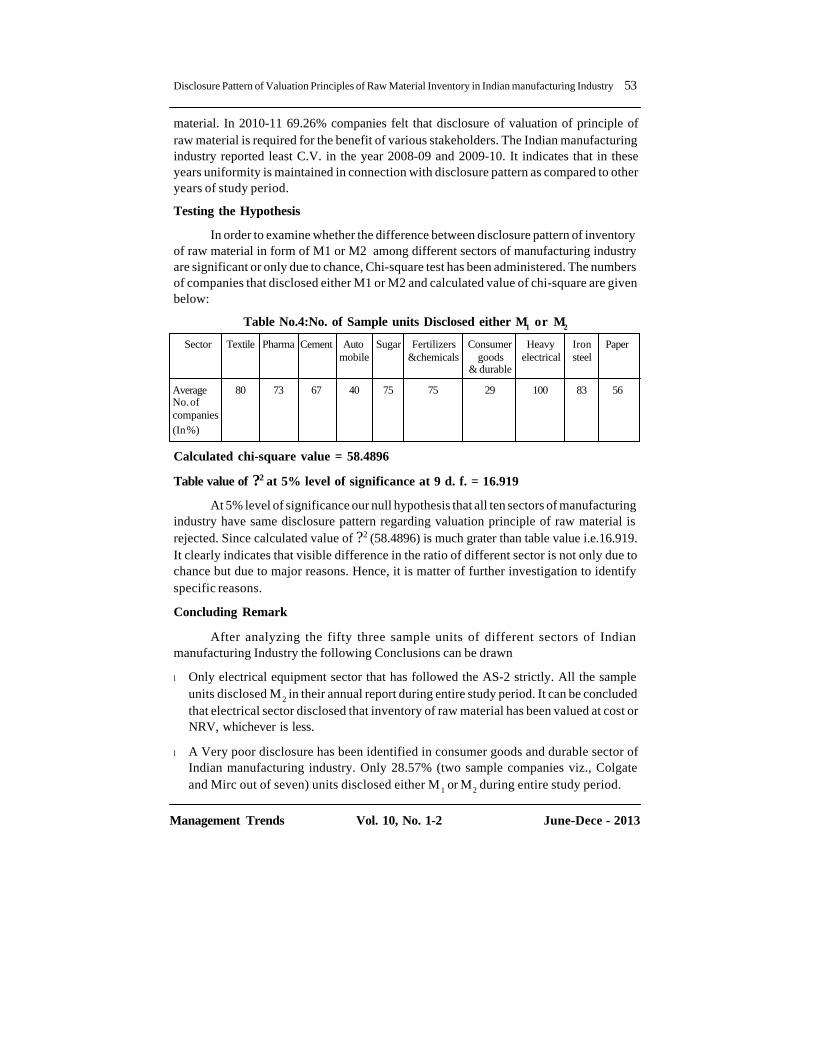
Management Trends Vol. 10, No. 1-2 June-Dece - 2013
material. In 2010-11 69.26% companies felt that disclosure of valuation of principle ofraw material is required for the benefit of various stakeholders. The Indian manufacturingindustry reported least C.V. in the year 2008-09 and 2009-10. It indicates that in theseyears uniformity is maintained in connection with disclosure pattern as compared to otheryears of study period.
Testing the Hypothesis
In order to examine whether the difference between disclosure pattern of inventoryof raw material in form of M1 or M2 among different sectors of manufacturing industryare significant or only due to chance, Chi-square test has been administered. The numbersof companies that disclosed either M1 or M2 and calculated value of chi-square are givenbelow:
Table No.4:No. of Sample units Disclosed either M1 or M2
Sector Textile Pharma Cement Auto Sugar Fertilizers Consumer Heavy Iron Papermobile &chemicals goods electrical steel
& durable
Average 80 73 67 40 75 75 29 100 83 56No. ofcompanies(In %)
Calculated chi-square value = 58.4896
Table value of ?2 at 5% level of significance at 9 d. f. = 16.919
At 5% level of significance our null hypothesis that all ten sectors of manufacturingindustry have same disclosure pattern regarding valuation principle of raw material isrejected. Since calculated value of ?2 (58.4896) is much grater than table value i.e.16.919.It clearly indicates that visible difference in the ratio of different sector is not only due tochance but due to major reasons. Hence, it is matter of further investigation to identifyspecific reasons.
Concluding Remark
After analyzing the fifty three sample units of different sectors of Indianmanufacturing Industry the following Conclusions can be drawn
l Only electrical equipment sector that has followed the AS-2 strictly. All the sampleunits disclosed M2 in their annual report during entire study period. It can be concludedthat electrical sector disclosed that inventory of raw material has been valued at cost orNRV, whichever is less.
l A Very poor disclosure has been identified in consumer goods and durable sector ofIndian manufacturing industry. Only 28.57% (two sample companies viz., Colgateand Mirc out of seven) units disclosed either M 1 or M2 during entire study period.
Disclosure Pattern of Valuation Principles of Raw Material Inventory in Indian manufacturing Industry 53

Management Trends Vol. 10, No. 1-2 June-Dece - 2013
l The well known companies of automobile industry viz.Mahindra and Mahindra,Maruti and TVS failed to disclose the valuation principle of raw material in theirannual reports. While other sample units of automobile industry viz., Bajaj Autoand Hero Honda companies followed good practice of disclosure during entirestudy period.
l On an average two third sample units (67.92%) have been disclosed either m1 orm2 valuation principles of raw material during entire study period. It means onethird (32.08%) of the sample units did not think it prudent to disclose it tostakeholders during study period.
l There is a more inconsistency has been observed in case of M 2 as compared to M 1
during entire study period, it is evident by having higher C.V (7.71058%) of M2. Itindicates that there is uniformity of disclosure pattern of raw material in M1 duringfive years of period as compare to M2.
l At 5% level of significance our null hypothesis that all ten sectors of manufacturingindustry have same disclosure pattern regarding valuation principle of raw materialis rejected. Since calculated value of ?2 (58.4896) is much grater than table valuei.e.16.919
References :
1. Bajpayee H.S., Srivastava, Anubha,,"An empirical study of disclosure practicesof accounting standards in India" Foundation for organisation research andeducation, jan. 2010,Vol. 28, No. 1.
2. Bhanawat S. Shurveer, "An Analysis of Raw Material Cost in IndianManufacturing Industries", The IUP Journal of Accounting Research and AuditPractices, The Icfai University Press, Hyderabad, July 2010, pp65-80.
3. Carpenter Charles G, Francia Arthur J and strawser H Robert.1971. Perceptionof financial Reporting Practice: An Empirical study. MSU Business Topics,autumn, pp56-62.
4. Copeland Ronald M and Frederick William. Extent of disclosure. Journal ofAccounting Research (spring)1968 .pp106-13.
5. Ole-Kristian Hope; "Disclosure Practices, Enforcement of Accounting Standards,and Analysts' Forecast Accuracy: An International Study." Journal of AccountingResearch, 2003, vol.41, issued 2, pages 235-272
6. Peter Harris, "Should Last in First Out Inventory Valuation Methods BeEliminated?" Global Journal of Business Research, 2011, Vol. 5. No. 4, pp. 53-67.
54 Shurveer S.Bhanawat & Abhay Jaroli

Management Trends Vol. 10, No. 1-2 June-Dece - 2013
7. Samal K Manaswee. An Empirical Study of Inventory Valuation And DisclosurePractices in Listed Indian Companies. The ICFAI Journal of Accounting Research.October 2005.pp 7-35
8. Singhvi Surendra S and Desai harsha B. An empirical Analysis of the Quality ofCorporate Financial Disclosure, JSTOR. The Accounting Review, 1971.vol.46,no.1,Jan.pp 129-138.
9 . Stephen l Buzby. Selected items of Information and Their Disclosure inAnnual Reports. The Accounting Review, July1974, Vol. XLIX,. No.3 ,pp423-435
10. Tim Baldenius,"Incentives for Efficient Inventory Management: The Role ofHistorical Cost" Management Science, Forthcoming, July, 2005, Vol. 51, No. 7,pp. 1032-45.
Disclosure Pattern of Valuation Principles of Raw Material Inventory in Indian manufacturing Industry 55

Management Trends Vol. 10, No. 1-2 June-Dece - 2013
Influence of Effectiveness of Leadership on Satisfactionof Leadership in Public and Private Insurance Sectors
Dasari Pandurangarao*
Gella Sireesha**
Devarapalli Rajasekhar***
* Assistant professor, Department of MBA, St.Ann's Engineering College, Chirala, AndhraPradesh, India-523187. Email: [email protected]
** Assistant professor, Department of MBA, St.Ann's College of Engineering & Technology,Chirala, Andhra Pradesh, India-523187. Email: [email protected]
*** Research Scholar, Department of commerce and business administration, Acharaya NagarjunaUniversity, Guntur. Email: [email protected]
Abstact : This paper studies the perception of leadershipstyles and Influence of effectiveness of leadership in publicand private insurance sectors. A sample of 300 employeesof public insurance sector (Life Insurance Corporation ofIndia) and 300 employees of private insurance sectors (ICICIPrudential Life Insurance) was taken for the purpose of thestudy. The coastal districts of Andhra Pradesh such asGuntur, Krishna, Nellore and Prakasam have beenpurposively selected for the present study. In public insurancesector employee's suggestions are not considered and alsono time for them, employees are informed about what has tobe done and how to do it but private insurance sectorsemployee ideas and input are sought for an upcoming plansand projects, employees are informed about what has to bedone and how to do it.
KEY WORDS : Effectiveness, Influence, Insurance,Leadership, and Satisfaction.
INTRODUCTION:
In this complex environment no single leader can be effective unless he hasknowledge, ability to envision, plan and achieve social, political or organizational goals.Modern leadership demands collaboration with many people each of whom has specialskills, knowledge and expertise that generate unique insights and perspectives. One ofthe crucial jobs of a leader is to foster open communication among his collaborators andinvolve them in decision-making at all levels. To function effectively employees shouldfeel free to participate, providing information, giving advice and expressing dissent. Oftenemployees do not feel free to speak of their minds when there is asymmetry of power notonly in organizations but also in public dialogue.
56 Dasari Pandurangarao, Gella Sireesha & Devarapalli Rajasekhar

Management Trends Vol. 10, No. 1-2 June-Dece - 2013
Effectiveness of leadership covers the interpersonal relations among employees,strategy formulation, involvement, adaptability, decision making process, learning process,organizational behavior, opportunities for career development, work culture, innovativeways of doing things, empowerment, enhancing productivity of employees, personalitydevelopment of employees, creating positive attitude among employees, ethical valuesand effective communication.
LITERATURE REVIEW:
Bagheri and Pihie, (2009), found that entrepreneurial leadership development inthat learning entrepreneurial leadership capabilities occurred in a process of experienceand social interaction through which students recognized the opportunities for theirpersonal development as well as business creation. Moreover, the knowledge acquiredfrom experience and social interaction was transformed through a process of reflection,particularly on failures, to adopt entrepreneurial behaviours and solved the problems ofnew situations. Laohavichien, et. al., (2009) found that organizations paid more attentionon the transactional and transformational leadership. The behaviour of both leadershipstyles considered strong determinant of organization success. It also concluded thattransformational leadership had higher effect than transactional leadership for qualityimprovement in the organizations. Woodbine and Liu (2010) in concluded that moralbehaviour, motivation, achievement oriented approach, experience, knowledge, directiveand participative approach, supportive in nature and situational factors were influencingthe leadership styles.
Barratt and Korac-Kakabadse (2002) argued that many leaders did not seemto address issues beyond short-term profitability, and therefore the time componentwas crucial in the evaluation of leadership effectiveness. Timely leadershipeffectiveness may be divided into three different leadership orientations. Theseleadership orientations depended on whether the organizational performance wasderived from today's, yesterdays or tomorrow's corporate decision-making andbusiness behaviour.
Chen, et. al., (2008) found that diversified leadership roles influenced bothleadership effectiveness and team trust; both leadership effectiveness and propensity totrust influenced team trust, and team trust in turn directly impacted team effectiveness. Inaddition, team trust mediated the relationship between leadership effectiveness and teameffectiveness.
Rice (2010) concluded that principals with the experience and skills found to berelated to effectiveness were less likely to be working in high-poverty and low-achievingschools, raising equity concerned about the distribution of effective principals. Besides,the quality of a principal affected a range of school outcomes including teachers' satisfactionand their decisions about where to work, parents' perceptions about the schools theirchildren attend and, ultimately, the academic performance of the school
Influence of Effectiveness of Leadership on Satisfaction of Leadership in Public and Private Insurance Sectors 57

Management Trends Vol. 10, No. 1-2 June-Dece - 2013
Abbasi et. al., (2011), found that significance of leadership, performancemanagement and employee involvement in context of TQM for gaining the competitivebenefit. Constant, clear and quality leadership was necessary for success. Therefore itwas required that quality leadership should be deemed as a strategic aim of the organization.Quality in today's era was the continuous improvement therefore needed change atcontinuous basis. Change cannot be carried out without effective leadership which providedsteadfastness and persistence against the confrontation to the change inside an organization.
METHODOLOGY AND SAMPLING:
Sample Design:
The secondary and primary data are collected from the sources of the selectedorganizations in public and private sectors, this viz., Life Insurance Corporation of India(LIC) and ICICI Prudential Life Insurance and their employees covering the districts ofCoastal Andhra in Andhra Pradesh. The LIC in public sector and the ICICI PrudentialLife Insurance in private sector are purposively selected for the study due to familiarityof the researcher. The leadership in selected public and private sector was analyzed bycollecting the data from LIC and ICICI Prudential Life Insurance from four districts ofcoastal Andhra of Andhra Pradesh namely, Nellore, Prakasam, Krishna and Guntur witha sample size of 600.
Methodology:
In order to study perception of leadership styles, satisfaction of leadership andrating of overall leadership of both public and private insurance sectors, t-test and WeightedMean has been applied and the multiple linear regressions by Ordinary Least Square(OLS) estimation used to assess the influence of effectiveness of leadership styles onsatisfaction of leadership.
Research Hypotheses:
First Hypothesis: There is no significant difference in perception of leadership stylesamong the employees in public and private sector
Second Hypothesis: There is no significant difference in satisfaction of leadership betweenpublic and private sector
Third Hypothesis: There is no significant difference in rating of overall leadership betweenpublic and private sector
Fourth Hypothesis: There is no significant difference in the influence of effectiveness ofleadership on satisfaction of leadership styles in public and private sector
RESULTS AND DISCUSSION:
First Research Hypothesis Test:
H1: There is no significant difference in perception of leadership styles among theemployees in public and private sector
58 Dasari Pandurangarao, Gella Sireesha & Devarapalli Rajasekhar
Management Trends Vol. 10, No. 1-2 June-Dece - 2013
. The leadership styles regarding decision making, participation of employees,communication of vision, setting of priorities to employees, delegation of authority,leadership power, process of monitoring, motivational practices, encouraging creativityin employees in LIC and ICICI Prudential Life Insurance were analyzed by working outweighted mean and t-test and the results are presented in Table-1
Table -1:
In LIC, employee's suggestions are not considered and also no time for them,employees are informed about what has to be done and how to do it, new hires arenot allowed to make any decisions unless it is approved by leader, leader closelymonitors employees to ensure they are performing correctly, leader likes the powerthat his leadership position holds over subordinates, leader likes to use his leadershippower to help subordinates grow, employees must be directed or threatened withpunishment in order to get them to achieve the organizational objectives andemployees seek mainly security can are almost always true as perceived by theemployees in the LIC.
E-mails, memos or voice mails are sent to get the information and the meeting iscalled very rarely. Employees are then expected to act upon the information, leaderdelegates tasks in order to implement a new procedure or process, when there aredifferences in role expectations, leader works with them to resolve the differences,employees have the right to determine their own organizational objectives and Employeescan lead themselves just as well as leader can are frequently true as perceived by theemployees in the LIC.
The results indicate that it is always tried to include one or more employees indetermining what to do and how to do it, employees always vote whenever a major decisionhas to be made, leader asks employees for their vision of where they see their jobs goingand then use their vision where appropriate, workers know more about their jobs than me,so leader allows them to carry out the decisions to do their job, when something goeswrong, leader tells employees that a procedure is not working correctly and he establishesa new one, leader allows employees to set priorities with his guidance, employees willexercise self-direction if they are committed to the objectives and employees know howto use creativity and ingenuity to solve organizational problems are occasionally true asperceived by the employees in the LIC.
From the table, it is observed that it is always retained the final decision makingauthority within the department or team, employee ideas and input are sought for anupcoming plans and projects, for a major decision to pass in my department, it must havethe approval of each individual or the majority, when things go wrong and there is a needto create a strategy to keep a project or process running on schedule, by calls a meeting toget employee's advice, environment is created where the employees take ownership ofthe project and allow them to participate in the decision making process, employees are
Influence of Effectiveness of Leadership on Satisfaction of Leadership in Public and Private Insurance Sectors 59

Management Trends Vol. 10, No. 1-2 June-Dece - 2013
allowed to determine what needs to be done and how to do it, each individual is responsiblefor defining their job and leader likes to share his leadership power with my subordinatesare seldom true as perceived by the employees in the LIC.
In ICICI Prudential Life Insurance, the results indicate that employee ideas andinput are sought for an upcoming plans and projects, employees are informed about whathas to be done and how to do it, leader asks employees for their vision of where they seetheir jobs going and then use their vision where appropriate, leader delegates tasks inorder to implement a new procedure or process, leader closely monitors employees toensure they are performing correctly, leader likes the power that his leadership positionholds over subordinates, leader likes to use his leadership power to help subordinatesgrow and Employees seek mainly security are almost always true as perceived by theemployees in the ICICI Prudential Life Insurance.
From the results, it is observed that it is always retained the final decision makingauthority within the department or team, it is always tried to include one or moreemployees in determining what to do and how to do it, when things go wrong and thereis a need to create a strategy to keep a project or process running on schedule, by callsa meeting to get employee's advice, employees are allowed to determine what needs tobe done and how to do it, new hires are not allowed to make any decisions unless it isapproved by leader, workers know more about their jobs than me, so leader allowsthem to carry out the decisions to do their job, leader allows employees to set prioritieswith his guidance, when there are differences in role expectations, leader works withthem to resolve the differences, employees must be directed or threatened withpunishment in order to get them to achieve the organizational objectives, employeeswill exercise self-direction if they are committed to the objectives, employees have theright to determine their own organizational objectives, employees know how to usecreativity and ingenuity to solve organizational problems and employees can leadthemselves just as well as leader can are frequently true as perceived by the employeesin the ICICI Prudential Life Insurance.
Employees always vote whenever a major decision has to be made, for a majordecision to pass in my department, it must have the approval of each individual or themajority, E-mails, memos or voice mails are sent to get the information and the meetingis called very rarely. Employees are then expected to act upon the information,environment is created where the employees take ownership of the project and allowthem to participate in the decision making process, when something goes wrong, leadertells employees that a procedure is not working correctly and he establishes a new one,each individual is responsible for defining their job and leader likes to share hisleadership power with my subordinates are occasionally true as perceived by theemployees in the ICICI Prudential Life Insurance and employee's suggestions are notconsidered and also no time for them is seldom true as perceived by the employees inthe ICICI Prudential Life Insurance.
60 Dasari Pandurangarao, Gella Sireesha & Devarapalli Rajasekhar

Management Trends Vol. 10, No. 1-2 June-Dece - 2013
The t-value of 84.146 is significant at one per cent level indicating that there is asignificant difference in perception of leadership styles among the employees in LIC andICICI Prudential Life Insurance. Hence, the null hypothesis of there is no significantdifference in perception of leadership styles among the employees in public and privatesector is rejected.
Second Research Hypothesis Test:
H1: There is no significant difference in satisfaction of leadership between public andprivate sector
The employee perception on the overall satisfaction of leadership in LIC andICICI Prudential Life Insurance are analyzed and the results are presented in Table-2
Table -2:
In LIC, the results show that about 68.00 per cent of the employees are satisfiedwith leadership followed by neutral (17.33 per cent), dissatisfied (10.67 per cent) andhighly satisfied (4.00 per cent).In ICICI Prudential Life Insurance, it is observed thatabout 66.67 per cent of the employees are satisfied with leadership followed by neutral(20.00 per cent) and highly satisfied and dissatisfied (6.67 per cent).The t-value of 11.528is significant at one per cent level indicating that there is a significant difference insatisfaction of leadership between LIC and ICICI Prudential Life Insurance. Therefore,the null hypothesis of there is no significant difference in satisfaction of leadership betweenpublic and private sector is rejected.
Third Research Hypothesis Test:
H1: There is no significant difference in rating of overall leadership between public andprivate sector
The rating of overall leadership in LIC and ICICI Prudential Life Insurance areanalyzed and the results are presented in Table-3
Table -3:
In LIC, the results indicate that about 40.00 per cent of the employees feel that theoverall leadership is good followed by bad (28.00 per cent), ok (22.67 per cent) and verygood (9.33 per cent).In ICICI Prudential Life Insurance, it is apparent that about 47.34per cent of the employees feel that the overall leadership is good followed by very good(19.33 per cent), bad(18.00 per cent) and ok(15.33per cent).The t-value of 9.764 issignificant at one per cent level indicating that there is a significant difference in rating ofoverall leadership between LIC and ICICI Prudential Life Insurance. Hence, the nullhypothesis of there is no significant difference in rating of overall leadership betweenpublic and private sector is rejected.
Research Hypothesis Test:
H1: There is no significant difference in the influence of effectiveness of leadership onsatisfaction of leadership styles in public and private sector
Influence of Effectiveness of Leadership on Satisfaction of Leadership in Public and Private Insurance Sectors 61

Management Trends Vol. 10, No. 1-2 June-Dece - 2013
Influence of effectiveness of leadership on satisfaction of leadership in LIC:
In order to assess the influence of effectiveness of leadership styles on satisfactionof leadership in LIC, the multiple linear regression by Ordinary Least Square (OLS)estimation and the results are presented in Table-4. The results indicate that the coefficientof multiple determinations (R2) is 0.68 and adjusted R2 is 0.64 indicating that the regressionmodel is good fit.
Table-4:
The results show that organizational climate, comfortability and developmentare positively influencing the satisfaction of leadership styles at one per cent level ofsignificance, while interpersonal relationship and involvement are also positivelyinfluencing the satisfaction of leadership styles at five cent level of significance inLIC.
Influence of effectiveness of leadership on satisfaction of leadership in ICICIPrudential
Life Insurance:
In order to assess the influence of effectiveness of leadership on satisfaction ofleadership in ICICI Prudential Life Insurance, the multiple linear regressions by OrdinaryLeast Square (OLS) estimation and the results are presented in Table-5. The results showthat the coefficient of multiple determinations (R2) is 0.64 and adjusted R2 is 0.59 indicatingthat the regression model is good fit.
Table-5:
The results show that organizational climate, welfare and improvement arepositively influencing the satisfaction of leadership styles at one per cent level ofsignificance, while comfortability and career opportunities are also positively influencingthe satisfaction of leadership styles at five cent level of significance in ICICI PrudentialLife Insurance.
The null hypothesis is defined as there is no significant difference in the influenceof effectiveness of leadership on satisfaction of leadership in public and private sector.The factors such as organizational climate, comfortability, interpersonal relations andinvolvement are positively affect the satisfaction of leadership in public sector. In privatesector the influencing factors of effectiveness of leadership on satisfaction of leadershipin organization are through organizational climate, welfare, career opportunities andimprovement. There are differences in the influencing factors of effectiveness of leadershipon satisfaction of leadership in public and private sector.
Therefore, the null hypothesis of there is no significant difference in the influenceof effectiveness of leadership on satisfaction of leadership styles in public and privatesector is rejected.
62 Dasari Pandurangarao, Gella Sireesha & Devarapalli Rajasekhar
Management Trends Vol. 10, No. 1-2 June-Dece - 2013
Findings:
In Public sector the leadership improves the interpersonal relation between theemployees, and leadership resolves the strategic differences with management are highlyeffective. Leadership is molding a staff, leadership helps in follow-through the functions,leadership eases the adaptability by the employees, leadership contributes significantlyin employee's development, leadership increases the employee's commitment to theorganization, leadership decides the training and development needs of the employees,leadership gives and expects the responsibility from the employees, leadership maintainsdiscipline of the employees, leadership creates the positive attitude among the employeesabout their work and organization and leadership creates the awareness among theemployees about their works and changes are effective as perceived by the employees inpublic sector. The results also indicate that leadership creates overdependence, leadershipresolves the strategic differences with management, leadership increases the involvementof the employees, leadership provides consistency, leadership helps in formation of themission statements, leadership assists in learning process, leadership provides theempowerment to the employees and leadership creates the job satisfaction among theemployees are moderately effective as perceived by the employees in the private sector.
In Private sector the leadership improves the interpersonal relation between theemployees, and leadership contributes in strategies formulation, leadership helps in follow-through the functions, leadership creates the positive attitude among the employees abouttheir work and organization, leadership creates the awareness among the employees abouttheir works and changes and leadership encourages teamwork are highly effective asperceived by the employees The results also indicate that leadership createsoverdependence, leadership resolves the strategic differences with management, leadershipincreases the involvement of the employees, leadership provides consistency, leadershiphelps in formation of the mission statements, leadership assists in learning process,leadership provides the empowerment to the employees and leadership creates the jobsatisfaction among the employees are moderately effective as perceived by the employeesin the private sector.
Suggestions:
For public sector in order to improve the effectiveness of leadership reduces overdependence and leadership should provide consistency, besides, leadership should enhancethe organizational behaviour and also should assist in learning process. And leadershipshould provide the empowerment and create the job satisfaction among the employees.Leadership should act as catalyst for organizational change. In order to improve theleadership styles of supervisor, the supervisor should take time to listen the employeesand should provide the employees with sufficient information related to their work andalso must take care of career development of their employees.
For private sector in order to improve the leadership, leaders should prescribe thebehavioural expectations of employees through formalization of rules and regulations
Influence of Effectiveness of Leadership on Satisfaction of Leadership in Public and Private Insurance Sectors 63
Management Trends Vol. 10, No. 1-2 June-Dece - 2013
correctly. In order to increase the standards of leadership styles, leaders should ensure theemployees work together, encouraging team work and also proper handling of employee'scomplaints. In order to improve the leadership styles of supervisor, supervisor shouldtake care of employees' career advancement.
CONCLUSION
The leadership concepts of leader is managing the critical functions of organizationefficiently, leader is facilitating the creativity and innovation on the part of the employees,leader should create trust among the employees and leader is responsible for creating andmaintaining strong work culture are strongly agreed by the employees of public sector.
References:
l Afsaneh Bagheri and Zaidatol Akmaliah Lope Pihie, (2009), "An Exploratory Studyof Entrepreneurial Leadership Development of University Students" European Journalof Social Sciences, 11(1): pp.177-190
l Laohavichien, T., Fredendall, L., and Cantrell, R., (2009), "The Effects ofTransformational and Transactional Leadership on Quality Improvement" The QualityManagement Journal, 16(2): pp. 7-24.
l Gordon F. Woodbine and Joanne Liu (2010), "Leadership Styles and the Moral Choiceof Internal Auditors", Electronic Journal of Business Ethics and Organization Studies,15(1): pp.28-35.
l Barratt, R. and Korac-Kakabadse, N. (2002), "Developing Reflexive CorporateLeadership: The Role of the Non Executive Director", Corporate Governance:International Journal of Business in Society, 2 (3): pp. 32-6
l Chen, P.Y., and Spector, P.E., (2008), "Negatively Affectivity as the Underlying Causeof Correlations between Stressors and Strains", Journal of Applied Psychology, 76(4):pp.398-407
l Jennifer King Rice (2010), "Principal Effectiveness and Leadership in an Era ofAccountability: What Research Says", National Center for Analysis of LongitudinalData in Education Research, Washington, D.C.
l Aamna Shakeel Abbasi, Ali Muslim Bin Aqeel and Ali Naseer Awan (2011), "TheEffectiveness of Leadership, Performance and Employee Involvement for ProducingCompetitive Advantage with a TQM Orientation: A Conceptual Framework"Mediterranean Journal of Social Sciences, 3(4): pp.83-90.
64 Dasari Pandurangarao, Gella Sireesha & Devarapalli Rajasekhar

Management Trends Vol. 10, No. 1-2 June-Dece - 2013
Table -1: Perception of Leadership Styles of Employees in LIC andICICI Prudential Life Insurance
Leadership Styles LIC ICICI Prudential t- SigLife Insurance Value
Weighted Status Weighted StatusMean Mean
It is always retained the final decision 1.56 ST 3.58 FTmaking authority within my departmentor team.
It is always tried to include one or more 2.89 OT 3.92 FTemployees in determining what to do andhow to do it.
Employees always vote whenever a major 3.42 OT 3.46 OTdecision has to be made.
Employee's suggestions are not considered 4.64 AAT 2.24 STand also no time for them.
Employee ideas and input are sought for 2.44 ST 4.62 AATan upcoming plans and projects.
For a major decision to pass in my 2.04 ST 3.26 OTdepartment, it must have the approval ofeach individual or the majority.
Employees are informed about what has to 4.64 AAT 4.72 AATbe done and how to do it.
When things go wrong and there is a need 2.42 ST 4.48 FTto create a strategy to keep a project orprocess running on schedule, by calls ameeting to get employee's advice.
E-mails, memos or voice mails are sent to 3.62 FT 3.46 OTget the information and the meeting iscalled very rarely. Employees are thenexpected to act upon the information.
Environment is created where the 2.24 ST 3.02 OT 84.146 0.01employees take ownership of the projectand allow them to participate in thedecision making process.
Employees are allowed to determine what 2.35 ST 3.82 FTneeds to be done and how to do it.
New hires are not allowed to make any 4.56 AAT 3.94 FTdecisions unless it is approved by leader.
Leader asks employees for their vision of 3.02 OT 4.62 AATwhere they see their jobs going and thenuse their vision where appropriate.
Influence of Effectiveness of Leadership on Satisfaction of Leadership in Public and Private Insurance Sectors 65
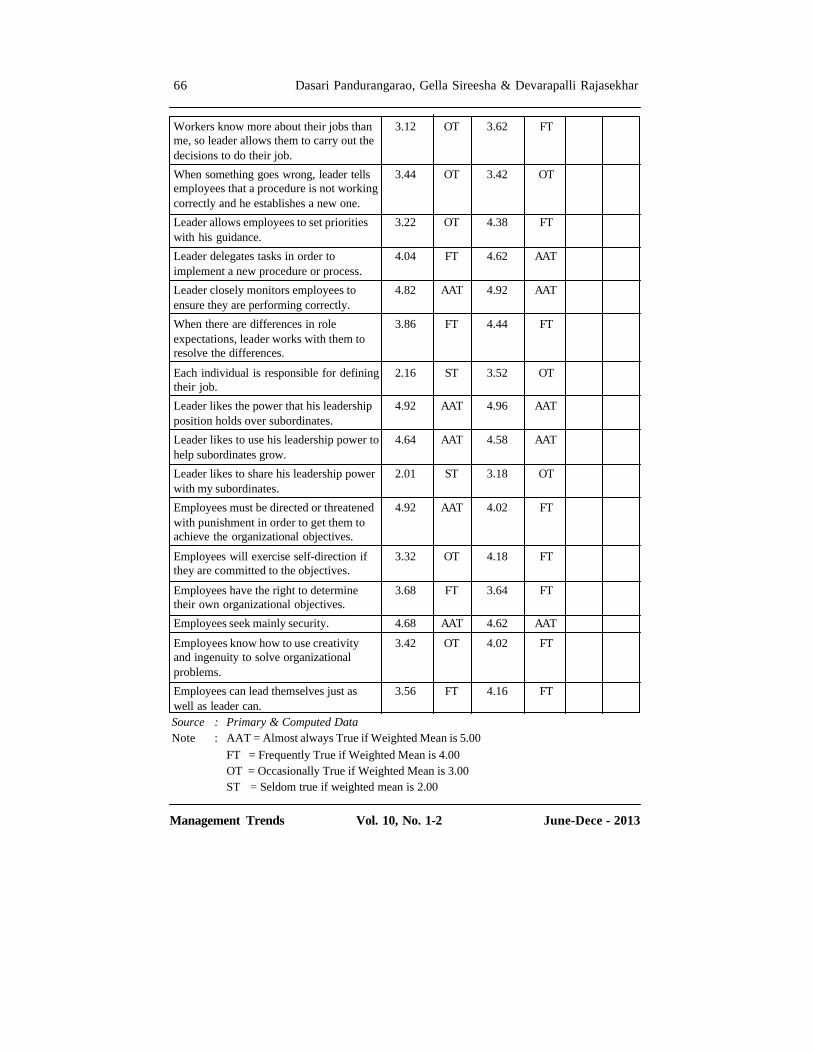
Management Trends Vol. 10, No. 1-2 June-Dece - 2013
Workers know more about their jobs than 3.12 OT 3.62 FTme, so leader allows them to carry out thedecisions to do their job.
When something goes wrong, leader tells 3.44 OT 3.42 OTemployees that a procedure is not workingcorrectly and he establishes a new one.
Leader allows employees to set priorities 3.22 OT 4.38 FTwith his guidance.
Leader delegates tasks in order to 4.04 FT 4.62 AATimplement a new procedure or process.
Leader closely monitors employees to 4.82 AAT 4.92 AATensure they are performing correctly.
When there are differences in role 3.86 FT 4.44 FTexpectations, leader works with them toresolve the differences.
Each individual is responsible for defining 2.16 ST 3.52 OTtheir job.
Leader likes the power that his leadership 4.92 AAT 4.96 AATposition holds over subordinates.
Leader likes to use his leadership power to 4.64 AAT 4.58 AAThelp subordinates grow.
Leader likes to share his leadership power 2.01 ST 3.18 OTwith my subordinates.
Employees must be directed or threatened 4.92 AAT 4.02 FTwith punishment in order to get them toachieve the organizational objectives.
Employees will exercise self-direction if 3.32 OT 4.18 FTthey are committed to the objectives.
Employees have the right to determine 3.68 FT 3.64 FTtheir own organizational objectives.
Employees seek mainly security. 4.68 AAT 4.62 AAT
Employees know how to use creativity 3.42 OT 4.02 FTand ingenuity to solve organizationalproblems.
Employees can lead themselves just as 3.56 FT 4.16 FTwell as leader can.Source : Primary & Computed DataNote : AAT = Almost always True if Weighted Mean is 5.00
FT = Frequently True if Weighted Mean is 4.00OT = Occasionally True if Weighted Mean is 3.00ST = Seldom true if weighted mean is 2.00
66 Dasari Pandurangarao, Gella Sireesha & Devarapalli Rajasekhar
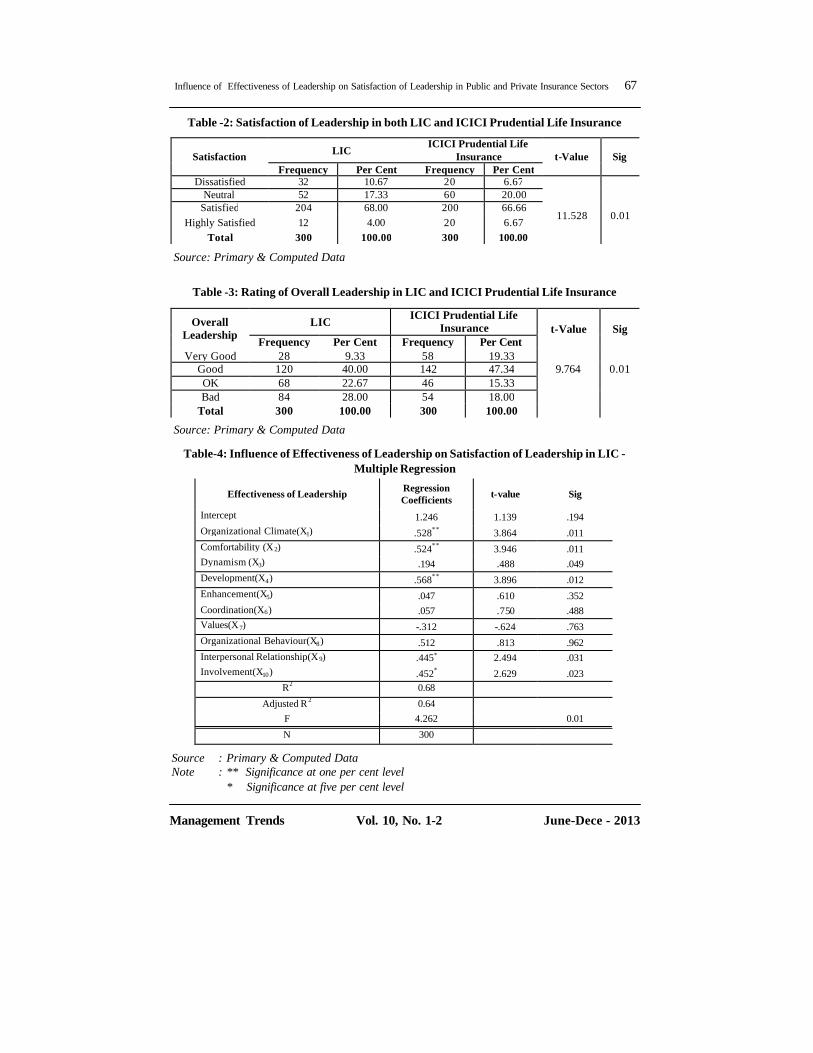
Management Trends Vol. 10, No. 1-2 June-Dece - 2013
Table -2: Satisfaction of Leadership in both LIC and ICICI Prudential Life Insurance
Table -3: Rating of Overall Leadership in LIC and ICICI Prudential Life Insurance
Source: Primary & Computed Data
Source: Primary & Computed Data
Overall Leadership
LIC ICICI Prudential Life
Insurance t-Value Sig Frequency Per Cent Frequency Per Cent
Very Good 28 9.33 58 19.33 9.764
0.01 Good 120 40.00 142 47.34
OK 68 22.67 46 15.33 Bad 84 28.00 54 18.00
Total 300 100.00 300 100.00
Satisfaction LIC ICICI Prudential Life
Insurance t-Value Sig Frequency Per Cent Frequency Per Cent
Dissatisfied 32 10.67 20 6.67
11.528
0.01
Neutral 52 17.33 60 20.00 Satisfied 204 68.00 200 66.66
Highly Satisfied 12 4.00 20 6.67 Total 300 100.00 300 100.00
Table-4: Influence of Effectiveness of Leadership on Satisfaction of Leadership in LIC -Multiple Regression
Source : Primary & Computed DataNote : ** Significance at one per cent level
* Significance at five per cent level
Effectiveness of Leadership Regression Coefficients t-value Sig
Intercept 1.246 1.139 .194 Organizational Climate(X1) .528** 3.864 .011 Comfortability (X2) .524** 3.946 .011 Dynamism (X3) .194 .488 .049 Development(X4) .568** 3.896 .012 Enhancement(X5) .047 .610 .352 Coordination(X6) .057 .750 .488 Values(X7) -.312 -.624 .763 Organizational Behaviour(X8) .512 .813 .962 Interpersonal Relationship(X 9) .445* 2.494 .031 Involvement(X10) .452* 2.629 .023
R2 0.68
Adjusted R2 0.64 F 4.262 0.01
N 300
Influence of Effectiveness of Leadership on Satisfaction of Leadership in Public and Private Insurance Sectors 67
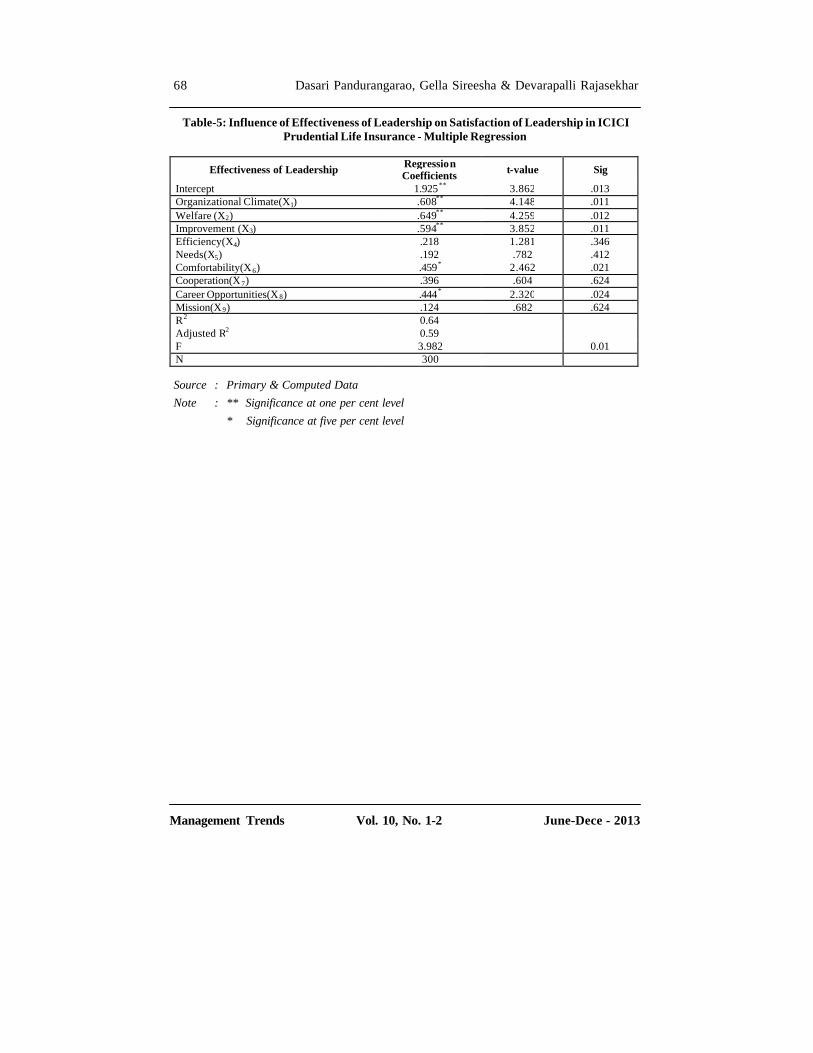
Management Trends Vol. 10, No. 1-2 June-Dece - 2013
Effectiveness of Leadership Regression Coefficients t-value Sig
Intercept 1.925** 3.862 .013 Organizational Climate(X1) .608** 4.148 .011 Welfare (X2) .649** 4.259 .012 Improvement (X3) .594** 3.852 .011 Efficiency(X4) .218 1.281 .346 Needs(X5) .192 .782 .412 Comfortability(X6) .459* 2.462 .021 Cooperation(X7) .396 .604 .624 Career Opportunities(X8) .444* 2.320 .024 Mission(X9) .124 .682 .624 R2 0.64 Adjusted R2 0.59 F 3.982 0.01 N 300
Table-5: Influence of Effectiveness of Leadership on Satisfaction of Leadership in ICICIPrudential Life Insurance - Multiple Regression
Source : Primary & Computed DataNote : ** Significance at one per cent level
* Significance at five per cent level
68 Dasari Pandurangarao, Gella Sireesha & Devarapalli Rajasekhar

Management Trends Vol. 10, No. 1-2 June-Dece - 2013
Syed Irfan Shafi*
C. Madhavaiah**
Impact of Brand Association on Soft Drinks PurchaseDecision on Indian Consumers
* Doctoral Research Scholar, Department of Management Pondicherry UniversityKaraikalCampus,Nehru Nagar KARAIKAL - 609 605E-mail: [email protected].
** Assistant Professor, Department of Management Pondicherry University, Karaikal Campus,Nehru Nagar KARAIKAL - 609 605E-mail: [email protected]
Abstract : Brand association is an indispensable part ofbrand image. The determination of optimal positioning inthe minds of the customer for the brand is based uponidentifying the relationship between the brand and itsfavourable and unique associations. An association canaffect the processing and recall of information, provide apoint of differentiation, provide a reason to buy, createpositive attitudes and feelings and serve as the basis ofextensions. Brand association is an indispensable elementwhich directly has a relationship with brand loyalty, brandknowledge, brand awareness, brand equity, purchasedecision and post purchase behaviour. The purpose of thestudy is to understand which brand associations createpositive brand attitude and purchase decision in the mindsof consumers for the soft drink market in Pondicherry. Thestatistical population consists of consumers in Pondicherry.The research sample consists of 115 consumers of soft drinksin Karaikal /Pondicherry and they are asked to replyquestions which are constructed based on Likert scale.According to the research conceptual model, the relationshipbetween soft drink association mix dimensions and brandassociation was investigated. The data has been analysedusing correlation analysis and regression model. The resultsshow that among all the factors, packaging, productcharacteristics, quality, country of origin, producer's brandimage, retailer's brand image and retailer staff qualities arepositively related to the brand association, and price of thebrand was negatively related to the brand association.
Key Words: Soft drink marketing, brand association,consumer decision-making, purchase, India.
Impact of Brand Association on Soft Drinks Purchase Decision on Indian Consumers 69

Management Trends Vol. 10, No. 1-2 June-Dece - 2013
1. INTRODUCTION
Soft drinks are known as non-alcoholic beverage containing syrup essence or fruitconcentrates that are mixed with carbonated water. Soft drinks are thirst quencher, hygienicand a drink of enjoyment. Soft drinks industries are quit old. Today, Pepsi and Coca - colaare the famous brands and both are multinational.
The production of soft drinks is based on the franchise system, where the parentcompanies supply the concentrates brand name and know how. The franchise unit that isthe bottling unit supplies the production to the market. Hence the bottlers become veryimportant for the successful operation of the soft drinks brand. The drinks are called softdrinks, only to separate them from hard alcoholic drinks. This drinks do not containsalcohol & broadly specifying this beverages, includes a variety of regulated carbonatedsoft drinks, diet & caffeine free drinks, bottled water juices, juice drinks, sport drinks &even ready to drink tea/coffee packs. So we can say that soft drinks mean carbonateddrinks.
Soft drinks are called "soft" in contrast to "hard drinks" (alcoholic beverages).Small amounts of alcohol may be present in a soft drink, but the alcohol content must beless than 0.5% of the total if the drink is to be considered non-alcoholic. Fruit juice, tea,and other such non-alcoholic beverages are technically soft drinks by this definition butare not generally referred to as such.
Widely sold soft drink flavours are cola, cherry, lemon-lime, root beer, orange,grape, vanilla, ginger ale, fruit punch, and lemonade.
Today, soft drink is more favourite refreshment drink than tea, coffee; juice etc. Itis said that where there is a consumer, there is a producer & this result into competition.Bigger the player, the harder it plays. In such situation broad identity is very strong. Ittakes long time to make brand famous. Soft drinks are made by mixing dry ingredientsand/or fresh ingredients (for example, lemons, oranges, etc.) with water. Production ofsoft drinks can be done at factories or at home.
2. SOFT DRINK INDUSTRY IN INDIA
First soft drink, established 50 years ago before all empowering Coca-Cola enteredthe company to dominate the scene. It faced no competition and its euphoric image builtup in western countries helped it get ready clientele and glamour. Parle Export PrivateLtd should be regarded as the first Indian company introducing Limca a lemon drinkcomplimentary to their well established Gold Spot in 1970 which got moderate success.However, before this, it had also introduced Cola-Pepino which was withdrawn in facetough competition from Coca-cola.
Coca-Cola serves in India some of the most recalled brands across the world,which includes names such as Coca-Cola, Diet Coke, Sprite, Fanta, along with theSchweppes product range. The acquisition of Thums Up brought some of the leadingnational soft drinks like Thums Up, Limca, Maaza, Citra and Gold Spot under its umbrella.
70 Syed Irfan Shafi & C. Madhavaiah

Management Trends Vol. 10, No. 1-2 June-Dece - 2013
To add to this, Kinley mineral water was launched in the year 2000. The Soft DrinkIndustry consists of establishments primarily engaged in manufacturing non-alcoholic,carbonated beverages, mineral waters and concentrates and syrups for the manufacture ofcarbonated beverages. Establishments primarily engaged in manufacturing fruit juicesand non-carbonated fruit drinks are classified in Canned and Preserved Fruit and VegetableIndustry. Principal activities and products:
l Aerated waters
l Carbonated beverages
l Mineral and spring waters
l Soft drink concentrates and syrup
l Soft drink preparation carbonating
The first marketed soft drinks (non-carbonated) appeared in the 17th century.They were made from water and lemon juice sweetened with honey. In 1676, theCompanies de Limonadiers of Paris was granted monopoly for the sale of lemonadesoft drinks.
In 2012, soft drinks registered a higher off-trade value growth rate than the reviewperiod average. This growth was attributable to strong double-digit performances in sectorssuch as sports and energy drinks, bottled water and fruit/vegetable juice, which had agood year due to rising mercury levels. Long summers and higher disposable incomes arethe main growth drivers for the soft drinks category.
2.1 Categorisation of Soft Drink Industry
The industry of soft drinks is divided into two main categories namely non-carbonated and carbonated drinks. The non-carbonated drink segments include mostlymango flavours, squashes and fruit juices, while carbonated drinks include orange, lemonand lemon flavours. Some of the top brand names in the soft drinks sector in India areThumps Up, Pepsi and Coco-cola, Limca, Sprite, Mirinda, 7Up, etc… With a view tomeet the requirements of different segments of the society, these soft drinks are beingoffered in varied sizes.
2.2 Top Soft Drink Companies in India
Soft Drinks has become part and parcel of the lifestyle of Indians, irrespective ofmiddle aged people or kids. Particularly, after the arrival of a number of fast food jointsin India, soft drinks have gained more and more popularity. Foods like French fries,burgers and pizzas go hand in hand with soft drinks. Gone are the days when soft drinkswere preferred only during sunny days, nowadays soft drinks are enjoyed with almostevery meal that is had by people outside their home. In spite of several issues that crept upwith respect to ingredients used in the manufacture of soft drinks, the market remainedstable.
Impact of Brand Association on Soft Drinks Purchase Decision on Indian Consumers 71

Management Trends Vol. 10, No. 1-2 June-Dece - 2013
2.3 Top Players in the Soft Drinks Industry in India:
The soft drinks industry in India is dominated by some of the top players and thenames of these top players are given below:
l Coco-Cola India
l PepsiCo India
l Rasna International
Some of the details regarding these top soft drink manufacturers in India are givenbelow:
Coco-Cola India
Coco-Cola Company entered into India in the name of Coco-Cola India, which isits wholly owned subsidiary. The company was launched in India in the year 1993 andthis launch was actually a re-launch since India encouraged foreign investments in differentindustries. The company has more than 1.3 million retailers and more than 7000 distributorsin India and their brands are the leading brands in the soft drinks industry in India. Someof their popular brands in India are Thumps up, Sprite, Limca, Fanta Apple, Fanta Orangeand of course coco-cola. Their recent introduction to the soft drink industry in India isMinute Maid Juice.
Pepsi Co India
PepsiCo is an international company that entered into Indian soft drink industry inthe year 1989 and within a short period of its entry, the company has started dominatingthe Indian soft drink market. The company is operating with the vision of Performancewith purpose and the meaning of this vision is that when the business increases the valueof the shares, they become responsible for improving the society they serve and theenvironment whose resources are being used by them. Thus, Pepsico India serves thesociety to grow along with it. Some of their popular products are Slice, Pepsi, Nimbooz,Mountain Dew, Mirinda and 7Up.
Rasna International
Rasna is another popular name in the soft drinks industry in India and this companyhas in-depth and adequate information and knowledge on market behaviours, marketsizes, finances, government policies, project viabilities, etc… They have emerging andhuge market for their products all over the world and they have made their mark in thefood & beverages industry in India. They have introduced a wide range of ready to makesoft drinks that can be prepared at the comfort of the home of users.
On the basis of pattern of consumption, the pattern of soft drink industry can beclassified into two segments, namely based on the premises in which they are sold likecinema halls, restaurants, shops, railway stations, etc… and the other segment is in-houseconsumption, which indicates that soft drinks consumed at home by the consumers. Even
72 Syed Irfan Shafi & C. Madhavaiah

Management Trends Vol. 10, No. 1-2 June-Dece - 2013
though, the soft drinks industry is growing in India, it is comparatively growing at aslower pace as compared to that of soft drinks industry in other countries.
3. CONCEPT OF BRAND ASSOCIATION
Although there has not always been agreement on how to measure brand image(Dobni and Zinkhan,1990), one generally accepted view is that, consistent with anassociative network memory model, brand image can be defined as perceptions about abrand as reflected by the cluster of associations that consumers connect to the brandname in memory. Thus, brand associations are the other informational nodes linked to thebrand node in memory and contain the meaning of the brand for consumers.
One way to distinguish between brand associations is by their level of abstraction,that is, by how much information is summarized or subsumed in the association. In linewith this criterion, Keller (1993, 1998) classifies brand associations in to three majorcategories: attributes benefits and attitudes. Attributes are those descriptive features thatcharacterize a brand,
Such as what a consumer thinks the brand is or has and what is involved with itspurchase or consumption. Benefits are the personal value consumers attach to the brandattributes, that is, what consumers think the brand can do for them. Brand attitudes areconsumers 'overall evaluations of a brand.
The associations related to the functions represent a greater degree of Abstractionthan those referring to the attributes, and so are more accessible. And remain longer inthe consumer's memory (Chattopadhyay and Alba, 1988). A further specific feature fthe functions is that they have a positive nature, that is, the brand value is greater, thehigher the level. For these reasons, and given the interest of working with amultidimensional measure of brand associations, we will examine the associationsconcerning the functions.
Consumers use brand associations to help process, organize, and retrieveinformation in memory. Keller and Aaker agree that brand associations are one of themain dimensions of brand equity and have a great importance in attitude formation andfinally purchase decisions and loyalty. Brand attitude is defined as consumers' overallevaluation of a brand .Hawkins, Best & Coney's suggest that attitude has threecomponents; cognitive, affective, and behavioural. Cognitive component refers toconsumer's knowledge and beliefs about a brand. The more positive they are, the easierit is for the individual to retrieve or recall the brand. Consumer's feelings or emotionalreactions to a brand represent the affective component of an attitude. Individuals developfavourable attitudes toward the brand if they positive feelings and emotional reactions.The behavioural component of an attitude represents individual's overt behaviour tothe brand. In the literature, brand attitude is conceptualized as part of the brand equity.To form brand attitudes, the existence of brand associations that are salient in a brandis a must.
Impact of Brand Association on Soft Drinks Purchase Decision on Indian Consumers 73

Management Trends Vol. 10, No. 1-2 June-Dece - 2013
Figure 1: Research Model
The primary aim of this study is to examine whether the association withBrand influence how the consumer perceives the brand. It explores to identify theimpact of the nine associations on Soft Drink purchasing behaviour, as shown inFigure 1 .
4. RESEARCH METHODOLOGY & HYPOTHESES
An empirical study was undertaken to understand brand association impactingpurchase decision of soft drinks. Questionnaire with open and close ended questionswere circulated through investigators. In all, 115 respondents were selected who use Pepsi,Coco-Cola, Rasna and other brands who are living in Pondicherry.
The flowing are the two key research hypotheses:
H1. Identify the impact of the nine associations on brand association of Soft Drinkpurchasing behaviour, as shown in Figure 1 below.
H2: The relationship between brand association and Consumer Purchase Decision ispositive.
5. DATA ANALYSIS AND RESULTS
Collected data were analysed using statistical tools of computer programs viz.Microsoft Excel and SPSS. The findings of the study are presented in a manner that meets
Packaging
Characteristics
Quality
Country
Price
Producer
Retailer
Staff
Events
Brand Association
Consumer Purchase Decision
74 Syed Irfan Shafi & C. Madhavaiah
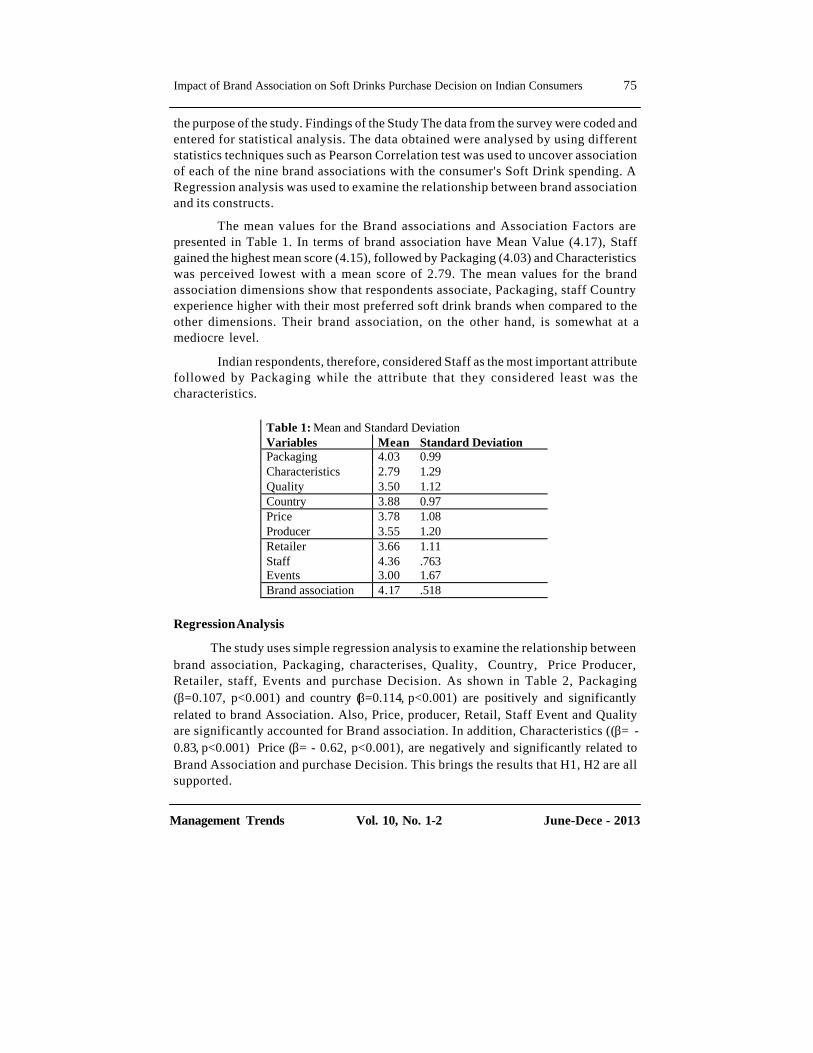
Management Trends Vol. 10, No. 1-2 June-Dece - 2013
the purpose of the study. Findings of the Study The data from the survey were coded andentered for statistical analysis. The data obtained were analysed by using differentstatistics techniques such as Pearson Correlation test was used to uncover associationof each of the nine brand associations with the consumer's Soft Drink spending. ARegression analysis was used to examine the relationship between brand associationand its constructs.
The mean values for the Brand associations and Association Factors arepresented in Table 1. In terms of brand association have Mean Value (4.17), Staffgained the highest mean score (4.15), followed by Packaging (4.03) and Characteristicswas perceived lowest with a mean score of 2.79. The mean values for the brandassociation dimensions show that respondents associate, Packaging, staff Countryexperience higher with their most preferred soft drink brands when compared to theother dimensions. Their brand association, on the other hand, is somewhat at amediocre level.
Indian respondents, therefore, considered Staff as the most important attributefollowed by Packaging while the attribute that they considered least was thecharacteristics.
Table 1: Mean and Standard Deviation Variables Mean Standard Deviation Packaging 4.03 0.99 Characteristics 2.79 1.29 Quality 3.50 1.12 Country 3.88 0.97 Price 3.78 1.08 Producer 3.55 1.20 Retailer 3.66 1.11 Staff 4.36 .763 Events 3.00 1.67 Brand association 4.17 .518
Regression Analysis
The study uses simple regression analysis to examine the relationship betweenbrand association, Packaging, characterises, Quality, Country, Price Producer,Retailer, staff, Events and purchase Decision. As shown in Table 2, Packaging(β=0.107, p<0.001) and country (β=0.114, p<0.001) are positively and significantlyrelated to brand Association. Also, Price, producer, Retail, Staff Event and Qualityare significantly accounted for Brand association. In addition, Characteristics ((β= -0.83, p<0.001) Price (β= - 0.62, p<0.001), are negatively and significantly related toBrand Association and purchase Decision. This brings the results that H1, H2 are allsupported.
Impact of Brand Association on Soft Drinks Purchase Decision on Indian Consumers 75

Management Trends Vol. 10, No. 1-2 June-Dece - 2013
Regression Coefficients for Dependent Variable: Brand Association
Coefficientsa
Model
Unstandardised Coefficients
Standardised Coefficients
t Sig. B Std. Error Beta 1 (Constant) 3.449 .342 10.09 .000
Packaging .107 .047 .206 2.280 .000 Characteristics -.083 .037 -.206 -2.228 .028
Quality .059 .045 .128 1.304 .000 Country .114 .053 .215 2.154 .000 PRICE -.062 .063 -.129 -.983 .328 Producer .003 .054 .008 .065 .000 Retailer .035 .056 .076 .629 .000 Staff .063 .063 -.093 -.999 .320 Events .081 .028 .262 2.881 .000
a. Dependent Variable: Brand Association
Correlation
Pearson Correlation test was used to analyse relationships if any betweenthe nine brand associations (independent variables) affecting Brand associationconsumers' soft drink spending (dependent variables). The main hypothesis statedthat all of the nine Independent Variables have an impact on Brand association.Table 3.
Table 3: Pearson Correlation Coefficients Variables Pearson’s Correlation Sig(2-Tailed) Packaging 0.225* 0.001 Characteristics 0.170* 0.000 Quality 0.158** 0.000 Country 0.208** 0.000 PRICE -0.300* 0.025 Producer 0.250** 0.001 Retailer 0.145* 0.004 Staff 0.250** 0.002 Events 0.240** 0.001
*. Correlation is significant at the 0.05 level (2-tailed).
**. Correlation is significant at the 0.01 level (2-tailed).
76 Syed Irfan Shafi & C. Madhavaiah

Management Trends Vol. 10, No. 1-2 June-Dece - 2013
Pearson result showed that that the independent variables of packaging, productcharacteristics, quality, country of origin, producer's brand image, retailer's brand imageand retailer staff qualities are positively related to the dependent variable, i.e., Price ofthe brand was negatively related to the dependent variable.
5. CONCLUSION
The present study has analysed the brand association based on the functions orbenefits that the consumer associates with the brand. The basic objective was to study theinfluence of these functions on certain aspects of consumer purchase decision in softdrink market. For this, we have formulated two hypotheses that relate each of the brandfunctions with the consumer's willingness to recommend the brand to others, pay a pricepremium for it and accept brand association and the result concluded that brand associationhave positive and significant relation with consumers purchase decision process in softdrink market in India.
6. SCOPE FOR FURTHER STUDY
The researcher purposes to analyse the relationship of all variables that affectbrand association toward soft drink and to make suggestion. Accordingly, a further studywith two import areas is suggested for future research.
First, further research can be conducted on other important factors that contributesoft drink industries to its successful business that are not covered in this study. Forexample, satisfaction, location, loyalty and other factors, second, a further study focusingon new target population can be conducted for soft drink users. Soft drink's new targetpopulation is students belonging to the age group of 20 and above.
l REFERENCES
Ashutosh Nigam, and Rajiv Kaushik, (2011), "Impact of Brand Equity on CustomerPurchase Decisions: An Empirical Investigation with Special Reference to HatchbackCar Owners in Central Haryana", International Journal of Computational Engineering &Management, 12
Batt P. J., and Dean, A. (2000), "Factors influencing the consumer's decision", TheAustralian & New Zealand Wine Industry Journal (First International Wine MarketingSupplement), 15(4), 34-41
Chi. Hsin Kuang, Yeh Huery Ren, and Yang Ya Ting, (2009), "The Impact of BrandAwareness on Consumer Purchase Intention: The Mediating Effect of Perceived Qualityand Brand Loyalty", The Journal of International Management Studies, 4(1)
Del H (2007). "Customer Behaviour", The Tata Mc graw- hill publishing company ltd
Dodds, W. & Monroe, K.B. (1985), "The effect of brand choice information on subjectiveproduct evaluations", Advances in Consumer Research - Association for ConsumerResearch.12, 85-90
Impact of Brand Association on Soft Drinks Purchase Decision on Indian Consumers 77
Management Trends Vol. 10, No. 1-2 June-Dece - 2013
Gibson G (2007). "Retail Management", Jaico Publishing House
Joseph H., D. Ontinau (2005). "Marketing Research," The Tata Mc graw- hill publishingcompany ltd
Kathiravanaa Chandrasekaran, Panchanathama Natarajan and Sivasundaram Anusha,(2010), "the competitive implications of consumer Evaluation of brand image, productattributes, and Perceived quality in competitive two-wheeler Markets of India", SerbianJournal of Management 5 (1), 21 - 38
Keller, K. L. (1998), "Strategic Brand Management: Building, Measuring, and Managing
Nowlis Stephenm., Dhar Ravi, and simonson itamar, (2010), "The Effect of DecisionOrder on Purchase Quantity Decisions", Journal of Marketing Research XLVII, 725-737
Olsen, J.C. (1977), "Price as an informational cue: Effects on product evaluations.Consumer and Industrial buying Behaviour", New York: North Holland Inc. 267-286
Saeidinia Mojtaba , Salehi Mehrdad , Hashem Seyyedeh Mehrsa, darabkhani YasamanDarabi and Ahanijan Behrooz , (2012), "operation strategies for coca-cola vs pepsicompanies to attract their Customer", Contemporary Marketing Review 1(11) ,01 -15
Shinde Govind and Ganjre Kumardatt , "Brand building strategies for Soft Drinks",Journal of Research In Commerce & Management, 1(3)
Tisirak, Soonarong, (2011), "Factors affecting brand loyalty toward taekwondo martialarts of Jinya gym in Bangkok", American International Journal of Contemporary Research,1(3)
Yasin, N. M. et al. (2007), "Does image of country-of-origin matter to brand equity", TheJournal of Product and Brand Management, Santa Barbara, 16(1), 38
78 Syed Irfan Shafi & C. Madhavaiah
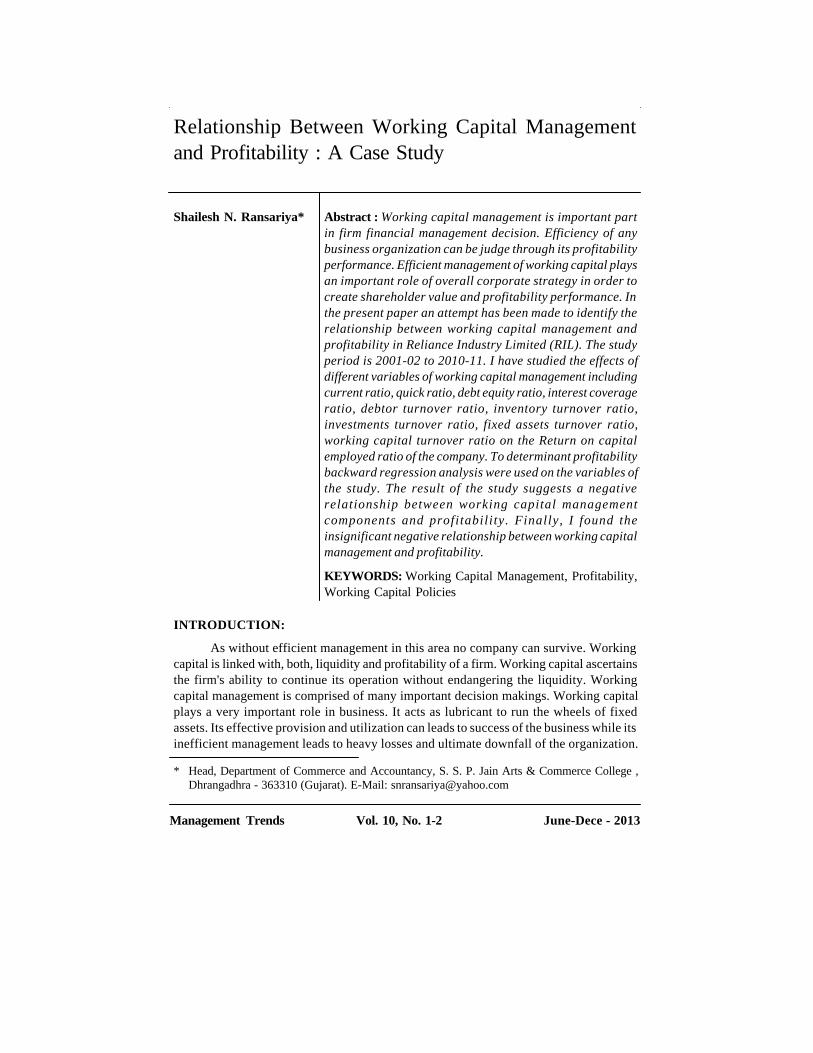
Management Trends Vol. 10, No. 1-2 June-Dece - 2013
Abstract : Working capital management is important partin firm financial management decision. Efficiency of anybusiness organization can be judge through its profitabilityperformance. Efficient management of working capital playsan important role of overall corporate strategy in order tocreate shareholder value and profitability performance. Inthe present paper an attempt has been made to identify therelationship between working capital management andprofitability in Reliance Industry Limited (RIL). The studyperiod is 2001-02 to 2010-11. I have studied the effects ofdifferent variables of working capital management includingcurrent ratio, quick ratio, debt equity ratio, interest coverageratio, debtor turnover ratio, inventory turnover ratio,investments turnover ratio, fixed assets turnover ratio,working capital turnover ratio on the Return on capitalemployed ratio of the company. To determinant profitabilitybackward regression analysis were used on the variables ofthe study. The result of the study suggests a negativerelationship between working capital managementcomponents and profitability. Finally, I found theinsignificant negative relationship between working capitalmanagement and profitability.
KEYWORDS: Working Capital Management, Profitability,Working Capital Policies
Shailesh N. Ransariya*
* Head, Department of Commerce and Accountancy, S. S. P. Jain Arts & Commerce College ,Dhrangadhra - 363310 (Gujarat). E-Mail: [email protected]
Relationship Between Working Capital Managementand Profitability : A Case Study
INTRODUCTION:
As without efficient management in this area no company can survive. Workingcapital is linked with, both, liquidity and profitability of a firm. Working capital ascertainsthe firm's ability to continue its operation without endangering the liquidity. Workingcapital management is comprised of many important decision makings. Working capitalplays a very important role in business. It acts as lubricant to run the wheels of fixedassets. Its effective provision and utilization can leads to success of the business while itsinefficient management leads to heavy losses and ultimate downfall of the organization.
Relationship Between Working Capital Management and Profitability : A Case Study 79

Management Trends Vol. 10, No. 1-2 June-Dece - 2013
In short, the success and efficiency of business organization depends fundamentally onits ability to manage its working capital and that is why working capital managementholds very important place in firm's overall financial management.
In a time when global competition erodes prices, margins are low, companiesneed cash to expand internally or overseas, invest in new technologies and products andpay down debt, turning to working capital as a source of cash represents a managerialtool. There are a growing number of companies recognizing working capital managementas a true competitive advantage in the profit enhancement. In the case of Dell Computer,the company derives cost advantage in three areas: component purchase costs, sellingand administrative costs and inventory and working capital costs.
OBJECTIVES OF WORKING CAPITAL MANAGEMENT:
The objectives of working capital can be stated as:
1. To ensure optimum investment in current assets.
2. To strike a balance between the twin objectives of liquidity and profitability in theuse of funds.
3. To ensure adequate flow of funds for current operations.
4. To speed up the flow of funds or to minimize the stagnation of funds.
NEEDS OF WORKING CAPITAL MANAGEMENT:
For studying the need of working capital in a business, one has to study the businessunder varying circumstances such as a new concern, as a growing concern and as onewhich has attained maturity. A new concern requires a lot of liquid funds to meet initialexpenses like promotion, formation etc. the amount of working capital needed goes onincreasing with the growth and expansion of working capital till it attains maturity. Atmaturity the amount of working capital needed is called normal working capital.
The need of working capital cannot be over emphasized. Every business needssome amount of working capital for the day to day operations of the organization. Theneed for working capital arises due to the time gap between the production and realizationof cash from sales. There is an operating cycle involved in the sales and realization ofcash. There are the time gap in purchase of raw material, production, sales and therealization of cash. Thus working capital is needed in for following purpose:
1. For the purchase of raw material, components and spares.
2. To pay wages and salary.
3. To incur day to day expenses and overhead cost such as fuel, power, office expensesetc.
4. To meet the selling cost as packing, advertisement etc.
5. To provide the credit facility to the customers.
6. To maintain the inventories of raw material, work in progress, store and spares andfinished stock.
80 Shailesh N. Ransariya

Management Trends Vol. 10, No. 1-2 June-Dece - 2013
OBJECTIVES OF THE STUDY:
The following are the specific objectives of the study:
v To analyze the firm's efficiency in Working Capital Management in the RIL.
v To analyze the relationship between Working Capital Management and profitabilityRIL
REVIEW OF LITERATURE:
The review of literature is:
u Shin and Soenen (1998) used a sample of 58,985 firm's years covering the period1975-1994 in order to investigate the relationship between net-trade cycle that wasused to measured efficiency of working capital management and corporate profitabilityand found a strong negative relationship between lengths of the firm's net tradingCycle and its profitability. In addition, shorter net trade cycles were associated withhigher risk adjusted stock returns.
u Ghosh and Maji( 2003) in this paper made an attempt to examine the efficiency ofworking capital management of the Indian cement companies during 1992 - 1993 to2001 - 2002. For measuring the efficiency of working capital management,performance, utilization, and overall efficiency indices were calculated instead ofusing some common working capital management ratios. Setting industry norms astarget-efficiency levels of the individual firms, this paper also tested the speed ofachieving that target level of efficiency by an individual firm during the period ofstudy. Findings of the study indicated that the Indian Cement Industry as a whole didnot perform remarkably well during this period.
u Ganesan, (2007), analyzed impact of working capital management upon theperformance of firms in Telecom industry. The variables used were, days salesoutstanding, number of days for payment to vendors, average days inventory held,cash conversion efficiency, revenue to total assets, revenue to total sales, etc. Findingsreveal negative & insignificant relationship between profitability and daily workingcapital requirement in the said industry.
u Garcia-Teruel and Martinez-Solano (2007) studied the effects of working capitalmanagement on the profitability of a sample of small and medium-sized Spanishfirms. They found that managers can create value by reducing their inventories andthe number of days for which their accounts are outstanding. Moreover, shorteningthe cash conversion cycle also improves the firm's profitability.
u Chakraborty (2008) evaluated the relationship between working capital andprofitability of Indian pharmaceutical companies. He pointed out that there were twodistinct schools of thought on this issue: according to one school of thought, workingcapital is not a factor of improving profitability and there may be a negative relationshipbetween them, while according to the other school of thought, investment in working
Relationship Between Working Capital Management and Profitability : A Case Study 81

Management Trends Vol. 10, No. 1-2 June-Dece - 2013
capital plays a vital role to improve corporate profitability, and unless there is aminimum level of investment of working capital, output and sales cannot be maintained- in fact, the inadequacy of working capital would keep fixed asset inoperative.
u Singh and Pandey (2008) studied the working capital components and the impact ofworking capital management on profitability of Hindalco Industries Limited for periodfrom 1990 to 2007. Results of the study showed that current ratio, liquid ratio,receivables turnover ratio and working capital to total assets ratio had statisticallysignificant impact on the profitability of Hindalco Industries Limited.
u Falope and Ajilore (2009), using a sample of 50 Nigerian quoted non-financialfirms for the period 1996 -2005, found a significant negative relationship betweennet operating profitability and the average collection period, inventory turnover indays, average payment period and cash conversion cycle for a sample of fifty Nigerianfirms listed on the Nigerian Stock Exchange. Furthermore, they found no significantvariations in the effects of working capital management between large and smallfirms.
u Karamjeet Singh and Firew Chekol Asress (2010), concluded that firms whichhave adequate working capital in relation to their operational size are performedbetter than those firms which have less than the required working capital in relationto their operational size. If firms actual working capital is below the required workingcapital in relation to their operational size, firms are forced to produce below theiroptimal scale and this create problem to run day to day activities smoothly, so thislead firms to generate low return on their investment.
In view of the literature surveyed above, I found that there still is indistinctnessregarding the appropriate variables that might serve as proxies for working capitalmanagement and no significant study was conducted in India on the issue regarding impactof working capital management components on profitability for Reliance Industry Limited(RIL).
SIGNIFICANCE AND SCOPE OF THE STUDY:
Very few studies have been made in relation to Working Capital Managementespecially in the refinery industry in India for 10 years 2001-02 to 2010-11. Therefore,the present study is a maiden attempt to analyze the relationship between WCM efficiencyand Return on capital employed in the refinery industry in India. The study covers leadingrefinery industry in India RIL), for which an attempt is made to provide an empiricalsupport to the hypothesized relationship between WCM and profitability.
RESEARCH HYPOTHESIS:
The hypotheses on the basis of objectives of the study are:
H0 : There is no relationship between working capital management and profitability.
H1 : There is relationship between working capital management and profitability.
82 Shailesh N. Ransariya

Management Trends Vol. 10, No. 1-2 June-Dece - 2013
SELECTION OF VARIABLES:
The variable of the study are:
Dependent variable:
v Return On Capital Employed (ROCE)
Independent variables:
v Current Ratio
v Quick Ratio
v Debt Equity Ratio
v Long-term Debt to Equity Ratio
v Interest Coverage Ratio
v Inventory Turnover Ratio
v Debtor Turnover Ratio
v Investment Turnover Ratio
v Fixed Assets Turnover Ratio
v Working Capital Turnover Ratio
MODEL SPECIFICATIONS:
The basic empirical framework employed in this study is based on a simple model:
ROCE t = α’ + Σβ X t +µ t
Where ROCE refers to Return on capital employed of company i at time t.
X t refers to the vector of determinants of working capital Management whichrepresents different independent variables for working capital Management of firm attime t and µ is the error term. α’ is the intercept of equation.
l β is the Coefficients of X it variables.
l t is the time = 1, 2,……,10 years.
In order to understand the impact of working capital management component onprofitability more precisely, the above equation is elaborated as follows:ROCEt = α’ + β1 (CR t) + β 2(QR t)+ β 3 (DER t) + β 4 (LTDER t) + β 5 (ICR t) + β 6(ITR t) + β 7 (DTR t) + β 8 (IsTR t) + β 9 (FATR t) + β 10 (WCTR t) + µ t
Where,
CR = Current Ratio
QR = Quick Ratio
Relationship Between Working Capital Management and Profitability : A Case Study 83

Management Trends Vol. 10, No. 1-2 June-Dece - 2013
DER = Debt Equity Ratio
LTDER = Long-term Debt to Equity Ratio
ICR = Interest Coverage Ratio
ITR = Inventory Turnover Ratio
DTR = Debtor Turnover Ratio
IsTR = Investments Turnover Ratio
FATR = Fixed Assets Turnover Ratio
WCTR = Working Capital Turnover Ratio
Table No.1 (Multiple Correlations)
Correlations ROCE CR QR D/E LD/E ICR ITR DTR IN.TR FTR WTR
ROCE Pearson Correlation
Sig. (2 tailed)
N
1.000
.
10
CR Pearson Correlation
Sig. (2 tailed)
N
-.857**
.002
10
1.000
.
10
QR Pearson Correlation
Sig. (2 tailed)
N
-.301
.399
10
.474
.166
10
1.00
.
10
D/E Pearson Correlation
Sig. (2 tailed)
N
-.857**
.003
10
.669*
.049
10
0.250
.517
10
1.000
.
10
LD/E Pearson Correlation
Sig. (2 tailed)
N
-.714*
.020
10
.666*
.035
10
.125
.731
10
.920**
.000
10
1.000
.
10
ICR Pearson Correlation
Sig. (2 tailed)
N
.244
.497
10
-.340
.336
10
.452
.190
10
-.233
.547
10
-.539
.108
10
1.000
.
10
ITR Pearson Correlation
Sig. (2 tailed)
N
.723*
.018
10
-.762*
.010
10
- .197
.585
10
-.439
.238
10
-.288
.420
10
.045
.902
10
1.000
.
10
DTR Pearson Correlation
Sig. (2 tailed)
N
-.203
.574
10
-.088
.809
10
.262
.465
10
.224
.563
10
-.122
.738
10
.685*
.029
10
-.157
.664
10
1.000
.
10
IN. TR Pearson Correlation
Sig. (2 tailed)
N
.792**
.006
10
-.841**
.002
10
- .185
.609
10
-.550
.125
10
-.416
.232
10
.176
.627
10
.971**
.000
10
-.053
.885
10
1.000
.
10
FTR Pearson Correlation
Sig. (2 tailed)
N
.005
.990
10
.273
.445
10
.835**
.003
10
-.176
.651
10
-.125
.731
10
.240
.505
10
.047
.897
10
-.138
.703
10
.057
.875
10
1.000
.
10
WTR Pearson Correlation
Sig. (2 tailed)
N
-.065
.859
10
-.076
.835
10
- .095
.795
10
-.544
.130
10
-.591
.072
10
.425
.221
10
-.392
.262
10
.477
.164
10
-.285
.425
10
- .173
.632
10
1.000
.
10
** Correlation is significant at the 0.01 level (2-tailed).
* Correlation is significant at the 0.05 level (2-tailed).
84 Shailesh N. Ransariya

Management Trends Vol. 10, No. 1-2 June-Dece - 2013
Pearson's Correlation analysis is used for data to examine the relationship betweenworking capital management components and profitability. Table No.1 shows multiplecorrelations of selected companies. Pearson's correlation analysis is used for data to findthe relationship between working capital management and return on capital employed.The ROCE and CR are negatively correlated but show significance result at 1% level ofsignificance. Correlation between ROCE and current ratio is negative indicating that highcurrent ratio involving greater current asset than current liability will reduce the profitabilityof the firms. The ROCE and QR also show negative correlation but t-test result isinsignificance. It indicates that the two objectives of liquidity and profitability have inverserelationships. So, the Indian manufacturing firms need to maintain a balance or tradeoffbetween these two measures. The ROCE and D/E shows negative correlation and it showssignificance result at 1% level of significance. The ROCE and LD/E indicates significanceresult at 5% level of significance. The ROCE and ICR show insignificance correlation.The ROCE and ITR show the positive correlation. The correlation coefficient is 0.723shows that less the time firm take in selling inventory more will be the favourable effecton its profitability.
Table No.2 (Model of multiple regressions)
Model Summary
Model R R Square Adjusted R Square
Std. Error Of the
Estimate 1 .990a .990 .990 5.000E-02 a. Predictors: (Constant), WTR, CR, FTR, DTR, ICR, D/E, ITR, QR
Table No.2 indicates the model of multiple regressions which shows thatindependent variables like WTR, CR, FTR, DTR, ICR, D/E, ITR and QR have 0.990effect on the dependent variable (ROCE).
Table No. 3 (Coefficients)
Coefficients a
Model Unstandardized
Coefficients Standardized Coefficients t Sig.
B Std. Error Beta 1 (Constant)
CR QR D/E ICR ITR DTR FTR WTR
55.280 -36.799 88.316
-32.902 -0.651 -0.784 -0.429
-24.497 -0.193
3.875 5.381
10.152 2.392 0.140 0.305 0.037 2.217 0.049
-1.948 2.664
-.0847 -0.898 -0.348 -0.601 -1.563 -0.266
14.264 -6.839 8.700
-13.755 -4.661 -2.575
-11.612 -11.048
-3.938
0.045 0.092 0.073 0.046 0.135 0.236 0.055 0.057 0.158
a. Dependent Variable : ROCE
Relationship Between Working Capital Management and Profitability : A Case Study 85

Management Trends Vol. 10, No. 1-2 June-Dece - 2013
I have used the regression analysis to investigate the impacts of working capitalon the profitability. The above table no. 3 shows the result of the model of regressionanalysis. The coefficient of CR and ROCE is -36.799 and result of t-test is significance.Whereas the QR and ROCE shows positive coefficients with positive beta value and ttest result is significant. Coefficient between D/E and ROCE is negative with significantdiffidence of t -test. Whereas ICR, ITR, DTR, FTR and WTR explains negativecoefficient with negative beta value and t test has been significant with 5% level ofsignificance.
LIMITATIONS AND SCOPE FOR FURTHER STUDY:
1. The study is confined to ten years data only, i. e. from 2001-02 to 20011-12, therefore,a detailed analysis covering a lengthy period, which may give slightly different resultshas not been made.
2. The study is based on secondary data collected from the www.capitalline.com.therefore the quality of the study depends purely upon the accuracy, reliability andquality of the secondary data source. Approximation, and relative measures withrespect to the data source might impact the results.
3. Further studies could be made by future researchers in the following aspects andareas: by inclusion of extraneous variables like profitability ratios (g/p ratio, n/p ratio, etc) and analyzing the inter-relationship between the WCM andprofitability.
CONCLUSION:
Working capital management is exceedingly significant issue in firm's corporatefinancial decision making process and it should be designed to generate higher profit.Present study investigates the relationship between Working Capital Management (WCM)and profitability of a Reliance Industry Limited. For analysis purpose financial ratios ofWCM are used to check their effect on the return on capital employed performance. Themethod that was used is the multiple correlations and regression analysis in which, liquidity,accounts receivable, inventories are analyzed for the period of ten years 2001-02 to 2010-11. It was found from the study that there is negative relationship between workingcapital components and profitability during the study period. The findings of the studysuggest that it may be possible to increase profitability by improving efficiency of workingcapital.
REFERENCES:
1. Afza, T., & Nazir, M. (2009), Impact of aggressive working capital managementpolicy on firms' profitability. The IUP Journal of Applied Finance,vol. 15(8), pp20-30.
2. Deloof, M. (2003), Does Working Capital Management Affect Profitability of BelgianFirms? Journal of Business Finance & Accounting,vol. 30,no.(3&4), pp573-587.
86 Shailesh N. Ransariya

Management Trends Vol. 10, No. 1-2 June-Dece - 2013
3. Eljelly, A. (2004), "Liquidity-Profitability Tradeoff: An empirical Investigation inAn Emerging Market", International Journal of Commerce & Management, vol. 14,no.2, pp48-61.
4. Falope OI, Ajilore OT( 2009), Working capital management and corporate profitability:evidence from panel data analysis of selected quoted companies in Nigeria. ResearchJournal of Business Management, vol.3: pp73-84.
5. Ghosh, S. K. and Maji, S. G. (2003), "Working Capital Management Efficiency: Astudy on the Indian Cement Industry", The Institute of Cost and Works Accountantsof India.
6. Lazaridis, I., & Tryfonidis, D. (2006), "Relationship between working capitalmanagement and profitability of listed companies in the Athens stock exchange",Journal of Financial Management and Analysis, vol.19, no.1, pp26-35.
7. Raheman, A. & Nasr, M. (2007), "Working capital management and profitability -case of Pakistani firms", International Review of Business Research Papers, vol. 3,no.1, pp279-300.
8. Shin, H. H., and L. Soenen, 1998. "Efficiency of Working Capital Management andCorporate Profitability", Financial Practice and Education, Vol. 8, No. 2, pp. 37-45.
9. Singh, J.P. and Shishir Pandey, 2008. "Impact of Working Capital Management inthe Profitability of Hindalco Industries Limited", ICFAI Journal of FinancialEconomics, Vol. 6, Issue 4, pp. 62-72
Relationship Between Working Capital Management and Profitability : A Case Study 87
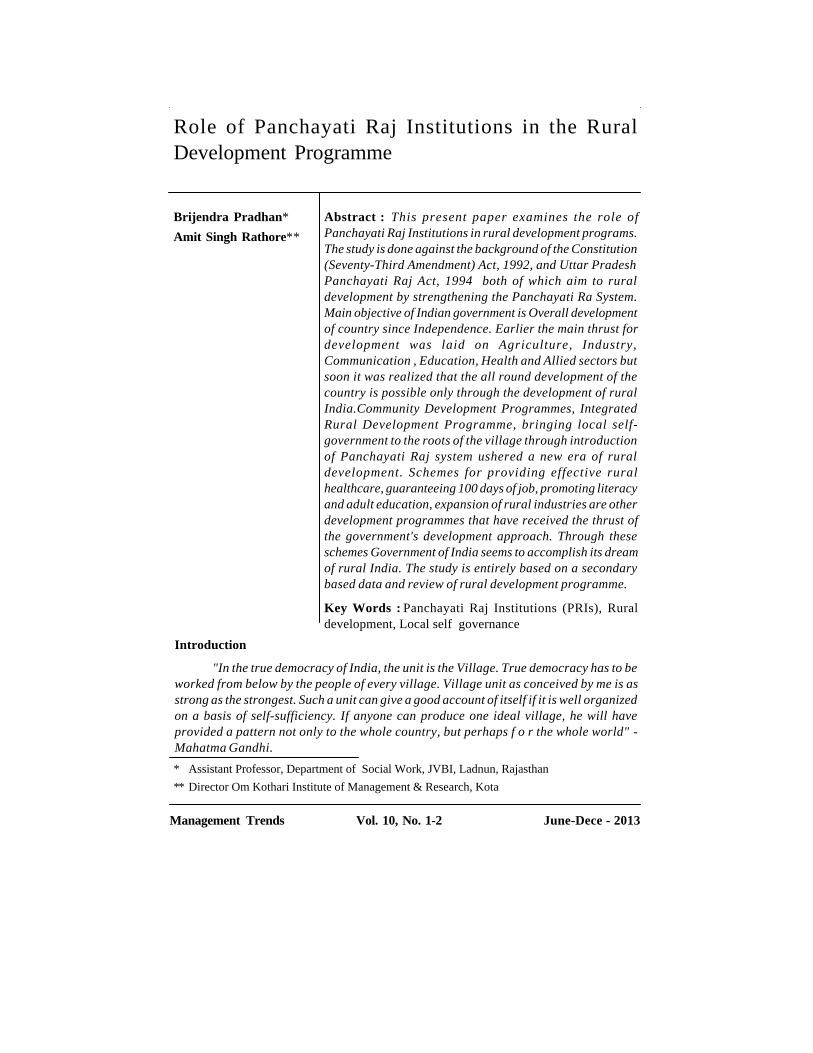
Management Trends Vol. 10, No. 1-2 June-Dece - 2013
Introduction
"In the true democracy of India, the unit is the Village. True democracy has to beworked from below by the people of every village. Village unit as conceived by me is asstrong as the strongest. Such a unit can give a good account of itself if it is well organizedon a basis of self-sufficiency. If anyone can produce one ideal village, he will haveprovided a pattern not only to the whole country, but perhaps f o r the whole world" -Mahatma Gandhi.
Role of Panchayati Raj Institutions in the RuralDevelopment Programme
* Assistant Professor, Department of Social Work, JVBI, Ladnun, Rajasthan** Director Om Kothari Institute of Management & Research, Kota
Abstract : This present paper examines the role ofPanchayati Raj Institutions in rural development programs.The study is done against the background of the Constitution(Seventy-Third Amendment) Act, 1992, and Uttar PradeshPanchayati Raj Act, 1994 both of which aim to ruraldevelopment by strengthening the Panchayati Ra System.Main objective of Indian government is Overall developmentof country since Independence. Earlier the main thrust fordevelopment was laid on Agriculture, Industry,Communication , Education, Health and Allied sectors butsoon it was realized that the all round development of thecountry is possible only through the development of ruralIndia.Community Development Programmes, IntegratedRural Development Programme, bringing local self-government to the roots of the village through introductionof Panchayati Raj system ushered a new era of ruraldevelopment. Schemes for providing effective ruralhealthcare, guaranteeing 100 days of job, promoting literacyand adult education, expansion of rural industries are otherdevelopment programmes that have received the thrust ofthe government's development approach. Through theseschemes Government of India seems to accomplish its dreamof rural India. The study is entirely based on a secondarybased data and review of rural development programme.
Key Words : Panchayati Raj Institutions (PRIs), Ruraldevelopment, Local self governance
Brijendra Pradhan*
Amit Singh Rathore**
88 Brijendra Pradhan & Amit Singh Rathore

Management Trends Vol. 10, No. 1-2 June-Dece - 2013
The Constitutional (73rd Amendment) Act, passed in 1992 by the Centralgovernment, came into force on April 24, 1993. It was meant to provide constitutionalsanction to establish "democracy at the grassroots as it is at the state level or nationallevel".Panchayati Raj system is a three-tier system in the state with elected bodies at theVillage, Block and District levels. It is a constructional mechanism spread across thecountry. It ensures greater participation of people and more effective implementation ofrural development programmes. There will be a Gram Panchayatfor a village or group ofvillages, Block Panchayat(orPanchayatSamiti/ KshetraPanchayat) at Block level and theZilaPanchayat(or ZilaParishad) at the district level. India has a history of Panchayati Rajstarting from self-sufficient and self-governing village communities that survived the riseand fall of empires in the past to the modern legalised institutions of governance at thethird tier provided with Constitutional support.In pursuance of this, States have initiatedaction to devolve administrative and financial powers and resources to Panchayati RajInstitutions (PRIs) to enable them to discharge their Constitutional role. It is expectedthat once the process of devolution is effectively operationalised, resources from theCentral and State Governments meant for programmes falling within the jurisdiction ofthe PRIs would directly get allocated to them.
The Ministry of Rural Development (MORD), which is the nodal Ministry forimplementation of the 73rd Constitutional Amendment Act, has also, so far, not dischargedits role in setting up institutional mechanisms for bridging the wide gap that exists today.Though some steps have been taken by the MORD to goad the State Governments tostrengthen and deepen the process of democratic decentralization, it has not yielded thedesired results. Most Central Ministries have not yet internalised the PRIs role in thedelivery of services handled by the Ministry. According to Ministry of Rural Development(Govt. of India). Rural Development implies both the economic betterment of people aswell as greater social transformation. In order to provide aspirations of the local people,Panchayati Raj Institutions have been involved in the programme implementation andthese institutions constitute the core of decentralized development of planning and itsimplementations. The Ministry is also vigorously pursuing with the State Governmentsfor expeditious devolution of requisite administrative and financial powers to PRIs asenvisaged under 73rd Amendment Act of the Constitution of India.
Still about 70 percent of India's population lives in rural areas. There are about6,38,365 villages in the country as against about 300 cities and 5,161 towns. Of the 121crore Indians, 83.3 crore live in rural areas while 37.7 crore stay in urban areas, as per theCensus 2011. The National Council of Applied Economic Research (NCAER) surveyreport says that there are 720 million consumers across the villages in rural India. Hence,the development of the nation largely depends upon the development of the ruralpopulation. Majority of the rural population is dependent upon agriculture for theirsubsistence. Uttar Pradesh, with a population of 19.95 crore as per 2011 Census, is themost populous State of the country. UP covers 2,40,928 sq.kms. and accounts for 7.3percent of total area of the country which makes it the fifth largest State in the country.
Role of Panchayati Raj Institutions in the Rural Development Programme 89

Management Trends Vol. 10, No. 1-2 June-Dece - 2013
Uttar Pradesh has 71 districts 820 development Blocks, 107452 villages, 51976 GramPanchayats and 8135 NyayPanchayats.
At present, there are about 3 million elected representatives at all levels of thepanchayatone-third of which are women. These members represent more than 2.4 lakhGram Panchayats, about 6,000 intermediate level tiers and more than 500 districtpanchayats. Already the Constitution is amended to make the representation of women50 percent. Spread over the length and breadth of the country, the new panchayatscoverabout 96 percent of India's more than 6.4 lakh villages and nearly 99.6 percent of ruralpopulation. This is the largest experiment in decentralisation of governance in the historyof humanity.
Rural Development
Development of rural areas has been at the core of planning process in the countryand also in the State. Rural Development is a broad, inclusive term which takes in itsconsideration socioeconomic and political development of the rural areas. It includesmeasures to strengthen the democratic structure of society through the Panchayati RajInstitutions as well as measures to improve the rural infrastructure, improve income ofrural households and delivery systems pertaining to education, health and safetymechanisms. Poverty alleviation is a key component of rural development. Governmentof India has taken many initiatives for rural development. For this purpose it has setup theMinistry of Rural Development.
The Department of Rural Development implements schemes for generation ofself employment and wage employment, provision of housing and minor irrigation assetsto rural poor, social assistance to the destitute and Rural Roads etc. Apart from this, theDepartment provides the support services and other quality inputs such as assistance forstrengthening of District Rural Development Agency (DRDA) Administration, PanchayatiRaj Institutions, training & research, human resource development, development ofvoluntary action etc. For the proper implementation of the programmes.
The 2011 Census estimates that 83.3 crore people, about 69 percent of the country'stotal population of 121 crore, continue to live in rural India. A major challenge thus arisesis, how to feed India's growing population with rising incomes with the given land andwater resources. The expansion of income opportunities in the farm sector and progressiveabsorption of people into non-agricultural activity have been identified as the mostappropriate solutions to this challenge. For achieving rural development, the presentgovernment has been injecting resources at a massive scale to the rural and farm sector.Presently, seven major flagship programmes are being implemented to develop rural areas.They are: Mahatma Gandhi National Rural Employment Guarantee Act (MGMGNREGA),National Rural Livelihood Mission (NRLM), Indira AwasYojana (IAY), National RuralDrinking Water Programme (NRDWP) and Total Sanitation Campaign (TSP), IntegratedWatershed Development Programme (IWDP), PradhanMantriGrameenSadakYojana(PMGSY) and rural electrification, including separation of agricultural feeders and Rajiv
90 Brijendra Pradhan & Amit Singh Rathore

Management Trends Vol. 10, No. 1-2 June-Dece - 2013
Gandhi GrameenVidyutikaranYojana (RGGVY). All these programmes are essentiallymeant for creating gainful employment opportunities and to improve the quality of livesof rural masses.
Role of Panchayti Raj Institutions (PRIs)
Ideally speaking, panchayats should be implementing programmes. However, evenif they are not doing so currently, they can play a key role in monitoring the implementationof these programmes through certain simple and easy to install systems. First, panchayatsat all levels can be considered as units for data collection and aggregation in respect ofdevelopmental schemes. Ideally, the planning and implementation of every ruralinfrastructure scheme ought to be monitored at the village panchayat level, with appropriateaggregation of information at the intermediate and district panchayat levels. This willnecessitate the creation of a database of village panchayats, givingdetails of the villagesand habitations that come within thejurisdiction of each panchayat, thus enabling all suchschemesto be monitored over standard geographical areas conformingto the jurisdictionof the rural local bodies concerned. Oncevillage to panchayat correlation data is available,data in respectof the planning and implementation of such schemes can bere-arrangedand maintained on the internet.
It must be ensured that perspective and annual plans in respect of each scheme areprepared by the panchayats concerned. All monitoring formats for such schemes prescribedby the Ministries concerned can be consolidated into a simple standardized monthly 'return'that would be universally applied for monitoring purposes at each panchayat level fromthe village panchayat upwards. Currently, performance of panchayats is being aggregatedat the District level for the purpose of monitoring. Districts are considered the basic unitsfor the furnishing of utilization certificates. This tends to average out performance ofindividual panchayats, so that the best performing panchayats have to wait till the districthas reached the threshold prescribed before receiving the next instalment of funds. Inorder to encourage well performing panchayats by ensuring smooth fund flows directedtowards prompt implementation, it is proposed that progressively, monitoring will betaken down to each panchayat level. In the first instance, the intermediate panchayat canbe adopted as the basic unit for monitoring of progress, submission of utilization certificatesand release of funds (like the Nirmal Gram Puraskar). Panchayats will need to be fullyinvolved in the monitoring
process by development of yardsticks for monitoring through discussion at thepanchayat level, introducing a system of peer reviews, consolidation of data relevant to aparticular indicator and comparing it with the best possible status, as well as the minimumactual level of achievement in the intermediate panchayat area, adoption of a system ofranking between panchayats aimed at providing a development database of the area andpreparation of a model citizens charter covering all the flagship schemes and circulationfor adoption by all panchayats. It is also necessary to prepare databases of independentquality assessments covering implementation of such schemes.
Role of Panchayati Raj Institutions in the Rural Development Programme 91

Management Trends Vol. 10, No. 1-2 June-Dece - 2013
Panchayati Raj Department is an important department for the rural development.The mainobjective of this department is tostrengthen the Panchayati Raj System inthestate according to the 73rd amendment of Indian constitution. So that panchayatscanrealize the dream of ruraladministration and rural developmentwith complete coordinationandtransparency.
1. Financial aid to Gram Panchayats
2. Rural Cleanliness Programmes.
3. Responsibilities of the Panchayats-(Transparency in work, rural administration &development).
4. Responsibilities of public towards Panchayat.
5. Decentralization Programme.
6. Control over the Gram Panchayats
7. Arrangement of Panchayat Help-line.
8. Drinking water supply, cleaning and maintenance facilities.
9. Maintenance of public lamp posts, roads, drainage system, cleanliness programmes,primary schools and maintenance of other public assets.
10. Construction of PanchayatBhawans for meeting halls and for the residence of secretaryof Gram Panchayat.
11. Construction of GraminKisan Bazaar and Livestock Markets.
12. Construction of underground water drainage system for the objective of environmentalcleanliness.
MGNREGA and PRIs
The Mahatma Gandhi National Rural Employment Guarantee Act (hereafterMGNREGA) is a law whereby any adult who applies for employment in rural areas hasto be given work on local public works within 15 days. If employment is not given, anunemployment allowance has to be paid. The employment guarantee is subject to alimit of 100 days per household per year. The main objective of MGNREGA is toprotect ruralhouseholds from poverty and hunger. MGNREGA can also serve otherobjectives: generating productive assets, protecting the environment, empoweringwomen, reducing rural-urban migration, and fostering social equity, among others. Thus,MGNREGA is not just an employment scheme: it is a tool of economic and socialchange in rural areas.
MGNREGA is perhaps, an opportunity for rural India as it guarantees one of thecrucial rights, right to work envisaged in the Article 41 of the Indian Constitution. Thenational rural employment guarantee act has the potential to provide a "big push" in
92 Brijendra Pradhan & Amit Singh Rathore

Management Trends Vol. 10, No. 1-2 June-Dece - 2013
India's region of distress. Panchayats are having central (Principal authority) role in theimplementation and monitoring of the Schemes under MGNREGA. . Under theprovisions of the Mahatma Gandhi National Rural Employment Guarantee Act(MGNREGA), eligible households apply to the Gram Panchayat which, after dueverification, issues the job card. Each district has to prepare a shelf of projects, whichis done on the basis of priority assigned by the Gram Sabha. At least 50% of the workshave to be allotted to Gram Panchayats for execution. Social audit has to be done bythe Gram Sabha. However, for the potential of MGNREGA to be realized , majorinterventions are required to enable Panchayats to fulfil their constitutional obligationsto lead economic development and social justice in their areas and major reforms needto be initiated in its implementation.
It is important that Panchayati Raj Institutions are effectively enabled to governthe Scheme.In several states of India, the District Rural Development Authorities havebeen entrusted with a key role relating to administration of the Scheme, while the criticalrole of Panchayati Raj institutions remains to be adequately appreciated and actualized.In a state like Jharkhand, where elections to local panchayats haven't taken place forover two decades, the government needs to pro-actively engage traditional gram sabhasof local communities in operationalization and governance of the Scheme. The role ofinstitutions like District Rural Development Agency (DRDA) becomes particularlyquestionable, when they unilaterally initiate critical processes, e.g. preparation of shelfof projects, without any local level consultations and involvement of panchayatfunctionaries - a common reality in many states where NREGS has been initiated.Asper section 16 (1) of the MGNREGA for the works/projects to be implemented in theGram Panchayat area would be undertaken by the Gram Panchayat ensuring activeparticipation of the gram sabha members. The plan proposals will then move upwardsfor approval and consolidation at the above Panchayat levels and District PanchayatCommittee (DPC) will coordinate the preparation of detailed technical estimates andsanctions. Most of the Gram Panchayats across the districts have not identified theworks to be implemented instead the works to be carried out are allotted to them. GramPanchayats play a very limited role in identification and planning of the works. It seemsPanchayats have become mere implementers of the scheme.The first step in the planningprocess has to be initiated at the gram sabha level. Even the identification of thebeneficiaries is to be done by the gram sabhas. The gram sabhas have to carry out asocial audit of all the projects, within their jurisdiction.
The Act says that at least 50 per cent of the works in terms of costs will beallotted to the Gram Panchayat for execution. Intermediate Panchayats and DistrictPanchayats are among other implementing agencies. The selection of implementingagencies will have to be indicated in the Annual Plan. Although Panchayats are associatedwith the implementation of the works but they play a very limited role in its effectiveimplementation. Panchayat representatives lack capacities and skills to efficientlyperform their duties as a result of which they get dependent on the government officials
Role of Panchayati Raj Institutions in the Rural Development Programme 93

Management Trends Vol. 10, No. 1-2 June-Dece - 2013
for each and everything resulting in to passive participation in the processes. Lack ofcapacity and skills of the Panchayat officials is one of the major critical issues which isrestricting Panchayats from effective participation in the MGMGNREGA. Lack oftechnical skills, low awareness of the provisions of the scheme, lack of clarity on theirroles and responsibilities are some of the problems putting off the Panchayats fromactive functioning. The Act defines Panchayats as the prime authorities in managementof the MGMGNREGA. The limited role of Panchayats in management of the scheme isa critical issue in effective implementation of MGNREGA. Due to lack of functionaries,they have become paralysed and are not able to perform their roles and responsibilities.Deployment of full time professionals dedicated to MGNREGA at all levels, but mostimportantly at block level is vital.
Conclusion
Consequent to the 73rd Consti tut ion Amendment Act poli t icaldecentralisationhas taken place in almost all the States where elections have beenheld. However,progress on fiscal and functional decentralisation has been mixed.There are Stateswhich have taken steps to devolve funds, functions and functionariesto the PRIs. Theprocess of devolution is at different levels of operationalisation acrossStates.Surprisingly, the States of Madhya Pradesh and Uttar Pradesh who have hadlittleexperience of decentralisation have made the most fundamental changes in thisregard.Further, it is imperative that the PRIs have resources to match theresponsibilitiesplaced on them. While State Finance Commissions have submittedtheirrecommendations, very few States have taken the necessary steps to ensurefiscalviability of the PRIs. Yet, one can be hopeful that the experience of some Statesandsome PRIs within States would provide the necessary impetus for greaterdevolution in other parts of the country.
Strict monitoring of their performance by PRIs against specific outcomes shouldbe ensured. Greater convergence is required across departments and Programmes withMGNREGA so that sustainable livelihoods can be created. Some of these principles,such as answerability to PRIs, stakeholder participation and social audit, are inherentin the MGNREGA architecture. But they are yet to be effectively put into place.
References
1. Uttar Pradesh Development Report . Planning Commission, Government of India
2. TFC (2004). 'Report of the Twelfth Finance Commission (2005- 10), Twelfth FinanceCommission, Government of India, New Delhi.
3. Report of Twelfth Finance Commission
4. Rao, Govinda M., H.K.Amarnath and B.P.Vani (2004). 'India: Fiscal Decentralizationto Rural Governments, Report No. 26654- IN (January)', World Bank RuralDevelopment Unit, South Asia Region, New Delhi.
94 Brijendra Pradhan & Amit Singh Rathore
Management Trends Vol. 10, No. 1-2 June-Dece - 2013
5. Planning Commission (2006). 'Planning At the Grassroots Level: An ActionProgramme for the Eleventh Five Year Plan, Report of the Expert Group, March',Planning Commission, New Delhi.
6. Plan 2005-06 . Document of Planning Department, Government of Uttar Pradesh
7. MOPR (2006). Annual Report of the Ministry of Panchayati Raj 2005-6 , Governmentof India, New Delhi
8. Mathur, Mukesh (2003). 'Panchayati Raj Institutions and the state FinanceCommissions-A Report', in 3iNetwork (ed.), India Infrastructure Report 2003: PublicExpenditure Allocation and Accountability, Oxford University Press, New Delhi.
9. https://lrms.nic.in/clr_phy.pdf
10. http://www.righttofoodindia.org/rtowork/ega-toolsfor-action-and-research.html
11. http://www.mapsofindia.com/stateprofiles/uttarpradesh/m053101.htm
12. http://upgov.nic.in/upinfo/census01/cen01-6.htm
13. http://upgov.nic.in/
14. http://rural.nic.in/i1.htm
15. http://rd.up.nic.in/
16. http://planning.up.nic.in
17. http://panchayatiraj.up.nic.in/index4.htm
Role of Panchayati Raj Institutions in the Rural Development Programme 95

Management Trends Vol. 10, No. 1-2 June-Dece - 2013
Impact of FII on Indian Stock Market
Himani Gupta* Abstract : Foreign institutional investors have gained asignificant role in Indian capital markets. Availability offoreign capital depends on many firm specific factors otherthan economic development of the country. This paperstudies the impact of market opening to FIIs, on Indian stockmarket behavior companies included in sensitivity index(Sensex) of Bombay Stock Exchange India announced itspolicy regarding the opening of stock market to FIIs forinvestment in equity and related instruments on 14thSeptember 1992.. It is observed that foreign investorsinvested more in companies with a higher volume of sharesowned by the general public. The promoters' holdings andthe foreign investments are inversely related. Foreigninvestors choose the companies where family shareholdingof promoters is not substantial. Among the financialperformance variables the share returns and earnings pershare are significant factors influencing their investmentdecision. Using stock market data related to Bombay StockExchange, an empirical examination has been conducted toassess the impact of the market opening on the returns andvolatility of stock return. We found that while there is nosignificant changes in the Indian stock market averagereturns, volatility is significantly reduced after Indiaunlocked its stock market to foreign investors.
Key Words: foreign institutional investors, Bombay StockExchange, Sensex, share returns, earnings per share
*Assistant Professor, Jagannath International Management School; Address: K-13 A, Ground Floor,Khirki Ext, Malviya Nagar, New Delhi 110017 E- Mail: [email protected]
I. INTRODUCTION
FOREIGN investment refers to investments made by the residents of a countryinthe financial assets and production processes of another country. After theopening up ofthe borders for capital movement, these investments have grownin leaps and bounds. Theeffect of foreign investment, however, varies from countryto country. It can affect thefactor productivity of the recipient country and can alsoaffect the balance of payments. Indeveloping countries there has been a great needfor foreign capital, not only to increase
96 Himani Gupta

Management Trends Vol. 10, No. 1-2 June-Dece - 2013
the productivity of labor but also becauseforeign capital helps to build up the foreignexchange reserves needed to meet tradedeficits. Foreign investment provides a channelthrough which developing countriescan gain access to foreign capital. It can come intwo forms: foreign directinvestment (FDI) and foreign institutional investment (FII).1Foreign direct investmentinvolves in direct production activities and is also of a medium-to long-termnature. But foreign institutional investment is a short-term investment, mostlyinthe financial markets. FII, given its short-term nature, can have bidirectionalcausationwith the returns of other domestic financial markets such as moneymarkets,stock markets, and foreign exchange markets. Entities covered by the term'FII' include "Overseas pension funds, mutual funds, investment trust, asset managementcompany, nominee company, bank, institutional portfolio manager, university funds,endowments, foundations, charitable trusts, charitable societies, a trustee or power ofattorney holder incorporated or established outside India proposing to make proprietaryinvestments or investments on behalf of a broad-based fund (i.e., fund having morethan 20 investors with no single investor holding more than 10 per cent of the shares orunits of the fund)" (GOI (2005)). FIIs can invest their own funds as well as invest onbehalf of their overseas clients registered as such with SEBI. These client accounts thatthe FII manages are known as 'sub-accounts'. A domestic portfolio manager can alsoregister itself as an FII to manage the funds of sub-accounts.A few large FIIs (less than3% of all registered ones, according to GOI (2005)), issue derivative instrument s called'participatory notes' that are registered and traded overseas, backed by the FIIs' holdingsof Indian securities. This arrangement has raised some concerns in regulatory circlessince it makes it difficult to trace the ultimate beneficiary in the funds and may be usedto bring in "unclean" funds (funds generated out of illegal activities) into the Indianmarkets. . In this age of transnational capitalism, significant amounts of capital areflowing from developed world to emerging economies. Positive fundamentals combinedwith fast growing markets have made India an attractive destination for foreigninstitutional investors (FIIs). Portfolio investments brought in by FIIs have been themost dynamic source of capital to emerging markets in 1990s. At the same time there isunease over the volatility in foreign institutional investment flows and its impact on thestock market and the Indian economy. Statistical records provided by Securities andExchange Board of India (SEBI) indicated that both FIIs and domestic institutionalinvestors together influenced market sentiment.FII exerts a largerimpact on the domesticfinancial markets in the short run and a real impact in thelong run. India, being a capitalscarce country, has taken many measures to attract foreigninvestment since the beginningof reforms in 1991.. There was a surge in capital inflows into India too since 1992 as inIndia, the purchase of domestic securities by FIIs was first allowed in September 1992 aspart of the liberalization process, which affects short-term stability in the financial markets.Hence, there is a need to determine the push and pull factors behind any changein the FII,so that we can frame our policies to influence the variables that attractforeign investment.Also, FII has been the subject of intense discussion, as it is heldto be responsible forhaving intensified the currency crises of the 1990s in East Asiaand elsewhere in the world..
Impact of FII on Indian Stock Market 97

Management Trends Vol. 10, No. 1-2 June-Dece - 2013
Table 1 provides a cross section of data on the FIIs inflow and stock marketmovement, not necessarily at cause and effect relationship however this is not been testedby us anyway. The FIIs and hedge funds had pulled out money mainly due to higherinterest rates in U.S. after Federal Reserve increased interest rates to 4.5% under theirnew governor. Similar changes and took place many times in the history since openingand few times in the study.
YEAR FII INFLOW IN $ BSE SENSEX 2010:(DEC) -1,551 20509.09 2010:(NOV) -19,921 19521.25 2010:(OCT) 28,630 20032.34 2010:(SEP) 10,449 20069.12 2010:(AUG) -440 17971.12 2010:(JUL) 8,750 17868.29 2010:(JUN) 871 17700.9 2010:(MAY) -491 16944.63 2010:(APR) 3,159 17558.71 2010:(MAR) 5,206 17527.77 2010:(FEB) 230 16429.44 2010:(JAN) 3,093 16357.96
II. LITERATURE REVIEW
There have been several attempts to explain FII behavior in India. All theexistingstudies have found that equity return has a significant and positive impact onFII(Agarwal 1997; Chakrabarti 2001; Trivedi and Nair 2003). But given the huge volumeofinvestments, foreign investors can play the role of market makers and booktheir profits,that is, they can buy financial assets when the prices are declining,thereby jacking-up theasset prices, and sell when the asset prices are increasing(Gordon and Gupta 2003). Hence,there is a possibility of a bidirectional relationship
between FII and equity returns.Following the Asian financial crisis and the burstingof the info-tech bubble internationallyin 1998/99, net FII declined by U.S.$61 million.This, however, exertedlittle effect on equity returns. This negative investment mightpossibly disturbthe long-term relationship between FII and other variables such as equityreturns,inflation, and so on. Chakrabarti (2001) has perceived a regime shift in thedeterminantsof FII following the Asian financial crisis and found that in the pre-Asiancrisisperiod, any change in FII had a positive impact on equity returns. But it wasfound that inthe post-Asian crisis period, a reverse relationship has been the case,namely, that changein FII is mainly due to change in equity returns. This is a factthat needs to be taken intoaccount in any empirical investigation of FII.Investments, either domestic or foreign,depend heavily on risk factors. Hence,while studying the behavior of FII, it is important
98 Himani Gupta

Management Trends Vol. 10, No. 1-2 June-Dece - 2013
to consider the risk variable.Further, realized risk can be divided into ex-ante andunexpected risk. Ex-ante riskis an observed component and is negatively related to FII.But the relationship betweenunexpected risk and FII is obscure. Therefore, while examiningthe impactof risk on FII, one needs to separate the unobserved component from therealizedrisk. Trivedi and Nair (2003) have used only the realized risk.Another possibledeterminant of FII is the operation of foreign factors such asreturns in the source country'sfinancial markets and other real factors in the sourceeconomy. So far, however, studieshave found that both return in the source countrystock market and the inflation rate havenot exerted any impact on FII. Agarwal(1997) found that world stock market capitalizationhad a favorable impact on theFII in India.A survey of the literature shows that existingstudies do not account for volatility(the ARCH effect), which can be expected in most ofthe monthly financial timeseriesdata. Yet given the increase in financial market integration,both domesticallyand in foreign financial markets, accounting for volatility is unavoidable.Further,the existing studies either do not incorporate risk in foreign and domestic marketsormake use of realized risk, an approach that does not always yield robust results.
Literature Review as per foreign researchers on Indian market.
As the Indian equity market is growing, the trend and future prospects inforeigninstitutional investments has become a topic of great concern. A recent researchsurvey byJapan Bank for international operation (JBIC), shows that in the next 3 years,India will bethe third most favoured investment destination for Japanese investors. ASmith Barney (aCITI group Division) study says estimated market value of foreigninstitutional investment inthe top 200 companies in India (including ADRs and GRDs) atcurrent market prices isUS$43 billion. This is 18% of the market capitalization of BSE200.It is established in literature that block shareholders influence the firm performance(Cho &
Padmanabhan, 2001). Governance of listed companies plays an important role inforeignintuitional investment decisions. Further more management of businesses run byfamilygroups plays a distinctive role. When governments become block share shareholdertheirobjective will be quite different from those of private investors.Douma, Pallathiattaand Kabir (2006) investigated the impact of foreign institutionalinvestment on theperformance of emerging market firms and found that there is positiveeffect of foreignownership on firm performance. They also found impact of foreigninvestment on thebusiness group affiliation of firms. Aggarwal, Klapper and Wysocki(2005) observed thatforeign investors preferred the companies with better corporategovernance. Investorprotection is poor in case of firms with controlling shareholders whohave ability toexpropriate assets. The block shareholders affect the value of the firm andinfluence theprivate benefits they receive from the firm. Companies with such shareholderswill find itexpensive to raise external funds. Yin-Hua and Woidtke (2005) found that whencompanyboards are dominated by members who are affiliated to the controlling familyinvestorprotection will be relatively weak and it is difficult to determine the degree ofseparationof management from ownership. They also observed that firm value is negativelyrelated
Impact of FII on Indian Stock Market 99
Management Trends Vol. 10, No. 1-2 June-Dece - 2013
to board affiliation in family controlled firms. Li (2005) observed that in case ofpoorcorporate governance the foreign investors choose foreign direct investment (FDI)ratherthan indirect portfolio investment. It is generally believed that FDI could bebetterprotected by private means.Dahlquist et al. (2003) analysed foreign ownershipand firm characteristics for the Swedishmarket. They found that foreigners have greaterpresence in large firms, firms paying lowdividends and in firms with large cash holdings.They explained that firm size is driven byliquidity. They measured international presenceby foreign listings and export sales. Theyreiterated that foreigners tend to underweightthe firms with a dominant owner. Covirg etal. (2007) concluded that foreign fundmanagers have less information about the domesticstocks than the domestic fundmanagers. They found that ownership by foreign funds isrelated to size of foreign sales,index memberships and stocks with foreign listing.Li and Jeong-Bon (2004) found thatforeign investors tend to avoid stocks with high crosscorporateholdings. They suggestedthat FII are likely to be efficient processors of publicinformation and are attracted toJapanese firms with low information asymmetry. Morin(2000) explored the influenceof French model of shareholding and management on FII.They commented that Francehas undergone rapid change from a financial networkeconomy to a financial marketeconomy. The new pattern has broken the traditional systemof cross holding andfacilitated the arrival of FII who bring with them new techniques anddemands efficientcorporate management.What could be firm level factors that influence foreign capitalfrom an economic standpointis the question yet to be answered. Outside investors willlower the price they pay if theyfear consumption of private benefits of control family.Choe, Kho, Stulz (2005) found thatUS (United States) investors do indeed hold fewershares in firms with ownership structuresthat are more conducive to expropriation bycontrolling insiders. In companies whereinsiders are dominating information accessand availability to the shareholders will belimited. With less information, foreigninvestors face an adverse selection problem. So theyunder invest in such stocks.Leuz,Nanda and Wysocki (2003) further asserted that the information problemscauseforeigners to hold fewer assets in firms. Firm level characteristics can be expectedtocontribute to the information asymmetry problems. Concentrated family control makesitmore likely that information is communicated via private channels. Informativeinsidershave incentives to hide the benefits from outside investors by providing opaquefinancialstatements and managing earnings. Haw, Hu, Hwang and Wu, (2004) also foundthat firmlevel factors cause information asymmetry problems to FII. Their paper foundevidence thatUS investment is lower in firms where managers do not have effectivecontrol. Foreigninvestment in firms that appear to engage in more earnings managementis lower incountries with poor information framework. There is a growing literature onthe determinants of global investment flows and allocations.Prior research focused oninternational portfolio flows and examined the relationshipbetween portfolio flows andstock returns. Most of these studies have analyzed global andcountry level factors thatinfluence investment allocations. This paper investigatedempirically the firm specificvariables, which influence the investment decision of foreigninvestors.
100 Himani Gupta

Management Trends Vol. 10, No. 1-2 June-Dece - 2013
III. Data and Methodology
The present study is based on the secondary data. The data for the net flows ofForeign Institutional Investors (FIIs) and Sensitivity Index closing points is collectedfrom http://www.5paisa.com and http://in.finance.yahoo.com for the duration of 4 yearsbetween January, 2007 and December, 2010 excluding days data set which was notavailable. A set of 16 samples out of 48 monthly observations from the above mentionedrange of historical data were collected to study the distribution of correlation. MS Excelhas been used for plotting of graphs and analysis of data and SEBI and Centre forMonitoring Indian Economy (CMIE) Prowess Database has been used for collection ofdata otherwise.
The correlation values for samples are calculated through and result it interpreted.Spearman's Coefficient of correlation for the sample is calculated by??? = ? s ??? ? - s ?? s ? ?? ? s ??2 - (s ??)2? ? s ??2 - (s ??)2 - 1 = ??? = 1)
Where x and y are the data variables and n denotes the no. of data sets.
IV Result and Analysis
Another important measure of FIIs impact on SENSEX is the movement andcomparison between volatility and return on SENSEX. The movement of returns andvolatility suggests anpositive relationship. It can be observed that movement of the returnson SENSEX and volatility is not only cyclical but it is notable that the peak of the formercoincides with the peak of the latter and vice-versa. The 48 months data on net FII inflowsand volatility respect to net FII inflows and Returns on SENSEX, the time series data for39 months shows a shows positive correlation. Despite being significant it suggests ahigher net FII inflow would lessen the volatility in the SENSEX. Positive and significantcorrelation and same has been depicted by the Graph shown below
Graph 1: Net FII Flows and BSE Sensitive Index
Impact of FII on Indian Stock Market 101
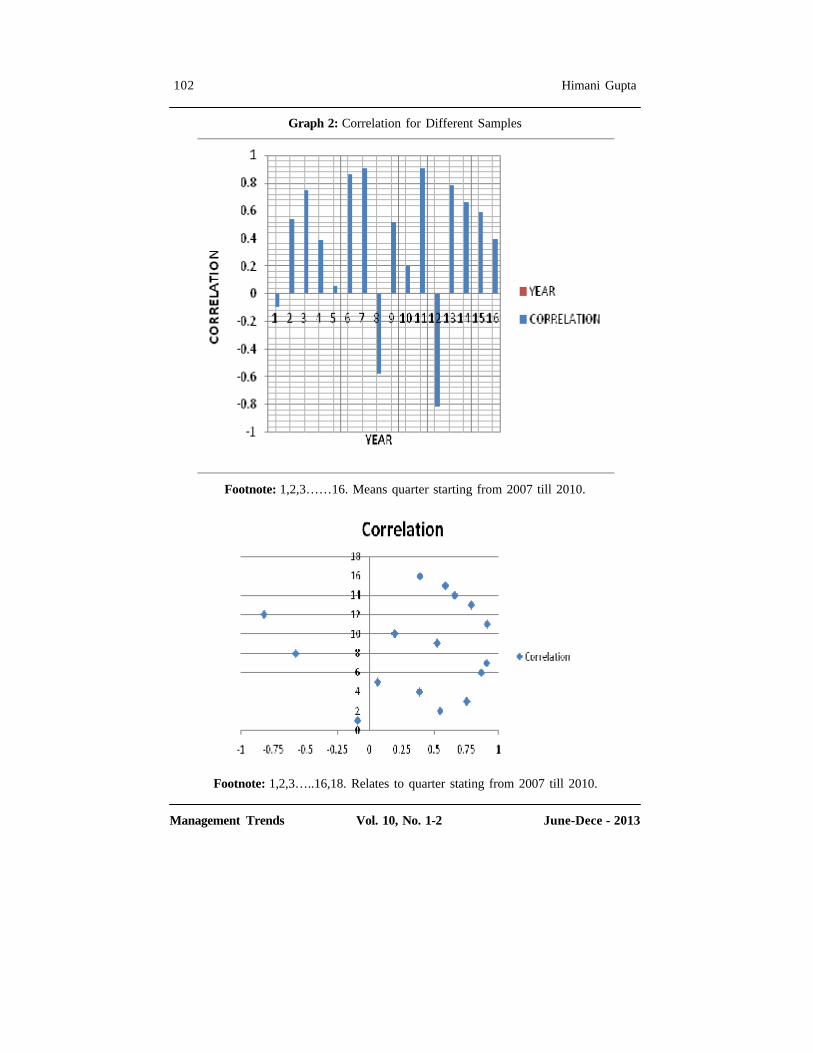
Management Trends Vol. 10, No. 1-2 June-Dece - 2013
Graph 2: Correlation for Different Samples
Footnote: 1,2,3……16. Means quarter starting from 2007 till 2010.
Footnote: 1,2,3…..16,18. Relates to quarter stating from 2007 till 2010.
102 Himani Gupta

Management Trends Vol. 10, No. 1-2 June-Dece - 2013
V. Conclusion
Sampling distribution of correlation obtained shows a range of --0.82096 to amaximum of 0.910743 with 25% values lying at 0.162003, 50% of the values lying at0.535007and 75% of the values lying at 0.786959. The result shows that correlationbetween FII and BSE SENSEX is moderate because most of the values are following inthe bracket of + 0.25 and + 0.75 so it can be concluded that impact of FII on Indian stockmarket (which is BSE in this case ) is moderate as there are many other internal andexternal factors affecting the return of the stock market. Though it is a popular belief thatFII and SENSEX are positively correlated, our analysis also shows that there have beenmany instances for a negative correlation between the net FII and SENSEX.
References
l Aggrawal, Reena, L. Klapper and P. Wysocki (2005), Portfolio Preferences of ForeignInstitutional Investors, Journal of Banking and Finance, Elsevier, vol. 29(12), pp 2919-2946.
l Gordon, James and Poonam Gupta (2003), Portfolio Flows into India: Do DomesticFundamentals Matter, June, IMF Working Paper No. 03/20.
l Mohan, T. T. Ram (2005), Taking Stock of Foreign Institutional Investors, Economicand Political Weekly, Vol. 40, No. 24.
l Pal, Parthapratim, (1998), Foreign Portfolio Investment in Indian Equity Markets:Has the Economy Benefited, Economic and Political Weekly, Vol. 33, No.11.
l Chakrabarti, R (2001), FII Flows to India: Nature and Causes, Money and Finance,Oct-Dec, Vol.2, Issue 7.
l Agarwal, R. N. (1997), Foreign Portfolio Investment in Some Developing Countries:A study of Determinants and Macroeconomic Impact, Indian Economic Review, Vol.XXXII, No. 2, pp.217-229.
l Samal, C. Kishore (1997), Emerging Equity Market in India: Role of ForeignInstitutional Investors, Economic and Political Weekly, Vol. 32, No. 42.
l Trivedi, Pushpa and N. Abhilash, (2003), Determinants of FII Investment Inflow toIndia, paper presented in 5th Annual conference on Money & Finance in The IndianEconomy, Indira Gandhi Institute of Development Research, unpublished work.
l Kumar Saji (2006), FIIs Vs. SENSEX: An Emerging Paradigm, Treasury Management,ICFAI University Press, February.
l Singh, Rahul and P N Mishra (2005), Information and Stock Market Volatility: AStudy of SENSEX, Journal of Insurance and Risk Management, Vol. III, Issue 06, pp105.
Impact of FII on Indian Stock Market 103

Management Trends Vol. 10, No. 1-2 June-Dece - 2013
1. Introduction
The duration of trading period in the BSE is 5 days in a week. It starts on Mondayand ends with Friday. The mechanism of rolling settlement is T+2. Consequently, thedeals are to be closed on the next two days of trading. For the purpose of settlement, allthe trades are squared up in their trading positions. Squaring up the transaction meansacquiring the shares in case of short sales or selling the shares if there is no money to payfor the purchase of shareswhatever the case may be.
If any trader, who is a short seller, is not able to acquire the shares required fordelivery, the position of that trader will be subjected to an auction. This action may resultin a great loss. Thus, there is a pressure on traders for buying or selling of shares as the
Last Day of the Trading Period Effect on Volatility inPrices of Stocks of Bombay Stock Exchange Limited
Venkataramanaih. M*
* Professor & Principal, Vignanasudha Institute of Management & Technology, Chittoor- 517 100; [email protected] +9189850 52430 +9173960 82025
Abstract : The present study enquiries the effect of lasttrading day of the week on volatility in the prices of stocksof the Bombay Stock Exchange Limited. ). In the study, Fridayhas been taken as the proxy of the last trading day of thetrading period. Here, the study period is one year, i.e. 2010.The analysis is presented only as a case study by assumingthat it represents the rest of the period. The volatility for 252trading days was computed during 2010. The percentagedeviation of half the spread between high-low values of indexfrom the mid-value of high-low spread of index was takenas a measure of volatility. The study found that that there isno enough evidence of effect of last trading day of the tradingperiod on volatility in the prices of the BSE. The IT, TECHand CG sectors are exceptional to this phenomenon. Therest of sectoral indices including sensex exhibits less volatilityduring the last trading day of the trading period. The lessvolatile days and average volatile days is more than that ofmore volatile days in all the sectors. Therefore, it mayconclude that the effect of last trading day effect of thetrading period is minimal on the volatility of prices of stocksin the BSE.
Keywords: Volatility, Trading, BSE, India
104 Venkataramanaih. M.
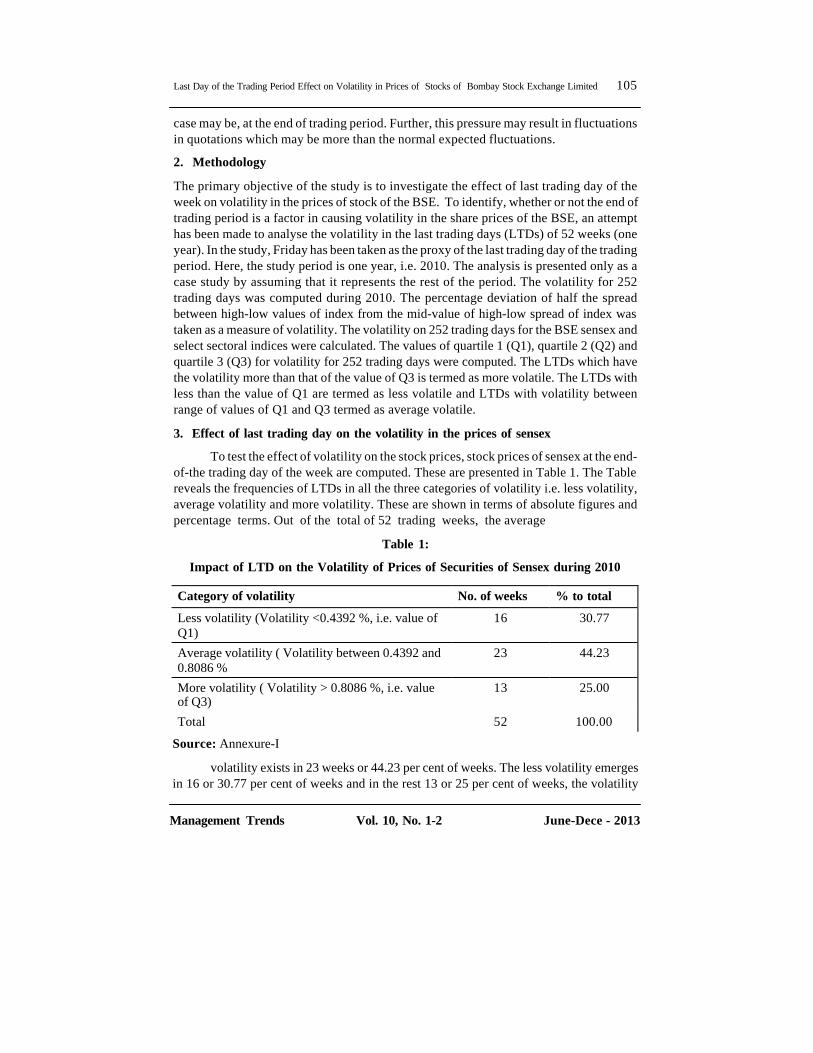
Management Trends Vol. 10, No. 1-2 June-Dece - 2013
case may be, at the end of trading period. Further, this pressure may result in fluctuationsin quotations which may be more than the normal expected fluctuations.
2. Methodology
The primary objective of the study is to investigate the effect of last trading day of theweek on volatility in the prices of stock of the BSE. To identify, whether or not the end oftrading period is a factor in causing volatility in the share prices of the BSE, an attempthas been made to analyse the volatility in the last trading days (LTDs) of 52 weeks (oneyear). In the study, Friday has been taken as the proxy of the last trading day of the tradingperiod. Here, the study period is one year, i.e. 2010. The analysis is presented only as acase study by assuming that it represents the rest of the period. The volatility for 252trading days was computed during 2010. The percentage deviation of half the spreadbetween high-low values of index from the mid-value of high-low spread of index wastaken as a measure of volatility. The volatility on 252 trading days for the BSE sensex andselect sectoral indices were calculated. The values of quartile 1 (Q1), quartile 2 (Q2) andquartile 3 (Q3) for volatility for 252 trading days were computed. The LTDs which havethe volatility more than that of the value of Q3 is termed as more volatile. The LTDs withless than the value of Q1 are termed as less volatile and LTDs with volatility betweenrange of values of Q1 and Q3 termed as average volatile.
3. Effect of last trading day on the volatility in the prices of sensex
To test the effect of volatility on the stock prices, stock prices of sensex at the end-of-the trading day of the week are computed. These are presented in Table 1. The Tablereveals the frequencies of LTDs in all the three categories of volatility i.e. less volatility,average volatility and more volatility. These are shown in terms of absolute figures andpercentage terms. Out of the total of 52 trading weeks, the average
Table 1:
Impact of LTD on the Volatility of Prices of Securities of Sensex during 2010
Category of volatility No. of weeks % to total
Less volatility (Volatility <0.4392 %, i.e. value of Q1)
16 30.77
Average volatility ( Volatility between 0.4392 and 0.8086 %
23 44.23
More volatility ( Volatility > 0.8086 %, i.e. value of Q3)
13 25.00
Total 52 100.00
Source: Annexure-I
volatility exists in 23 weeks or 44.23 per cent of weeks. The less volatility emergesin 16 or 30.77 per cent of weeks and in the rest 13 or 25 per cent of weeks, the volatility
Last Day of the Trading Period Effect on Volatility in Prices of Stocks of Bombay Stock Exchange Limited 105

Management Trends Vol. 10, No. 1-2 June-Dece - 2013
is more. It may be concluded that there is no evidence to show that there is high volatilityin the sensex as low and average volatility weeks together accounted for 75 per centduring 2010.
3.1 Effect of LTD on the volatility of prices of securities of sectoral indices
The effect of LTD of the week on the volatility of prices of securities in the selectsectoral indices during 2010 is evaluated. Table 2 presents the level of volatility in theprices of BSE100 sector. It can be observed that the average volatility is 26 out of 52weeks. It accounts for 50 per cent in the total number of weeks. The less volatility andmore volatility weeks were 15 and 11 respectively. These two have together constituted50 per cent in the volatility weeks. It may
Table 2:
Impact of LTD on the Volatility of Prices of Securities ofBSE100 Sector during 2010
Category of volatility No. of weeks
% to total
Less volatility (Volatility <0.3677 %, i.e. value of Q1) 15 28.85 Average volatility ( Volatility between 0.3677 and 0.6906 % 26 50.00 More volatility ( Volatility > 0.6906%, i.e. value of Q3) 11 21.15 Total 52 100.00
Source: Annexure-IIBe noted that the former forms 28.85 per cent while the latter 21.15 per cent
sequentially. It may be summed up that the LTD of the week has not contributed much forvolatility in the prices of securities under BSE100 sector.
Table 3 shows the range of volatility in the prices of securities of FMCD on accountof LTD of the week during 2010. A look at the Table reveals that the average volatilityspans over 25 or 48.08 per cent of total number of weeks in the year whereas less volatilityweeks are 15 or 28.84 per cent. This sector has experienced more volatility in 12
Table 3:
Effect of LTD on the Volatility of Prices of Securities ofBSE FMCD Sector during 2010
Source: Annexure-III
Kind of volatility No. of weeks
% to total
Less volatility (Volatility <0.6667 %, i.e. value of Q1) 15 28.84 Average volatility ( Volatility between 0.6667 % and 1.2430 % 25 48.08
More volatility ( Volatility > 1.2430%, i.e. value of Q3) 12 23.08 Total 52 100.00
106 Venkataramanaih. M.

Management Trends Vol. 10, No. 1-2 June-Dece - 2013
or 23.80 per cent in the aggregate number of weeks. It is evident that the averageand less volatility weeks have together accounted for 78.85 per cent in the total numberof weeks. It may be concluded that the LTD of the week has no impact on the volatility ofprices of securities forming part of FMCD sector.
In the case of CG sector, the less volatility is spread over 14 weeks, which accountsfor 26.92 per cent in the total number of weeks in the year (see Table 4). The morevolatility weeks are 14, recording a share of 26.92 per cent in the total. The averagevolatility weeks are 24
Table 4:
Effect of LTD on the Volatility in the Prices of Securities ofCG Sector for the year 2010
Source: Annexure-IV
or 46.16 per cent. This situation in the CG sector contradicts that of BSE 100 andFMCG sectors. In other words, the LTD exercises impact on the volatility in the prices ofsecurities under CG sector.
It can be gauged from Table 5 that the less volatile and more volatile weeks stoodat 15 and 13 serially in the year. Their proportions in the total number of weeks are 28.85per cent and 23.08 per cent sequentially. The average volatility weeks are 24 or 46.16 percent. It may be summed up that LTD has not contributed significantly to volatility in theprices of securities of FMCG sector since more volatile weeks are less than the lowervolatile weeks during 2010.
Table 5:
Impact of LTD on Volatility of the Price of Securities under FMCGSector during 2010
Category of volatility No. of weeks
% to total
Less volatility (Volatility <0.4804 %, i.e. value of Q1) 14 26.92 Average volatility ( Volatility between 0.4804 % and 0.8598 % 24 46.16 More volatility ( Volatility > 0.8598 %, i.e. value of Q3) 14 26.92 Total 52 100.00
Category of volatility No. of weeks
% to total
Less volatility (Volatility <0.4936 %, i.e. value of Q1) 15 28.84 Average volatility ( Volatility between 0.4936 % and 0.8627 % 24 46.16
More volatility ( Volatility > 0.8627 %, i.e. value of Q3) 13 25.00
Total 52 100.00
Source: Annexure-V
Last Day of the Trading Period Effect on Volatility in Prices of Stocks of Bombay Stock Exchange Limited 107

Management Trends Vol. 10, No. 1-2 June-Dece - 2013
With regard to HC sector, the less, average and more volatile weeks are 15, 25 and12 respectively (see Table 6). The share of each of these is 28.85 per cent, 48.07 per centand 23.08 per cent sequentially. This trend is similar
Table 6:
Effect of LTD on the Volatility in the Prices of Securities of HC sector during 2010
Source: Annexure-VI
to that of FMCG sector. The less volatile weeks are greater than that of morevolatile weeks. Therefore, it may be said that LTD has no impact on the volatility in theprices of securities constituting HC sector.
A glance at the Table 7 shows that, in the IT sector, less volatility weeks are 15. Inanother 15 weeks, the volatility is more. The average volatility is spread over 22 or 42.30per cent of weeks. It may be noted that the intensity of volatility is relatively more thanthat of CG sector. The conclusion which
Table 7:
Impact of LTD on Volatility in the Prices of Securities of IT Sector during 2010
Category of volatility No. of weeks
% to total
Less volatility (Volatility <0.4804 %, i.e. value of Q1) 15 28.85 Average volatility ( Volatility between 0.4804 % and 0.8598 % 25 48.07 More volatility ( Volatility > 0.8598 %, i.e. value of Q3) 12 23.08 Total 52 100.00
Source: Annexure-VII
could be reached here conflicts with the ones drawn in the remaining sectoralindices leaving CG. Between CG and IT sectors, the effect of LTD on the volatility in theprices of the latter surpasses that of the former.
Table 8 portrays the pace of volatility in the prices of securities of PSU sectorduring 2010. It can be observed that the less volatile weeks are higher than more volatileweeks. The former and the latter have constituted 28.85 per
Category of volatility No. of weeks
% to total
Less volatility (Volatility <0.4910 %, i.e. value of Q1) 15 28.85 Average volatility ( Volatility between 0.4910 % and 0.9697 % 22 42.30 More volatility ( Volatility > 0.9697 %, i.e. value of Q3) 15 28.85 Total 52 100.00
108 Venkataramanaih. M.

Management Trends Vol. 10, No. 1-2 June-Dece - 2013
Table 8:
Impact of LTD on the Volatility in the Prices of PSU Sector for the year 2010
Source: Annexure-VIII
cent and 23.08 per cent serially. The average volatility covers 25 or 48.07 weeks.The results show that the effect of LTD on the volatility in the prices of securitiesconstituting PSU sector is absent.
It can be observed that the LTD has influence over the volatility in the prices ofsecurities forming part of TECH sector. This is based on the fact that
Table 9:
Volatility in the BSE TECH on Last Trading Day of the Week during 2010
Category of volatility No. of weeks
% to total
Less volatility (Volatility <0.4910 %, i.e. value of Q1) 15 28.85 Average volatility ( Volatility between 0.4910 % and 0.9697 % 25 48.07 More volatility ( Volatility > 0.9697 %, i.e. value of Q3) 12 23.08 Total 52 100.00
Source: Annexure-IX
the average volatile weeks are less than that of the aggregate of less and morevolatile weeks. The less and more volatile weeks are 30 whilst the average volatile weeksare 22. From the aforesaid analysis, we can deduce that LTD has impact on the volatilityin the prices of securities of CG, IT and TECH sectors only. In other words, the LTD hasno impact on the rest of five sectoral indices. Similar is in the case with securitiesconstituting sensex.
4. Summary of findings and conclusion
Out of the total of 52 trading weeks, the average volatility in sensex exists in 23weeks or 44.23 per cent of weeks. The less volatility emerges in 16 or 30.77 per cent ofweeks and in the rest 13 or 25 per cent of weeks, the volatility is more. In BSE 100, theaverage volatility is 26 weeks or 50 per cent of total number of weeks. The less volatilityand more volatility weeks were 15 and 11 respectively. The FMCD sector has experiencedmore volatility in 12 or 23.80 per cent in the aggregate number of weeks. In the case ofCG sector, the less volatility is spread over 14 weeks, which accounts for 26.92 per cent
Category of volatility No. of weeks
% to total
Less volatility (Volatility <0.4713 %, i.e. value of Q1) 15 28.85 Average volatility ( Volatility between 0.4713 % to 0.8571 % 22 42.30 More volatility ( Volatility > 0.8571 %, i.e. value of Q3) 15 28.85 Total 52 100.00
Last Day of the Trading Period Effect on Volatility in Prices of Stocks of Bombay Stock Exchange Limited 109

Management Trends Vol. 10, No. 1-2 June-Dece - 2013
in the total number of weeks in the year. The more volatility weeks are 14, recording ashare of 26.92 per cent in the total. The average volatility weeks are 24 or 46.16 per cent.The less volatile and more volatile weeks in FMCG sector stood at 15 and 13 serially inthe year. The average volatility weeks are 24 or 46.16 per cent. With regard to HC sector,the less, average and more volatile weeks are 15, 25 and 12 respectively. The share ofeach of these is 28.85 per cent, 48.07 per cent and 23.08 per cent sequentially. In the ITsector, less volatility weeks are 15. In another 15 weeks, the volatility is more. The averagevolatility is spread over 22 or 42.30 per cent of weeks. In PSU sector, the less volatileweeks are higher than more volatile weeks. The average volatility covers 25 or 48.07weeks. The average volatile weeks are less than that of the aggregate of less volatileweeks and more volatile weeks in Tech sector. In this sector, the less and more volatileweeks are 30 whilst the average volatile weeks 22.
On the basis above discussion it may be concluded that there is no enough evidenceof effect of last trading day of the trading period on volatility in the prices of the BSE.The IT, TECH and CG sectors are exceptional to this phenomenon. The rest of sectoralindices including sensex exhibits less volatility during the last trading day of the tradingperiod. The less volatile days and average volatile days is more than that of more volatiledays in all the sectors. Therefore, it may conclude that the effect of last trading day effectof the trading period is minimal on the volatility of prices of stocks in the BSE.
References
(1) Cross, F.. 1973, Thebehavior of stock prices on Fridays and Mondays, FinancialAnalysts Journal 4. 67-69.
(2) Fama, E., 1965, Thebehavior of stock prices. Journal of Business 38, 383-417.
(3) French, K., 1980, Stock returns and the weekend effect. Journal of FinancialEconomics 8, 55-70.
(4) Gibbons, M. and P. Hess, 1981, Day of the week effects and asset returns, Journalof Business 54, 579-596.
(5) Harris, L.. 1986, A transaction data study of weekly and intradaily patterns in stockreturns, Journal of Financial Economics 16. 99-117.
(6) Keim. D. and R. Stambaugh, 1984. A further investigation of the weekend effect instock returns, Journal of Finance 39, 819-835.
(7) Lakonishok, J. and M. Levi, 1982, Weekend effects on stock returns: A note, Journalof Finance 37, 883-889.
(8) Prince, P.. 1982, Day of the week effects: Hourly data. Unpublished manuscript(University of Chicago, Chicago, IL).
(9) Rogalski, R., 1984, New findings regarding day of the week returns over trading andnon-trading periods, Journal of Finance 39, 1603-1614.
(10) Scholes. M. and J. Williams, 1977. Estimating betas from non-synchronous data,Journal of Financial Economics 4, 309-327.
110 Venkataramanaih. M.

Management Trends Vol. 10, No. 1-2 June-Dece - 2013
Introduction
Accomplishment of organizational goal is of the biggest challenges for managersin this century. Managers have been struggling to experiment with different techniques toimprove organizational performance. Among those suggested techniques, concepts likeTotal Quality Management (TQM) and Business Process Reengineering (BPR) earnedrecognition from many authors in the second half of twentieth century and were foundhelpful in increasing organizational performance by focusing on operational and processimprovements.They were/still being used as tools for management in their effort to plan,execute and control of the desired changes in the operational quality. The concept ofEmployee Engagement is also doing round of late which signifies level of commitmentand emotional attachment of employees towards their organization. Employers now realize
Employee Engagement - A Key to OrganizationalSuccess
* Director, Shree Swaminarayan Institute of Management, Porbandar - 360578 Email :[email protected]
Viralkumar Shilu* Abstract : Employee engagement is an approach whichtouches almost all parts of human resource management inan organization. If every part of human resources is notaddressed in appropriate manner, employees fail to fullyengage themselves in their job which results in tounproductive organizational performance. The concept ofemployee engagement is built on the foundation of earlierconcepts like job satisfaction, employee commitment andOrganizational citizenship behavior. Though it is related toand encompasse sthese concepts, employee engagement isbroader in scope. Employee engagement is strongerpredictor of positive organizational performance clearlyshowing the two-way relationship between employer andemployee compared to the three earlier constructs: jobsatisfaction, employee commitment and organizationalcitizenship behavior. Engaged employees are emotionallyattached to their organization and highly involved in theirjob with a great enthusiasm for the success of their employer,going extra mile beyond the employment contractualagreement.
Keywords: Employee engagement, Employee commitment,Job satisfaction
Employee Engagement - A Key to Organizational Success 111

Management Trends Vol. 10, No. 1-2 June-Dece - 2013
that by focusing on employee engagement, they can create more efficient and productiveworkforce. Any initiatives of improvement which are taken by management cannot befruitful without will ful in volvement and engagement of employees.
Employee engagement is a workplace approach designed to ensure that employeesare committed to their organization's goals and values, motivated to contribute toorganizational success, and are able at the same time to enhance their own sense of well-being. Though the concept of Employee Engagement is very comprehensive; this articlelimits itself to discuss only the basic concepts on employee engagement based on recentliteratures. The article explores the evolution of the concept, its definition and how it isdifferent from the earlier concepts such as Commitment, Organizational CitizenshipBehavior (OCB) and job satisfaction. Secondly, the articled is cusses the factors or driversleading to engagement. It details the impact of employee engagement on organizationalperformance indicators or business out comes such as profitability, customer satisfaction,company growth, productivity and others pointing out its benefits and importance toorganizations. Finally, the article suggests strategies the companies should take up tokeep employees engaged in their jobs.
Employee Engagement
Employee engagement refers to a condition where the employees are fully engrossedin their work and are emotionally attached to their organization. One can't achieve anythingunless and until one is serious about it. An employee must be dedicated towards his workand should take it as a challenge. Work should never get monotonous as it would then bea burden for the individual.Problems arise when individuals have nothing creative to doand sit idle the whole day. They start interfering in each other's work and tend to becomenegative for the organization. They start finding reasons to fight with their fellow workersand crib about almost everything.
Additionally, there are differences between attitude, behavior and outcomes interms of engagement. An employee might feel pride and loyalty (attitude); be a greatadvocate of their company to clients, or go the extra mile to finish a piece of work(behavior). Outcomes may include lower accident rates, higher productivity, fewerconflicts, more innovation, lower numbers leaving and reduced sickness rates. But webelieve all three - attitudes, behaviors and outcomes - are part of the engagement story.There is a virtuous circle when the pre-conditions of engagement are met when thesethree aspects of engagement trigger and reinforce one another.It is to be stated that engagedorganizations have strong and authentic values, with clear evidence of trust and fairnessbased on mutual respect, where two way promises and commitments - between employersand staff - are understood, and are fulfilled.Although improved performance andproductivity is at the heart of engagement, it cannot be achieved by a mechanistic approachwhich tries to extract discretionary effort by manipulating employees' commitment andemotions. Employees see through such attempts very quickly; they lead instead to cynicismand disillusionment. By contrast, engaged employees freely and willingly give discretionaryeffort, not as an 'add on', but as an integral part of their daily activity at work.
112 Viralkumar Shilu
Management Trends Vol. 10, No. 1-2 June-Dece - 2013
The employees must be assigned challenging assignments as per their interestsand expectations so that they devote their maximum time to work rather than loiteringand gossiping around. The team leaders or the managers must ensure to review their teammember's performance on a weekly basis to find out whether they are enjoying their workor not? An employee must not treat his organization as a mere source of earning moneyonly. An organization is a place where employees are motivated to upgrade their skillsand learn something new every day. One must respect and love his job and to expect thesame. Never talk ill of your organization in front of anyone.
Various studies have shown that actively engaged employees are almost 50 percentmore productive than their not-engaged or disengaged colleagues. The employeeengagement cannot be improved only by designing and implementing effective humanresource strategies but their involvement and quality of output produced by them alsodepends on their relationships with their colleagues, subordinates and seniors. It is abasic need of human beings to belong and to be belonged. Such collaborations can be amajor contributor to the success of a company.
Until recently, solutions facilitating two-way communication including top-to-bottom and bottom-to-top were given much important but nothing has been done to fosterthe open communication and collaborations among employees. The way they interactwith each other determines the health of any organization. A perfect balance of respect,care and competitiveness should be prevailed in the organization to keep them activelyengaged in their jobs. Mutual support and healthy relationships contribute majorly to theorganization's success.
Employee Engagement and Organizational Performance
Investing for Employee Engagement is fruitful practice. Studies have found positiverelationship between employee engagement and organizational performance outcomes:employee retention, productivity, profitability, customer loyalty and safety. Researchesalso indicate that the more engaged employees are, the more likely their employer is toexceed the industry average in its revenue growth.
Effective ways to enhance Employee Engagement
Understanding Employees: The team leader should understand his members well.Do not assign anything which the employee would not find interesting.
Effective communication: It enhances employee engagement. Make sure there istransparency in communication at all levels and everyone is aware of what is happeningaround him.
Motivation: The management must constantly motivate his employees. Cash prizes,trophies, gift vouchers, certificates are an effective way to motivate the employees andkeep them engaged in their work. Give them a target and ask them to achieve that within
Employee Engagement - A Key to Organizational Success 113
Management Trends Vol. 10, No. 1-2 June-Dece - 2013
a particular time frame to earn handsome incentives or lucrative prizes. This way, theemployees would not waste their time and spend their maximum time working and aimingfor the rewards.
Work life Balance: Be friendly with your team. Don't ask them to stay back lateunnecessarily. They are likely to commit more mistakes and eventually lose interest inwork. Let them go back home on time and enjoy their personal lives as well. Rejuvenationis essential for an individual to remain happy and stress free. More than a strict boss, bea mentor to them and stand by them always.
Creativity: Encourage your team members to think out of the box. Ask them dotheir work in a little different way than they normally do. The employees must put on theirthinking caps at workplace and accomplish the task in the most innovative way.
Such activities help the employees to develop a sense of trust and loyalty towardsthe management and stick to the organization for a longer period of time. They considerthe organization's goals as their goals and thus try to achieve them at any cost. Theemployees learn to take ownership of their work and do every possible thing which satisfiesthem as well as the organization.
Conclusion
Companies with engaged employees have higher employee retention, productivity,profitability, growth and customer satisfaction. On the other hand, companies withdisengaged employees suffer from waste of effort and bleed talent, earn less commitmentfrom the employees, face increased absenteeism and have less customer orientation, lessproductivity, and reduced operating margins and net profit margins. Most researchesemphasize merely on the importance and positive impacts of employee engagement onthe business outcomes, failing to provide the cost-benefit analysis for engagementdecisions. As any other management decisions, engagement decision should be evaluatedin terms of both its benefits and its associated costs, without giving greater emphasis toneither of the two, not to bias the decision makers. Thus there is a need to study the costaspect of engagement decisions. Findings of various researches suggest their own strategiesin order to keep employees engaged. Here in this article the points or strategies called‘‘the essential tablets” were suggested to keep employees engaged. For managers, workof employee engagement starts at day one through effective recruitment and orientationprogram, the work of employee engagement begins from the top as it is unthinkable tohave engaged people in the organizations where there is no engaged leadership. Managersshould enhance two-way communication, ensure that employee shave all there sourcesthey need to do their job, give appropriate training to increase their knowledge and skill,establish reward mechanisms in which good job is rewarded through various financialand non-financial incentives, build a distinctive corporate culture that encourages hardwork and keeps success stories alive, develop a strong performance management systemwhich holds managers and employees accountable for the behavior they bring to the workplace, focuson top-performing employees and maintain or increase business performance.
114 Viralkumar Shilu

Management Trends Vol. 10, No. 1-2 June-Dece - 2013
References:
1. Accord Management Systems. (2004). Employee Engagement Strategy : A Strategyof Analysis to Move from Employee Satisfaction to Engagement. [Online] Available:www.accordsyst.com/papers/engagement_wp.pdf (March 3, 2009)
2. Buckingham M., and Coffman C. (2005). First, break all the rules. Pocket Books,London.
3. Coffman, C., and Gonzalez-Molina, G. (2002). Follow this Path : How the world’sgreatest organizations drive growth by unleashing human potential. New YorkWarner Books, Inc.
4. Development Dimensions International. (2005). (Predicting Employee EngagementMRKSRR12-1005
5. Development Dimensions International, Inc., MMV. [Online] Available :www.ddiworld.com (October 30, 2008)
6. Erickson, T.J. (2005). Testimony submitted before the US Senate Committee onHealth, Education, Labor and Pensions, May 26.
7. Human Resources. (2007). Research: Employee engagement ROI-rules ofengagement [Online] Available: http://global. factiva.com/ha/default.aspx. (October28, 2008)
8. Melcrum publishing. (2005). Employee engagement: How to build a high-performance workforce. An independent Melcrum Research Report ExecutiveSummary.
9. Rafferty A.M., Maben J., West E., and Robinson D. (2005). What makes a goodemployer ? Issue Paper 3 International Council of Nurses Geneva
10. Vance R. J. (2006). Employee Engagement and Commitment SHRM Foundation,USA
11. Watson Wyatt Worldwide. (2005). Employee Engagement and Talent Management.[Online] Available: www.watsonwyatt.com (March 3, 2009)
Employee Engagement - A Key to Organizational Success 115


