27
Management’s Discussion & Analysis of Financial Condition and Financial Performance For the three months ended June 30, 2013 Dated August 22, 2013

Management’s Discussion &
Analysis
of Financial Condition and
Financial Performance
For the three months ended June 30, 2013
Dated August 22, 2013

Table of Contents
BUSINESS OVERVIEW ............................................................................................ 3 The Effect of Rate Regulation.............................................................................. 5
FINANCIAL AND OPERATIONAL OVERVIEW ........................................................... 6 Training .............................................................................................................. 8 Safety and Security............................................................................................. 7 Revenue.............................................................................................................. 9 Expenses........................................................................................................... 17
LIQUIDITY AND CAPITAL RESOURCES ................................................................. 18
SUMMARY OF QUARTERLY RESULTS ..................................................................... 20
INVESTING IN OUR CAPITAL ASSETS................................................................... 21
OUTLOOK ............................................................................................................. 24
FINANCIAL RISKS ................................................................................................ 25
BUSINESS RISK MANAGEMENT............................................................................. 25
ACCOUNTING PRACTICES..................................................................................... 26
FORWARD LOOKING STATEMENTS ....................................................................... 27

3
Management’s Discussion & Analysis of Financial Condition and Financial Performance For the three months ended June 30, 2013
Dated August 22, 2013 The following is our discussion and analysis of the financial condition and financial performance
for British Columbia Ferry Services Inc. as of August 22, 2013. This should be read in conjunction with our unaudited consolidated financial statements and related notes for the three month periods ended June 30, 2013 and 2012, and our audited consolidated financial statements and related notes for the years ended March 31, 2013 (fiscal 2013) and March 31,
2012 (fiscal 2012), together with our Management’s Discussion & Analysis for fiscal 2013. These documents are available on SEDAR at www.sedar.com and on our investor webpage at http://www.bcferries.com/about/investors/index.html.
Except where indicated, all financial information herein is expressed in Canadian dollars and determined on the basis of International Financial Reporting Standards (IFRS).
BUSINESS OVERVIEW
British Columbia Ferry Services Inc. is an independent company providing ferry services on the west coast of British Columbia. We operate one of the largest and most complex ferry systems in the world. We provide frequent year-round transportation service with 35 vessels operating
on 25 routes out of 47 terminals spread over 1,000 miles of coastline. We also manage ferry transportation service on other remote routes through contracts with independent operators. Our service is an integral part of British Columbia’s coastal transportation system and has been
designated by the Province of British Columbia (the Province) as an essential service for purposes of the provincial Labour Relations Code. This designation means our services are considered necessary for the protection of the health, safety and welfare of the residents of
British Columbia. We provide a wide range of ferry services for our customers. During the three months ended June 30, 2013 (the first quarter of fiscal 2014), we provided over 45,000 sailings, carrying 5
million passengers and 2 million vehicles. We experienced a 1.8% decline in vehicle traffic and a 1.4% decline in passenger traffic compared to the same quarter in the prior year, primarily due to the timing of Easter weekend. For a discussion of our traffic levels, see “Financial and
Operational Overview” below. Significant events during or subsequent to our first quarter of the year ending March 31, 2014 (fiscal 2014) include the following:
• On April 3, 2013, an amendment to the Coastal Ferry Services Contract (CFSC) was agreed
to with the Province. This amendment extended the deadline for identifying service level adjustments required over the remainder of performance term three (PT3). The Province
also agreed to pay us ferry transportation fees in the amount of $7.1 million in 9 equal monthly instalments commencing July 2013. Specific service level adjustments to core service levels designed to achieve a further $18.9 million in net savings over the remainder
of the performance term are expected to be determined by March 31, 2014. (See “Outlook” below for more detail.)
• On April 15, 2013, the Commissioner issued Order 12-02A, reducing the service level
adjustments to achieve a total of $22.9 million in net savings during the remainder of PT3, to reflect the $7.1 million received from the Province. (See “Outlook” below for more detail.)

4
• On July 19, 2013, the British Columbia Ferries Commissioner (the Commissioner) approved our application to construct three new intermediate class vessels to replace the 48-year old Queen of Burnaby and the 49-year old Queen of Nanaimo. Both of these vessels are
scheduled for retirement in 2016. We intend to replace them with three open-deck vessels; two with the capacity to carry 145 automobile equivalents (AEQs) and a third with capacity to carry 125 AEQs. We expect this strategy will permit a more efficient deployment of our
vessel assets. All three vessels will provide service during the peak and shoulder seasons, and the third vessel will serve as a temporary replacement for several other vessels during the off peak season when they are undergoing maintenance. (See “Outlook” below for more detail.)
• On July 24, 2013, as permitted by the provisions of the Master Trust Indenture, we
redeemed our $140 million bond Series 08-2, formerly due December 19, 2013. This debt
management initiative to reduce our interest costs in the short term, was funded with $55 million from cash on hand and $88 million in draws on our credit facility. It is our intention to refinance these bonds and we will be monitoring the capital markets for appropriate opportunities to do so.

5
The Effect of Rate Regulation We are regulated by the Commissioner to ensure, among other things, that our tariffs are fair and reasonable. Under the terms of the Coastal Ferry Act (the Act), the tariffs we charge our
customers over a performance term are subject to price caps set by the Commissioner. The Commissioner may, under certain circumstances, allow increases in price caps over the set levels. Certain decisions and orders of the Commissioner may give rise to assets or liabilities.
Regulatory assets generally represent incurred costs that are probable of future recovery in tariffs or fuel surcharges. Regulatory liabilities represent obligations to customers which will be settled through future tariff reductions or fuel rebates.
IFRS differs significantly from previous accounting standards. IFRS does not have a standard
for rate-regulated activities and, therefore, does not permit us to report in our financial
statements the assets and liabilities that result from the regulated price cap setting process, such as our deferred fuel cost accounts. Rather than being charged to regulatory asset accounts on our Statements of Financial Position, fuel surcharges collected or rebates granted are now included in revenue, and increases or decreases in fuel prices from those approved in
price caps are now included in operating expenses. While this is a significant accounting change for us, it does not change the treatment of these types of assets and liabilities for regulatory purposes.
We continually assess whether our regulatory assets are probable of future recovery by
considering factors such as regulatory changes. We believe the regulatory assets at June 30, 2013 are probable of future recovery and that the obligations as represented by the regulatory liabilities will be settled through future tariff reductions. These regulatory assets and regulatory liabilities are detailed in note 9 to our June 30, 2013 consolidated financial statements.
If IFRS permitted us to report regulatory assets and liabilities in our financial statements, the effect on our Statements of Comprehensive Income for the quarters ended June 30, 2013 and 2012 would be as follows:
($ millions)
Three months ended June 30
2013 2012
Total comprehensive income 4.3 3.3
Regulatory asset or liability Statement line item
Deferred fuel costs (a)
Fuel costs incurred Operations expense 2.6 3.9
Fuel surcharges collected Fuel surcharge revenue - (6.0)
Payments from the Province Ferry transportation fees (0.5) (0.6)
2.1 (2.7)
Tariffs in excess of price cap (b)
Obligation incurred during the period Tariff revenue (2.8)
Obligation settled during the period Tariff revenue 2.5
(Decrease) in total comprehensive income (0.7) (0.2)
Adjusted total comprehensive income 3.6 3.1
(a) Deferred fuel costs: As prescribed by regulatory order, we defer differences between actual fuel costs and approved fuel costs which were used to develop the regulated price caps. The difference between actual fuel costs and approved fuel costs (including fuel hedge gains and losses) is deferred for settlement in future tariffs. Also, as
prescribed by regulatory order, we collect fuel surcharges or provide fuel rebates from time to time which are applied against deferred fuel cost account balances.
(b) Tariffs in excess of price cap: The Act contains provisions which ensure that if tariffs that we charge exceed established price caps, the excess amounts collected will be returned to customers through future tariffs.

6
FINANCIAL AND OPERATIONAL OVERVIEW
This section provides an overview of our financial and operational performance for the three
months ended June 30, 2013 and 2012.
Three months ended June 30
($ millions) Variance
2013 2012 $ %
Total revenue 200.0 197.6 2.4 1.2%
Operating expenses 178.8 176.9 (1.9) (1.1%)
Operating profit 21.2 20.7 0.5 2.4%
Net finance and other 16.9 17.4 0.5 2.9%
Net earnings and
comprehensive income 4.3 3.3 1.0 30.3%
Our net earnings and comprehensive income in the three months ended June 30, 2013 was $1.0 million higher than in the three months ended June 30, 2012. The first quarter of fiscal
2014 net earnings reflect the effects of increased fares and lower financing costs, partially offset by reductions in fuel surcharges, lower traffic levels, lower ferry transportation fees and operating cost increases.
In the first quarter of fiscal 2014, we experienced a 1.8% decline in vehicle traffic and a 1.4% decline in passenger traffic compared to the same period in the prior year. The decline was experienced in both the Major and Other Routes while the Northern Routes experienced a
modest increase. Traffic was negatively impacted by the timing of the Easter holiday. The first quarter of fiscal 2014 included only the Monday of the Easter holiday weekend while the first quarter of fiscal 2013 included the entire Easter holiday weekend. The decline was partially offset by an increase in commercial traffic. We believe that if the first quarter of fiscal 2014
included the entire Easter holiday weekend, traffic levels would have been similar to the same period of the prior year.
The following graph illustrates our vehicle and passenger traffic levels for the first quarter from fiscal 2010 through fiscal 2014:
-
1,000
2,000
3,000
4,000
5,000
6,000
Traffic volume (thousands)
Vehicles 2,133 2,099 2,029 1,995 1,960
Passengers 5,392 5,328 5,172 5,049 4,980
2010 2011 2012 2013 2014

7
Safety and Security
We continue to see a steady reduction in the number of employees injured at work. Time loss injuries in the first quarter of fiscal 2014 were 43% lower than in the same period in the prior year and days lost were down 33%. Passenger injuries were also reduced by 15% during the
same period. Several proactive initiatives are underway and already having an impact on safety performance. Employee health and wellness is a priority and our Health & Wellness Program
was enhanced with the launch, on July 12, 2013, of the Employee Recognition Program. The award of $300 to each bargaining unit employee to further his or her health and wellness is a positive investment in our most valuable assets. These payments represent a partial
reinvestment of savings resulting from the steady improvement in employee time lost since 2007. This investment has already shown an immediate return in employee morale. The ongoing effort to manage both operational and occupational risk continues with risk
training for front-line supervisors and managers. Through the new risk register process, staff at all levels are now able to effectively monitor risk levels in all areas of operations.
Operational Readiness Exercises were successfully conducted on two vessels; the Coastal
Inspiration and the Queen of New Westminster. This initiative continues to ensure improved
levels of crew preparedness across a range of key areas such as seamanship, navigation, fire fighting, evacuation and security.

8
Training Each year we invest heavily in operational and safety training. In the first quarter of fiscal 2014, we conducted over 4,400 days of training. The training was focused primarily on
equipping new front-line employees with the skills and knowledge required to safely and effectively address operational and customer-related issues. New employees attend two weeks of training on average, including dangerous goods, basic safety, and respect in the workplace
training, as well as job specific training (standardized education and assessment (SEA)). Shipboard personnel also receive evacuation systems training and passenger safety management training. During this quarter, 321 new employees attended the new hire orientation, followed with the required job specific training.
Our 3-day restricted proficiency in survival craft training was completed by 77 returning seasonal and casual employees at a new permanent training site located at our fleet
maintenance facility. After this training, employees are certified under Transport Canada requirements, preparing them in the event of an emergency evacuation situation. The addition of a new lifesaving system training slide at our training site has allowed us to deliver the requisite training more efficiently to over 220 employees in the first quarter of fiscal 2014.
Our SEA program continues to be developed and rolled out throughout the organization, with 16 of 35 safety critical positions fully implemented to date. Our SEA program replaces the traditional job-shadowing approach to vessel and terminal familiarization training with a
blended learning approach being delivered by dedicated SEA trainers. The program leverages technology and e-learning to enhance hands-on training in a phased, auditable and sustainable manner. This program is an innovative, award-winning approach that has attracted
considerable interest from others in the marine passenger industry. It has proven to be an effective engagement tool as employees at all levels participate in the design, development and rollout of the training programs. We expect that the rollout of the SEA program will be complete by April 2016 and will then shift to sustainment and enhancement.
Our Bridge Team Simulator (BTS) training program continues at three of our major terminals. In the first quarter of fiscal 2014, 21 2-day Bridge Operations Skills and Systems (BOSS) 1, 9
3-day BOSS 2 courses and 5 5-day BOSS 2+ courses were completed. The BTS instructors are midway through the formulation of a third course that builds on BOSS 1 and BOSS 2 principles, and also includes our engineering staff. This new BOSS 3 course will focus on maritime resource management; specifically on how to work safely and efficiently inter-departmentally.
In addition, BTS instructors continued their post-training support visits to our vessels, assessing the degree of learning transfer accomplished. The instructors found the results both positive and encouraging. Thus far, 67 visits have occurred, and all vessels have been visited between one and three times.

9
Revenue The following discussion of revenues is based on IFRS results with reference to the impacts of
rate regulation.
Major
Routes
65%
Northern
Routes
11%
Other
Routes
24%
General
revenue
0.2%
In the three months ended June 30, 2013, the
greatest portion of our revenues (65%) was earned on our Major Routes. The revenue from the Northern Routes contributed 11% and Other Routes contributed 24%.
Selected operational statistics and total revenues for the three months ended June 30, 2013 compared to the same period of the prior year are shown in the tables below.
Three months ended June 30
Operational Statistics 2013 2012
Vehicle traffic 1,959,625 1,994,843
Passenger traffic 4,980,187 5,049,095
On-time performance 90.7% 92.0%
Number of round trips 20,955 20,924
Capacity provided (AEQs) 4,384,104 4,429,071
AEQs carried 2,237,404 2,265,323
Capacity utilization 51.0% 51.1%
In the three months ended June 30, 2013, vehicle and passenger traffic decreased 1.8% and 1.4%, respectively, compared to the three months ended June 30, 2012. The decline was experienced in both the Major and Other Routes while the Northern Routes experienced a
modest increase. Traffic was negatively impacted by the timing of the Easter holiday. The three months ended June 30, 2013 included only the Monday of the Easter holiday weekend while the three months ended June 20, 2012 included the entire Easter holiday weekend. The general decline was partially offset by an increase in commercial traffic, including drop trailer
traffic. We continue to experience an increase in drop trailer traffic on two of our Major Routes where commercial customers can drop their trailers off at one terminal and pick them up at another.
On-time performance is defined as the percentage of our sailings departing within 10 minutes of the scheduled time on the Major and Other routes. The on-time performance on the Northern Routes is defined as the percentage of our sailings arriving within 10 minutes of the
scheduled time. Meeting customer service expectations is an important factor in our focus on on-time performance.
The capacity provided, measured in AEQs, is the available space on the vessel times the number of round trips. Round trips normally stay fairly stable as the CFSC stipulates, among other things, the number of round trips to be provided for each regulated ferry service route. However, the number of round trips can be impacted by cancellations due to weather, vessel
substitution, terminal dock closures and extra round trips made.

10
An AEQ is a standard unit of measure for an approximation of one car length. AEQs are calculated by using a conversion factor for each vehicle type. For example, a passenger vehicle would be one AEQ while a bus would be three AEQs. The change in AEQs from one period to the
next may not be proportionate to the change in vehicle traffic due to variations in the types of vehicles carried.
Capacity utilization is calculated by taking the number of AEQs carried during the period divided by the AEQ capacity provided on the vessels. Capacity utilization is impacted by the number of vehicles carried; the mix of vehicle types (the relative number of buses, commercial vehicles, and passenger vehicles); the size of the vessels utilized; and the number of round trips in each
period. Utilization during the three months ended June 30, 2013, remained at a similar level as the same period in the prior year mainly as a result of reduced capacity provided in the current year, which offset the lower number of AEQs carried.
Revenue ($millions) Three months ended June 30
2013 2012 Increase (Decrease)
Direct Route Revenue
Vehicle tariff 78.2 71.9 6.3 8.8%
Passenger tariff 46.2 42.6 3.6 8.5%
Fuel surcharges - 6.0 (6.0) (100.0%)
Catering & on-board 19.1 18.7 0.4 2.1%
Social program fees 8.5 7.6 0.9 11.8%
Reservation fees 2.9 3.1 (0.2) (6.5%)
Other revenue 2.0 1.7 0.3 17.6%
Total Direct Route Revenue 156.9 151.6 5.3 3.5%
Indirect Route Revenue
Ferry transportation fees 35.6 38.6 (3.0) (7.8%)
Federal-Provincial subsidy 7.1 7.0 0.1 1.4%
Total Route Revenue 199.6 197.2 2.4 1.2%
Other general revenue 0.4 0.4 - -
Total Revenue 200.0 197.6 2.4 1.2%
Our largest revenue source is vehicle and passenger tariffs. Our year over year tariff revenues may be impacted by such things as changes in overall traffic levels, approved price caps, the
proportion of total traffic on routes with higher versus lower tariffs, and the implementation of promotional fare programs. The Commissioner authorized a price cap increase of 4.1% effective April 1, 2013. In response,
we implemented average tariff increases up to the new level authorized. No fuel surcharges were in effect in the three months ended June 30, 2013. On November 30,
2012, as a result of declining fuel prices, all fuel surcharges were removed from our routes. During the three months ended June 30, 2012, surcharges of 2.5% of tariffs on average were in place on our Horseshoe Bay – Langdale route and 5.0% on most of our other routes. No surcharges or rebates were in place on our Northern Routes. We continue to monitor trends in
fuel prices and we anticipate a likely need to reintroduce fuel surcharges at some point during the current fiscal year.
From time to time, we utilize promotional fares designed to stimulate growth in traffic or direct traffic towards our less busy sailings while ensuring compliance with approved price cap orders. In calculating the price cap, vehicle and passenger tariffs, as well as reservation fees, are combined. The utilization of promotional fare incentives may cause the average vehicle and
passenger tariff rate to be under or over the allowed increase in any one period.

11
Year to year changes in operational statistics and revenue for the three months ended June 30, 2013 and 2012 for the Major, Northern and Other Routes are discussed separately below.
Major Routes
Our Major Routes consist of three regulated routes connecting Greater Vancouver with mid and southern Vancouver Island and our regulated route connecting Horseshoe Bay and Langdale. These are our four busiest routes, carrying 59% of our vehicle traffic and 64% of our passenger traffic during the first quarter of both fiscal 2014 and 2013.
Three months ended June 30
Operational Statistics 2013 2012
Vehicle traffic 1,155,471 1,184,907
Passenger traffic 3,177,611 3,236,912
On-time performance 79.5% 84.2%
Number of round trips 3,122 3,165
Capacity provided (AEQs) 2,251,786 2,281,292
AEQs carried 1,378,016 1,399,035
Capacity utilization 61.2% 61.3%
Vehicle traffic decreased 2.5% and passenger traffic decreased 1.8% in the three months ended June 30, 2013 compared to the same period in the prior year. Traffic was negatively impacted by the timing of the Easter holiday. The three months ended June 30, 2013 included
only the Monday of the Easter holiday weekend while the three months ended June 20, 2012 included the entire Easter holiday weekend. The general decline in vehicle traffic was partially offset by an increase of 4.9% in commercial traffic, including an 18.9% increase in drop trailer
traffic on two of our Major Routes where commercial customers can drop their trailers off at one terminal and pick them up at another. On-time performance during the first quarter of fiscal 2014 was affected by significant
maintenance activities at our Horseshoe Bay and Langdale terminals, resulting in berth closures and other conditions negatively impacting arrivals and departures. Utilization on these routes during the three months ended June 30, 2013, remained at a similar
level as the same period in the prior year mainly as a result of reduced capacity from fewer round trips provided in the current quarter, which offset the lower number of AEQs carried.
Customers
96%
Social
program
fees
4%
Ferry
transportation
fees
.2%
In the three months ended June 30, 2013, revenue from our Major Routes consisted of 96% from customers and 4% from the Province (4% social program fees and 0.2%
ferry transportation fees in support of our route connecting Horseshoe Bay and Langdale).

12
Major Routes cont’d
Direct Route Revenue Three months ended June 30
($ thousands) 2013 2012 Increase (Decrease)
Vehicle tariff 65,322 59,436 5,886 9.9%
Passenger tariff 37,403 33,939 3,464 10.2%
Fuel surcharges - 4,971 (4,971) (100.0%)
Catering & on-board 17,349 16,992 357 2.1%
Social program fees 5,215 4,544 671 14.8%
Reservation fees 2,886 3,053 (167) (5.5%)
Parking 1,017 930 87 9.4%
Other revenue 857 727 130 17.9%
Total Direct Route Revenue 130,049 124,592 5,457 4.4%
Indirect Route Revenue
Ferry transportation fees 261 657 (396) (60.3%)
Federal-Provincial subsidy - - - -
Total Route Revenue 130,310 125,249 5,061 4.0%
Average tariff revenue per vehicle increased $6.37 or 12.7% compared to the same period in the prior year. Average tariff revenue per passenger increased $1.29 or 12.3%. The increase in
average tariff revenue reflects the increases authorized by the Commissioner as well as the “CoastSaver” promotion in the prior year. “CoastSaver” price discounts of approximately 40% from regular passenger and passenger vehicle fares for Friday through Monday of each week were in effect from May 25 through June 25, 2012. Higher average fares more than offset the
traffic decline, resulting in an increase in tariff revenue of $9.4 million.
No fuel surcharges were collected in the three months ended June 30, 2013. Surcharges of 2.5% on our Horseshoe Bay – Langdale route and 5.0% on our three other Major Routes
connecting Greater Vancouver with mid and southern Vancouver Island were in place throughout the three months ended June 30, 2012. For regulatory purposes, these amounts are applied to our deferred fuel cost accounts. (See “The Effect of Rate Regulation” above for
more detail.) All vessels that provide service on our Major Routes have a gift shop and options for food service. Catering and on-board sales increased marginally as compared to the prior year,
reflecting higher average sales per passenger, partially offset by lower passenger traffic levels. Sales of quality apparel continue to grow, increasing a total of 13.6%. Sales of magazines, comics and newspapers continue to decline, following industry trends.
Social program fees are reimbursements from the Province of discounts provided on fares for BC seniors, students travelling to and from school, persons with disabilities and persons travelling under the Ministry of Health Travel Assistance Program (MTAP). These fees increased
as a result of higher fares and higher senior and student travel. Reservation fees decreased as a result of the lower traffic levels and lower usage.
Revenue from parking increased as a result of higher usage of our parking facilities. Other revenue increased mainly as a result of an increase in hostling1 fees from our drop trailer service and retail display allowances.
1 Loading and unloading of commercial trailers that are dropped off for transportation on a ferry route.

13
Ferry transportation fees decreased $0.4 million due to the elimination of fees in support of services provided on our Horseshoe Bay – Langdale route, effective April 1, 2013. Funds received from the Province related to the import duty remission on one of our foreign-built
vessels remained at a similar level. For regulatory purposes, this amount is applied to our deferred fuel cost accounts. (See “The Effect of Rate Regulation” above for more detail.)
Northern Routes
Our Northern Routes consist of three regulated routes operating on the British Columbia coast north of Port Hardy on Vancouver Island.
Three months ended June 30
Operational Statistics 2013 2012
Vehicle traffic 6,583 6,334
Passenger traffic 18,098 17,343
On-time performance 90.1% 93.0%
Number of round trips 86 85
Capacity provided (AEQs) 19,697 19,543
AEQs carried 8,155 7,868
Capacity utilization 41.4% 40.3%
In the first three months ended June 30, 2013, the Northern Routes experienced a 3.9%
increase in vehicle traffic and a 4.4% increase in passenger traffic, compared to the three months ended June 30, 2012.
Utilization on these routes during the three months ended June 30, 2013, is higher compared to the same period in the prior year mainly as a result of an increase in AEQs carried
Customers
21%
Social
program
fees
1%
Ferry
transportation
fees
69%
Federal-
Provincial
subsidy
9%
In the three months ended June 30, 2013,
revenue from our Northern Routes consisted of 21% from customers and 79% from the Province (1% social program fees, 69% ferry transportation fees, and 9% from payments
under the Federal-Provincial subsidy agreement).

14
Northern Routes cont’d
Direct Route Revenue Three months ended June 30
($ thousands)
2013 2012 Increase (Decrease)
Vehicle tariff 1,949 1,826 123 6.7%
Passenger tariff 1,521 1,484 37 2.5%
Social program fees 332 264 68 25.8%
Catering & on-board 446 437 9 2.1%
Stateroom rental 304 248 56 22.6%
Hostling & other 65 34 31 91.2%
Total Direct Route Revenue 4,617 4,293 324 7.5%
Indirect Route Revenue
Ferry transportation fees 14,342 14,981 (639) (4.3%)
Federal-Provincial subsidy 1,820 1,801 19 1.1%
Total Route Revenue 20,779 21,075 (296) (1.4%)
The average tariff revenue per vehicle increased $7.78 or 2.7% compared to the same period in the prior year, while the average tariff revenue per passenger decreased $1.53 or 1.8%. The
average revenue per passenger decreased mainly as a result of a greater proportionate number of passengers on the shorter routes with lower fares. The increase in traffic and in average vehicle fares, partially offset by lower average passenger fares, resulted in a total tariff revenue increase of $0.2 million.
There were no fuel surcharges or rebates in place on our Northern Routes.
Reimbursements from the Province for social program fees increased primarily as a result of
higher usage of MTAP and other programs, as well as higher fares.
Revenue from catering and on-board services increased mainly as a result of the increase in passenger traffic.
Stateroom rental increased due to higher usage and an increase in passenger traffic. Hostling and other revenues increased as a result of increased use of hostling services, parking
and reservations. Ferry transportation fees decreased $0.6 million as a result of lower total ferry transportation fees received under the CFSC, partially offset by an increase in the percentage of these fees
allocated to the Northern Routes. Fees received from the Province related to the price of fuel remained at a similar level as the first quarter of the prior year. For regulatory purposes, the amounts received relating to the price of fuel are applied to our deferred fuel cost accounts.
(See “The Effect of Rate Regulation” above for more detail.)
The Federal-Provincial subsidy has increased by the change in the annual Consumer Price Index (CPI) (Vancouver).
15
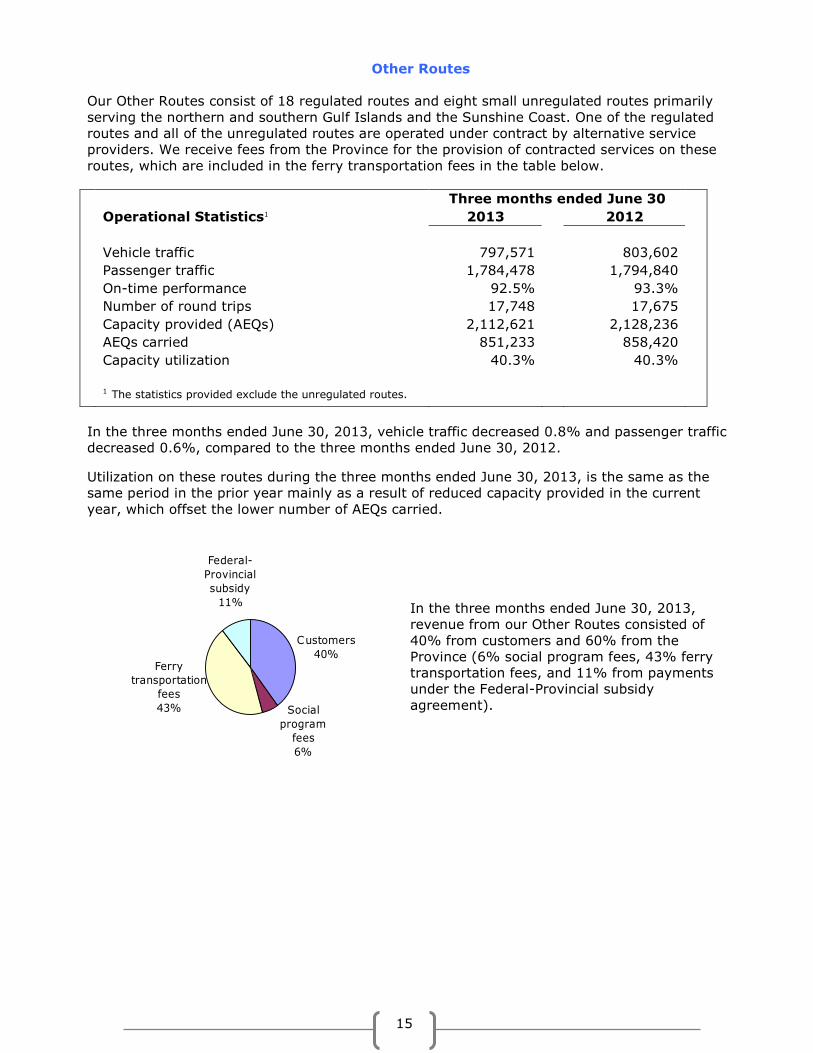
Other Routes
Our Other Routes consist of 18 regulated routes and eight small unregulated routes primarily
serving the northern and southern Gulf Islands and the Sunshine Coast. One of the regulated routes and all of the unregulated routes are operated under contract by alternative service providers. We receive fees from the Province for the provision of contracted services on these
routes, which are included in the ferry transportation fees in the table below.
Three months ended June 30
Operational Statistics1 2013 2012
Vehicle traffic 797,571 803,602
Passenger traffic 1,784,478 1,794,840
On-time performance 92.5% 93.3%
Number of round trips 17,748 17,675
Capacity provided (AEQs) 2,112,621 2,128,236
AEQs carried 851,233 858,420
Capacity utilization 40.3% 40.3%
1 The statistics provided exclude the unregulated routes.
In the three months ended June 30, 2013, vehicle traffic decreased 0.8% and passenger traffic decreased 0.6%, compared to the three months ended June 30, 2012.
Utilization on these routes during the three months ended June 30, 2013, is the same as the same period in the prior year mainly as a result of reduced capacity provided in the current
year, which offset the lower number of AEQs carried.
Customers
40%
Social
program
fees
6%
Ferry
transportation
fees
43%
Federal-
Provincial
subsidy
11%
In the three months ended June 30, 2013, revenue from our Other Routes consisted of
40% from customers and 60% from the Province (6% social program fees, 43% ferry transportation fees, and 11% from payments under the Federal-Provincial subsidy
agreement).

16
Other Routes cont’d
Direct Route Revenue Three months ended June 30
($ thousands)
2013 2012 Increase (Decrease)
Vehicle tariff 10,915 10,600 315 3.0%
Passenger tariff 7,274 7,137 137 1.9%
Fuel surcharges - 1,059 (1,059) (100.0%)
Social program fees 2,957 2,808 149 5.3%
Catering & on-board 1,024 1,028 (4) (0.4%)
Reservation fees 49 48 1 2.1%
Parking & other 26 20 6 30.0%
Total Direct Route
Revenue 22,245 22,700 (455) (2.0%)
Indirect Route Revenue
Ferry transportation fees 20,952 22,974 (2,022) (8.8%)
Federal-Provincial subsidy 5,273 5,218 55 1.1%
Total Route Revenue 48,470 50,892 (2,422) (4.8%)
The average tariff revenue per vehicle increased $0.50 or 3.7%, compared to the same period
in the prior year, while the average tariff revenue per passenger increased $0.10 or 2.5%. The increase in average fares, partially offset by the reduction in traffic, resulted in a total tariff revenue increase of $0.5 million.
No fuel surcharges were collected in the three months ended June 30, 2013. Surcharges of 5% were in place throughout the three months ended June 30, 2012. For regulatory purposes, these amounts are applied to our deferred fuel cost accounts. (See “The Effect of Rate Regulation” above for more detail.)
Reimbursements from the Province for social program fees increased as a result of higher fares and higher program usage, primarily senior and student travel.
Revenue from catering and on-board services is at the same level as the prior year. Lower
traffic levels on the routes where those services are offered were mainly offset by higher average sales per passenger.
Fees for reservations were also at the same level as the prior year, resulting from higher usage mainly offset by lower traffic levels.
Parking and other revenues are higher than the prior year, mainly due to an increase in usage of our parking facilities and higher charter fees.
Ferry transportation fees are $2.0 million lower than the prior year. This reduction in fees from the Province includes:
• $1.8 million reduction in ferry transportation fees received under the CFSC for the 18
regulated routes; and • $0.2 million reduction in funds related to the import duty remission on one of our
foreign-built vessels. For regulatory purposes, these amounts are applied to our deferred fuel cost accounts. (See “The Effect of Rate Regulation” above for more detail.)
The Federal-Provincial subsidy has increased by the change in the annual CPI (Vancouver).

17
Expenses Expenses for the three months ended June 30, 2013 and 2012 are summarized in the tables
below:
Operating expenses Three months ended June 30
($ millions)
2013 2012
Increase (Decrease)
Operations 114.2 111.0 3.2 2.9%
Maintenance 15.6 17.2 (1.6) (9.3%)
Administration 7.0 7.2 (0.2) (2.8%)
Total operations, maintenance & 136.8 135.4 1.4 1.0%
administration
Cost of retail goods sold 7.7 7.5 0.2 2.7%
Depreciation and amortization 34.3 34.0 0.3 0.9%
Total operating expenses 178.8 176.9 1.9 1.1%
We continue to take proactive measures to contain and reduce expenses while ensuring that safety remains our top priority.
The $3.2 million increase in operations expenses consists mainly of: • $2.7 million increase in wages and benefits due to bargaining unit wage rate increases of
1% at October 1, 2012 and 1.5% at April 1, 2013, in accordance with the Collective
Agreement, an increase in overtime and in hours spent in training activities; • $0.5 million increase in property and hull and machinery claims costs; • $0.4 million increase in materials & contracted services; • $0.4 million increase in training costs, other than wages;
• $0.8 million increase in several other operational areas, including credit card service fees, data communications, advertising, rental expenses and training related travel costs;
partially offset by:
• $1.6 million decrease in fuel expense reflecting a decrease of $1.5 million due to lower fuel prices and a $0.1 million or 0.3% reduction in fuel consumption. For purposes of rate regulation, $2.6 million of our fuel expense for the first quarter of fiscal 2014 is recorded in deferred fuel cost accounts for future recovery ($3.9 million recorded for the same quarter
in fiscal 2013). (See “The Effect of Rate Regulation” below for detail.) The $1.6 million decrease in maintenance costs reflects a $0.9 million decrease in vessel maintenance as a result of variations in vessel refit scheduling and a $0.5 million decrease in
terminal maintenance. The $0.2 million decrease in administration expenses is mainly due to lower labour costs.
Depreciation and amortization increased a total of $0.3 million, reflecting the assets that are now available for use. (See “Investing in our Capital Assets” below for detail of significant purchases.)

18
Net finance and other expenses Three months ended June 30
($ millions)
2013 2012
Increase (Decrease)
Finance expense
Bond interest 15.8 15.8 -
KfW loans 2.0 2.1 (0.1)
Interest on finance lease 0.5 0.6 (0.1)
Short-term debt 0.1 - 0.1
Structured Financing Facility Program - (0.2) 0.2
Capitalized interest (0.7) (0.4) (0.3)
Total finance expense 17.7 17.9 (0.2)
Less: finance income (0.8) (0.5) (0.3)
Total net finance and other expenses 16.9 17.4 (0.5)
Net finance expenses decreased $0.5 million primarily due to:
• $0.3 million higher capitalized interest; and • $0.3 million higher finance income; partially offset by: • $0.2 million less interest rate support received through the Structured Financing Facility
Program offered by the Government of Canada, reflecting the completion of the funding related to the life extension of the Quinsam.
LIQUIDITY AND CAPITAL RESOURCES
Liquidity and Capital Resources We fund our operations and capital acquisitions with cash flow generated from operations, as well as bank financing and debt issues.
We expect our cash requirements, in the near term, will be met through operating cash flows and by accessing our credit facility from time to time. At June 30, 2013, our unrestricted cash and cash equivalents and other short-term investments totalled $98 million.
On July 24, 2013, as permitted by the provisions of the Master Trust Indenture, we redeemed our $140 million bond series, formerly due December 19, 2013. This debt management initiative to reduce our interest costs in the short term, was funded with $55 million cash on
hand and $88 million in draws on our credit facility. In addition, we have a $250 million bond series that will mature in May 2014. It is our intention to refinance both series of bonds and we will be monitoring the capital markets for appropriate opportunities to do so.
Our $155 million credit facility was amended on March 15, 2013 to extend the maturity date of the facility from April 2017 to April 2018. The facility is available to fund capital expenditures and other general corporate purposes. At June 30, 2013, there were no draws on this credit
facility. We target maintaining a strong investment-grade credit rating to allow capital market access at reasonable interest rates. Our credit ratings at June 30, 2013, were “A” (DBRS) with a stable
trend and “A+” (S&P) with a stable outlook.

19
Sources & Uses of Cash Our liquidity needs are met through a variety of sources, including cash generated from operations, issuance of bonds, and borrowings under our credit facility. Our primary uses of
funds are operational expenses, capital asset acquisitions and upgrades, and payments on our long-term debt.
Sources and uses of cash and cash equivalents for the three months ended June 30, 2013 and
2012 are summarized in the table below:
Three months ended June 30
($ millions) 2013 2012 Increase (decrease)
Cash and cash equivalents, beginning of
period 36.6 7.7 28.9
Cash from operating activities:
Net earnings 4.3 3.3 1.0
Items not affecting cash 54.1 51.4 2.7
Changes in non-cash operating working
capital (12.6) (16.7) 4.1
Net interest paid (21.0) (21.5) 0.5
Cash generated by operating activities 24.8 16.5 8.3
Cash (used in) provided by financing activities (0.3) 15.0 (15.3)
Cash (used in) investing activities (18.5) (31.8) 13.3
Net increase (decrease) in cash and cash
equivalents 6.0 (0.3) 6.3
Cash and cash equivalents, end of period 42.6 7.4 35.2
In the three months ended June 30, 2013, cash generated by operating activities was $8.3 million higher compared to the same period in the prior year mainly due to changes in non-cash
operating working capital, items not affecting cash and higher net earnings. Cash provided by financing activities was higher in the three months ended June 30, 2012 than the same period this year due to the receipt of $25.0 million contributed surplus from the
Province, partially offset by $9.7 million in short-term debt repayments. Cash used in investing activities in the three months ended June 30, 2013 was $13.3 million
lower than the same period in the prior year mainly due to $9.5 million proceeds from short-term investments and a $3.7 million decrease in cash used for capital expenditures. (See “Investing in Our Capital Assets” below for detail of significant capital expenditures.)

20
SUMMARY OF QUARTERLY RESULTS
The table below compares IFRS earnings by quarter for the most recent eight quarters:
Quarter Ended (unaudited)
($ millions) Jun 13 Mar 13 Dec 12 Sep 12 Jun 12 Mar 12 Dec 11 Sep 11
Total revenue 200.0 150.5 169.6 268.7 197.6 145.0 164.9 256.9
Operating profit (loss) 21.2 (20.2) 0.2 84.1 20.7 (24.6) (1.8) 73.5
Net earnings (loss) 4.3 (37.1) (17.2) 66.5 3.3 (42.1) (19.2) 55.8
Gain on land revaluation - 1.1 - - - 2.2 - -
Comprehensive income (loss) 4.3 (36.0) (17.2) 66.5 3.3 (39.9) (19.2) 55.8
Quarterly results are affected by the seasonality of leisure travel patterns. The second quarter,
covering the summer period, experiences the highest traffic levels and the highest net earnings. The third and fourth quarters reflect a seasonal reduction in traffic. We utilize these periods to perform upgrades and major maintenance and refit programs, as well as to undertake
mandatory inspections on the majority of our vessels. The following graph demonstrates the seasonality of our revenue and shows the relationship of traffic volume and tariff revenue over the most recent eight quarters:
0
20
40
60
80
100
120
Jun13 Mar13 Dec12 Sep12 Jun12 Mar12 Dec11 Sep11
Quarter Ending
Tariff ($ millions)
0
1
2
3
4
5
6
7
8Traffic Volume (millions)
Vehicle tariff Passenger tariff
Vehicle traffic Passenger traffic

21
INVESTING IN OUR CAPITAL ASSETS
Capital Expenditures
Capital expenditures in the three months ended June 30, 2013 totalled $21.7 million.
($ millions) Vessel upgrades and modifications 12.2 Terminal marine structures 5.6 Information technology 3.2
Terminal and building upgrades and equipment 0.7
Total capital expenditures 21.7
Vessel Upgrades and Modifications Capital expenditures for vessel upgrades and vessel modifications in the three months ended
June 30, 2013 included the following:
($ millions)
Major overhauls and inspections 6.1 Tachek life extension 3.9 Other projects 2.2
12.2
Major overhauls and inspections completed in the first quarter of fiscal 2014 or currently underway include:
• $2.1 million on the Coastal Celebration; • $1.8 million on the Skeena Queen; • $1.4 million on the Mayne Queen;
• $0.6 million on the Queen of Chilliwack; and • $0.2 million on several other vessels. A $19 million project to extend the life of the Tachek by an additional 15 years until retirement
in 2029 started in the third quarter of fiscal 2013. This life-extension includes new engines and shafting, new generators, and upgrades to lifesaving equipment and passenger facilities. The project is expected to complete in the third quarter of this fiscal year.
Other ongoing projects include the second year of a four-year program to upgrade vessel electrical and navigational equipment including searchlights, gyro compasses, depth sounders, and radar equipment; early costs of mid-life upgrades on the Queen of Capilano and the Spirit
of British Columbia; and three-quarter life upgrades on the Kwuna and the Queen of Oak Bay.

22
Terminal Marine Structures Capital expenditures for terminal marine structures in the three months ended June 30, 2013 included the following:
Terminal Description
($ millions)
Alert Bay Replacement of wingwalls, towers, ramp and aprons 2.2
Westview Replacement of trestle, ramp, apron and towers 1.0 Denman Island
and Buckley Bay Modifications to accommodate the new cable ferry 0.5
Horseshoe Bay Transfer deck life-extension 0.4
Various Install tie-up winches 0.4
Various Other projects 1.1
5.6
At Alert Bay terminal, a $7.5 million project to upgrade wingwalls, towers, aprons and ramp was completed in the first quarter of this fiscal year, in time for the busy summer season.
At Westview terminal, work continues on a $20 million project to replace the existing trestle with one designed for full highway bridge loading with an improved approach radius, two traffic lanes and a pedestrian sidewalk; replace the ramp, ramp abutment, apron and towers with active lift hydraulics; and replace the waiting shelter. This project is expected to be complete by the end of
the current fiscal year. Work continues on modifications at Denman Island and Buckley Bay terminals as part of the
$34 million project for our new cable ferry service. The cable ferry service is an innovative initiative and is part of our ongoing efforts to identify and pursue opportunities that have the potential to enhance our cost effectiveness in delivering safe, reliable and quality ferry service.
At Horseshoe Bay terminal, a $3 million project to extend the life of the transfer deck to provide an additional seven years of useful life is underway. Due to poor weather and the busy summer season, completion of this project has been deferred until the fall of 2013.
The installation of tie-up winches at Langdale and Horseshoe Bay terminals has been completed and installation at Tsawwassen terminal is expected to be complete in the second quarter of this fiscal year. The project is expected to total $1.7 million, of which $1.6 million
has been incurred to the end of June 2013. Other projects complete or in progress are the $0.6 million project to replace the double-sided floating lead at Village Bay terminal which was completed in the current quarter; a $10 million
project to replace the ramp, wingwall, tower, and dolphin at Little River terminal; a $13 million project at Port McNeill terminal to replace the trestle, wingwalls, ramp, apron, towers and dolphin and reposition the new ramp to accommodate all minor and intermediate vessels; and
an $8 million project at McLoughlin Bay to install two berthing dolphins and two tie-up dolphins and modify the berth to enable ship tie-up.
23
Information Technology Capital expenditures for information technology in the three months ended June 30, 2013 included the following:
($ millions) Customer service program 1.9 Payroll system replacement 0.6
Infrastructure relocation program 0.2 Computer hardware upgrades 0.2 Other projects 0.3
3.2
Our $57 million customer service program will replace our aged point of sale and reservations systems and allow us to respond in a more timely fashion to changing business needs and to support marketing, travel services, and pricing initiatives. This program will also include
terminal ticketing automation and customer relationship management systems. This multi-year program will be completed and implemented in stages starting in fiscal 2014, and is expected to be fully completed in fiscal 2017. We believe this program will significantly improve our ability to efficiently respond to the changing needs of our customers.
Our $10 million payroll system replacement initiative will replace both our payroll and labour distribution systems to provide added reliability and significant processing efficiencies and flexibility. This project is expected to be complete in the third quarter of fiscal 2014.
The $4.7 million infrastructure relocation program will relocate our prime data centre facility to the interior of British Columbia to mitigate risk in the event of a major incident such as an
earthquake. Our current infrastructure site will be expanded to house our pre-production infrastructure and serve as our production environment for disaster recovery in the unlikely event that the interior data centre production services are interrupted.
Computer hardware upgrades continue as we proceed through our programs for replacement of aged computers, servers, cash registers and printers.
Projects completed in the quarter include a new internal control management system, upgrades to simplify the process for customers making a reservation on our website and enhancements for improved supply chain management.
Terminal and Building Upgrades and Equipment Capital expenditures for terminal and building upgrades and equipment in the three months ended June 30, 2013 included the following:
($ millions) Vehicles and other equipment 0.3 Terminal seismic upgrades 0.2
Other terminal projects 0.2
0.7
Vehicles and other equipment consisted primarily of items of equipment for our Richmond maintenance facility, including marine diagnostic equipment, a turntable washer, generator,
electrical testing equipment, infrared measurement equipment, and several other items. Other projects include seismic upgrades at certain of our maintenance facilities; construction of
a new training facility for training on life saving equipment; and the first year of a five year program to update signage at our terminals serving our Major Routes.

24
OUTLOOK
We expect to have positive net earnings in fiscal 2014, although somewhat lower than fiscal
2013 net earnings. Traffic and tariff revenue In the first quarter of fiscal 2014, we experienced a 1.8% decline in vehicle traffic and a 1.4%
decline in passenger traffic compared to the same quarter in the prior year. This decline is discussed above in “Financial and Operational Overview”. We expect annual vehicle traffic to be at a similar level as the prior year with both commercial and non-commercial traffic continuing
to gradually improve throughout the year and passenger traffic to be somewhat lower. We continue to monitor trends in fuel prices and we anticipate a likely need to reintroduce fuel surcharges at some point during the current fiscal year.
Other revenue In the first quarter of fiscal 2014, compared to the same quarter in the prior year, catering and
on-board revenues increased as a result of an increase in the average sales per passenger. We expect fiscal 2014 revenues to be somewhat higher than the prior year, reflecting an increase in average sales per passenger, partially offset by lower passenger traffic levels.
In May 2012, the Province announced additional payments to us totalling $79.5 million in order to reduce the pressure for future fare and price cap increases. Of this, $25 million was received as contributed surplus and $21.5 million as additional ferry transportation fees in fiscal 2013. The remaining will be received as ferry transportation fees; $10.5 million in fiscal 2014, $11.0
million in fiscal 2015 and $11.5 million in fiscal 2016. On April 3, 2013, an amendment to the CFSC was agreed to with the Province. This amendment extended the deadline for identifying service level adjustments required over the remainder of PT3. The Province also agreed to pay
us ferry transportation fees in the amount of $7.1 million in 9 equal monthly instalments commencing July 2013. Specific service level adjustments to core service levels designed to achieve a further $18.9 million in net savings over the remainder of the performance term are expected to be determined by March 31, 2014. As a result of the additional payments from the
Province in both fiscal 2013 and fiscal 2014, we expect fiscal 2014 transportation fees under the CFSC to be $4.7 million less than the prior fiscal year.
On April 15, 2013, the Commissioner issued Order 12-02A, reducing the service level adjustments to achieve a total of $22.9 million in net savings during the remainder of PT3, to reflect the $7.1 million received from the Province. He also acknowledged the reduction of $4 million in service reductions already implemented with $18.9 million yet to be identified. The
Commissioner also reconfirmed that we may apply for relief under section 42 of the Act if amendments made will not enable us to achieve the $22.9 million in net savings Expenses
We expect a modest increase in total expenses in fiscal 2014, reflecting higher depreciation and amortization, wage increases, benefit increases including an increase in Employment Insurance and Canada Pension Plan contributions and provincial medical rates, and costs in
several other areas. We expect these increases to be partially offset by cost reductions resulting from the return to PST and GST from HST.

25
Capital Expenditures Our capital expenditures are expected to increase over the next five years as we begin to replace aged minor and intermediate-sized vessels, make significant improvements at our
terminals serving our Major Routes and renewing our information technology infrastructure. We are currently in the detailed design phase for the new cable ferry for service on our Buckley
Bay to Denman Island route and expect to conclude a procurement process for the construction of the vessel and terminal works by the end of the second quarter of this fiscal year. The new 50-car vessel is expected to be in service by the fall of 2014. The cable ferry is an innovative initiative and is part of our ongoing efforts to identify and pursue opportunities that have the
potential to enhance our cost effectiveness in delivering safe, reliable and quality ferry service. On July 19, 2013, the Commissioner approved our application to construct three new
intermediate class vessels to replace the 48-year old Queen of Burnaby and the 49-year old Queen of Nanaimo. Both of these vessels are scheduled for retirement in 2016. We intend to replace them with three open-deck vessels; two with the capacity to carry 145 AEQs and a third with capacity to carry 125 AEQs. We expect this strategy will permit a more efficient
deployment of our vessel assets. All three vessels will provide service during the peak and shoulder seasons, and the third vessel will serve as a temporary replacement for several other vessels during the off peak season when they are undergoing maintenance. We intend to pursue a design-build contract with a shipyard that will be selected through a formal
procurement process. Canadian and international shipyards are invited to participate in this process and we expect to award a contract for this project in the third quarter of fiscal 2014. While we intend to acquire liquefied natural gas fuelled vessels, further technical and financial
analysis will be required before a final decision is made. These analyses very much depend on the responses to the Request for Proposals. The two 145 AEQ vessels are expected to be in service in the spring and fall of 2016 and the 125 AEQ vessel is expected to enter service in the spring of 2017.
FINANCIAL RISKS
Exposure to credit risk, liquidity risk and market risk arises in the normal course of our business. We manage market risk arising from the volatility in foreign currency, interest rate and fuel price exposures in part through the use of derivative financial instruments including
forward contracts, swaps and options. We do not utilize derivative financial instruments for trading or speculative purposes. A discussion of financial risks can be found on pages 50 through 52 of our fiscal 2013
Management’s Discussion & Analysis. Our risk profile is substantially unchanged during the three months ended June 30, 2013.
BUSINESS RISK MANAGEMENT
Understanding and managing operational risk is an important part of our business. We have
processes in place throughout our company to manage risks that inevitably arise in the normal course of business. A discussion of enterprise wide risk management can be found on pages 53 through 58 of our fiscal 2013 Management’s Discussion & Analysis. Our risk profile is substantially unchanged during the three months ended June 30, 2013.
We do not believe that material uncertainties exist in regards to our future. As part of our risk management strategies, we have considered many items such as profitability levels, cash
generating potential, cash utilization requirements including debt repayment schedules and future capital expenditures, and working capital requirements. We have taken measures to allow us to weather the economic downturn and ensure a viable, profitable future.

26
ACCOUNTING PRACTICES
Critical Accounting Policies and Estimates Our discussion and analysis of our financial condition and financial performance is based upon our consolidated financial statements, which have been prepared in accordance with IFRS.
Our significant accounting policies are contained in note 1 to our March 31, 2013 and June 30, 2013 consolidated financial statements. Certain of these policies involve critical accounting estimates because they require us to make particularly subjective or complex judgments about
matters that are inherently uncertain and because of the likelihood that materially different amounts could be reported under different conditions or using different assumptions. These judgements, estimates and assumptions are subject to change as new events occur, as more experience is acquired, as additional information is obtained and as the general operating
environment changes. Discussion of the most critical accounting policies and estimates that we have used in the
preparation of our consolidated financial statements can be found on pages 59 and 60 of our fiscal 2013 Management’s Discussion & Analysis. The following describes the changes to critical accounting policies we have used in the preparation of our consolidated financial statements for the three months ended June 30, 2013, or expect to use in the future.
Adoption of New Accounting Standards The following is a discussion of mandatory accounting changes that were effective for us April
1, 2013: IAS 19 Employee Benefits has been amended. As a result of the amendments, actuarial gains and losses of defined benefit plans will be immediately recognized in other comprehensive
income rather than net earnings and the option to use the corridor approach to recognize these costs over time is no longer available. The amendments also introduce the net interest approach where the discount rate used to measure the obligation is applied to the net defined benefit liability (asset). In addition, the amendments change the definition of both short-term
and long-term employee benefits so it is clear that the distinction between the two depends on when we expect the benefits to become due to be settled. The retrospective application of this amended standard did not have an impact on our consolidated financial statements.
IFRS 13 Fair Value Measurement replaces the fair value measurement guidance contained in individual IFRSs with a single source of fair value measurement guidance. Fair value is defined as the price that would be received to sell an asset or paid to transfer a liability in an orderly
transaction between market participants at the measurement date. We have applied IFRS 13 prospectively effective April 1, 2013. Adoption of this standard had no impact on the recognition or measurement of any items in our consolidated financial statements but has
added additional disclosure which can be found in note 4 to our June 30, 2013 consolidated financial statements.
Future Accounting Changes The following is a discussion of accounting changes that will be effective for us in future periods:
IFRS 9 Financial Instruments (2010) replaces the guidance in IAS 39 Financial Instruments:
Recognition and Measurement, on the classification and measurement of financial assets. Financial assets will be classified into one of two categories on initial recognition: financial
assets measured at amortized cost; or financial assets measured at fair value. We intend to adopt IFRS 9 (2010) in our financial statements for the annual period beginning on April 1, 2015. We do not expect the application of this standard to have any impact on our consolidated financial statements.

27
FORWARD LOOKING STATEMENTS
This Management’s Discussion and Analysis contains certain “forward looking statements”. These statements relate to future events or future performance and reflect management’s
expectations regarding our growth, results of operations, performance, business prospects and opportunities and industry performance and trends. They reflect management’s current internal projections, expectations or beliefs and are based on information currently available to management. Some of the market conditions and factors that have been considered in
formulating the assumptions upon which forward looking statements are based include traffic, the Canadian Dollar relative to the US Dollar, fuel costs, construction costs, the state of the local economy, fluctuating financial markets, demographics, tax changes, and the requirements of the CFSC.
Forward looking statements included in this document include statements with respect to: economic conditions, traffic levels, and fuel prices; our expectations of the impact of our cost
containment program; whether our regulatory assets are probable of future recovery; our short-term and long-range business plans, capital expenditure levels, and asset renewal programs for vessels and terminals; our customer service program, payroll system replacement initiative, infrastructure relocation program, vessel replacement program for the
Queen of Burnaby and the Queen of Nanaimo, cable ferry initiative, liquefied natural gas plans, and safety and training projects; our expectations regarding ferry transportation fee amounts; catering and on-board revenue and total expense projections, how our cash requirements will
be met in the near term, the need to reintroduce fuel surcharges, and our intention to refinance bonds; the additional payments to be received from the Province over the following three fiscal years, and the amount of savings to be achieved through service level adjustments; and our intention to adopt IFRS 9 (2010). In some cases, forward looking
statements can be identified by terminology such as “may”, “will”, “should”, “expect”, “plan”, “anticipate”, “believe”, “estimate”, “predict”, “potential”, “continue” or the negative of these terms or other comparable terminology. A number of factors could cause actual events or results to differ materially from the results discussed in the forward looking statements. In
evaluating these statements, prospective investors should specifically consider various factors including, but not limited to, the risks and uncertainties associated with traffic volume and tariff revenue risk, safety and security, asset risk, accident risk, tax risk, environmental risk,
regulatory risk, labour disruption risk, limitations of vessel repair facilities, risk of default under material contracts and aboriginal land claims.
Actual results may differ materially from any forward looking statement. Although management believes that the forward looking statements contained in this Management’s Discussion and
Analysis are based upon reasonable assumptions, investors cannot be assured that actual results will be consistent with these forward looking statements. These forward looking statements are made as of the date of this Management’s Discussion and Analysis, and British
Columbia Ferry Services Inc. assumes no obligation to update or revise them to reflect new events or circumstances except as may be required by applicable law.
In addition to providing measures prepared in accordance with IFRS, we present certain supplemental non-IFRS measures. These include, but are not limited to, total comprehensive
income adjusted for the effect of rate regulation, vehicle and passenger traffic, on-time performance, capacity provided and utilized, average tariff per vehicle and average tariff per passenger. These measures do not have any standardized meaning prescribed by IFRS and therefore are unlikely to be comparable to similar measures presented by other companies.
These supplemental non-IFRS measures are provided to assist readers in determining our ability to generate cash from operations and improve the comparability of our results from one period to another. We believe these measures are useful in assessing operating performance of
our ongoing business on an overall basis.


