T: (511) 441-4420. D: Av. Víctor Andrés Belaúnde 214, San Isidro, Lima, Perú. W: www.exalmar.com.pe 1 MANAGERIAL ANALYSIS AND DISCUSSION AS AT THE FOURTH QUARTER 2018 PESQUERA EXALMAR S.A.A. (hereinafter, "the Company") 1. Indirect Human Consumption (IHC): 1.1. Second Season 2018 in the North – Central Region: • By means of Ministerial Resolution No. 504-2018-PRODUCE, the beginning of the second fishing season of anchovy 2018 in the North- Central region was authorized. This began on November 15 and will end when the Total Maximum Limit of Allowance Catch (TMLAC) is reached or, otherwise, when recommended by IMARPE. The TMLAC corresponding to such season is 2'100,000 metric tons, which is in line with the recommendations of the Instituto del Mar de Peru (IMARPE), according to its report called “Progress report of the current status of anchovy population in the north-central region and development of the reproductive process as at November 05, 2018.” • As at December 31, 2018, the second fishing season of 2018 was ongoing and approximately 90.3% out of the 2,100 thousand MT of quota allocated by the Ministry of Production (PRODUCE) was caught. As at January 27, the sector caught 99.1% of the quota. PARTICIPATION IN PROCESSING Empresa 2nd season 2017 2nd season 2018 (*) 21.7% 22.3% 24.1% 21.0% 12.8% 15.0% 11.2% 11.3% 12.4% 10.2% 8.0% 8.8% Otros 9.8% 11.4% Source: PRODUCE. Elaboration: own. (*) information as at January 27, 2019. (Quota advance in 99.1%). 1.2. First Season 2018 in the North - Central Region: • By means of Ministerial Resolution No. 560-2017-PRODUCE, the beginning of the first fishing season of anchovy 2018 in the North-Central region was authorized. This began on April 12 and ended on August 10 of this year. The Total Maximum Limit of Allowable Catch (TMLAC) corresponding to such season was 3'316,700 metric tons, which is in line with the recommendations of the Instituto del Mar de Peru (IMARPE), according to its report called "Situation of the North-Central Stock of Peruvian anchovy (Engraulis ringens) as at April 1, 2018, and prospects of exploitation for the first fishing season 2018.”
Transcript
T: (511) 441-4420. D: Av. Víctor Andrés Belaúnde 214, San Isidro, Lima, Perú. W: www.exalmar.com.pe
1
MANAGERIAL ANALYSIS AND DISCUSSION AS AT THE FOURTH QUARTER 2018
PESQUERA EXALMAR S.A.A. (hereinafter, "the Company")
1. Indirect Human Consumption (IHC): 1.1. Second Season 2018 in the North – Central Region:
• By means of Ministerial Resolution No. 504-2018-PRODUCE, the beginning of the second fishing
season of anchovy 2018 in the North- Central region was authorized. This began on November 15 and will end when the Total Maximum Limit of Allowance Catch (TMLAC) is reached or, otherwise, when recommended by IMARPE. The TMLAC corresponding to such season is 2'100,000 metric tons, which is in line with the recommendations of the Instituto del Mar de Peru (IMARPE), according to its report called “Progress report of the current status of anchovy population in the north-central region and development of the reproductive process as at November 05, 2018.”
• As at December 31, 2018, the second fishing season of 2018 was ongoing and approximately 90.3% out of the 2,100 thousand MT of quota allocated by the Ministry of Production (PRODUCE) was caught. As at January 27, the sector caught 99.1% of the quota.
PARTICIPATION IN PROCESSING Empresa
2nd season 2017 2nd season 2018 (*)
21.7% 22.3%
24.1% 21.0%
12.8% 15.0%
11.2% 11.3%
12.4% 10.2%
8.0% 8.8%
Otros 9.8% 11.4% Source: PRODUCE. Elaboration: own. (*) information as at January 27, 2019. (Quota advance in 99.1%).
1.2. First Season 2018 in the North - Central Region:
• By means of Ministerial Resolution No. 560-2017-PRODUCE, the beginning of the first fishing
season of anchovy 2018 in the North-Central region was authorized. This began on April 12 and ended on August 10 of this year. The Total Maximum Limit of Allowable Catch (TMLAC) corresponding to such season was 3'316,700 metric tons, which is in line with the recommendations of the Instituto del Mar de Peru (IMARPE), according to its report called "Situation of the North-Central Stock of Peruvian anchovy (Engraulis ringens) as at April 1, 2018, and prospects of exploitation for the first fishing season 2018.”
T: (511) 441-4420. D: Av. Víctor Andrés Belaúnde 214, San Isidro, Lima, Perú. W: www.exalmar.com.pe
2
• By the end of the first fishing season in 2018, 97.9% of the quota allocated by the Ministry of Production (PRODUCE) was caught. In the first season of 2017, the sector caught 85.3% of the quota set at 2'800,000 MT.
PARTICIPATION IN PROCESSING Company
1st season 2017 1st season 2018
21.3% 23.1%
25.3% 21.9%
14.4% 13.7%
11.3% 11.0%
10.7% 10.1%
8.6% 7.9%
Otros 8.4% 12.3% Source: PRODUCE. Elaboration: own.
1.3. South Region:
• By means of Resolution No. 257-2018-PRODUCE the beginning of the second fishing season 2018
in the south region was authorized, with TMLAC of 535 thousand MT. This season began on July 1 and ended on December 31, 2018. At the end of the season the sector caught 13.5% of the authorized quota (72 thousand MT), concentrating 59.3% of the catch in the ports of Pacocha and Matarani.
• By means of Resolution No. 257-2018-PRODUCE the beginning of the first fishing season 2019 in the south region was authorized, with TMLAC of 540 thousand MT. This season began on January 4 and will end once the TMLAC is reached or, otherwise, it may not exceed June 30.
1.4. Catch and processing:
• Considering that, in general, annual financial statements include the sales corresponding to the production of the second quota of the previous year and the first quota of the current year, the year 2018 included a quota of 3,935 thousand MT. For the year 2019, an effective quota of the second season of 2,100 thousand MT and that one corresponding to the first season of 2019 would be included.
Thousand MT 2018
2nd Season 2017 1st Season 2018 (*) Total N - C Quota 1,490 3,317 4,807
Effective catch of the sector 687 3,247 3,935
Sector quota advance 46.1% 97.9%
Exalmar processing 88 443 531
Quota allocated to Exalmar 6.64% 6.99% (**)
Participation of Exalmar 12.8% 13.7%
Season 07/01 - 26/01 12/04 – 10/08 (*)Source: PRODUCE. (**) 0.22% belongs to the quota rent.
T: (511) 441-4420. D: Av. Víctor Andrés Belaúnde 214, San Isidro, Lima, Perú. W: www.exalmar.com.pe
3
(*) Source: PRODUCE as at January 27, 2019. (**) 0.95% belongs to quota rent.
• By the end of the fourth quarter of 2018, the catch and processing volumes shown correspond to
January 2018 (balance of the second season of 2017), to the first season of 2018, and to 90.3% of the second season of 2018.
Thousand MT As at 4Q17 As at 4Q18 Variation
Own catch 215.2 398.7 85%
50% 50%
Purchase to Third Parties 209.0 400.9 92%
50% 50%
Fishing sold 2.6 3.9 51%
Total processed 421.7 795.7 89%
Fishmeal produced 98.5 181.0 83%
Fish oil produced 11.7 32.7 180%
Fishmeal Factor 4.27 4.40 3%
Fish oil Factor 2.77% 4.11% 49%
1.5. Inventories:
• The low level of inventories at the beginning of 2018 was due to the temporary suspension of
fishing activities during November and December 2017, because of the high presence of juveniles and the sea conditions, affected by La Niña Phenomenon.
• As at December 31, 2018, the initial inventory of fishmeal of the year plus the production up to December and the reprocessing resulted in a volume of 182.4 thousand MT (145.3 thousand MT in the previous year) available for sale, from which 124.8 thousand MT were sold, remaining an inventory of 57.7 thousand MT.
• It is worth to mention that the production as at the fourth quarter of 2018 exceeded by 83% the production of the previous year and the final inventory was significantly higher than that one of 2017.
Fishmeal (thousand MT) As at 4Q17 As at 4Q18 Variation
Initial inventory 45.5 0.6 -99%
Production 98.7 181.0 83%
Sales 144.7 124.8 -14%
Thousand MT 2019
2nd Season 2018 (*) 1st Season 2019 Total N - C Quota 2,100 2,100
Effective catch of the sector 2,059 2,059
Sector Quota Advance 99.5%
Exalmar processing 163 163
Quota allocated to Exalmar 7.77% (**)
Participation of Exalmar 15.0%
Season 15/11- To define
T: (511) 441-4420. D: Av. Víctor Andrés Belaúnde 214, San Isidro, Lima, Perú. W: www.exalmar.com.pe
4
Reprocessing 1.1 0.8
Final inventory 0.6 57.7 -
• Sales of fish oil by the end of the fourth quarter of 2018 were 24.0 thousand MT, remaining an
inventory of 7.8 thousand MT.
Fish oil (thousand MT) As at 4Q17 As at 4Q18 Variation
Initial inventory 6.6 0.0 -100%
Production 11.7 32.7 180%
Sales 18.3 24.0 31%
Reprocessing 0.0 -0.9
Final Inventory 0.0 7.8 -
2. Direct Human Consumption (DHC):
• By means of Resolution No. 015-2019-PRODUCE, published on January 17, 2019, the catch limit for the horse mackerel resource was set at 79,000 MT and for mackerel was set at 135,000 MT, applicable to extractive activities for Direct Human Consumption for the period corresponding to 2019, making total of 214,000 MT of horse mackerel and mackerel. This quota may be modified according to the biological and / or environmental factors estimated by the Instituto del Mar del Peru - IMARPE.
• By means of Resolution No. 643-2017-PRODUCE, published on December 31, 2017, the catch limit for the horse mackerel resource was set at 75,000 MT and for mackerel at 110,000 MT, for the period corresponding to 2018, totaling 185,000 MT of horse mackerel and mackerel.
• Despite the lack of horse mackerel and mackerel resources, Exalmar caught 7,438 MT in 2018. As at December 31, the sector caught 43.61% of the allocated quota, while Exalmar reached about 9.2% of participation.
Horse Mackerel and Mackerel
MT 2015 2016 2017 2018
Quota 140,000 239,000 210,000 185,000
Effective Catch of the Sector 1,080 110,814 76,790 80,598
Sector Quota Advance 0.8% 46.4% 36.6% 43.6%
Exalmar Catch 133 10,310 8,646 7,438
Participation of Exalmar 12.3% 9.3% 11.3% 9.2%
The effective catch of the years 2016, 2017 and 2018 basically corresponds to mackerel species. Elaboration: own.
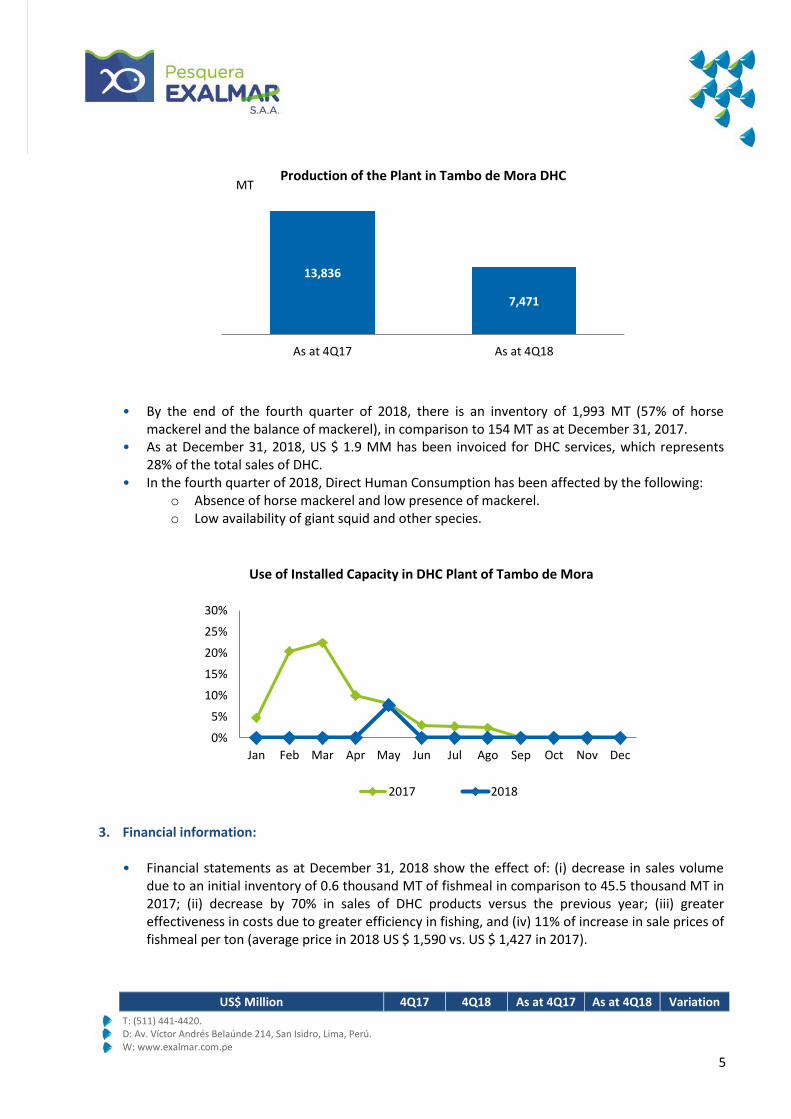
• By the end of the fourth quarter of 2018, the production of the Plant in Tambo de Mora reached
7,471 MT, decreasing by 46% in comparison to the previous year, due to the low availability of mackerel (in 2017 there was more processing until the beginning of the second quarter).
T: (511) 441-4420. D: Av. Víctor Andrés Belaúnde 214, San Isidro, Lima, Perú. W: www.exalmar.com.pe
5
• By the end of the fourth quarter of 2018, there is an inventory of 1,993 MT (57% of horse
mackerel and the balance of mackerel), in comparison to 154 MT as at December 31, 2017. • As at December 31, 2018, US $ 1.9 MM has been invoiced for DHC services, which represents
28% of the total sales of DHC. • In the fourth quarter of 2018, Direct Human Consumption has been affected by the following:
o Absence of horse mackerel and low presence of mackerel. o Low availability of giant squid and other species.
3. Financial information: • Financial statements as at December 31, 2018 show the effect of: (i) decrease in sales volume
due to an initial inventory of 0.6 thousand MT of fishmeal in comparison to 45.5 thousand MT in 2017; (ii) decrease by 70% in sales of DHC products versus the previous year; (iii) greater effectiveness in costs due to greater efficiency in fishing, and (iv) 11% of increase in sale prices of fishmeal per ton (average price in 2018 US $ 1,590 vs. US $ 1,427 in 2017).
US$ Million 4Q17 4Q18 As at 4Q17 As at 4Q18 Variation
13,836
7,471
As at 4Q17 As at 4Q18
Production of the Plant in Tambo de Mora DHCMT
0%
5%
10%
15%
20%
25%
30%
Jan Feb Mar Apr May Jun Jul Ago Sep Oct Nov Dec
Use of Installed Capacity in DHC Plant of Tambo de Mora
2017 2018
T: (511) 441-4420. D: Av. Víctor Andrés Belaúnde 214, San Isidro, Lima, Perú. W: www.exalmar.com.pe
6
Sales 7.1 25.6 254.6 240.7 -5%
Gross profit -12.5 7.0 53.7 90.3 68%
Operating profit (*) -15.7 1.6 28.3 65.6 132%
Profit before Tax -24.9 -3.2 4.7 42.9 808%
Net Profit -13.4 -2.8 4.8 29.3 511%
EBITDA (**) -10.6 6.8 48.5 91.3 88%
(*) Operating profit does not consider other incomes/expenses. (**) EBITDA does not consider the other incomes/expenses, because they are non-recurrent items nor sharing to workers.
3.1 Sales: • By the end of the fourth quarter of 2018, total sales decreased by 6% in comparison to the
previous year, due to a lower initial inventory, as a result of a lower effective catch in the second season of 2017 (687 thousand MT against to 1,954 thousand MT of the second season of 2016).
(*) The price of fish oil considers closed contracts on January 24, 2019, which represent 26% of the total production in this
season.
• The catch corresponding to the first season of 2018 increased by 36% in comparison to the first season of 2017 and, despite the higher quota, the sale price of fishmeal increased by 12.1%.
• By the end of the fourth quarter of 2018, 68.4% of the fishmeal volume available for sale has been sold and 57.7 thousand MT remain in the inventory.
19% 21%11% 2%
38% 38%27%
12%
EBITDA Margin Gross Margin Operating Margin Net Margin
As at 4Q17 As at 4Q18
1,476 1,3961,728 1,569
1,4691,5561,217
2,339
1,304
2,199
1.952.37
0.69
3.25
2.06
0.0
1.0
2.0
3.0
4.0
0
1,000
2,000
3,000
2nd season 2016 1st season 2017 2nd season 2017 1st season 2018 2nd season2018(*)
Average Sale Prices and Effective Catch
Fishmeal Fish oil Effective Catch
US$/ MT Million MT
T: (511) 441-4420. D: Av. Víctor Andrés Belaúnde 214, San Isidro, Lima, Perú. W: www.exalmar.com.pe
7
• DHC sales had a decrease of 70% in comparison to the previous year, due to the shortage of mackerel in the first months of the year. These represented 3% of total sales, lower than the previous year in which it represented 9%.
Net Sales - Indirect Human Consumption 4Q17 4Q18 As at 4Q17 As at 4Q18 Variation
Fishmeal MT 1,701 11,781 144,670 124,752 -14%
US$/MT 1,443 1,563 1,427 1,590 11%
Total Fishmeal Sales (thousand US$)
2,456 18,417 206,412 198,375 -4%
% of Total Sales 35% 72% 81% 82%
Fish oil
MT 2,437 2,592 18,293 23,965 31%
US$/MT 1,319 1,595 1,330 1,430 8%
Total Fish Oil Sales (thousand US$) 3,215 4,133 24,329 34,279 41%
% of Total Sales 45% 16% 10% 14%
Anchovy
MT - 1,393 2,554 3,862 51%
US$/MT - 201 256 221 -14%
Total Anchovy (thousand US$) - 281 655 854 30%
% of Total Sales - 1% 0% 0%
Quota Rent (thousand US$) (*) - - 656 300 -54%
% of Total Sales - - 0% 0%
TOTAL INDIRECT HUMAN CONSUMPTION
5,671 22,831 232,051 233,807 1%
% of Total Sales 80% 89% 91% 97%
Net Sales – Direct Human Consumption 4Q17 4Q18 As at 4Q17 As at 4Q18 Variation
Fresh fish Total Fresh Products
(thousand US$) - 9 137 44 -68%
% of Total Sales 0% 0% 0% 0%
Services – DHC
Total Services (thousand US$) - 342 1 1,888 -
% of Total Sales 0% 1% 0% 1%
Frozen Products
MT 543 2,873 18,101 5,311 -71%
US$/MT 2,589 798 1,237 888 -28%
Total Frozen Products (thousand US$) (**)
1,405 2,291 22,394 4,717 -79%
% of Total Sales 20% 9% 9% 2%
Others (thousand US$) - 153 57 201 256%
% of Total Sales - 1% 0% 0%
TOTAL DIRECT HUMAN CONSUMPTION
1,405 2,796 22,588 6,850 -70%
% of Total Sales 20% 11% 9% 3%
TOTAL 7,076 25,627 254,639 240,657 -5%
T: (511) 441-4420. D: Av. Víctor Andrés Belaúnde 214, San Isidro, Lima, Perú. W: www.exalmar.com.pe
8
(*)Quota rent corresponds to south region.
(**)It includes horse mackerel, mackerel, sea scallops, mahi-mahi, squid, and giant squid in various forms, among others.
3.2 Gross Profit:
US$ Million 4Q17 4Q18 As at 4Q17 As at 4Q18 Variation Sales 7.1 25.6 254.6 240.7 -5%
Cost of Sales 5.2 14.8 173.9 134.6 -23%
Non-production costs 14.3 3.9 27.1 15.7 -42%
Gross Profit -12.5 7.0 53.7 90.3 68%
% on Sales
Gross Margin -177% 27% 21% 38%
Cost of Sales 74% 58% 68% 56%
Non-production costs 203% 15% 11% 7%
• By the end of the fourth quarter of 2018, despite the sale volume was lower by 5%, the gross
profit was higher by 68% than the previous year, as a result of higher sale prices and the greater efficiency of the extraction cost. This was mainly explained by the adequate distribution of the resource to the plants and greater production of fishmeal (+ 83%). The increase of 92% of the volume purchased from third parties, without major changes in the cost of acquisition, also had a positive impact on the results of the year.
US$ Million 4Q17 4Q18 As at
4Q17 As at 4Q18
Variation
Sales 7.1 25.5 254.6 240.7 -5%
IHC 5.7 22.8 232.1 233.8 1%
DHC 1.4 2.8 22.6 6.9 -70%
Costs of Sales 5.2 14.8 173.9 134.6 -23%
IHC 3.5 13.7 157.0 131.4 -16%
DHC 1.7 1.0 16.9 3.2 -81%
Non-production costs (*) 14.3 3.9 27.1 15.7 -42%
IHC 12.8 2.4 19.9 9.5 -52%
21%38%
68%56%
11% 7%
As at 4Q17 As at 4Q18
Non-production costs
Cost of Sales
Gross Margin
T: (511) 441-4420. D: Av. Víctor Andrés Belaúnde 214, San Isidro, Lima, Perú. W: www.exalmar.com.pe
9
DHC 1.6 1.5 7.2 6.3 -13%
Gross Margin -12.5 7.0 53.7 90.3 68%
IHC -10.6 6.7 55.1 93.9 69%
DHC -1.9 0.3 -1.5 -2.6 79%
% on Sales 4Q17 4Q18 As at
4Q17 As at 4Q18
Cost of Sales 74% 58% 68% 56%
IHC 62% 60% 68% 56%
DHC 123% 37% 75% 47%
Non-production costs (*) 203% 15% 11% 7%
IHC 225% 10% 9% 4%
DHC 110% 54% 32% 91%
Gross Margin -177% 27% 21% 38%
IHC -187% 29% 24% 40%
DHC -133% 9% -7% -39%
3.3 Cost of Sales: • By the end of the fourth quarter of 2018, the cost of IHC sales represented 56% of sales, below
the 68% reported in 2017. There were 173 days of closed season, lower than the 234 days in the previous year. Unit costs of IHC sales decreased to US$ 884 per MT1, against to US$ 964 per MT in the previous year (8% less), due to higher production volumes and fuel saving.
• Costs of indirect human consumption sales have been reduced by 16% compared to the same period of the previous year, because the initial inventory of 2018 was 98% lower than the initial one of 2017, and also due to the higher volumes of production and sales.
Cost of IHC Sale
As at 4Q17 As at 4Q18 Variation
Initial Inventory 55,225 897 -98%
Cost of Total Production 101,955 196,451 93%
Workers' sharing 482 3,187 561%
Cost of Fresh Fish Extraction 250 531 113%
Final IHC Inventory 897 69,660 -
COST OF IHC SALE 157,015 131,406 -16%
• The cost of Total Production is composed by the costs of extraction, purchase to third parties and the costs of processing.
1 It considers MT of fishmeal and fish oil sold.
T: (511) 441-4420. D: Av. Víctor Andrés Belaúnde 214, San Isidro, Lima, Perú. W: www.exalmar.com.pe
10
1. As at December 31, 2018, the cost of anchovy catch per MT was higher by 4% against to the previous year, mainly due to the increase in the personnel remuneration by the increase in the fishmeal price, which is a reference for the variable calculation of salaries.
Costs of own catch
As at 4Q17 As at 4Q18 Variation
Own catch (MT) 215,177 398,695 85%
Cost of own catch (thousand US$) 26,449 50,918 93%
US$/MT 122.9 127.7 4%
Depreciation 3,890 8,304
Dep/ MT 18.1 20.8 15%
US$/MT (without depreciation) 104.8 106.9 2%
Detail: Personnel
9,907 20,640
Personnel /MT 46.0 51.8 12%
Maintenance 3,897 8,483
Maintenance/MT 18.1 21.3 17%
Fuel 4,656 6,651
Fuel /MT 21.6 16.7 -23%
Others 4,100 6,840
Others /MT 19.1 17.2 -10%
2. By the end of the fourth quarter 2018, the purchase to third parties represented 50% of the
total processed volume, similar to the previous year. The cost per MT of purchase to third parties regarding the sale price of fishmeal represented 15% as at the fourth quarter 2018, against to 17% in the same period of 2017. The volume purchased increased by 92% while the cost of purchase per ton only increased by 1%.
Costs of purchase to third parties
As at 4Q17 As at 4Q18 Variation
Purchase to third parties (MT) 209,042 400,914 92%
Cost of purchase to third parties (thousand US$) 50,218 96,844 93%
US$/MT 240.2 240.6 1%
% on Sale Price of Fishmeal 50% 50%
3. The processing cost per MT by the end of the fourth quarter 2018 (not including raw material) decreased by 1% regarding the previous year, as a result of higher levels of anchovy processing (89% more regarding the same period in the previous year) that helped to dilute fixed costs and basic services.
Processing Costs
T: (511) 441-4420. D: Av. Víctor Andrés Belaúnde 214, San Isidro, Lima, Perú. W: www.exalmar.com.pe
11
As at 4Q17 As at 4Q18 Variation
Fishmeal and Fish Oil Processing MT 110,342 213,712 94%
Processing Cost (Thousand US$) 25,289 48,690 93%
US$/MT 229.2 227.8 -1%
Depreciation 4,169 6,623 59%
Dep/ MT 38 31 -18%
US$/ MT (without depreciation) 191.4 196.8 3%
Others:
Personnel 4,226 7,356
Personnel/MT 38.3 34.4 -10%
Maintenance 1,050 2,158
Maintenance/MT 9.5 10.1 6%
Fuel 6,030 13,313
Fuel/MT 54.6 66.3 14%
Inspections and analysis 1,164 2,099
Inspections and analysis /MT 10.5 9.8 -7%
Direct costs 2,780 5,263
Direct costs /MT 25.2 24.6 -2%
Basic services (*) 3,116 3,669
Basic services /MT 28.2 17.2 -39%
Others 2,754 8,210
Others /MT 25.0 38.4 54%
(*)Electric power represents 50% of basic services.
3.4 Non-production Costs:
• “Non-production costs” correspond to expenses of plants and vessels during non-production/non-operation days in fishing seasons.
• Non-production costs decreased by 42% in comparison to the previous year, due to more efficiency and better distribution of the resource.
Million US$ As at 4Q17 As at 4Q18 Variation
Fleet non-production cost 6.8 1.3 -82%
Plant non-production cost 13.0 7.9 -40%
Costs of DHC non-production 7.2 6.5 -9%
Non-production Costs 27.0 15.6 -42%
3.5 Operating Expenses:
• By the end of the fourth quarter 2018, administrative expenses increased by 13% regarding the previous year, due to the hiring of non-iterative services.
• Moreover, sale expenses regarding 2017 decreased by 12%, due to lower sale volumes (14% less in fishmeal sale volume). The ratio in comparison to sales remains in 6%.
T: (511) 441-4420. D: Av. Víctor Andrés Belaúnde 214, San Isidro, Lima, Perú. W: www.exalmar.com.pe
12
Million US$ 4Q17 4Q18 As at
4Q17 As at 4Q18
Variation
Sale expenses 1.1 3.0 16.2 14.3 -12%
% On Sales 16% 12% 6% 6%
Administrative Expenses 2.1 2.3 9.2 10.4 13%
3.6 Operating Profit (*):
• By the end of the fourth quarter 2018, the operating profit increased by US$ 37.0 million regarding the previous year (27% regarding sales compared to 11% in 2017), as a result of lower costs and higher sales value per ton (11% more per ton of IHC products compared to the same period of the previous year).
(*)Operating profit does not consider the other incomes/expenses.
3.7 Financial Expenses:
• Net financial expenses had an increase of 9%, changing from US$ 17.6 million in 2017 to US$ 19.1 million as at the end of the fourth quarter of 2018, representing 8% on sales (7% in 2017). An Exchange Offer of the current bonds and their related expenses was made in February 2018 and this increased the financial expenses of the period. Moreover, the interest rates of the financial market have increased and there is more need of working capital due to the higher production obtained.
Million US$ 4Q17 4Q18 As at
4Q17 As at 4Q18
Variation
Financial incomes 0.0 0.2 0.1 0.2
Financial expenses 4.3 4.1 17.1 19.3 10%
Net Financial Expenses -4.3 -4.0 -17.6 -19.1 9%
% On Sales 60% 16% 7% 8%
3.8 Net Profit:
• By the end of the fourth quarter 2018, the net profit was US$ 29.3 million, 511% more than the previous year (US$ 4.8 million as at December 31, 2017).
28
66
Operating profit (*)
As at 4Q17 As at 4Q18
US$ Million
T: (511) 441-4420. D: Av. Víctor Andrés Belaúnde 214, San Isidro, Lima, Perú. W: www.exalmar.com.pe
13
3.9 Indebtedness:
• By the end of the fourth quarter 2018, the total debt amounted to US$ 265.9 million, superior by 31% to the previous year (US$ 200.6 million in 2017). The long-term debt (current and non-current part) was of US$ 191.9 million, from which US$ 2.9 million correspond to leasing operations. The short-term debt amounted to US$ 70.0 million, directly related to higher processing levels and purchase to third parties.
Debt Position (*)
US$ Million As at 4Q17 As at 4Q18 %
Short-term Debt 3.0 70.0 -
1% 27%
Long-term Debt 197.6 191.9 -3%
Current part 6.0 5.9 -3%
Non-current part 191.5 186.0 -3%
Total Debt 200.6 261.9 31%
Cash 2.9 33.1 1,031%
NET DEBT 197.6 228.8 16%
MILLION US$ As at 4Q17 As at 4Q18
Short-term Debt (Working Capital) 3.0 70.0
Cash 2.9 33.1
Net Trade Accounts Receivable 1.4 9.9
Valued Inventory (USS) 3.1 102.5
Fishmeal stock (thousand MT) 0.6 57.7
Fish Oil stock (thousand MT) 0.0 7.8
DHC Stock (thousand MT) 0.2 2.0
Fishmeal Valued Inv. (**) 0.8 84.7
Fish Oil Valued Inv (**) 0.0 17.2
DHC Inv (***) 2.3 0.6
Receivables + Valued Inventory + Cash 7.4 145.5
Short-term Debt Hedge 154% 108%
(*)Only the debt capital is considered. (**) Valued at average sale prices of closed contracts. (***) Valued at inventory costs.
• By the end of the fourth quarter of 2018, we had current assets of US$ 145.5 million approx., from which 23% is cash, 7% correspond to trade accounts receivable and 70% to inventories. If they are made, short-term debt will be hedged on 2.08 times.
3.10 Financial Indicators:
Liquidity :
T: (511) 441-4420. D: Av. Víctor Andrés Belaúnde 214, San Isidro, Lima, Perú. W: www.exalmar.com.pe
14
The current test (current assets / current liabilities) exceeded in 11% the 1.08x of the previous year. This is due to the increase of the current asset (increased in cash by 11.3x, accounts receivable by 7.2x and stocks by 4.3x regarding 2017), mainly explained by the greater amount of processed resource (+ 89%).
Solvency: Solvency ratio of the fourth quarter of 2018 increased by 48% compared to the same period in the previous year, due to an increase of 88% in EBITDA levels compared to 2017.
(*)EBITDA of the last 12 months is considered.
Profitability:
By the end of the fourth quarter of 2018, profitability ratios are higher than those of 2017. This is due to the increase by 5.1x times of the net income of 2018.
Profitability Position (UDM)
As at 4Q17 As at 4Q18
ROE 2.2% 11.6%
ROA 1.0% 6.3%
Net Margin 1.9% 12.2%
Total Debt / LTM EBITDA: By the end of the fourth quarter 2018, the indicator decreased from 4.20x to 2.90x compared to 2017, as a result of higher levels of EBITDA (+88%) for operational efficiencies.
1.08 1.20
Current test
As at 4Q17 As at 4Q18
3.90
2.01
Long-term debt/ EBITDA*
As at 4Q17 As at 4Q18
T: (511) 441-4420. D: Av. Víctor Andrés Belaúnde 214, San Isidro, Lima, Perú. W: www.exalmar.com.pe
15
(*)EBITDA of the last 12 months is considered.
3.11 CAPEX:
• Regarding CAPEX, by the end of the fourth quarter 2018, there were investments for US$ 23.9 million (US$ 17.4 million as at December 31, 2017), mainly aimed to IHC plants and vessels.
4. Share capital, shareholders and share evolution:
• As at December 31, 2018, the fully subscribed and paid-up capital of the Company amounted to S/. 295’536,144, divided into 295’536,144 common shares with voting rights for a nominal value of S/. 1.00 each one. All shares provide their holders the same rights and liabilities.
4.22.9
Debt / EBITDA*
As at 4Q17 As at 4Q18
51%61%
43%35%
4%3% 2%
0%
20%
40%
60%
80%
100%
As at 4Q17 As at 4Q18
IHC Plants IHC Vessels DHC Business Administratives
T: (511) 441-4420. D: Av. Víctor Andrés Belaúnde 214, San Isidro, Lima, Perú. W: www.exalmar.com.pe
16
• The company's shares are quoted on the Lima Stock Exchange. As at December 31, 2018, the market value of the 295’536,144 shares was S/. 1.15 per share, while as at December 31, 2017, it was S/. 1.05.
5. Other Relevant Facts:
• On September 27, the Moody's risk classification report was disseminated, maintaining the rating of the corporate bonds of Pesquera Exalmar S.A.A. in the B3 rating with stable outlook.
• On November 12, the authorization for starting the second fishing season 2018 in the north - central region was issued, establishing a quota of 2.1 million MT.
• On December 5, the increase in the operating license of our Plant in Callao from 50 MT / hour to 100 MT / hour was reported.
• On January 15, the Board of Directors' agreement regarding the approval of a repurchase of the Company's bonds called "7.375% Senior Notes due 2020" was published, as well as a syndicated loan for up to US $ 110 million.
• On January 15, the subscription of documents corresponding to a syndicated loan up to the amount of US $ 110 million was also disseminated.
• On 16 January the report issued by the risk rating agency Standard & Poor's was published, maintaining the B-rating of the corporate bonds and improving the outlook from "negative" to "positive".
• On January 17, the Moody’s Investors Service classification report was disseminated, which maintained the B3-rating of the corporate bonds with stable outlook,.
• On January 18, it was informed that the holders of the 2020 Bonds were notified of the process of repurchase of the current bonds, establishing the Repurchase date on February 19, 2019.