Managerial Entrenchment and Merger Waves Kose John New York University Dalida Kadyrzhanova Georgia State University December 2015 Abstract This paper documents a novel agency cost that arises because managers of potential takeover targets forgo merger opportunities in industry merger waves. We present compre- hensive evidence that the entrenchment e/ect of classied board varies dynamically over time by industry. While the e/ect is strongly economically signicant in years when in- dustries are undergoing a synergistic merger wave, it is muted in years when synergistic industry M&A activity subsides. In wave industry-years, rms without classied board are more than three times as likely to receive a takeover bid compared to rms with classied board. This di/erence is even larger for less anticipated waves and for rms that also have a high level of takeover protection based on the GIM index of Gompers, Ishii, and Metrick (2003). By contrast, the di/erence in takeover odds is an order of magnitude smaller and not statistically signicant in non-wave industry-years. These results are driven by eco- nomic, technological, and regulatory shocks that create economic opportunities to merge in the industry. Overall, our evidence broadens the classical agency view and suggests that the agency cost of classied boards varies signicantly over time. For helpful comments and suggestions, we thank our discussants Espen Eckbo, Mariassunta Giannetti, Rich Mathews, Avri Ravid, and Kelly Shue. We also thank Jennifer Arlen, Yakov Amihud, Lucian Bebchuk, Alicia Davis Evans, Antonio Falato, Michael Fishman, Victoria Ivashina, Ehud Kamar, Pete Kyle, Mike Lemmon, Kate Litvak, Vojislav Maksimovic, Holger Mueller, Gordon Phillips, Nagpurnanand Prabhala, Adriano Rampini, David Robinson, David Yermack, and seminar participants at NYU Corporate Governance Seminar, Georgetown Law, UNC-Duke Corporate Finance Conference, Penn-NYU Conference on Law & Finance, NBER Law and Economics Meeting, AFA Meetings, Ackerman Conference on Corporate Governance, and All-Georgia Finance Conference. All remaining errors are ours. Corresponding author: Dalida Kadyrzhanova, Department of Finance, J. Mack Robinson School of Business Georgia State University, Atlanta, GA 30303. Phone: (404) 4137347. Email: [email protected]. 1
Transcript
Managerial Entrenchment and Merger Waves
Kose JohnNew York University
Dalida Kadyrzhanova�
Georgia State University
December 2015
Abstract
This paper documents a novel agency cost that arises because managers of potential
takeover targets forgo merger opportunities in industry merger waves. We present compre-
hensive evidence that the entrenchment e¤ect of classi�ed board varies dynamically over
time by industry. While the e¤ect is strongly economically signi�cant in years when in-
dustries are undergoing a synergistic merger wave, it is muted in years when synergistic
industry M&A activity subsides. In wave industry-years, �rms without classi�ed board are
more than three times as likely to receive a takeover bid compared to �rms with classi�ed
board. This di¤erence is even larger for less anticipated waves and for �rms that also have
a high level of takeover protection based on the GIM index of Gompers, Ishii, and Metrick
(2003). By contrast, the di¤erence in takeover odds is an order of magnitude smaller and
not statistically signi�cant in non-wave industry-years. These results are driven by eco-
nomic, technological, and regulatory shocks that create economic opportunities to merge
in the industry. Overall, our evidence broadens the classical agency view and suggests that
the agency cost of classi�ed boards varies signi�cantly over time.
�For helpful comments and suggestions, we thank our discussants Espen Eckbo, Mariassunta Giannetti, RichMathews, Avri Ravid, and Kelly Shue. We also thank Jennifer Arlen, Yakov Amihud, Lucian Bebchuk, AliciaDavis Evans, Antonio Falato, Michael Fishman, Victoria Ivashina, Ehud Kamar, Pete Kyle, Mike Lemmon,Kate Litvak, Vojislav Maksimovic, Holger Mueller, Gordon Phillips, Nagpurnanand Prabhala, Adriano Rampini,David Robinson, David Yermack, and seminar participants at NYU Corporate Governance Seminar, GeorgetownLaw, UNC-Duke Corporate Finance Conference, Penn-NYU Conference on Law & Finance, NBER Law andEconomics Meeting, AFA Meetings, Ackerman Conference on Corporate Governance, and All-Georgia FinanceConference. All remaining errors are ours. Corresponding author: Dalida Kadyrzhanova, Department of Finance,J. Mack Robinson School of Business Georgia State University, Atlanta, GA 30303. Phone: (404) 4137347.Email: [email protected].
1
1 Introduction
Shares of �rms with antitakeover provisions trade at a discount relative to shares of other companies
in the same industry or market as a whole (Gompers, Ishii, and Metrick (2003), Bebchuk, Cohen,
and Ferrell (2009)).1 The traditional view of this discount is that it re�ects a lack of the discipline
from the market for corporate control (Manne (1965)): if antitakeover provisions deter takeovers bids,
the absence of takeover pressure will lead managers to take self-serving actions that ultimately lower
�rm value. A challenge for the traditional view has been the lack of direct evidence that antitakeover
provisions actually deter takeover bids. Comment and Schwert (1995) �nd no evidence that poison pills
or state-level statutes make a di¤erence for takeover likelihood. Bates, Becher, and Lemmon (2008)
�nd that the 1% di¤erence in takeover likelihood between �rms with and without a classi�ed board is
too small economically to justify the di¤erence in their value.
The traditional view focuses on a particular type of takeovers �the disciplinary takeovers. However,
evidence from the literature on industry merger waves (e.g., Harford (2005), Andrade, Mitchell, and
Sta¤ord (2001), Holmstrom and Kaplan (2001)) suggests that a substantial part of wealth creation
from mergers is due to synergistic mergers spurred by technology, economic, and deregulation shocks.
In this paper, we broaden the traditional agency view and ask whether antitakeover provisions destroy
value by deterring synergistic bids. In particular, merger synergies are concentrated in time and
industry: they arrive in response to economic and regulation shocks, are temporary, and not available
to a stand-alone �rm. Antitakeover provisions are costly since they give managers the ability to resist
takeovers and forgo opportunities for shareholders to bene�t from takeover premiums in merger waves
when most synergies occur.
Our evidence provides strong support for this view. We use a sample of publicly traded US �rms
between 1990 and 2007 and focus on the classi�ed board provision which is well-recognized to constitute
1Gompers, Ishii, and Metrick (2003) and Bebchuk, Cohen, and Ferrell (2009) show that �rms with more antitakeoverprovisions have lower valuation multiples. An earlier literature studies the shareholder wealth e¤ects of ATPs using short-term event-study methodology, where �rms�stock returns are analyzed following the announcements of ATP adoptions oramendments (see DeAngelo and Rice (1983), Linn and McConnell (1983), Malatesta and Walkling (1988) and Ryngaert(1988); see also Bhagat and Romano (2001) for a survey of the literature).
2
the most signi�cant barrier to takeovers. Our main �nding is that �rms without a classi�ed board are
targeted disproportionately more in years when industries are undergoing synergistic merger waves.2
In these industry-years, 10.5% of �rms with a single class of directors (i.e., no classi�ed board) become
the target of a takeover bid, compared to only 3% of �rms with classi�ed boards. Thus, in years when
industries are undergoing synergistic merger waves, �rms with a single class of directors are more than
three times as likely to receive a takeover bid compared to �rms with classi�ed boards. The wedge
in takeover odds is even larger for surprise waves and for �rms that also have a high level of takeover
protection based on governance indices used in the literature. These indices include the GIM index of
Gompers, Ishii, and Metrick (2003) and the E-index of Bebchuk, Cohen, and Ferrell (2009). Finally,
the wedge is robust across a battery of di¤erent speci�cations, to using several di¤erent de�nitions
of what constitutes an industry merger wave and synergistic M&A activity, and to treating classi�ed
board as an endogenous variable. Overall, these �ndings suggest that antitakeover provisions entrench
managers exactly when industry conditions are ripe for value-creating merger opportunities.
While our main result is on the entrenchment e¤ect, that is the di¤erence in takeover odds between
�rms with classi�ed boards and those with a single class of directors, even more striking evidence
comes from examining the level of these odds. Our results indicate that, while �rms without classi�ed
boards are much more likely to receive a takeover bid in wave industry-years compared to non-wave
industry-years, the takeover odds of �rms with classi�ed boards are �at over time. Thus, the familiar
wave pattern of takeover activity over time is only present in �rms without classi�ed board protection.
This evidence suggests that when industry merger waves bring synergies and higher target premiums
only shareholders of �rms without classi�ed board protections are able to take advantage of them. In
this sense, antitakeover provisions entrench managers by allowing them to "sit out" industry merger
waves.
Overall, our main result implies that the entrenchment e¤ect of antitakeover provisions (ATPs)
2We de�ne synergistic merger waves as industry-years with abnormally high merger activity for that industry (seeHarford (2005), with the additional requirement that bids are synergistic as in Bradley, Desai, and Kim (1988). SeeSection 3 for more details on the de�nition of synergistic merger waves.
3
varies signi�cantly over time with synergistic merger activity in the industry. This �nding has several
important implications. First, it shows that the takeover-related agency con�icts emphasized by the
literature are particularly severe at times when there are strong economic motives for �rms to merge in
the industry, suggesting that these are the times when the takeover channel may have most bearing for
weakly governed �rms. This implication of our results is consistent with Cremers and Ferrell (2011),
who document evidence of a more negative valuation e¤ect of ATPs when industry M&A activity is
high. While Cremers and Ferrell (2011) focus on the relation of ATPs to �rm value, we provide direct
evidence from the takeover market on time-variation in the entrenchment e¤ect.
Second, the strong economic signi�cance of our estimates is not at odds with the previous liter-
ature that �nds a generally weak average e¤ect of ATPs on takeover likelihood (e.g., Bates, Becher,
and Lemmon (2008) and Comment and Schwert (1995)).3 Instead, our results indicate that the small
average entrenchment e¤ect previously estimated in the literature masks signi�cant underlying het-
erogeneity in the relation between ATPs and merger activity. This is the case since the strength of
the entrenchment e¤ect of ATPs changes systematically through time by industry. In fact, while we
document large estimates for industries that are undergoing a synergistic merger wave, we also �nd
that the entrenchment e¤ect is muted in years when industry M&A activity subsides. In these o¤-wave
industry-years, 3.6% of �rms with a single class of directors become the target of a takeover bid in a
given year, compared to 3.2% of �rms with classi�ed boards. Thus, allowing for heterogeneity across
industries proves critical for establishing the entrenchment power of takeover defenses. Our results sug-
gest that researchers could bene�t from either interacting ATPs indices with industry-wide measures
of the intensity of economic motives to merge or analyzing the e¤ect of ATPs in separate sub-samples.
In our main results, merger waves are identi�ed using a standard approach based on realized
merger activity (see Harford (2005)). In our second set of tests, we adopt a di¤erent approach that
does not rely on ex-post realized activity. Instead, we examine the entrenchment e¤ect in the years
3When we pool observations across on- and o¤-wave industry years, the estimated entrenchment e¤ect of classi�edboard in our sample is 1.3%, same as in Bates, Becher, and Lemmon (2008)).
4
following industry shocks that are likely to bring about synergistic takeover opportunities, but do not
necessarily result in a merger wave. In particular, we consider a wide array of standard industry shocks
that have been shown to be signi�cant determinants of �rms�economic motives to merge, including
economic (Harford (2005)), technological (Andrade et al. (2001)), and regulatory changes in industry
fundamentals. If the variation in the entrenchment e¤ect is driven by the diverging interests of target
managers and shareholders over industry-wide synergy opportunities, then we expect that the e¤ect
should be systematically related to industry shocks that drive economic motives to merge.
For each of these industry shocks, we document that there is an economically large entrenchment
e¤ect of classi�ed boards subsequent to an industry shock. In particular, we show that in the year
subsequent to an industry shock, the di¤erence in takeover likelihood between �rms with and without
a classi�ed board is between 6% and 8%, depending on which particular shock is considered. This
wedge, which becomes even larger when there is large capital liquidity available at the macro-level,
signi�cantly narrows as more years elapse since the initial industry shock. Finally, using a two-stage
least squares approach that adds a �rst stage regression predicting synergistic merger waves with
industry shocks, we show that our �rst result is driven by industry shocks. This approach addresses
the potential concern that industry merger waves are endogenous to the incidence of classi�ed board
protection in the industry. Overall, our second set of results suggests that when industry conditions are
ripe, only shareholders of unprotected �rms bene�t from the arriving industry synergies. By contrast,
classi�ed boards signi�cantly insulate managers from industry shocks that create economic motives for
mergers in the industry.
In the third and �nal set of takeover likelihood tests, we use a dynamic speci�cation to further
corroborate the notion that ATPs entrench managers by allowing them to "sit out" synergistic industry
merger waves. These dynamic tests consider only �rms that actually received a takeover bid and
examine whether it takes longer for a �rm with a classi�ed board to receive a bid relative to a �rm
with a single class of directors. We use duration analysis to derive estimates of the relation between
classi�ed boards and the timing of takeover bids within any given synergistic merger wave spell. If
5
classi�ed boards help managers to "sit out" industry waves, then targets that have a single class of
directors should be "snatched up" �rst, while �rms with classi�ed boards should receive takeover bids
at a signi�cant delay. Consistent with this reasoning, for industries that are undergoing a synergistic
merger wave, we document that classi�ed boards reduce the conditional likelihood that a �rm receives a
takeover bid in any given month by about 1/3 and increase expected time it takes for a �rm to receive a
takeover bid by about 10 months. Overall, our dynamic tests support the notion that classi�ed boards
entrench managers by delaying takeover bid o¤ers, thus allowing them to "wait out" industry merger
waves.
Are the entrenchment e¤ects we documented likely to lead to signi�cant costs for shareholders?
In order to assess the economic signi�cance of our likelihood estimates, the last part of our analysis
considers target premiums and bidder returns. There is theory (e.g., Stulz (1988)) and some evidence
supporting the view that ATPs improve target management bargaining position and may allow targets
to extract higher takeover premiums especially in concentrated industries (Kadyrzhanova and Rhodes-
Kropf (2011)). Thus, the entrenchment e¤ect unambiguously leads to costs for shareholders only if
the lower likelihood of receiving an o¤er for �rms with classi�ed boards is not o¤set by relatively
higher premiums in industry merger waves. Our evidence shows that there is signi�cantly weaker
variation of the bargaining e¤ect through time by industry. If any, the bargaining e¤ect of classi�ed
boards is somewhat stronger o¤ industry merger wave years. Thus, we conclude that our documented
entrenchment e¤ects are likely to lead to signi�cant costs for shareholders, since they do not appear
to be signi�cantly o¤set by bargaining e¤ects.
Our study is most closely related to a growing recent governance literature starting from Gom-
pers, Ishii, and Metrick (2003)4 which focuses on industry interactions (Giroud and Mueller (2010),
Cremers and Ferrell (2011), and Kadyrzhanova and Rhodes-Kropf (2011)). Previous papers that fol-
low this industry approach have shown that governance and industry characteristics, such as industry
4See also Bebchuk, Cohen, and Ferrell (2009), Bebchuk and Cohen (2005), Faleye (2007) and Cremers and Nair (2003),Masulis, Wang, and Xie (2006).
6
concentration, are joint determinants of �rm value. We share with these papers the focus on industry
interactions. Our �ndings signi�cantly broaden the scope of this literature by focusing on a speci�c
mechanism, namely the market for corporate control, and by highlighting the role of industry shocks
that drive �rms�economic motives to merge. Our �ndings also contribute to the classical literature on
the market for corporate control5 by showing that entrenchment e¤ects of ATPs are much larger than
had been previously found and that there is a signi�cant time-series and cross-industry variation in
the entrenchment e¤ect of ATPs. Overall, our analysis suggests that the governance literature needs
to control for the interaction of ATPs and industry shocks.
The remainder of the paper is organized as follows. Section 2 reviews the literature and details
the empirical strategy of our industry approach. Section 3 describes the data and the construction of
our variables. Sections 4 and 5 present the results of our probit and duration analyses, respectively.
Section 6 considers economic signi�cance and Section 7 concludes.
2 Literature Background and Hypothesis Development
While the negative relation between ATPs and �rm value is well-established in the governance literature
(e.g., Gompers, Ishii, and Metrick (2003), Bebchuk, Cohen. and Ferrell (2009)), the question of
whether there are economically large entrenchment e¤ects of ATPs in the takeover market remains
open. Addressing this question is important for two main reasons. First, it moves us closer to answering
the fundamental question of whether ATPs are a signi�cant source of managerial entrenchment in the
takeover market. Second, it has important implications for the governance literature on �rm value, as
well as the policy debate on corporate governance reform, because it can help us to assess whether the
takeover market is a signi�cant channel through which ATPs impact shareholder value.
Several papers have studied the entrenchment e¤ect of ATPs in the takeover market (Comment
and Schwert (1995), Schwert (2000), and, more recently, Bebchuk, Coates, and Subramanian (2002),
5 Important contributions are Comment and Schwert (1995), Schwert (1996, 2000), Jensen and Ruback (1983), DeAn-gelo and Rice (1983), Mikkelson and Partch (1989), and Bates, Becher, and Lemmon (2008).
7
and Bates, Becher, and Lemmon (2008)). These papers have used a variety of provisions - e.g., poison
pill, classi�ed board, etc. - and econometric models. The typical framework is a probit regression of
a dummy variable for whether a given �rm becomes the target of a takeover bid in a given year on
the �rm�s anti-takeover provisions. This approach leads to a small average di¤erence in the implied
probabilities of becoming a takeover target between �rms with and without anti-takeover provisions:
for example, a typical di¤erence between the takeover probabilities of �rms with and without classi�ed
boards is about 1 percentage point. Based on these results, Bates, Becher, and Lemmon (2008) conclude
that existing estimates represent a challenge for the governance literature: "overall, the evidence is
inconsistent with the conventional wisdom that board classi�cation is an antitakeover device that
facilitates managerial entrenchment.�
Our paper extends the standard probit framework used in the literature and allows for systematic
heterogeneity in the entrenchment e¤ect of ATPs through time by industry depending on whether there
are economic motives for �rms to merge. This extension accomplishes two main goals: �rst, we o¤er
a new test and new evidence on whether the entrenchment e¤ect of ATPs varies signi�cantly across
industries; second, we use our analysis to reassess the question of the extent to which antitakeover
provisions entrench managers by shielding them from takeover pressure. In fact, while the literature to
date has estimated an average entrenchment e¤ect in the takeover market that is homogeneous across
years and industries, our tests isolate speci�c sub-sets of industry-years where there is potentially more
scope for takeover-related agency issues to play out. Overall, our extended probit framework enables
us to study the entrenchment e¤ect at times when industry-wide synergies become available and, thus,
forgone merger opportunities are costly for shareholders.
The question of whether the entrenchment e¤ect of ATPs in the takeover market varies through
time by industry is fundamentally an empirical one. Of course, if ATPs are a second-order factor in
acquisition decisions, then there is no a priori reason to expect that their e¤ect should be larger or
smaller in di¤erent industry-years. Alternatively, the entrenchment e¤ect could be either attenuated or
strengthened by the arrival of industry-wide synergies. On the one hand, expected gains for acquirers
8
are likely to be higher when synergistic merger opportunities become available in the industry. This
would work in the direction of o¤setting the higher acquisition costs of targets with ATPs and, thus,
would lead to an increase in the proportion of �rms with ATPs that become targets. On the other hand,
the potential for value gains for target shareholders is also likely to be higher when synergistic merger
opportunities become available in the industry. An agency-based view that managers are reluctant to
give up control and ATPs enable them to retain control would imply that, at such times, �rms without
ATPs should be targeted disproportionately more. Thus, under this agency hypothesis, the arrival of
synergistic merger opportunities in the industry strengthens the entrenchment e¤ect of ATPs.
In addition, the agency perspective emphasizes that especially some ATPs, such as a classi�ed
board of directors,6 can induce a delay of up to three-years on acquirers (see, for example, Bebchuk,
Coates and Subramanian (2002)). This delay e¤ect would reinforce the agency hypothesis, since delay
is likely to be particularly costly for acquirers concerned about missing merger opportunities in a
synergistic industry merger wave.
In summary, this reasoning suggests the following novel testable prediction.
Prediction 1 (ATPs and synergistic industry merger waves): The entrenchment e¤ect of
ATPs - i.e., the relation between ATPs a �rm�s likelihood of becoming a takeover target - should vary
systematically through time by industry. In particular, the arrival of synergistic merger opportunities
in the industry should either attenuate or magnify the entrenchment e¤ect of ATPs, depending on
whether or not takeover-related agency problems are heightened.
If the variation in the entrenchment e¤ect of ATPs is driven by the arrival of new merger oppor-
tunities in the industry, its magnitude should increase with the degree of the surprise about these
new opportunities. In fact, when acquirers partially anticipate that merger opportunities are going to
become available, they can start "snatching up" unprotected industry targets, thus attenuating the
deterrence e¤ect by the time M&A activity reaches its pick.
6A classi�ed board mandates that only a given proportion - typically 1/3 - of the board can be elected each year sothat it takes 3 years to turn over the board completely.
9
Prediction 2 (Anticipation): The variation in the deterrence e¤ect of ATPs through time by
industry should be more pronounced for surprise synergistic merger waves.
Finally, waves of industry M&A activity have been shown to be related to several industry-wide
shocks, including those related to economic, technological, and regulatory changes in the structure of
the industry, which create opportunities for value-creating mergers (Mitchell and Mulherin (1996)).
Holmstrom and Kaplan (2001) note that the determinants of merger activity in the 1990s were mostly
industry-wide synergies created by growth opportunities in new technologies and markets. Gort (1969)
argues that mergers are triggered by economic shocks and Jensen (1988) argues that the sharp rise in
interest rates, coupled with the sharp drop in oil prices, were the catalysts of the 1980�s restructuring
in the oil industry. If the variation of the entrenchment e¤ect is driven by the diverging interests of
target managers and shareholders over industry-wide synergy opportunities, then the e¤ect should be
systematically related to industry shocks that drive economic motives to merge.
Prediction 3 (Industry shocks): Industry shocks should either attenuate or magnify the en-
trenchment e¤ect of ATPs, depending on whether or not takeover-related agency problems are height-
ened.
In summary, our industry approach is to empirically test whether ATPs entrench managers in
synergistic industry merger waves, thus e¤ectively letting them sit out these waves of potential value
creation. If this is the case, we expect that the entrenchment e¤ect of ATPs should vary systematically
through time by industry and be stronger in those industry-years when economic motives to merge
are heightened. In the next subsection, we detail our empirical strategy aimed at implementing these
tests.
3 Data and Empirical Speci�cation
In order to test whether the relation between ATPs and merger activity varies over time by industry
depending on whether there are economic motives for �rms to merge, we assemble a dataset that adds
10
comprehensive information on corporate acquisition attempts to a standard panel of S&P 1500 �rms
between 1990 and 2006 for which data on anti-takeover provisions is available. For each observed
acquisition attempt, we need to de�ne the industry it occurred in and construct empirical proxies for
the intensity of the economic motives to merge in the industry. In this section, we �rst detail our
sample selection criteria and then describe our key explanatory variables. Appendix B summarizes the
sources and detailed de�nitions of all the variables.
3.1 Empirical Speci�cation
Our main empirical tests extend the standard probit framework of takeover deterrence (see, for example,
Bates, Becher, and Lemmon (2008)) to allow for variation of the deterrence e¤ect of ATPs through
time by industry:
Pr(Targetikt) = ajt + d
jk + b
j1 �ATPikt + b
j2 �Xikt + eijkt (1)
where i denotes �rm, j denotes an industry synergistic merger wave regime, k denotes industry, t
denotes year, Targetikt is a dummy that equals one if �rm i in industry k receives a takeover bid at
time t and zero otherwise, ATPikt is the �rm�s anti-takeover provisions, and Xikt is a set of standard
controls that includes the level of industry concentration, a dummy for high-tech industries, and
standard �rm and industry controls (e.g., Palepu (1986), Schwert (2000), Bates, Becher, and Lemmon
(2008)). Firm controls include (industry-adjusted) sales growth, market-to-book ratio, and size, while
industry controls are the industry averages of these �rm-level variables.7 We include year e¤ects, at; and
industry e¤ects, dk, to control for average variation in takeover activity over time and across industries
(industry dummies address the issue of unobserved heterogeneity across industries). Finally, to allow
for potential serial correlation of deals from the same industry, we evaluate statistical signi�cance using
robust clustered standard errors adjusted for non-independence of observations within industries (see
Wooldridge (2002), p. 275).
We split industry-years into two regimes, on the wave and o¤ the wave, based on the intensity
7All �rm- and industry-level variables are measured at the the end of the year prior to the bid o¤er announcement.
11
of synergistic merger activity in the industry (see detailed description below). Thus, letting j = 1
denote on the wave industry-years and j = 2 denote o¤-the-wave industry-years, we e¤ectively obtain
the standard probit estimates of takeover likelihood separately in each of the two industry-year sub-
samples. The innovation of our speci�cation with respect to previous literature is that equation (1)
allows for both intercept and slope coe¢ cients to be industry�year-speci�c. Our null hypothesis is that
the di¤erence between the (slope) coe¢ cients on ATPs between the two sub-samples equals zero - i.e.,
b11 = b21: In addition to the intensity of synergistic merger activity, we use a second proxy for the intensity
of economic motives to merge: a dummy variable that takes value of one in years when industries are
hit by economic, technological, and regulatory industry shocks (Mitchell and Mulherin (1996), Harford
(2005), Maksimovic and Phillips (2001). In the next section we detail our data construction procedure
and de�nitions of these proxies.
In the second part of our analysis, we complement these standard likelihood tests with a dynamic
speci�cation based on duration analysis (Cox hazard model). Duration analysis exploits the timing of
takeover bids, thus providing additional evidence on whether ATPs entrenchment managers by allowing
them to "sit out" synergistic industry merger waves.
3.2 Data
Our sample includes US public corporations covered by the Investor Responsibility Research Center
(IRRC) between 1990 and 2006. The IRRC reports about every two years8 data on a set of 24
governance provisions for �rms in the Standard & Poor�s 1500 and other major US corporations. We
match �rm-year observations from IRRC to Compustat and retain those with non-missing book value
of assets and exclude �nancial �rms and utilities (SIC codes between 6000 and 6999 and between 4900
and 4999). For years not covered by IRRC, we assume that the classi�ed board provision remains in
place if it is present in two adjacent IRRC volume publication dates. If not, we supplement information
with SEC �lings from Edgar and newspaper article searches from Factiva. The resulting merged IRRC-
8The IRRC volumes are published in the following year: 1990, 1993, 1995, 1998, 2000, 2002, 2004, 2006.
12
Compustat sample consists of 2,584 �rms and 16,141 �rm-year observations.
3.2.1 Industry shocks and merger waves
Our industry classi�cation is as in Fama and French (1997). In robustness tests, we consider �ner 3-
SIC industry classi�cations. We collect historical industry classi�cation data from physical Compustat
tapes on an annual basis over our sample period. Kahle and Walkling (1996) emphasize that Compustat
SICs lead to signi�cantly more accurate classi�cation than CRSP, an issue that is especially important
for studies such as ours that involve cross-industry comparisons. However, a limitation of Compustat
with respect to CRSP is that it does not have historical information on SIC, which is why we need
to rely on the physical tapes to identify all �rms whose primary SICs have changed over our sample
period.9
We use a standard approach to identify synergistic merger waves at the industry level (see Harford
(2005) for a similar de�nition of industry merger waves and Bradley, Desai, Kim (1988) for a similar
de�nition of synergistic deals). We classify any given industry-year as involving a synergistic industry
merger wave if the number of synergistic deals in that year is one standard deviation above the industry
time-series median. Synergistic deals are de�ned as those with positive bidder and target combined
wealth e¤ect, where bidder and target combined wealth e¤ect is de�ned as the value-weighted sum of
cumulative abnormal return to the bidder and the target�s stock for trading days (-5, +2) relative to
the date of the bid.
Based on Eckbo (1983, 1985, 1992) and Song and Walkling (2000), in our baseline analysis we
require that waves are relatively unexpected, which we de�ne as those that involve a surprise bid in at
least half of the (3-SIC) subsectors within the industry, with surprise bid de�ned as the �rst takeover
bid after a period of at least 5 months with no acquisition activity in the subsector. This restriction
leads to our �nal sample of 7,895 �rm-year observations. In robustness analysis we consider variation
by degree of anticipation and robustness to including relatively anticipated waves and to a variety of
9We also cross-checked this information for consistency using data from Compact Disclosure.
13
alternative de�nitions of what constitutes a synergistic wave.
We also consider a second approach that relies on industry characteristics (shocks), rather than
realized merger activity, to construct a proxy for the intensity of economic motives to merge in the
industry. We use a wide array of standard industry shocks that have been shown in the literature to
be signi�cant determinants of �rms�economic motives to merge, including economic (Harford (2005)),
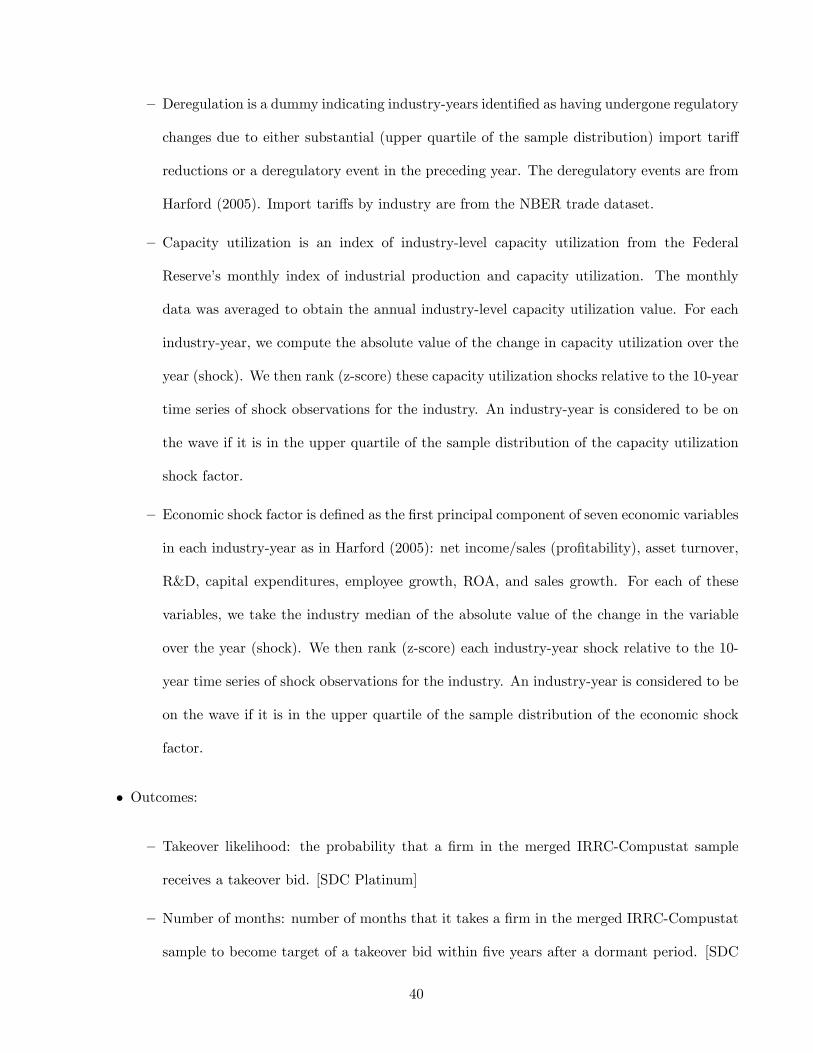
technological (Andrade et al. (2001)), and regulatory changes in industry fundamentals. Our proxy
for economic shock is based on seven economic variables in each industry-year as in Harford (2005):
net income/sales (pro�tability), asset turnover, R&D, capital expenditures, employee growth, ROA,
and sales growth. For each of these variables, we take the industry median of the absolute value of
the change in the variable over the year (shock). We then rank (z-score) each industry-year shock
relative to the 10-year time series of shock observations for the industry. To avoid multicollinearity
from including all these variables in the same model, we use the �rst principal component from these
seven variables as a measure of economic shock factor. An industry-year is considered to involve an
economic shock if it is in the upper quartile of the sample distribution of the economic shock factor.
Technological shocks are de�ned as in Mitchell and Mulherin (1996) based on capacity utilization
in the industry. Our proxy is an index of industry-level capacity utilization from the Federal Reserve�s
monthly index of industrial production and capacity utilization. We average the monthly data to obtain
the annual industry-level capacity utilization value and use the same procedure as for the economic
shocks to identify industry-years involving a shock. Finally, regulatory shocks are also standard (e.g.,
Andrade, Mitchell, and Sta¤ord (2001). Our regulatory shock dummy is de�ned as taking the value of
one in industry-years involving either substantial import tari¤ reductions (upper quartile of the sample
distribution) or a deregulatory event. We obtain annual import tari¤ data by industry from the NBER
trade dataset. The deregulatory events are from the list in Harford (2005).
14
3.2.2 Antitakeover provisions
We focus our main analysis on the classi�ed board provision. In robustness checks, we consider the role
of state- and other �rm-level antitakeover provisions. The reason for this choice is that, while �rms
can employ a number of alternative anti-takeover provisions, M&A practitioners and lawyers as well as
the agency literature (see, for example, Daines and Klausner (2001), Bebchuk and Cohen (2005), and
Kadyrzhanova and Rhodes-Kropf (2009)) argue that none presents as prohibitive of an expense for
prospective acquirers as a classi�ed board. This is the case since a classi�ed board staggers elections of
directors into usually three distinct classes with successive annual elections occurring only for a single
class of directors. By making it impossible for a hostile bidder to remove a majority of incumbent
directors without waiting for a minimum of two elections cycles, classi�ed boards represent a formidable
obstacle to a change-in-control bid contested by target management. In addition, classi�ed board is
the main anti-takeover provision considered in recent studies that also use the IRRC information such
as, for example, Bates, Becher, and Lemmon (2008), which eases comparison of our results with these
recent �ndings in the literature.
3.2.3 Takeover bids
In order to obtain information on both successful and unsuccessful takeover attempts involving IRRC
�rms, we use the mergers and acquisitions database maintained by Securities Data Corporation (SDC).
We account for multi-bid auctions and follow-on bidding as in Bates, Becher, and Lemmon (2008) and
�lter our sample of bids to include only initial bids for a given target, which are de�ned as all bids
for which there is no bid for the target identi�ed for 365 calendar days before the announcement. Our
merged IRRC-Compustat sample is associated with 934 merger and acquisitions transaction reports
on SDC between 1990 and 2006. These deals are screened to include only deal forms coded as �merg-
ers�, �acquisitions�, and �acquisitions of majority interest."10 We exclude takeovers involving �nancial
bidders and deals in which the bidder holds more than 15% of the target�s total shares outstanding
10We also exclude exclude spin-o¤ �acquisitions�where the acquirers are the �rm�s own shareholders.
15
prior to the takeover announcement. Our sample of takeover bids is then matched to the merged
IRRC/Compustat data by calendar year.11 The �nal data set consists of 732 takeover bids involving
IRRC �rms announced between 1990 and 2006.
Panel A of Table 1 presents summary statistics of �rm, industry, and takeover deal characteristics
in our sample. Sample moments for classi�ed board, �rm, and industry characteristics are in line with
previous governance studies that use the IRRC sample (e.g., Gompers, Ishii, and Metrick (2003)). Deal
characteristics are also comparable to those in previous studies of the market for corporate control (e.g.,
Mikkelson and Partch (1989), Bates, Becher, and Lemmon (2008), Schwert (2000)). In particular, �rms
that receive a takeover o¤er are about 4.9% of the �rm-year observations, deals that include stock as a
method of payment comprise about 65% of the total number of takeover deals, the incidence of tender
o¤ers is about 17%, and about 75% of the deals are completed.
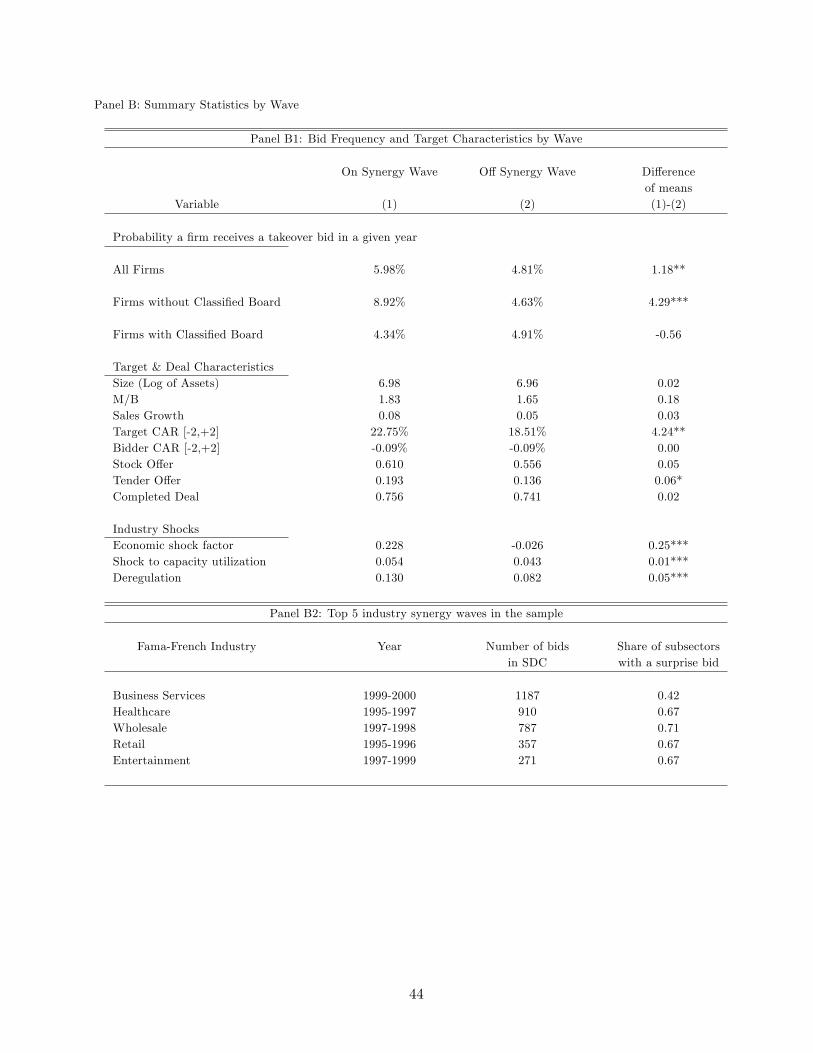
Panel B1 of Table 1 summarizes bid frequency, target and deals characteristics, and industry
shocks, delineated by whether the industry-year involves a synergistic merger wave. The statistical
signi�cance of di¤erences in means between industry-years that involve such waves and those that
do not is indicated by asterisks in the far right column. As expected, bid frequency is signi�cantly
higher in industry-years involving a synergistic merger wave. However, only �rms with a single class
of directors experience a signi�cant and large change in bid frequency between wave and non-wave
industry years, with bid frequency being about 4.6% in non-wave industry-years and about 9% in wave
industry-years. By contrast, bid frequency for �rms with a classi�ed board of directors is around 5%
and is not statistically signi�cantly di¤erent in wave and non-wave industry years. As a result, in wave
industry-years takeover bid frequency for �rms with a single class of directors is about twice as large
as bid frequency of �rms with classi�ed boards, while bid frequencies for these two groups of �rms are
about the same in o¤-wave industry-years.
11Targets are matched to CRSP/Compustat GVKEY identi�ers using reported SDC target CUSIPs. Given variationin SDC and Compustat CUSIP codes we verify positive matches comparing the SDC reported company name againstthe historical name structure on CRSP. For a subset of targets not matched by CUSIP, we match using the targetcorporation�s name from SDC and the name structure on CRSP.
16
With the exception of target announcement returns and tender o¤er frequency, which are both
higher in industry-years involving a synergistic merger waves, none of the di¤erences in target and
deal characteristics is statistically signi�cant across the two groups. The fact that target premiums
are higher on the wave suggests that targets share some of the surplus from synergistic deals. Finally,
all our measures of industry shocks are signi�cantly di¤erent across the two groups of industry-years,
which suggests that these industry shocks give rise to synergistic merger opportunities and is consistent
with the standard �nding in the literature that industry shocks are catalysts of industry merger waves.
Panel B2 of Table 1 lists �ve synergistic industry merger waves with the largest total deal value
in our sample. Given that we are using a similar methodology to identify industry waves, it is not
surprising that all of these �ve episodes are also classi�ed as waves by Harford (2005). However,
it is interesting to note that the motives for these waves reported in Harford (2005) and based on
Lexis-Nexis searches all involve economic motives to merge, such as the Telecom Act of 1996 for the
Entertainment industry or consolidation and industry growth as outsourcing takes o¤ in the Business
Services industry.
4 Baseline probit analysis of the likelihood of receiving a takeover
bid
In this section we present the main �ndings of our study. We show that the relation between classi�ed
board and a �rm�s takeover likelihood clusters through time by industry. In particular, we document
that there is an economically signi�cant relation between classi�ed boards and takeover likelihood in
years when industries undergo synergistic merger waves, especially when these industry merger waves
are relatively unanticipated. By contrast, deterrence is muted in years when synergistic industry M&A
activity subsides. Next, we explore the link with the underlying economic determinants of merger gains.
We document that the deterrence e¤ect of classi�ed boards is economically signi�cant in years when
industries are hit by a variety of economic, technological, and regulatory industry shocks that tend
17
to increase merger gains. As time lapses from the initial impact of these industry shocks, the e¤ect
of classi�ed board declines. Finally, we show that several other ATPs that are commonly included
in standard governance indices signi�cantly strengthen the deterrence e¤ect of the classi�ed board
provision, but again only on the wave. Overall, these results suggest that ATPs entrench managers by
allowing them to sit out synergistic industry merger waves.
4.1 Classi�ed boards and synergistic industry merger waves
Table 2 presents results of our baseline probit analysis of the relation between classi�ed board and
the likelihood that a �rm receives a takeover bid in any given synergistic industry merger wave year.
We estimate equation (1), where the dependent variable takes value of one when a �rm receives a
takeover bid in a given year. Industries are considered to undergo a synergy wave in any given year
if the number of synergistic deals in that year is one standard deviation above the industry time-
series median, with industries de�ned as in Fama and French (1997) and synergistic deals de�ned as
those with positive bidder and target combined wealth e¤ect (CAR (-5,+2)). In addition, we require
that waves are relatively unexpected, which we de�ne as those that involve a surprise bid in at least
half of the (3-SIC) subsectors within the industry. In subsequent analysis we consider variation by
degree of anticipation and robustness to including relatively anticipated waves and to a variety of
alternative de�nitions of what constitutes a synergistic wave. Coe¢ cients are reported as marginal
e¤ects calculated at the means of independent variables. Statistical signi�cance is evaluated using
robust standard errors clustered at the �rm level, which are reported in parentheses.
For the sake of comparison with the previous literature, Column (1) of Table 2 reports results
for a pooled regression across all industry-years - i.e., both wave and non-wave ones - which is the
standard approach in the literature. The estimates show that the likelihood of receiving a takeover
bid is signi�cantly lower for �rms with a classi�ed board of directors (t-statistic=2.6). The magnitude
of the marginal e¤ect implies that �rms with classi�ed boards are about 1.3% less likely to receive
a bid in a particular year relative to �rms with a single class of directors, which is in line with
18
previous estimates (e.g., Bates, Becher, and Lemmon (2008)). Estimated coe¢ cients for the �rm
controls are also as expected, with smaller and relatively underperforming �rms more likely to become
takeover targets (e.g., Morck, Shleifer, and Vishny (1988), Comment and Schwert (1995)). Overall,
considering that the unconditional likelihood of receiving a bid for �rms in the sample is about 5%,
these results con�rm the standard �nding in the literature that the deterrence e¤ect of classi�ed board
is economically signi�cant, on average, but small compared to the large valuation e¤ects of classi�ed
boards documented in the governance literature.
Columns (2) and (3) of Table 2 report the main �nding of our study. We estimate equation
(1) separately in the two sub-samples of industry-year observations. Column (2) reports results for
industry-years that include ("On") synergistic industry merger waves, while Column (3) shows results
for all other industry-years ("O¤" wave). The results in Column (2) show that the coe¢ cient estimate
of the classi�ed board indicator is strongly statistically signi�cant on the wave (t-statistic=3.1). The
marginal e¤ect is quite striking and implies that �rms with classi�ed boards are about 7.5% less likely
to receive a bid in a particular wave industry-year relative to comparable �rms with a single class of
directors, which is an economically large magnitude considering that the unconditional likelihood of
receiving a bid is about 6% on the wave. By contrast, the coe¢ cient estimate of the classi�ed board
indicator o¤ the wave (Column (3)) is an order of magnitude smaller and is not statistically signi�cant
(t-statistic=0.5). These estimates suggest that board classi�cation represents an economically signif-
icant takeover deterrent in years when synergistic industry merger activity is at its peak level, which
is consistent with our Prediction 1.
In order to gauge economic signi�cance of these results, the bottom panel of Table 2 displays implied
takeover likelihoods for �rms with and without classi�ed boards, again for industry-years that include
(Column (2)) and those that exclude (Column (3)) synergistic industry merger waves. Two features
are noteworthy. First, looking at Column (2), the likelihood that �rms with a single class of directors
receive a takeover bid on the wave is 10.5%, which is more than three times as large as the likelihood
that �rms with classi�ed boards become takeover targets (3%). Second, the comparison of Column 2
19
and Column 3 shows that takeover odds of �rms with a single class of directors display signi�cant time
variation. In fact, they more than triple on the wave compared to o¤-the-wave years. By contrast,
takeover odds of �rms with classi�ed boards are relatively �at across the two sub-samples at around
3%. Putting these two observations together suggests that the classi�ed board provision represents an
economically signi�cant impediment to potentially value-increasing merger opportunities that arise at
times when industries undergo synergistic merger waves.
Columns (4) and (5) of Table 2 show additional results for industry-years that are on the wave.
The results in Column(4) show that our estimates for on the wave industry-years are only a bit
smaller when we de�ne waves based on a 24-month, rather than one-year, window. The results in
Column (5) take a closer look at time-variation by adding four subsequent years to each synergy wave
industry-year and adding to our baseline speci�cation an interaction term between classi�ed board
and the number of years since the wave. The coe¢ cient estimate on the interaction term is positive
and statistically signi�cant (t-statistic=2.6), suggesting that the relation between classi�ed boards and
takeover likelihood is strong in the initial wave years and becomes signi�cantly weaker as activity
subsides in the years subsequent to the wave. Based on our estimates, on average the relation weakens
by a bit less than 2% per year and, thus, becomes muted by the fourth year after the wave. These
results indicate that there is pronounced time-series variation in the relation between classi�ed boards
and takeover likelihood.
Finally, Columns (6) and (7) of Table 2 show additional results for o¤-the-wave industry-years.
In particular, we further sub-divide o¤-the-wave observations between those when M&A activity is
high but non-synergistic, and those when overall industry M&A activity - both synergistic and non-
synergistic - is low, respectively. The results in Column (6) show that our main result is not driven
by high overall M&A activity in the industry. In non-synergistic industry waves, the coe¢ cient on
classi�ed board is small, positive, and not statistically signi�cant. This result is consistent with existing
theory and evidence on non-synergistic waves driven by over-valuation (e.g., Rhodes-Kropf, Robinson,
and Viswanathan (2005), Shleifer and Vishny (2003)), which show that the usual con�ict of interest
20
reverses in waves driven by misvaluation, since passing on merger opportunities might actually be in
the interest of target shareholders, but not of target management who might want to take advantage
of their overvalued stock. In industry-years of low M&A activity (Column (7)), the relation between
classi�ed board and takeover likelihood is weakly negative and not statistically signi�cant. These
results indicate that our main �nding for industry-years that are o¤ synergistic waves (Column (3))
holds for both low activity industry-years and those with high M&A activity that is not synergistic.
In summary, the results in Table 2 show that the answer to the question of whether there is an
economically signi�cant relation between a �rm�s classi�ed board and its likelihood of becoming the
target of a takeover bid depends crucially on whether industries are undergoing synergistic merger
waves. In these wave industry-years, �rms with a single class of directors are more than three times
as likely to become takeover targets as �rms with classi�ed boards. As synergistic merger activity
subsides, the gap in takeover likelihood between these two types of �rms narrows. Finally, the gap is
not statistically signi�cant in o¤-wave years, irrespective of whether overall activity is low or there is
non-synergistic activity. Overall, this �rst set of results suggest that while classi�ed boards entrench
management at times when shareholders could bene�t the most from synergistic merger opportunities
in the industry, these provisions do not appear to play a signi�cant role once synergistic industry M&A
activity subsides.
Anticipation Table 3 presents results on variation by the degree to which industry merger waves
are unanticipated, or �surprise waves.�Based on Prediction 2, we expect to see larger e¤ects for surprise
waves since acquirers are less likely to be "snatching up" unprotected targets in advance of the time
when synergistic merger activity peaks in the industry. The full set of �rm and industry controls
� size, market-to-book, and sales growth, as well as industry concentration and high tech status -
and year and industry e¤ects are included in the estimation, but since there is little change from the
coe¢ cients presented in Table 2, �rm controls are omitted in this table and the subsequent ones for
brevity. All speci�cations are for industries that undergo a synergy wave in any given year, which are
21
de�ned as those for which the number of synergistic deals in that year is one standard deviation above
the industry time-series median, with industries de�ned as in Fama and French (1997) and synergistic
deals de�ned as those with positive bidder and target combined wealth e¤ect (CAR (-5,+2)). In the
panel to the left (Columns (1)-(4)), we include waves with a smaller degree of surprise than those in
Table 2 (share of subsectors with a surprise bid in the top three quartiles), while in the panel to the
right (Columns (5)-(8)) we consider waves with a higher degree of surprise (share of subsectors with
a surprise bid in the top quartile). Surprise bid is de�ned as in Table 2. Coe¢ cients are reported as
marginal e¤ects calculated at the means of independent variables. Robust standard errors clustered
at the �rm level are in parentheses.
The estimates in Columns (2) and (6) of Table 3 show that the negative relation between classi�ed
board and takeover likelihood is stronger for waves with a higher degree of surprise. In industry-years
that include more anticipated waves, the estimate for classi�ed board in Column (2) implies a di¤erence
in takeover likelihood between �rms with classi�ed boards and those with a single class of directors
of about 6%, which is both statistically and economically signi�cant, but lower than its counterpart
in Table 2. By contrast, in industry-years that are in the top quartile of surprise wave, the estimated
coe¢ cient on the classi�ed board indicator in Column (6) implies that �rms with classi�ed boards are
about 10% less likely to receive a bid relative to �rms with a single class of directors. In addition,
their implied takeover likelihood is only about 1%. These results are con�rmed by the estimates in
Columns (4) and (8) that add four years subsequent to each wave and consider the richer speci�cation
with an interaction term between classi�ed board and years since the onset of the wave. Finally, the
estimates in Columns (3) and (7), show that the degree of anticipation of industry merger activity is
not a signi�cant factor o¤ the wave, since the estimated coe¢ cients for the classi�ed board indicator
remain not statistically signi�cant and are stable across samples.
Overall, the evidence in Table 3 suggests that the degree to which synergistic industry merger waves
are unanticipated signi�cantly reinforces the negative relation between classi�ed board and takeover
likelihood on such waves. This cross-sectional feature of the empirical relation between classi�ed board
22
and takeover likelihood is consistent with Prediction 2 and supports the agency interpretation that
classi�ed boards protect target managers from the arrival of synergistic merger opportunities in the
industry.
4.2 Classi�ed boards and industry shocks
In this subsection, we provide additional evidence that there is a large entrenchment e¤ect of classi�ed
board at times when synergistic merger opportunities arise in the industry. Rather than relying on
the intensity of synergistic M&A activity in the industry to identify these industry-years, we take
a complementary approach. Tables 4 and 5 present results on changes in the entrenchment power
of classi�ed boards in response to several industry shocks that are well-recognized to drive economic
motives to merge in the industry, including economic (Harford (2005)), technological (Andrade et
al. (2001)), and regulatory shocks. If classi�ed boards protect target managers from the arrival of
synergistic merger opportunities in the industry, then whenever industries are hit by shocks that create
such merger opportunities we would expect to see a signi�cantly larger increase in takeover likelihood
for �rms with a single class of directors. Consequently, the di¤erence in the takeover likelihood of
�rms that have classi�ed boards and those that do not should widen in response to industry shocks
(Prediction 3). This gap should further widen in years with higher macroeconomic liquidity. Finally,
we verify that our �nding on industry merger waves continues to hold in a simultaneous equation
setting that treats industry merger waves as endogenously arising in response to industry shocks.
Table 4 presents our evidence on the relation between industry shocks and takeover likelihood for
�rms with classi�ed boards and those with a single class of directors. We estimate probit regression (1)
in a �ve-year window subsequent to an industry shock, with the dependent variable equal to one if a
�rm receives a takeover bid in a given year and the full set of �rm and industry controls, as well as year
and industry e¤ects included (coe¢ cients omitted for brevity). Columns (1), (2), and (3) report results
for three sets of shocks (done iteratively), which are de�ned as industry-years subsequent to a large
(upper quartile of industry time-series) change in economic, technological and regulatory fundamentals.
23
Columns (5), (6), and (7) report results for non-shocked industry-years. Columns (1) and (5) report
results for the economic shock factor, Columns (2) and (6) report results for technological shocks, and
Columns (3) and (7) report results for regulatory shocks. Industries are as in Fama and French (1997)
and industry-years are included if they are de�ned as surprise in Table 2. Reported coe¢ cients are
marginal e¤ects and robust standard errors clustered at the �rm level are in parentheses.
The estimates in Table 4 show that there is an economically signi�cant relation between classi�ed
boards and takeover likelihood in years when industries are hit by economic, technological, and reg-
ulatory shocks. Depending on which particular shock is considered, the estimates for the classi�ed
board indicator in Columns (1)-(3) imply that the takeover likelihood of �rms with classi�ed boards
is between 6% and 8% lower than �rms with a single class of directors in the year subsequent to an
industry shock. This gap signi�cantly narrows as more years elapse since the industry shock.
Notably, the largest gap in takeover odds between �rms with classi�ed boards and those with a
single class of directors is in response to regulatory shocks. In the �rst year subsequent to these shocks,
�rms with a single class of directors are almost seven times as likely to receive a takeover bid than
�rms with classi�ed boards. By contrast, Columns (5)-(7) of Table 4 show that the relation between
classi�ed board and takeover likelihood is weak and mostly statistically insigni�cant in industries that
are not hit by shocks.
In order to provide more perspective on economic signi�cance of our �ndings, the two rows at the
bottom of Table 4 show that the implied takeover likelihood of �rms with a single class of directors
doubles or triples upon impact of industry shocks, going from as little as 3.6% to as much as 9.4%.
However, takeover likelihood of �rms with classi�ed boards is relatively insensitive to these shocks,
hovering between 1.4% and 2,7%. Overall, these results show that merger opportunities created by
industry shocks accrue disproportionately to �rms with a single class of directors. As such, this evi-
dence suggests that classi�ed boards constitute a signi�cant impediment to potentially value-enhancing
merger opportunities created by changes in industry fundamentals.
As industry-wide economic, technological, and regulatory shocks are unlikely to be a¤ected by
24
�rm-level antitakeover provisions, we can use the industry shocks as instruments and treat synergis-
tic industry merger waves in Table 2 as an endogenous variable. Instead of using the de�nition of
synergistic waves of Table 2, we now run a �rst-stage probit regression analogous to Harford (2005),
with the dependent variable taking value of one in any given year when the number of deals is one
standard deviation above the industry time-series median. We then consider synergistic those wave
industry-years that are predicted by our three industry shocks. The estimates reported in Columns
(4) and (8) for shocked and non-shocked industries, respectively, con�rm our main �nding in Table 2,
that there is a strong negative relation between classi�ed boards and takeover likelihood only in wave
industry-years.
The results in Table 5 show that macroeconomic liquidity reinforces industry shocks in magnifying
the entrenchment e¤ect of classi�ed boards. The table replicates the analysis on the sample of shocked
industry-years in Table 4 by sub-splitting these industry-years depending on whether macroeconomic
liquidity is high (Columns (1)-(4)) or low (Columns (5)-(8)). Liquidity is considered to be high in
industry-years when the spread between the average interest rate on commercial and industrial (C&I)
loans and the Federal Funds rate is low (below its time-series median) and the industry M/B ratio
is above its time-series median, and low otherwise. The intuition behind this test is based on the
evidence in Harford (2005), who shows that industry shocks are more likely to translate into a wave if
macroeconomic liquidity is high. Based on this intuition, we expect to see a larger wedge between the
takeover odds of �rms with classi�ed boards and those of �rms with a single class of directors whenever
industry shocks are accompanied by high macroeconomic liquidity.
Consistent with this intuition and irrespective of which industry shock is considered, the estimates
for the classi�ed board indicator in Columns (1)-(3) of Table 5 imply that the di¤erence in takeover
likelihood between �rms with classi�ed boards and those with a single class of directors is even larger
when industry shocks hit at times of high liquidity. In these high-liquidity industry years, industry
shocks lead to an average di¤erence in takeover likelihood of up to 10.7%, which signi�cantly declines
as time elapses since the shocks. In addition, the two bottom rows of the table show that, in high-
25
liquidity industry-years, implied takeover likelihood is as large as 11.7% for �rms with a single class
of directors and as low as 0.5% for �rms with classi�ed boards. These results stand in contrast to
those for industry-years with low liquidity, when the classi�ed board indicator remains statistically
signi�cant, but is much smaller in magnitude.
In summary, the evidence in Tables 4 and 5 suggests that economic, technological, and regulatory
industry shocks signi�cantly reinforce the negative relation between classi�ed board and takeover
likelihood. Consistent with Prediction 3, this evidence supports the agency interpretation that classi�ed
boards insulate managers of potential targets from industry- and economy-wide shocks that create
opportunities for value enhancing mergers in the industry.
4.3 Other antitakeover provisions
In this sub-section we examine the argument that is often made in the governance literature (e.g.,
Bebchuk, Cohen, and Ferrell (2009)) that the power of classi�ed boards as a takeover deterrent is
strengthened when combined with other ATPs. In fact, while previous studies �nd that other ATPs,
such as poison pills or state anti-takeover status, are on average more weakly related to takeover
likelihood than classi�ed boards, there is to date limited evidence on whether these other provisions
strengthen the deterrence e¤ect of classi�ed boards.
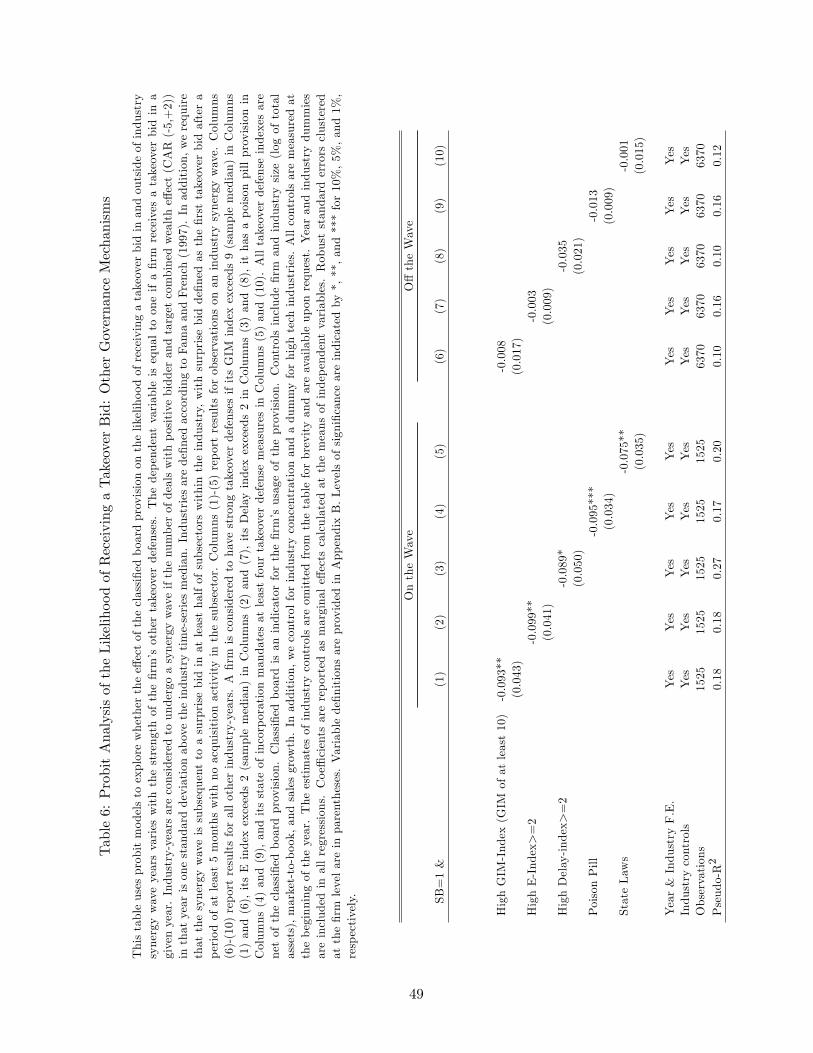
Table 6 explores this conjecture. We use the same probit speci�cation as the takeover likelihood
regression in Columns (2) and (3) of Table 2. Columns (1)-(5) report results for industry-years on
synergy waves. Columns (6)-(10) report results for all other industry-years. The main explanatory
variable is an indicator that takes value of one for �rms that have both a classi�ed board of directors
and, done iteratively, a high level of protection based on three indices of ATPs that are commonly
employed in the governance literature or two other types of ATPs that have been the focus of previous
studies: Columns (1) and (6) show results for the dummy of classi�ed board combine with a value
of the GIM index of Gompers, Ishii, and Metrick (2003) exceeding 9 provisions (sample median);
Columns (2) and (7) refer to the combination with a value of the E index of Bebchuk and Cohen
26
(2003) exceeding 2 provision (sample median); Columns (3) and (8) consider values of the Delay index
used in Gompers, Ishii, and Metrick (2003) and Kadyrzhanova and Rhodes-Kropf (2010) exceeding 2
provisions; all indices are net of classi�ed board. Finally, classi�ed board combined with the poison pill
provision, which has been widely studies starting with Comment and Schwert (1995), is in Columns
(4) and (9), and with states of incorporation with at least four takeover statues in Columns (5) and
(10). Coe¢ cients are reported as marginal e¤ects calculated at the means of independent variables
and robust standard errors clustered at the �rm level are in parentheses.
In wave industry-years, the estimates for classi�ed board combined with other ATPs (Columns (1)
through (5)) are higher than the ones for the classi�ed board indicator in Column (2) of Table 2, a
result that holds robustly across di¤erent sets of provisions. For example, the coe¢ cient estimate of
the indicator for classi�ed board combined with a high level of protection based on the GIM index is
strongly statistically signi�cant on the wave (t-statistic=2.2). The marginal e¤ect implies that �rms
with classi�ed boards and high GIM index are about 9.3% less likely to receive a bid in a particular
wave industry-year relative to comparable �rms with a single class of directors and low GIM index,
which is an economically large magnitude considering that the unconditional likelihood of receiving a
bid is about 6% on the wave. Notably, only state antitakeover statutes do not appear to signi�cantly
enhance the deterrence e¤ect of classi�ed boards, which is consistent with these state-level provisions
being substitutes, rather than complements, of �rm-level ones. By contrast to the results on the wave,
the coe¢ cient estimates of the indicator variable for classi�ed board combined with other ATPs o¤
the wave (Columns (6)-(10)) remain small and not statistically signi�cant (t-statistic=0.1 for the GIM
index). Although not statistically signi�cant, only the combination with delay provisions appears to
increase the deterrence e¤ect of classi�ed board even o¤ the wave, a result which is consistent with the
evidence in Kadyrzhanova and Rhodes-Kropf (2011) that classi�ed board and delay provisions have a
stronger relation with outcomes in the takeover market than any other ATPs. Overall, the estimates in
Table 6 suggest that board classi�cation when combined with other ATPs represents an even stronger
takeover deterrent in years when synergistic industry merger activity is at its peak level.
27
4.4 Robustness
Table 7 reports results of �ve sets of robustness checks for our baseline estimates. We estimate the
same probit regression (1) that a �rm receives a takeover bid as in Table 2, and include the full set of
�rm and industry controls �size, market-to-book, and sales growth, as well as industry concentration
and high tech status - and year and industry e¤ects are included in the estimation. Columns (1)-(3)
report results for observations on an industry synergy wave. Columns (4)-(6) report results for all other
industry-years. All speci�cations add observations for four subsequent years to each industry-year and
allow for the e¤ect of the classi�ed board provision on takeover likelihood to vary with the number of
years since the most recent industry synergy wave, which is the same speci�cation as in Column (5) of
Table 2. Coe¢ cients are reported as marginal e¤ects and robust standard errors clustered at the �rm
level are in parentheses.
First, Rows [1], [2], and [3] show that the result is robust to using di¤erent de�nitions of synergistic
merger activity and relaxing the requirement that waves are unanticipated. In particular, Row [1] shows
that our baseline estimates are little changed when we de�ne as synergistic activity those industry-
years in which the number of all-cash deals is one standard deviation above industry time-series median.
Based on the arguments in Harford (2005), all cash deals are less likely to be subject to over-valuation
issues. The estimates on the wave remain large when we consider an even weaker de�nition of synergistic
activity that only excludes all stock deals (Row [2]). Finally, when we relax the requirement that
synergy waves are relatively unanticipated and include all such waves, Row [3] shows that the magnitude
of the estimated coe¢ cient on the classi�ed board indicator is lower, which is consistent with the results
in Table 3, but our main result that there is a signi�cant negative relation between classi�ed boards
and takeover likelihood only on the wave continues to hold.
Second, Rows [4] and [5] show that our results are robust to using di¤erent de�nitions of the industry
merger wave indicator. In particular, Row [4] shows that our result of a signi�cant negative relation
between classi�ed board and takeover likelihood continues to hold even under the milder de�nition of
wave based on industry merger activity above time-series median. Row [5] shows that the result is
28
actually much stronger when we use a more narrow de�nition of wave based on activity above time-
series median plus two standard deviations. This set of robustness checks further corroborates our
interpretation of the result that classi�ed boards allow managers to sit merger waves out, and, thus,
�rms with a single class of directors bene�ts disproportionately more of the merger opportunities that
arise in an industry wave.
Third, Row [6] shows that our result is robust to using a �ner industry classi�cation based on the
three-digit SIC level, rather than the one based on Fama and French (1997). Fourth, Rows [7] and [8]
show robustness to using a more general speci�cation that adds interaction terms between classi�ed
board and industry controls. This robustness check addresses the concern that these industry controls
may be signi�cantly di¤erent on and o¤ the wave and, thus, a failure to control for their interaction with
classi�ed boards may be driving our results. We consider two versions of this more general speci�cation,
one that includes the interaction of the classi�ed board with industry concentration (Row [7]) and one
that include interactions of classi�ed board with all industry controls (Row [8]). These two sets of
robustness checks suggest that our result is not driven by any particular choice of industry aggregation
nor by the failure to control for potential heterogeneity in the e¤ect of classi�ed board across industries
with di¤erent levels of concentration or other industry controls.
Fourth, Row [9] shows robustness to treating classi�ed board as an endogenous variable. We use an
instrumental variable approach. For an instrument to be valid, it should not directly a¤ect takeover
likelihood, and should be a signi�cant determinant of classi�ed board. Based on Bates, Becher, and
Lemmon (2008), we instrument for board classi�cation using board size, since �rms with large boards of
directors are more likely to have a classi�ed board, but board size is not otherwise obviously related to
takeover likelihood.12 The �rst-stage F-tests reject the null that the instruments are jointly insigni�cant
in the �rst-stage regressions and our speci�cation passes the Sargan overidenti�cation test, suggesting
that our instruments are valid and relevant. The coe¢ cient estimates for the second-stage are close
12Since the IRRC database, our main data source for board size, contains information starting from 1996, we retrieveall missing �rm information from Compact Disclosure database.
29
to the OLS estimates reported in Table 2, which suggests that potential endogeneity concerns with
classi�ed board are unlikely to be driving our baseline estimates.
Finally, it is possible that shareholders of �rms with a classi�ed board may still bene�t from the
arrival of industry synergies if such �rms are more likely to become acquirers, rather than targets.
Row [10] shows that this is not the case and board classi�cation is not signi�cantly associated with a
greater likelihood of making a takeover bid during synergistic merger waves. Combined with our main
estimates on the likelihood of receiving a takeover bid in Table 2, these results suggest that managers
of �rms with classi�ed boards tend to stay out of the heightened takeover activity during industry
merger waves, thereby reducing the opportunities for the �rms�shareholders to bene�t from synergies
that arise in an industry wave.
5 Duration analysis of the likelihood of receiving a takeover bid
In this section we present additional evidence consistent with the notion that classi�ed boards allows
managers to sit out industry merger waves. We do so by analyzing the timing of takeover bids within
industry merger waves. Since our baseline probit regressions do not take into account the timing of the
takeover bids, we need to examine our data in dynamic duration framework that explicitly takes into
account the fact that takeover bids are received by di¤erent targets at earlier or later stages of each
wave spell. Within each industry merger wave spell, if acquirers start out with "snatching up" targets
that have a single class of directors, then those �rms with classi�ed boards that do receive takeover
bids should do so with a signi�cant lag or delay with respect to the other �rms in the industry.
Columns (1) to (3) of Table 8 present the results of a Cox proportional hazard model, which is a
parsimonious semiparametric model and a common choice for modeling duration.13 In this duration
framework, the dependent variable is time-to-takeover, which measures the time (number of months)
between the initial surprise bid in the industry and the time when any given �rm becomes the target
13For robustness, we also used a fully parametric Weibull model and obtained similar results (avaliable upon request).
30
of a takeover bid.14 All de�nitions, including industry classi�cations and synergy waves, are as in
Table 2, to which we refer the reader for details. The full set of �rm and industry controls � size,
market-to-book, and sales growth, as well as industry concentration and high tech status - and year
and industry e¤ects are included in the estimation. Column (1) reports results for all �rms. Columns
(2) and (3) report results for observations on and o¤ a synergistic industry merger wave, respectively.
Robust standard errors clustered at the �rm level are in parentheses.
The estimates of the timing of any given takeover bid in the industry as a function of targets�
classi�ed board in Columns (1) to (3) of Table 8 show that classi�ed board is associated with a
signi�cant decrease in the hazard of receiving a takeover bid, but only in years when industries are
undergoing synergistic merger waves. For these industry-years, the hazard ratio in Column (2) is
around 66%, indicating that classi�ed board reduces the conditional likelihood that a �rm receives a
takeover bid in any given month by about 1/3. By contrast, the relation between classi�ed board and
takeover hazards is much weaker and not statistically signi�cant in either the entire sample (Column
(1)) or in o¤-the-wave industry-years. These results suggest that �rms with classi�ed boards become
takeover targets at signi�cantly later stages of industry merger waves.
Columns (4) to (6) of Table 8 o¤ers a complementary perspective on the timing of receiving a
takeover bid by replicating the hazard analysis using OLS regressions of the time-to-takeover, where
the dependent variable is the number of months it takes for any given �rm to receive a takeover bid.
Column (4) reports results for all �rms, while Columns (5) and (6) report results for observations
on and o¤ a synergistic industry merger wave, respectively. For wave industry-years, the estimates
in Column (5) show that there is a signi�cant positive relation between classi�ed board and a �rm�s
time-to-takeover, which is highly statistically signi�cant (t-statistic=3.1). Our estimates imply that
classi�ed boards increase the average time it takes for a �rm to receive a takeover bid by about 10
14Formally, we estimate a Cox proportional hazard model: hi(t)�Pr(�rm i in industry k receives a takeover o¤er intime t j �rm i has not received a takeover o¤er before time t) = h0(t)exp�IPCBijt+ Xijt+�j+�t+"jt : The model allowsthe baseline hazard to vary nonparametrically over time. Panel A of Table 7 reports the coe¢ cients �̂ (coe¢ cients oncontrols are suppressed and available upon request). Corresponding estimate of hazard ratio (relative risk) of takeover isexp�̂ , which is reported in square brackets. A value of 1 for the hazard ratio indicates that the variable neither raises norlowers the expected hazard rate.
31
months with respect to �rms with a single class of directors. In line with the results of the duration
analysis, Column (6) con�rm that the relation between classi�ed board and time-to-takeover is much
weaker and not statistically signi�cant o¤ the wave.
In summary, our duration estimates suggest that, on average, classi�ed boards lengthen by almost
a years the time it takes for any given �rm to receive a takeover bid in industries that are undergoing
synergistic merger waves. This evidence further supports an agency interpretation since it shows that
�rms with a single class of directors are quicker to take advantage of potential synergies that become
available at the earlier stages of industry merger waves.
6 Is sitting out waves costly for shareholders? Analysis of target and
bidder wealth e¤ect of takeover bids
In this section we explore whether there is a bargaining e¤ect of classi�ed boards in industries that
are undergoing synergistic merger waves. It is well-understood that classi�ed boards may improve
target management�s bargaining position vis-a-vis acquirers, thus enabling target �rms to extract
takeover premiums (for example, Stulz (1988) argues that takeover defenses lead to higher target
premiums by allowing management to fend o¤ opportunistic o¤ers). Thus, a potential concern with
an agency interpretation of our main result is that the bene�ts shareholders may derive through a
bargaining channel may mitigate the losses from deterrence (Schwert (2000) �nds a positive although
weak relation between poison pill provisions and target premiums; Bates, Becher, and Lemmon (2008)
show evidence that classi�ed board negatively a¤ects bidder returns).15 In addition, since the agency
perspective holds that classi�ed boards are a source of entrenchment costs for shareholders, we need
to assess target shareholder wealth in order to answer the important economic question of whether our
documented entrenchment e¤ect of classi�ed boards is indeed costly for shareholders.
The analysis in Table 9 addresses these issues by estimating changes in target and bidder share-
15See also Comment and Schwert (1995) and Ryngaert (1988). Bhagat and Romano (2002) is a survey.
32
holder wealth at the announcement of a takeover bid. We use OLS regressions with the dependent
variable given by the cumulative abnormal return to target shareholders (Columns (1)-(3)) or bidder
shareholders (Columns (4)-(6)) for trading days (-2, +2) relative to the date of the takeover bid an-
nouncement. CARs are calculated using standard event study methodology (see MacKinlay (1997) for
a detailed review) relative to the market model. All de�nitions, including industry classi�cations and
synergy waves, are as in Table 2, to which we refer the reader for details. The full set of �rm and
industry controls �size, market-to-book, and sales growth, as well as industry concentration and high
tech status - and year and industry e¤ects are included in the estimation. In addition, we include con-
trols for deal characteristics, including an indicator variable that takes the value of one if the method
of payment includes bidder�s equity, an indicator variable that takes the value of one if the deal is
completed, and an indicator variable that takes the value of one if the bid is in the form of a tender
o¤er. Robust standard errors clustered at the �rm level are in parentheses.
Columns (1) to (3) of Table 9 summarize regressions of target announcement period returns. Col-
umn (1) reports results for all industry-years. Columns (2) and (3) report results for industry-years on
and o¤ a synergistic merger wave, respectively. Both on and o¤ the wave, the coe¢ cients associated
with target classi�ed board are small and not signi�cantly di¤erent from zero. In the overall sample,
there is a positive but not statistically signi�cant relation between target shareholder CARs and target
classi�ed board. In addition, target announcement CARs are higher for completed deals and tender
o¤ers and are negatively correlated with target �rm size and equity bids. All these results for the
overall sample are consistent with previous studies. Overall, the evidence on the link between target
shareholder wealth and target classi�ed board is rather weak and is not signi�cantly strengthened by
separating out on and o¤ the wave industry-years.
Columns (4) to (6) of Table 9 consider the determinants of announcement period bidder CARs.
Results in Column (4) are for all industry-years, while those in Columns (5) and (6) are for industry-
years on and o¤ a synergistic merger wave, respectively. On the wave, the coe¢ cient of target classi�ed
board is negative, but small and not signi�cantly di¤erent from zero. The coe¢ cient is more negative
33
and, instead, statistically signi�cant o¤ the wave (t-statistic=2.1). In the overall sample, there is a
negative and statistically signi�cant relation between bidder shareholder CARs and target classi�ed
board (t-statistic=3.3). In addition, bidder announcement returns are signi�cantly lower for equity
bids and for larger bidder �rms. These results for the overall sample are all consistent with previous
studies. For example, Bates, Becher, and Lemmon (2008) also �nd evidence of a negative relation
between bidder CARs and target classi�ed board. Overall, the evidence is consistent with bidders
giving up some of the total surplus when negotiating with targets that have a classi�ed board of
directors, which is consistent with a bargaining story. However, the bargaining e¤ect is only signi�cant
in o¤ the wave industry-years and, thus, it is unlikely to counter the deterrence e¤ect of classi�ed
boards in industry-years that are on the wave.
Overall, the evidence in Table 9 shows that potential bargaining bene�ts from classi�ed boards are
unlikely to o¤set their entrenchment costs in years when industries are undergoing synergistic merger
waves. The results should not be interpreted as indicating that there is no evidence of a bargaining
e¤ect of classi�ed board. Rather, our evidence indicates that the relation between classi�ed boards
and target and bidder CARs better �ts a bargaining story in industry-years that are o¤ the wave.
Thus, we conclude that classi�ed boards are a likely source of entrenchment costs for shareholders of
�rms that end up sitting out industry merger waves.
7 Conclusion
This paper shows that the deterrence e¤ect of classi�ed board clusters through time by industry. In
particular, we �nd a signi�cant deterrence e¤ect in years when industries are undergoing a synergistic
merger wave. Our main �nding is that, while the di¤erence in takeover likelihood between �rms with
and without a classi�ed board is small on average, in years when industries undergo synergistic merger
waves this di¤erence is large and statistically signi�cant. In particular, in these industry-years, �rms
with a single class of directors are more than three times as likely to receive a takeover bid compared
34
to �rms with classi�ed boards (10.5% vs 3%, respectively). This wedge is robust across a battery of
di¤erent speci�cations, to using several di¤erent de�nitions of what constitutes an industry merger
wave and synergistic M&A activity, and to treating classi�ed board as an endogenous variable.
Overall, our analysis suggests that takeover bid deterrence can potentially explain a large fraction
of the di¤erence in �rm value between �rms with and without classi�ed boards. The mechanism we
highlight is novel to the literature: antitakeover provisions such as a classi�ed board allow managers
to sit out industry merger waves and as a result shareholders lose out on opportunities to bene�t from
takeover premiums in merger waves when most synergies occur. Our main result implies that the
e¤ect of classi�ed board on �rm value should vary signi�cantly over time with merger activity in the
industry. Consistent with this implication, Cremers and Ferrell (2011) �nd that the value di¤erence
between �rms with and without antitakeover provisions is time-varying and concentrated in periods
with high industry M&A activity. Our results provide strong support for the �ndings in Cremers
and Ferrell (2011) by documenting direct evidence from the takeover market on time-variation in the
bid deterrence e¤ect of classi�ed boards. As such, our �ndings broaden the classical agency view by
highlighting that industry shocks and, in general, industry-wide factors that drive economic motives
to merge exacerbate managerial entrenchment costs for shareholders.
35
References
[1] Andrade, Gregor, Mark Mitchell, and Erik Sta¤ord, 2001, "New evidence and perspectives onmergers," Journal of Economic Perspectives 15, 103�120.
[2] Bates, Thomas W., David Becher, and Michael L. Lemmon, 2008, "Board classi�cation andmanagerial entrenchment: Evidence from the market for corporate control," Journal of FinancialEconomics 87, 656-677.
[3] Bebchuk, Lucian A., John C. Coates IV and Guhan Subramanian, 2002, �The Powerful An-titakeover Force of Staggered Boards: Theory, Evidence & Policy�, Stanford Law Review, 54,887-951
[4] Bebchuk, Lucian A. and Alma Cohen, 2003, �Firms�Decisions Where to Incorporate,�Journal ofLaw and Economics, 46, 383-425.
[5] Bebchuk, Lucian A. and Alma Cohen, 2005, �The Costs of Entrenched Boards,� Journal of Fi-nancial Economics, 78, 409-433.
[6] Bebchuk, Lucian A., Alma Cohen, and Allen Ferrell, 2009, �What Matters in Corporate Gover-nance?�Review of Financial Studies, 22 (2), 783-827
[7] Betton, Sandra, B. Espen Eckbo, and Karin S. Thorburn, 2008, "Corporate Takeovers," in Hand-book of Empirical Corporate Finance, Volume 2, Edited by B.E. Eckbo, Elsevier.
[8] Bhagat, Sanjai, and Roberta Romano, 2002, "Event Studies and the Law: Part II: EmpiricalStudies of Corporate Law," American Law and Economics Review, 4(380)
[9] Bradley, Michael, Anand Desai, and E. Han Kim , 1988, �Synergistic Gains From CorporateAcquisitions And Their Division Between the Stockholders Of Target and Acquiring Firms,�Journal of Financial Economics 21, 3-40.
[10] Comment, Robert and William G. Schwert, 1995, "Poison or placebo? Evidence on the deterrenceand wealth e¤ects of modern antitakeover measures," Journal of Financial Economics 39, 3�43.
[11] Cremers, Martijn K.J. and Allen Ferrell, 2011, "Thirty Years of Shareholder Rights and FirmValuation," mimeo, Yale University.
[12] Cremers, Martijn K.J. and Vinay B. Nair, 2005, "Governance Mechanisms and Equity Prices,"Journal of Finance, 60 (6), 2859-2894
[13] Daines, Robert and Michael Klausner, �Do IPO Charters Maximize Firm Value? AntitakeoverProtection in IPOs,�Journal of Law, Economics, and Organization, XVII (2001), 83-120
[14] DeAngelo, Harry and Edward M. Rice, 1983, "Anti-takeover charter amendments and stockholderwealth," Journal of Financial Economics 11, 329�360.
[15] Eckbo, B. Espen, 1983, "Horizontal Mergers, Collusion, and Stockholder Wealth," Journal ofFinancial Economics 11, 241-273.
[16] Eckbo, B. Espen, 1985, "Mergers and the market concentration doctrine: evidence from the capitalmarket," Journal of Business 58, 325�349.
36
[17] Eckbo, B. Espen, 1992, "Mergers and the value of antitrust deterrence," Journal of Finance 47,1005�1029.
[24] Holmstrom, Bengt and Steven Kaplan, 2001, "Corporate Governance and Merger Activity in theUnited States: Making Sense of the 1980s and 1990s," Journal of Economic Perspectives, 15(2),121-144.
[25] Jensen, Michael C., 1988, "Takeovers: Their Causes and Consequences," Journal of EconomicPerspectives 2, 21-48.
[26] Jensen, M., and Meckling, W., 1976, "Theory of the Firm: Managerial Behavior, Agency Costs,and Ownership Structure," Journal of Financial Economics 3, 305�360.
[27] Jensen, Michael C. and Richard S. Ruback, 1983, "The market for corporate control: the scienti�cevidence," Journal of Financial Economics 11, 5�50.
[28] Kadyrzhanova, Dalida and Matthew Rhodes-Kropf, 2011, "Concentrating on Governance," Jour-nal of Finance 66, 1649-1685.
[29] Kahle, Kathleen M. and Walkling, Ralph A., 1996, "The impact of industry classi�cations on�nancial research. Journal of Financial and Quantitative Analysis 31, 309�335.
[30] Karpo¤, Jonathan M. and Paul H. Malatesta, 1989, "The Wealth E¤ects of Second GenerationState Takeover Legislation," Journal of Financial Economics 25, 291-322
[31] Linn, Scott C., and John J. McConnell, 1983, �An empirical investigation of the impact of anti-takeover amendments on common stock prices�, Journal of Financial Economics 11, 361-399.
[32] Loughran, Tim and Jay R. Ritter, 2004, �Why has IPO Underpricing Changed Over Time?�Financial Management 33, 5-37.
[33] Maksimovic, Vojislav and Gordon M. Phillips, 2001, "The market for corporate assets: whoengages in mergers and asset sales and are there e¢ ciency gains?" Journal of Finance, 2019�2065.
[34] Malatesta, Paul, and Ralph A. Walkling, 1988, �Poison Pill Securities: Stockholder Wealth,Pro�tability, and Ownership Structure,�Journal of Financial Economics, 20, 347-376.
37
[35] Manne, Henry, 1965, �Mergers and the Market for Corporate Control,�Journal of Political Econ-omy, 73, 110.
[36] Masulis, Ronald W., Cong Wang, and Fei Xie, 2007, "Corporate Governance and Acquirer Re-turns," The Journal of Finance, 62(4), 1851�1889.
[37] Mikkelson, Wayne H. and M. Megan Partch, 1989, "Managers� Voting Rights and CorporateControl," The Journal of Financial Economics 25, 263-290.
[38] Mitchell, Mark and Harold Mulherin, 1996, "The impact of industry shocks on takeover andrestructuring activity," Journal of Financial Economics 41, 193�229.
[39] Morck, Randall, Andrei Shleifer, and Robert W. Vishny, 1988, �Management Ownership andMarket Valuation: An Empirical Analysis,�Journal of Financial Economics 20, 293-315.
[40] Palepu, Krishna G., 1986, "Predicting takeover targets: a methodological and empirical analysis,"Journal of Accounting and Economics 8, 3�37.
[41] Rhodes-Kropf, Matthew, David Robinson and S. Viswanathan, 2005, �Valuation Waves andMerger Activity: The Empirical Evidence,�Journal of Financial Economics, 77(3), 561-603.
[42] Ryngaert, Michael, 1988, "The e¤ect of poison pill securities on shareholder wealth," Journal ofFinancial Economics, 20, 377-417.
[43] Shahrur, Husayn, 2005, "Industry structure and horizontal takeovers: Analysis of wealth e¤ectson rivals, suppliers, and corporate customers,�Journal of Financial Economics, 76, pp.61�98.
[44] Scharfstein, David, 1988, �The Disciplinary Role of Takeovers,�The Review of Economic Studies,55(2), 185-199.
[45] Schwert, William G., 1996, "Markup pricing in mergers and acquisitions," Journal of FinancialEconomics 41, 153�192.
[46] Schwert, William G., 2000, "Hostility in takeovers: in the eyes of the beholder," Journal of Finance55, 2599�2640.
[47] Shleifer, Andrei, and Robert W. Vishny, 2003, �Stock Market Driven Acquisitions �, Journal ofFinancial Economics, 70(3), 295-311.
[48] Song, Moon H. and Ralph A. Walkling, 2000, "Abnormal returns to rivals of acquisition targets:a test of the �acquisition probability hypothesis�," Journal of Financial Economics 55, 143�171.
[49] Wooldridge, Je¤rey M., 2002. Econometric analysis of cross section and panel data (MIT Press,Cambridge, Mass.).
38
Appendix B. Variable De�nitions
The variables used in this paper are extracted from four major data sources: SDC Platinum, IRRC,
COMPUSTAT, and CRSP. For each data item, we indicate the relevant source in square brackets. The
speci�c variables used in the analysis are de�ned as follows:
� Governance [IRRC]:
�Classi�ed board is a dummy indicating that the �rm employs the governance feature.
�GIM-index is the sum of all antitakeover provisions in a �rm�s charter that varies between
0 and 24 (Gompers, Ishii, and Metrick (2003)).
�E-index is the sum of six provisions: staggered boards, limits to shareholder bylaw amend-
ments, limits to shareholder charter amendments, supermajority requirements for mergers,
poison pills, and golden parachutes (Bebchuk, Cohen, and Ferrell (2004)).
�Delay index is the sum of four provisions: blank check, special meeting, written consent,
and classi�ed board (Gompers, Ishii, and Metrick (2003)).
�Poison pill is a dummy indicating that the �rm employs the governance feature.
� State antitakeover provisions index is the sum of all antitakeover statutes in the �rm�s state
of incorporation. The index is from Bebchuk and Cohen (2003).
� Industry synergy waves: Industry-years are considered to undergo a synergy wave if the number
of deals with positive bidder and target combined wealth e¤ect (CAR (-5,+2)) in that year is
one standard deviation above the industry time-series median. Industries are de�ned according
to Fama and French (1997). In addition, we require that the synergy wave is subsequent to a
surprise bid in at least half of subsectors within the industry, with surprise bid de�ned as the
�rst takeover bid after a period of at least 5 months with no acquisition activity in the subsector.
� Industry economic shocks:
39
�Deregulation is a dummy indicating industry-years identi�ed as having undergone regulatory
changes due to either substantial (upper quartile of the sample distribution) import tari¤
reductions or a deregulatory event in the preceding year. The deregulatory events are from
Harford (2005). Import tari¤s by industry are from the NBER trade dataset.
�Capacity utilization is an index of industry-level capacity utilization from the Federal
Reserve�s monthly index of industrial production and capacity utilization. The monthly
data was averaged to obtain the annual industry-level capacity utilization value. For each
industry-year, we compute the absolute value of the change in capacity utilization over the
year (shock). We then rank (z-score) these capacity utilization shocks relative to the 10-year
time series of shock observations for the industry. An industry-year is considered to be on
the wave if it is in the upper quartile of the sample distribution of the capacity utilization
shock factor.
�Economic shock factor is de�ned as the �rst principal component of seven economic variables
in each industry-year as in Harford (2005): net income/sales (pro�tability), asset turnover,
R&D, capital expenditures, employee growth, ROA, and sales growth. For each of these
variables, we take the industry median of the absolute value of the change in the variable
over the year (shock). We then rank (z-score) each industry-year shock relative to the 10-
year time series of shock observations for the industry. An industry-year is considered to be
on the wave if it is in the upper quartile of the sample distribution of the economic shock
factor.
� Outcomes:
�Takeover likelihood: the probability that a �rm in the merged IRRC-Compustat sample
receives a takeover bid. [SDC Platinum]
�Number of months: number of months that it takes a �rm in the merged IRRC-Compustat
sample to become target of a takeover bid within �ve years after a dormant period. [SDC
40
Platinum]
�Target CAR: the cumulative abnormal return to the stock of the target of a takeover bid for
trading days (-2, +2) relative to the date of the bid [SDC Platinum and CRSP]. Abnormal
returns are calculated using the CAPM benchmark based on the market model obtained
using CRSP daily returns for the (-241,-41) window.
�Bidder CAR: the cumulative abnormal return to the stock of the bidder for trading days
(-2, +2) relative to the date of the bid [SDC Platinum and CRSP]. Abnormal returns are
calculated using the CAPM benchmark based on the market model obtained using CRSP
daily returns for the (-241,-41) window.
� Firm and industry controls:
� Industry size is de�ned as mean of Assets among all �rms in the same three-digit SIC group
for each year, where Assets is de�ned as log of the book value of assets (item 6), de�ated
by CPI in 1990. [Compustat]
� Industry market-to-book is de�ned as mean of Market-to-book among all �rms in the same
three-digit SIC group for each year, where Market-to-book is de�ned as the market value of
assets divided by the book value of assets (item 6). Market value of assets equals the book
value of assets plus the market value of common equity less the sum of the book value of
common equity (item 60) and balance sheet deferred taxes (item 74). [Compustat]
� Industry sales growth is de�ned as mean of Sales growth among all �rms in the same three-
digit SIC group for each year, where Sales Growth is de�ned as change in sales (item 12)
from year t� 1 to t, scaled by sales in year t� 1. [Compustat]
� Industry concentration is the four-�rm concentration ratio de�ned as the ratio of the sales
of four �rms with largest market share to total industry sales. [Census Bureau]
�High-tech industries are de�ned following Loughran and Ritter (2004) as those in SIC codes
� Stock o¤er: a dummy variable that takes the value of 1 if the method of payment includes
bidder equity, 0 otherwise. [SDC]
�Tender o¤er: a dummy variable that takes the value of 1 if the bid is in the form of a tender
o¤er. [SDC]
�Completed deal: a dummy variable that takes the value of 1 if the target was successfully
taken over without more than a one year interval between bids. [SDC]
42
Appendix C. Tables and Figures
Table 1: Summary Statistics
The sample is a panel of 1,485 �rms from IRRC in the 1990 to 2006 period on and o¤ industry synergy wave years.Industry-years are considered to undergo a synergy wave if the number of deals with positive bidder and target combinedwealth e¤ect (CAR (-5,+2)) in that year is one standard deviation above the industry time-series median. Industries arede�ned according to Fama and French (1997). In addition, we require that the synergy wave is subsequent to a surprisebid in at least half of subsectors within the industry, with surprise bid de�ned as the �rst takeover bid after a period ofat least 5 months with no acquisition activity in the subsector. Variable de�nitions are provided in Appendix B. Levelsof signi�cance are indicated by *, **, and *** for 10%, 5%, and 1%, respectively.
Panel A: Summary statistics
Variable Mean Median Std Dev
Classi�ed board 0.59 1 0.48Net GIM 7.94 8 2.34
Wave CharacteristicsSynergy wave 0.25 0 0.41Share of subsectors with a surprise bid 0.38 0.38 0.26
Figure 1: Takeover Likelihood over Industry Merger Waves
This �gure shows how implied takeover likelihood changes over the duration of an industry synergy wave from twoyears before to �ve years after the onset of the wave. Red bars correspond to implied takeover likelihoods for �rmswithout classi�ed board provision. Blue bars correspond to implied takeover likelihoods for �rms with classi�ed boardprovision. The probabilities are calculated from the regression coe¢ cients in Column 2 of Table 2, with all control variablesevaluated at their means. Year 0 on the horizontal axis corresponds to the onset of an industry synergy wave de�nedas an industry-year in which the number of deals with positive bidder and target combined wealth e¤ect (CAR (-5,+2))is one standard deviation above the industry time-series median. Industries are de�ned according to Fama and French(1997). In addition, we require that the synergy wave is subsequent to a surprise bid in at least half of subsectors withinthe industry, with surprise bid de�ned as the �rst takeover bid after a period of at least 5 months with no acquisitionactivity in the subsector. See Table 2 for details of the estimation.